Article

Centennial Fertilization-Induced Soil Processes Control Trace Metal Dynamics. Lessons from a Long-Term Bare Fallow Experiment

1
INRA-AgroParisTech, UMR 1402 EcoSys, Soil Ecotoxicology, RD10, F-78026 Versailles CEDEX, France
2
Facultade de Farmacia, Departamento de Edafoloxía e Química Agrícola, Universidade de Santiago de Compostela, E-15782 Santiago de Compostela, Spain
3
INRA, US 0010 Laboratoire d’Analyse des Sols, 273 Route de Cambrai, F-62000 Arras, France
4
INRA, UR 0272 Science du Sol, F-45075 Orléans CEDEX 2, France
5
Université de Bourgogne—Franche Comté, UMR 6298, ArTéHis, CNRS-Culture, 6 bd Gabriel, Bât. Gabriel, F-21000 Dijon, France
*
Author to whom correspondence should be addressed.
Soil Syst. 2018, 2(2), 23; https://doi.org/10.3390/soilsystems2020023
Submission received: 15 March 2018 / Revised: 11 April 2018 / Accepted: 17 April 2018 / Published: 19 April 2018
(This article belongs to the Special Issue Soil Processes Controlling Contaminant Dynamics)

Abstract

:
Long-term bare fallow (LTBF) experiments with historical sample archives offer unique opportunities to study long-term impacts of anthropogenic activities on mineral soil fractions. In natural agro- and ecosystems, such impacts are often masked by organic matter due to its buffering action and rapid turnover. The 42-plot LTBF trial of INRA (Institut National de la Recherche Agronomique) started in Versailles (France) in 1928 to assess the impacts of prolonged application of fertilizers and amendments on the composition and properties of loamy soils. Here, we established geochemical budgets of major and trace elements on surface samples from 1929 and 2014 for four groups of treatments relevant for developed soil processes. We considered accompanying effects of soil compaction or decompaction due to changing physicochemical conditions over 85 years. Element losses from the surface horizon were quantified via fertilization-induced or -amplified soil processes: clay leaching favored by Na- or K-based fertilization, and lixiviation of major and trace elements in acidic or alkaline soil conditions. Enhanced mineral weathering was shown for acidified and nonamended plots. Conclusions on trace metal migration were confirmed by selected analyses on subsurface horizons. Additional information was provided on specific element inputs via fertilizers and/or diffuse inputs via atmospheric deposition.

1. Introduction

Soil degradation or, better, degradation of soil properties may result from both anthropogenic activities and natural processes, i.e., land misuse, soil mismanagement, or climatic change and related factors [1]. Soil acidification was an up-to-date topic in the 1970s to 1990s with a view to acid rain and related risks for increased leaching of soil nutrients. Currently, soil organic carbon (SOC) pools occupy a central place in problematic global change, with respect to reduced biodiversity, decreased aggregate stability and soil compaction, and nutrient loss [1,2]. Such items are widely documented. The SOC pool was reported as the defining constituent of soil [3] and reputed to be the most reliable indicator for monitoring soil degradation [4], particularly by soil erosion. This reputation is due, in large part, to short-term response on climatic or anthropogenic constraints and rapid turnover dynamics in soils [5,6]. However, in most ecosystems, the decomposition of organic matter is compensated by restitution of plant debris or organic fertilization and amendments in agricultural soils. Therefore, soil organic matter (SOM) is not necessarily the most suitable indicator of long-term constraints affecting soils, or in any case not the sole indicator. Changing land use and management or agricultural practices may also affect the soil’s mineral fraction, in particular the finest reactive phases. Phyllosilicate clay minerals register such impacts by changes in their composition (substitution), behavior (hydration), surface properties (electric charge), or clay-particle thickness [7,8,9]. The chemical and mineralogical evolution of clay minerals is generally less rapid than that of SOC pools. Impacts of long-term anthropogenic activities on mineral fractions are less well documented, because study in real field conditions is often hampered by soil heterogeneity, changing land use, management practices, or duration of field monitoring.
Long-term agronomic experiments are particularly valuable for studying time impacts of agricultural management on soils and cultivars, under more or less known and/or controlled conditions. Among them, long-term bare fallow (LTBF) experiments, in the absence of vegetation and organic matter restitution, offer unique opportunities to unravel the complex impacts of anthropogenic activities on mineral soil fractions. In 1928, such a long-term agronomic experiment, simply designated as the “42-plots trial,” was created at the research center of INRA (Institut National de la Recherche Agronomique) in Versailles, located in the gardens of the Chateau de Versailles. The main initial objective was to “examine the impacts of prolonged applications of main N, P and K fertilizers, as well as organic and basic amendments on the composition and properties of loam soils” [10]. The experiment was conducted on bare soils, in the absence of vegetation. Fertilizer doses were about twice those applied in the 1930s [10]. Such conditions are more extreme than those observed in real field situations, but were intentionally selected to exacerbate the impacts of the different treatments on mineral soil fractions. The restricted surface of the experiment in a fairly flat geographical position ensured the similarity of soils and soil properties at the start of the experiment. Moreover, the historical soil archive of annually collected surface samples makes it possible to study time effects, such as SOM dynamics [11] or atmospheric deposition of metal pollutants [12,13]. Organic C and N dynamics in the 42 plots have been extensively discussed elsewhere [11,14,15].
Recently, soil damage effects of chemical fertilization of intensively cultivated soils in modern industrialized agriculture in the quest for ever-increasing productivity were questioned in an article titled “Why It’s Time to Stop Punishing Our Soils with Fertilizers” [16]. Such questioning implies disposing of good indicators for time effects of fertilization practices on soils. Study of long-term bare fallow trials provides valuable insight into fertilizer-induced impacts on soils. The aim of the present work was to interpret, from a pedological point of view, recently obtained analytical data on soils of the LTBF 42-plots trial of INRA Versailles. We established geochemical budgets for major and trace elements covering a time span of 85 years and assessed the impacts of fertilization treatments on the composition and properties of loess Luvisols. For that, we selected surface soil samples collected in 1929 and 2014 in plots under monovalent (Na, K), ammonium-based, dried blood, or basic amendment treatments, and in nonamended plots, thus offering a wide panel of physicochemical soil conditions. Geochemical budgets were examined in terms of inputs by fertilizers, amendments, and atmospheric deposition, or losses via fertilization-induced soil processes. Selected exploratory data on soil characteristics in subsurface horizon are briefly discussed to support the major findings of our work with respect to migration pathways of major and trace elements toward soil depth.

2. Materials and Methods

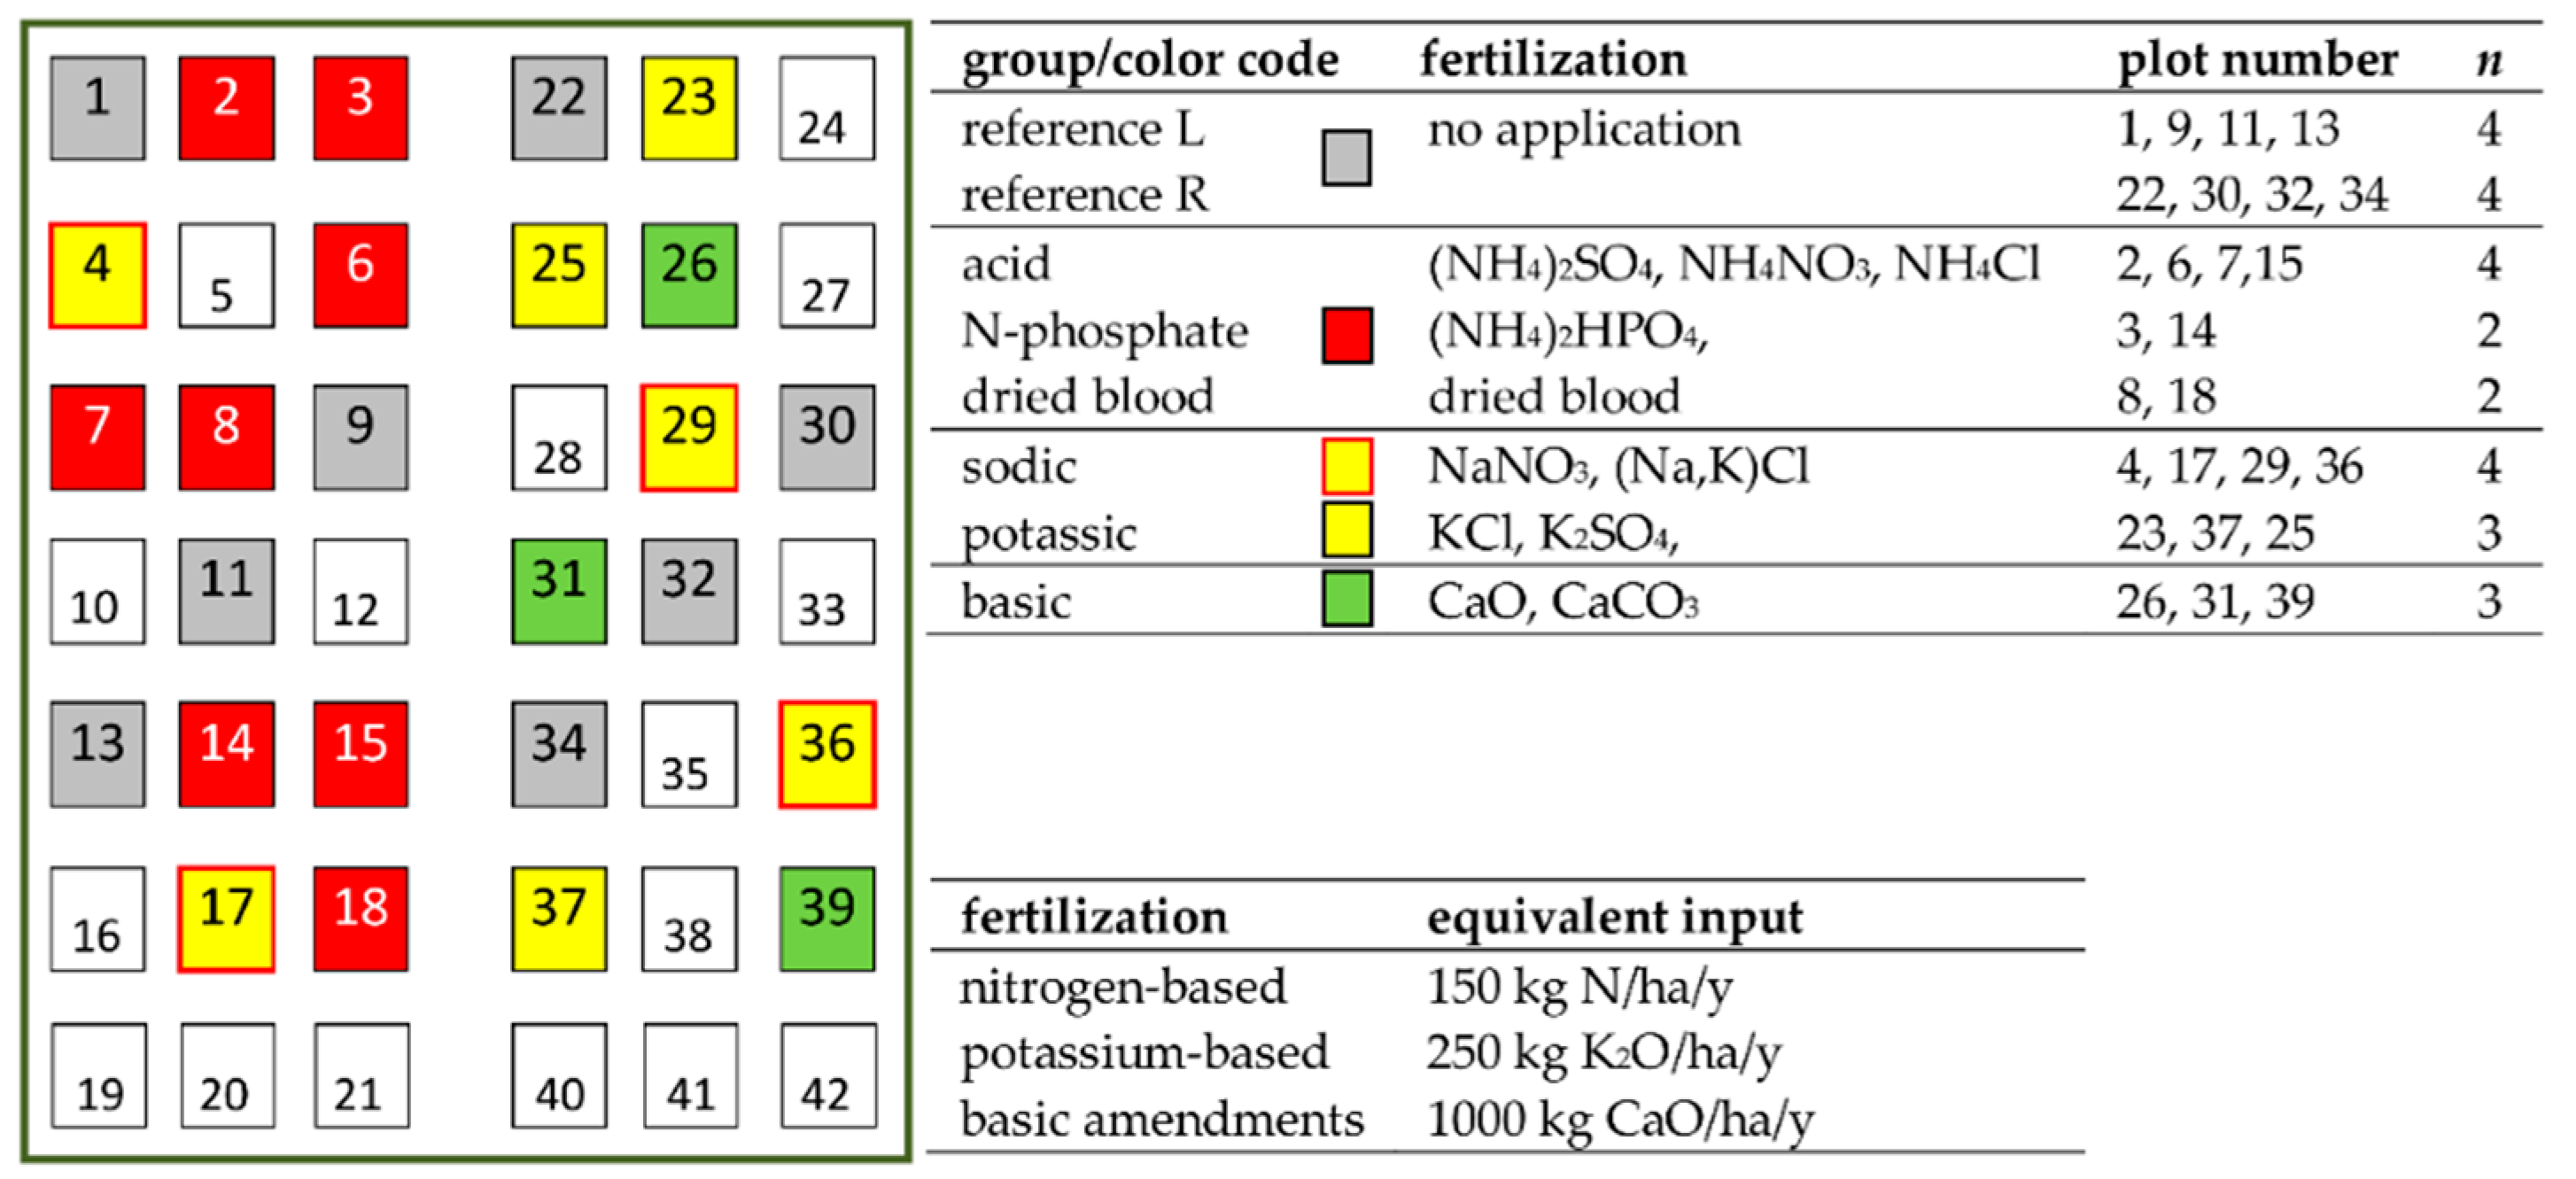
2.1. Long-Term Bare Fallow Experiment of INRA Versailles

The experiment was conducted on silt-loam textured Haplic Luvisols [17] developed in loess, representative of large areas used for conventional cereal production in northern France and northwestern Europe. The experiment was and still is managed according to a strict plan, unchanged since 1928: plots are 2 m × 2.5 m wide; annual inputs of N-fertilizers are in the spring, whereas K and P fertilizers, as well as organic and basic amendments, are added in autumn; the upper 25 cm soil of all plots is dug by spade twice a year, following fertilization; 16 fertilization treatments are tested in duplicate and 10 plots remain without applications as a reference. Weeds are removed manually and occasionally by herbicide treatment. The first applications were performed on 12 November 1928. Samples of the upper 25 cm surface layer have been collected throughout the experiment, generating today a 90-year-old unique bare-soil sample archive.
Initial soil data used in our work were taken from [10]: pH 6.3, and bulk density estimated at 1300 kg/m3 based on soil porosity data. Initial chemical data were determined on the first reference-plot samples collected in March 1929: clay content: 189 g/kg and concentrations of major and trace elements [18,19]. The fertilizers used were commercial products. The fertilizer stocks were renewed partly in 1954 and completely in 1991. The applied doses of the target elements N, P, K, and Ca were adapted according their concentration in the fertilizers, but little or no information on the contents of trace elements was available.
The experimental design of the 42 plots is presented in Figure 1. For the present study, 26 plots were selected and divided into 4 groups with comparable analytical characteristics: (1) ammonium-based fertilizers (sulfate, phosphate, chloride, nitrate) and dried blood; results indicated by red bars (or spots) and black borders; (2) monovalent Na- and/or K-based fertilizers added as sulfate, chloride, or nitrate; for the sodic treatments, the results are indicated by yellow bars with red borders; (3) reference plots, 4 from the left-hand nitrogen block (reference L) and 4 from the right-hand K, P, and basic amendments block (reference R); results indicated by gray bars with black borders; and (4) basic amendments, indicated by green bars with black borders. The samples from plots along a small road in sight of the INRA’s research center (19–21,40–42) were excluded from our study due to suspected localized dust contamination [19].
In addition to global sampling in the surface horizon, bulk and undisturbed samples were also collected in the underlying E, B and C horizons of a dozen plots, using a root auger device (diameter 8 cm, height 15 cm), until the carbonated parent material was reached, between 90 and >120 cm. The core samples were separated according soil horizon limits. Selected undisturbed parts were resin-impregnated before thin-section preparation; the rest were ground to 2 mm and stored for chemical analysis. Relevant chemical and microscopic data are presented, providing a first short overview of the impacts of 85 years of experimentation on soil characteristics in subsurface horizons, which supports our interpretation of geochemical budgets established in the 0–25 cm surface horizons.

2.2. Analysis of Soil Characteristics and Total Element Concentrations

On representatively quartered soil samples from the selected plots, the following analyses were performed according to international standard conditions [20]: grain size distribution (NF X 31-107), pH in water (ISO 10390), organic carbon and nitrogen (ISO 10694, ISO 13878), and cation exchange capacity (CEC) and exchangeable cations by the cobalt hexammine method (ISO 23470). For analysis of total element concentrations, subsamples were ground to 250 µm before complete dissolution by hydrofluoric and perchloric acid (ISO NF X31-147). Major agronomic elements (K, P, Ca, Mg, and Na), pedological key indicator elements (Al, Fe, and Mn), and 12 trace elements—micro-oligo-elements (Cu, Zn, Co, Cr, Ni, Mo, and As) and nonessential elements (Cd, Pb, U, Tl, and Sc)—were determined by either Inductively Coupled Plasma Atomic Emission Spectrometry (ICP-AES) or Mass Spectrometry (ICP-MS) (NF ISO 22036 and NF ISO 17294-2, respectively). Total element concentrations were analyzed simultaneously on samples from 1929 and 2014. The studied elements were chosen based on a preliminary analytical screening of 25 elements in soils of the 42 plots. Our final selection coincides to a large extent with the panel of major and trace elements considered in a large French national research program on trace metal contents in agricultural soils [21].

2.3. Computation of Element Stocks and Budgets

Following decomposing organic matter and diverging physicochemical ambience induced by fertilization, the physical properties of soils in the surface horizon were significantly modified, notably with regard to soil structure, aggregate stability, and bulk density [2,22,23]. Among the plots selected for our work, the bulk densities in 2014 varied from about 1200 to 1600 kg/m3, i.e., ≈30% variation with respect to the estimated 1300 kg/m3 at the start of the experiment. Consequently, the weight of 1 m2 of the 25 cm thick Ap horizon ranged from ≈300 to 400 kg. In view of such differences, the use of element concentrations expressed as mass per kg of soil does not appropriately account for their amounts in the surface horizon. Therefore, we calculated stocks of elements in the 0–25 cm Ap horizons, expressed as mass per m2. The use of element stocks was reported as an ecologically relevant unit for soil quality studies [24,25], preventing biased comparisons of element amounts in soils with variable bulk density, organic matter content, or horizon thickness [26]. Stocks of elements in a soil horizon were calculated by multiplying the element concentration, the bulk density, and the horizon thickness. Thus, in 1929 the initial stock of elements (S1929) in the Ap horizon was:
S1929 = [M]1929 × ρ1929 × tAp
where [M]1929 = element concentration (mass/kg), determined on March 1929 reference-plot samples; ρ1929 = bulk density (kg/m3) of the Ap horizon in 1929; and tAp = thickness of Ap, set to 0.25 m.
For 2014, the computation of element stock was more complex. First, due to the combining effects of soil compaction and successive soil collection, and a constant 25 cm depth of annual digging and sampling, the upper centimeters of the underlying E horizon was progressively incorporated into the surface Ap horizon (Figure 2). Second, a small but nonnegligible part of the surface horizon elements is currently stored in the soil archive collection. Therefore, in 2014 the element stock (S2014) in the Ap horizon included 3 terms:
S2014 = S’2014 − SE + Sarch
S’2014: overall element stock (kg/m3) in the 25 cm surface layer = [M]2014 × ρ2014 × 0.25
where [M]2014 = element concentration (mass/kg) and ρ2014 = bulk density; and
SE: element stock from the E horizon incorporated into the Ap horizon = [M]E1929 × ρE × (tE1 + tE2)/100
where [M] = element concentration (mass/kg) in the upper few cm of the E horizon in 1929, set to the initial surface horizon concentration; ρE = bulk density (kg/m3) of the E horizon, set to 1580 kg/m3 according to several local soil survey studies [27,28]; and tE = thickness (cm) of the E horizon incorporated into the surface Ap horizon, with:
tE1: thickness linked to densification in the Ap horizon = [(ρ2014ρ1929) × 0.25]/ρE/100
tE2: thickness linked to soil sampling, estimated at 75 kg for 5 m2 = (75/5)/ρE/100
The estimation of 75 kg of soil collected for each plot is based on the actual amounts stored in the historical sample archive, and probably slightly underestimates the amount of soil used with time for laboratory analyses. Therefore, tE2 was set to 1 cm.
Sarch: element stock of the Ap in the historical sample collection = (75/5) × ([M]2014 + [M]1929)/2
The final geochemical budget for each element is calculated as:
B2014−1929 = S2014 − S1929
NB: For treatments with decreasing bulk density during the experiment (dried blood, lime), the soil surface rose, producing a new layer between the Ap and E horizons, Ap/E. This effect was particularly visible for the manure treatment (Figure 2), where the surface Ap bulk density decreased to 960 kg/m3 [2,19]. The corresponding element stock SA/E was calculated using average values for element concentrations and bulk densities between 1929 and 2014:
SA/E: = ([M]1929 + [M]2014)/2 × (ρ2014 + ρ1929)/2 × (tA/E1 + tA/E2)/100
where tA/E1 = [(ρ2014ρ1929) × 0.25]/[(ρ2014 + ρ1929)/2]/100 and tA/E2 is set to 1 cm. NB: tAE1 and tAE2 have opposite signs, thus expressing a soil rising or deepening effect, respectively.

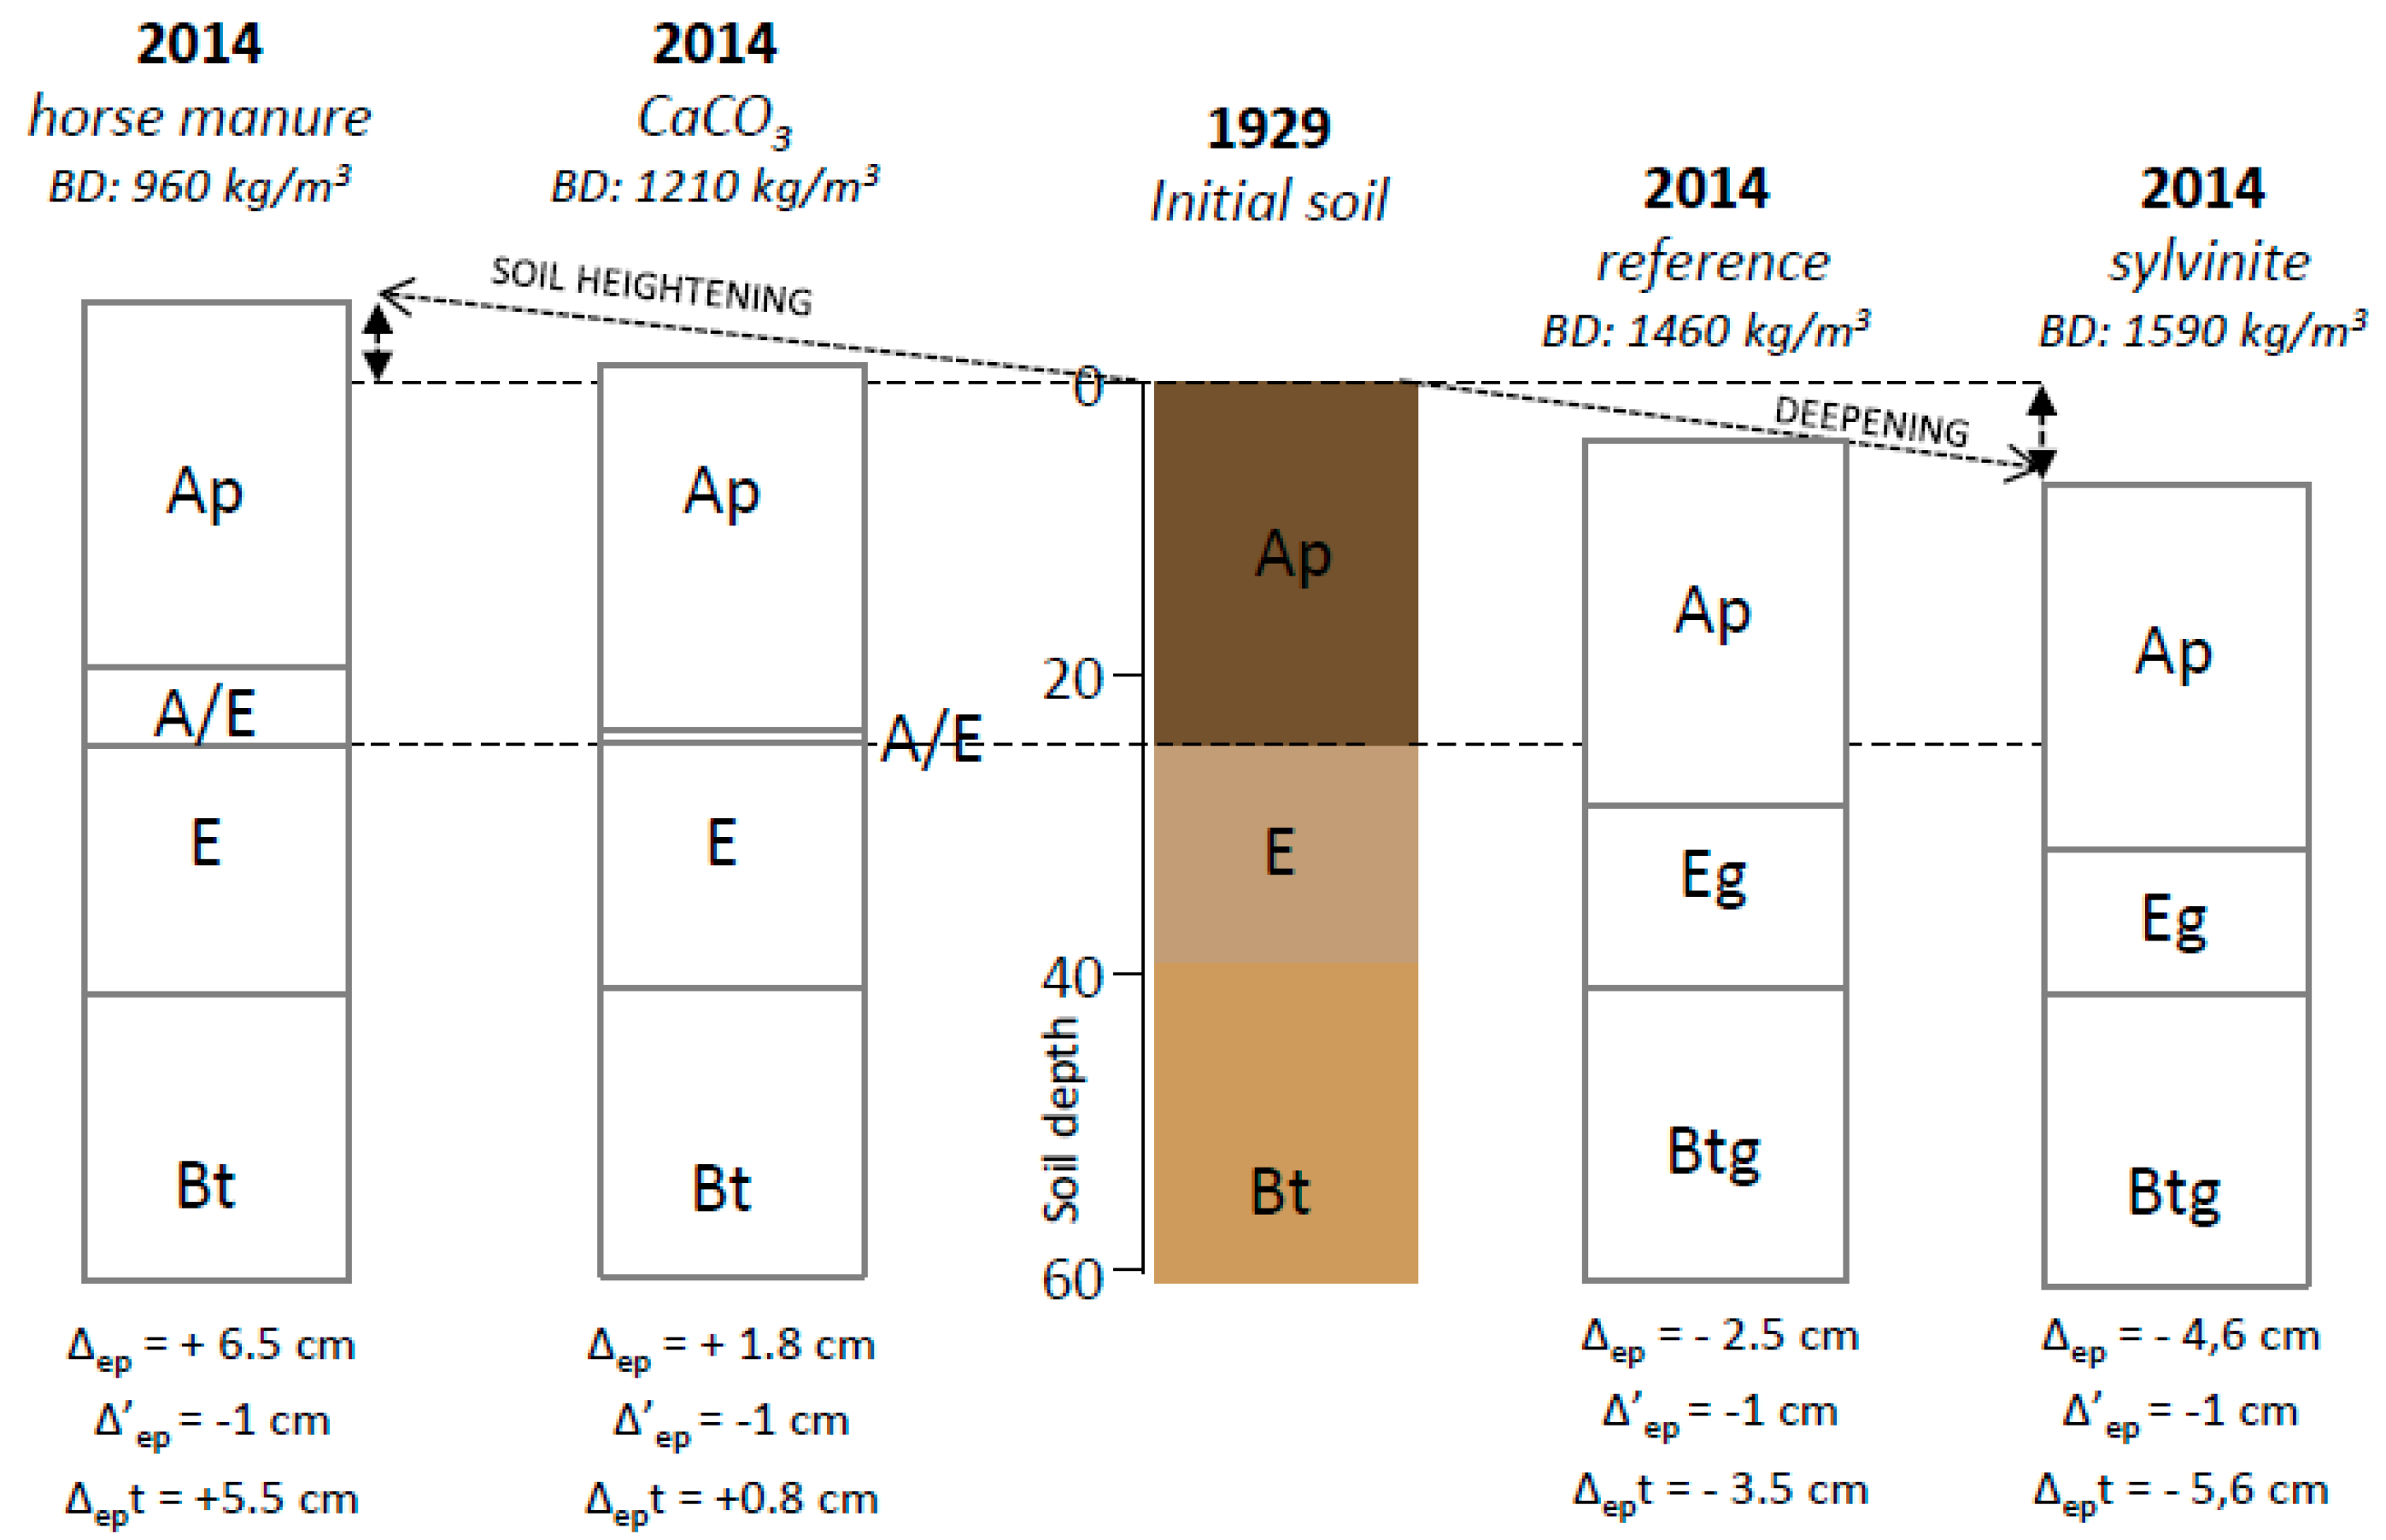
2.4. Validity of Calculations

The validity of our computation approach was checked by comparing budgets of one soil component, a key indicator of dominant soil processes (<2 µm clay fraction), and one trace element (scandium, Sc), assuming their concomitant migration in loess Luvisols. This hypothesis was based first on the geochemistry literature from the 1960s and 1970s: (i) in ferromagnesian minerals, Sc3+ can substitute for Fe3+ and Al3+ [29]; (ii) in sedimentary soils, scandium is primarily located in easily weatherable minerals, such as hornblende, biotite, and chlorite [30]; and (iii) in Luvisols of North America, Sc translocation was shown to be closely related to clay and iron via pedogenesis processes [29]. Second, Sc is disseminated a little or not at all by anthropogenic activity in the environment [31] and has very low mobility in soils under oxidizing and acidic environmental conditions [32]. Third, our previous work [19] revealed remarkably high correlation between Sc and clay for the entire soil set of the 42-plots experiment (Figure 3a, excluding manure plots), supporting the literature findings. The Sc content in clay fractions, analyzed on samples from plots with highly contrasting physicochemical conditions, showed an average of 18.4 ± 0.37 mg/kg. Such low variability of the Sc content of clay makes it useful as an indicator of clay loss/accumulation.
The stocks of <2 µm clay fractions and scandium were established following Equations (1) and (2) for the selected groups of fertilization treatments (cf. Figure 1) and their geochemical budgets were established following Equation (3). Comparing the correlation of concentrations and budgets of scandium and clay (Figure 3a,b) reveals an appreciable increase of R2 from 0.83 to 0.92. In both graphs, the slopes of linear regression were very close to measured clay Sc contents (18.4 mg/kg), 17.6 and 17.3, respectively. For plots displaying clearly lower clay content in 2014, i.e., ≥20% since 1929, the budget ratio Bclay/BSc ranged from 16.2 to 15.6, diverging by 12.5–15.2% with respect to the measured 18.4 mg/kg Sc content in the clay fraction. In view of the estimations made for unknown parameters at the start of and during the experiment, this difference was found to be satisfactory for validating our computation approach.

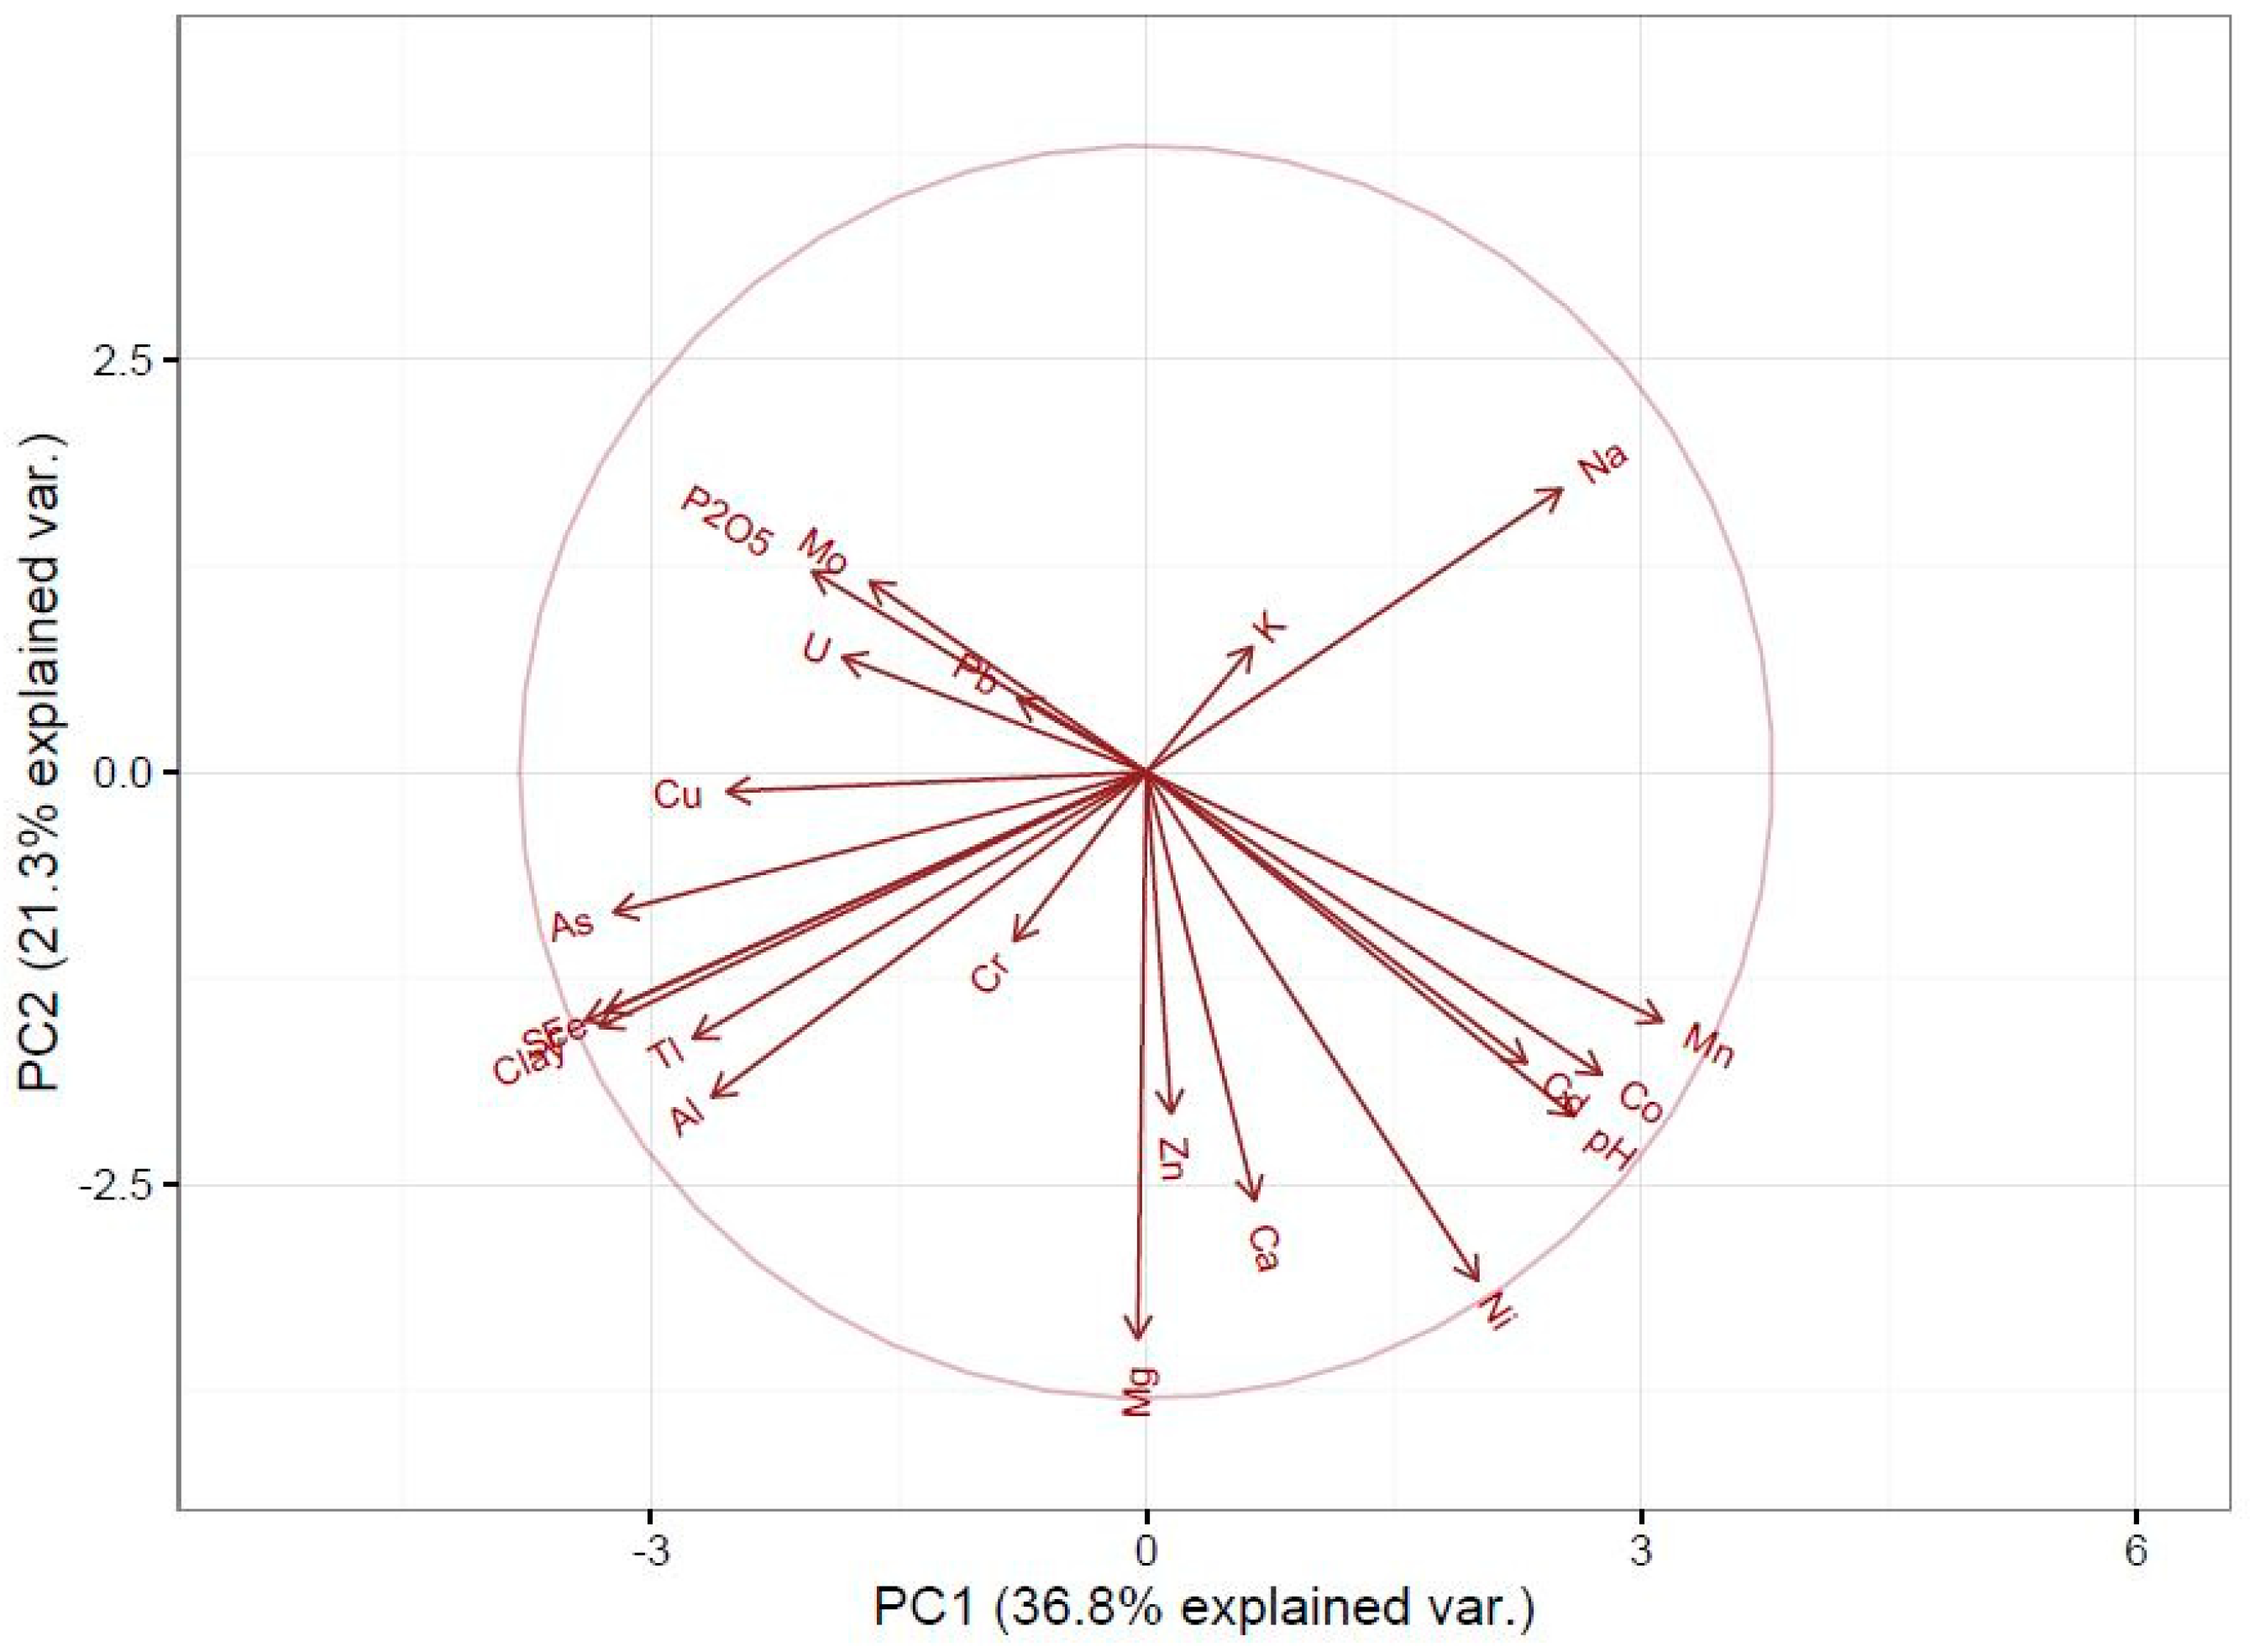
2.5. Data Presentation and Statistical Treatment

Due to the initial setup of the experiment, including 2 replicates per treatment, no statistics could be operated on data from fertilized plots; therefore max and min bars are presented on histograms to indicate intragroup variability. For the 8 reference plots, the significance of differences in geochemical budgets in the soil surface horizon between 1929 and 2014 was statistically examined using the paired Wilcoxon test. A principal component analysis (PCA) projection of the 2014–1929 element and clay budgets and the 2014 soil pH was made to help assess the impacts of soil processes on element dynamics.

3. Results

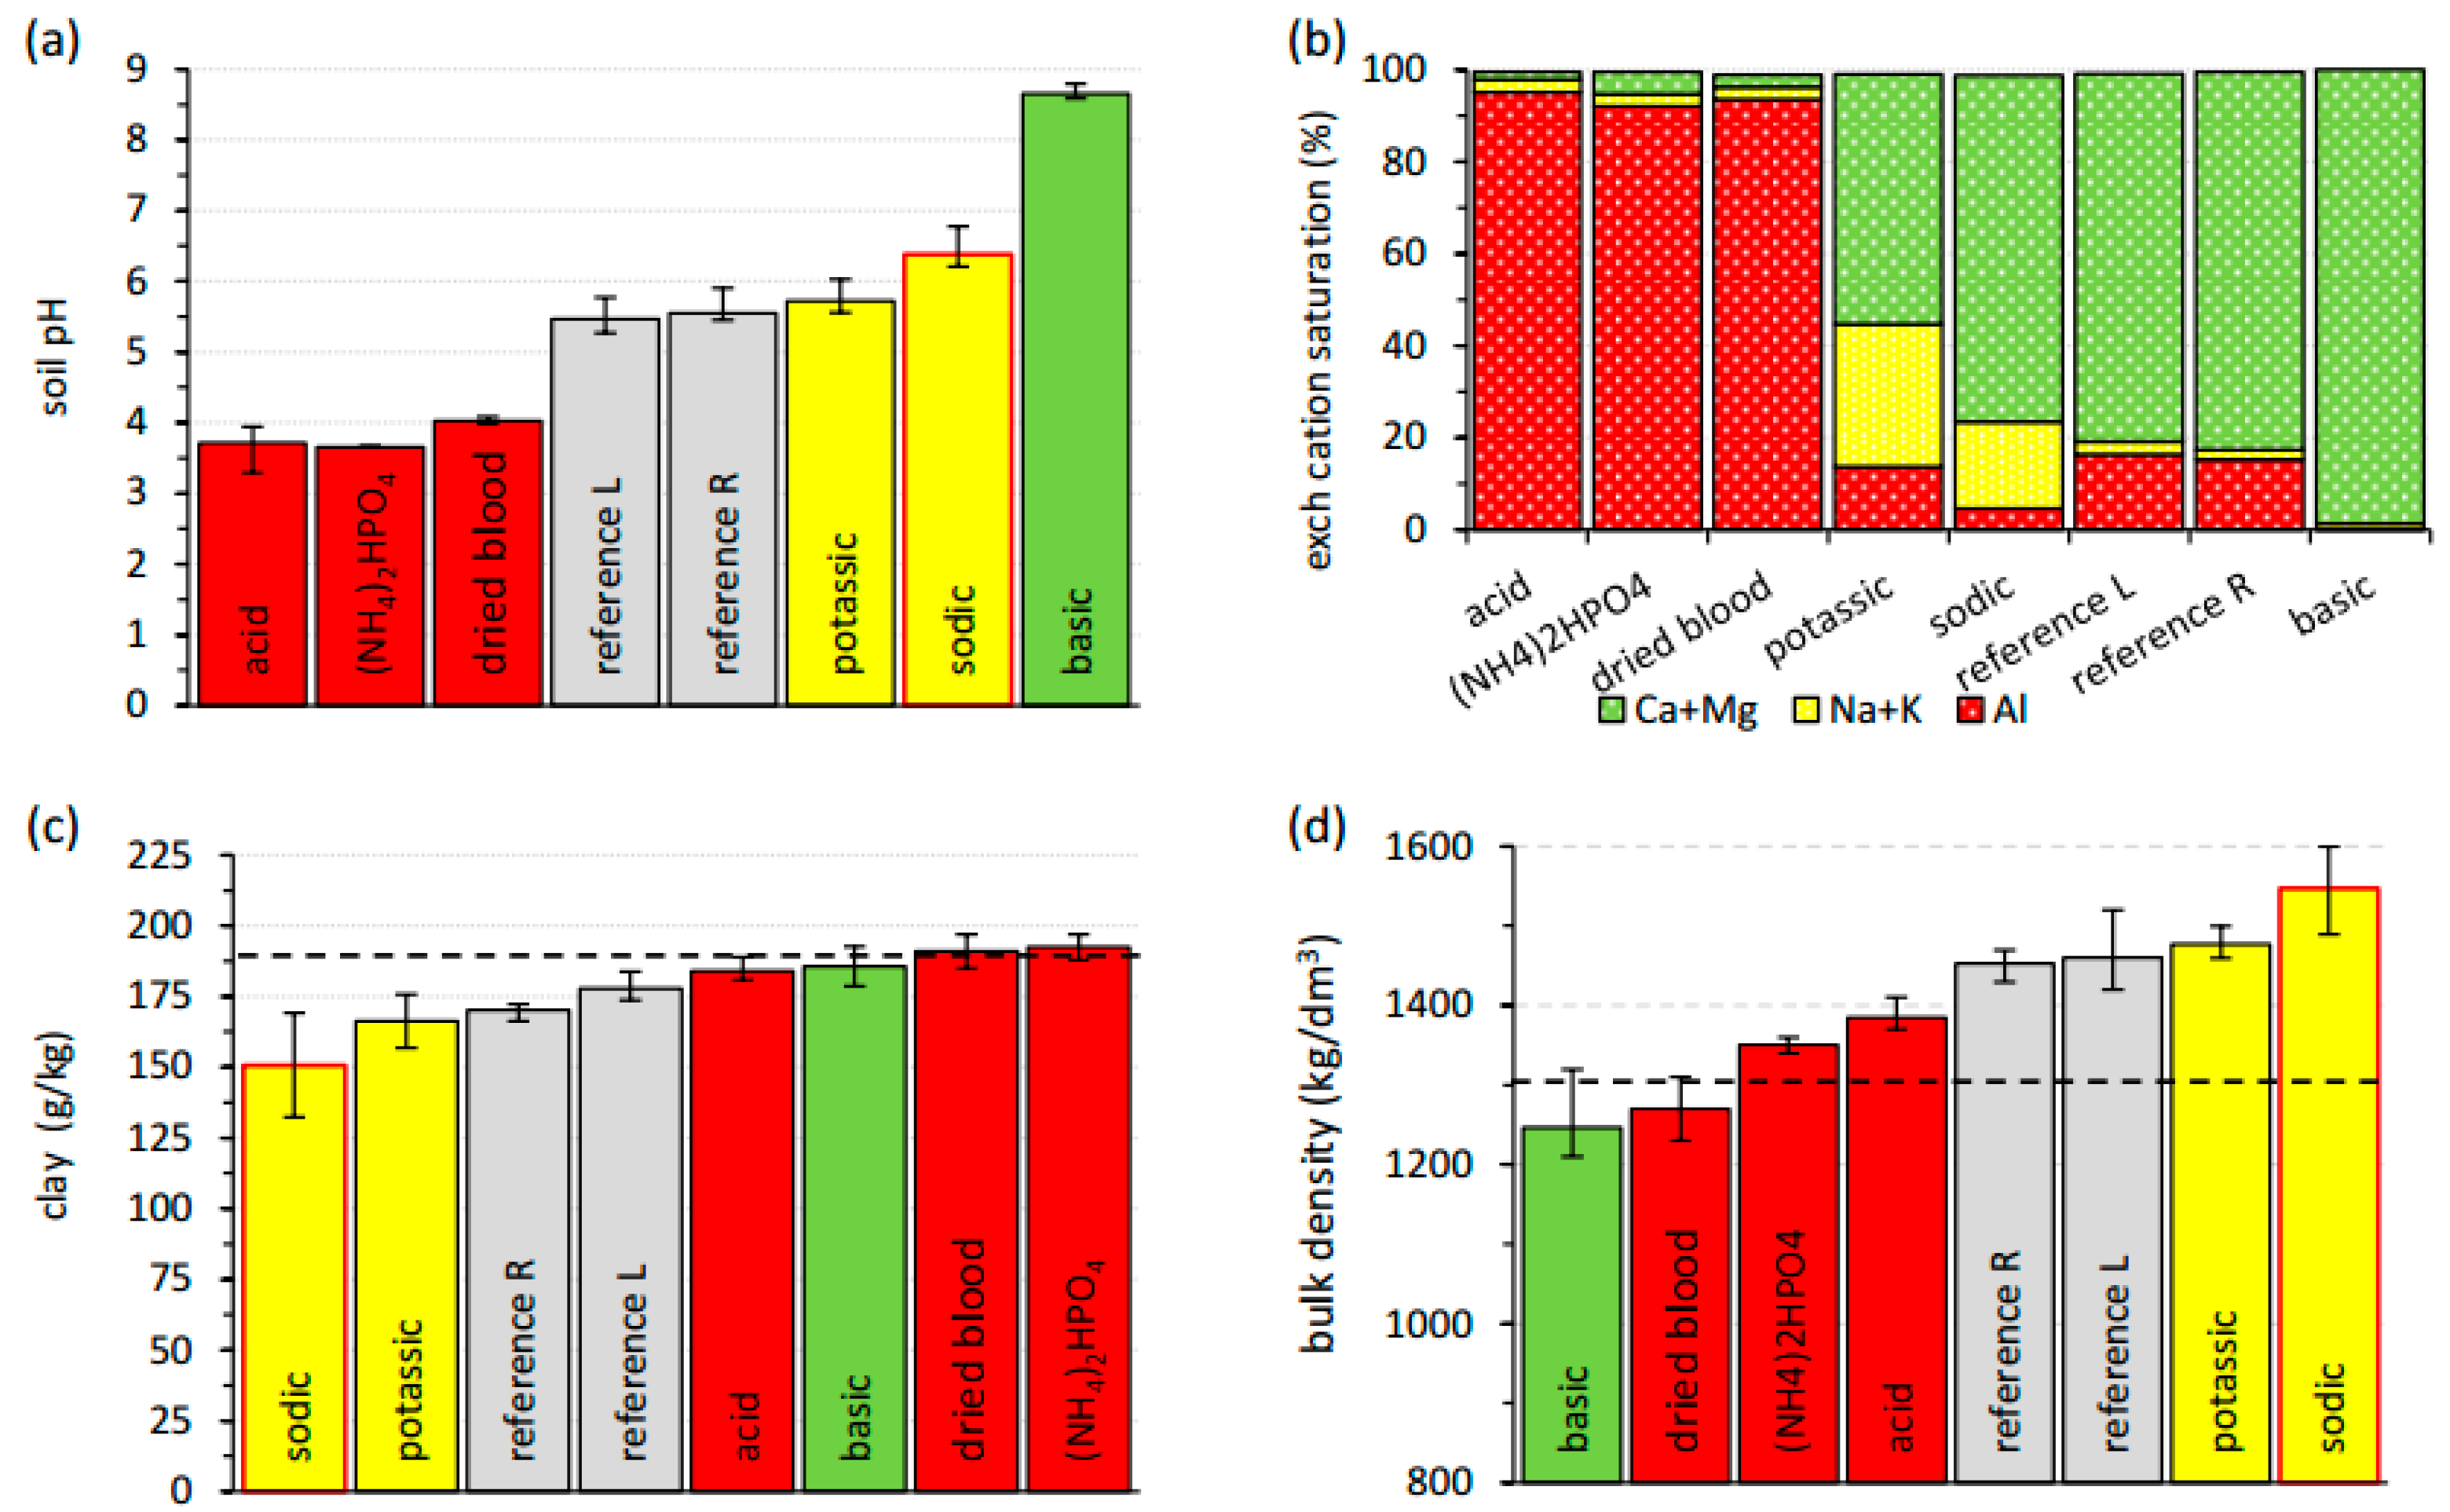
3.1. Present Physicochemical Soil Characteristics

Notable modifications of chemical and physical soil properties in the surface horizons were reported early, as soon as 10 years after the start of experimentation [10], and progressively amplified over the years. The most striking effects of fertilizers are presented in Figure 4. The range of pH values in 2014 was outstandingly wide, more than 5 units from 8.8 in CaCO3 amended plots to 3.5 in the ammonium sulfate plot (Figure 4a). The pH decrease was higher for K-based than for Na-based fertilizers. Although variation of pH was remarkably fast during the first decades (4 units in 1939, [10]), the magnitude of ΔpH is still increasing: 4.6 units in 1999 [33] and 5.3 units in 2014 [18].
Concomitantly, the composition of the exchange complex markedly changed: the proportion of bivalent cations decreased from >98% in 1928 to ≈80% in the reference plots, to 75 and 55% in the sodic and potassic plots, respectively, and to <5% in strongly acidified plots (Figure 4b). In the latter, exchangeable Al occupied up to 96% of the CEC in 2014, strongly contrasting with soils under basic amendments, where exchangeable Ca + Mg occupied almost 99% of the CEC. In the monovalent plots, the proportion of exchangeable Na + K reached 15–35% in 2014 and was highest under K fertilization. Clay content considerably varied (Figure 4c) from 134 g/kg for the NaNO3 treatment to 197 g/kg for the (NH4)2HPO4 treatment. With respect to 1929, the decrease of clay content was more marked for Na- than for K-fertilized plots and indicates a process of enhanced clay leaching under monovalent dispersive conditions. In the reference plots, an average clay content in 2014 of 174 g/kg also pointed to a loss of clay by leaching toward depth. Such widely diverging physicochemical soil conditions impacted the physical properties of the surface horizon: effects of surface sealing are easily visible at the surface of the plots after major rain events [22], as well as effects of soil compaction due to increasing bulk density with respect to 1928, notably in the reference and monovalent plots, reaching 1590 kg/m3 for sylvinite (Figure 4d). By contrast, bulk density remained unchanged or even decreased under basic amendments and dried blood, and the lowest value reached 1210 kg/m3.

3.2. Geochemical Budgets of Major and Trace Elements between 1929 and 2014

3.2.1. Element Budgets in Nonamended Reference Plots

Geochemical budgets in soils of the reference plots provide information about cumulative gains and losses of elements under local climatic conditions over a period of 85 years. Table 1 and Table 2 present the median values of element stocks in 1929 and 2014 in the eight selected reference plots, as well as p-values calculated at a 95% significance level by paired Wilcoxon test. Significant differences are expressed as both the element mass/m2 and a rough estimation of mass/ha. Among the major elements, significant changes (p <0.01) were observed for Ca, Mg, and Na (Table 1). Losses reached 1.2 kg/m2 for Ca and ≈50g/m2 for Mg, and there was a gain of ≈100 g/m2 for Na.
For the 12 trace elements (Table 2), six of them showed significant gains: Cd, Co, Cr, Mo, Pb, and Zn, ascribed to atmospheric deposition between 1929 and 2014. The gains of Cd and Mo ranged between 10 and 20 mg/m2, but for Co, Cr, Pb, and Zn, the gains were in the order of 0.5–10 g/m2, and their sum totaled about 20 g/m2, representing an average yearly deposition rate of more than 200 mg/m2.

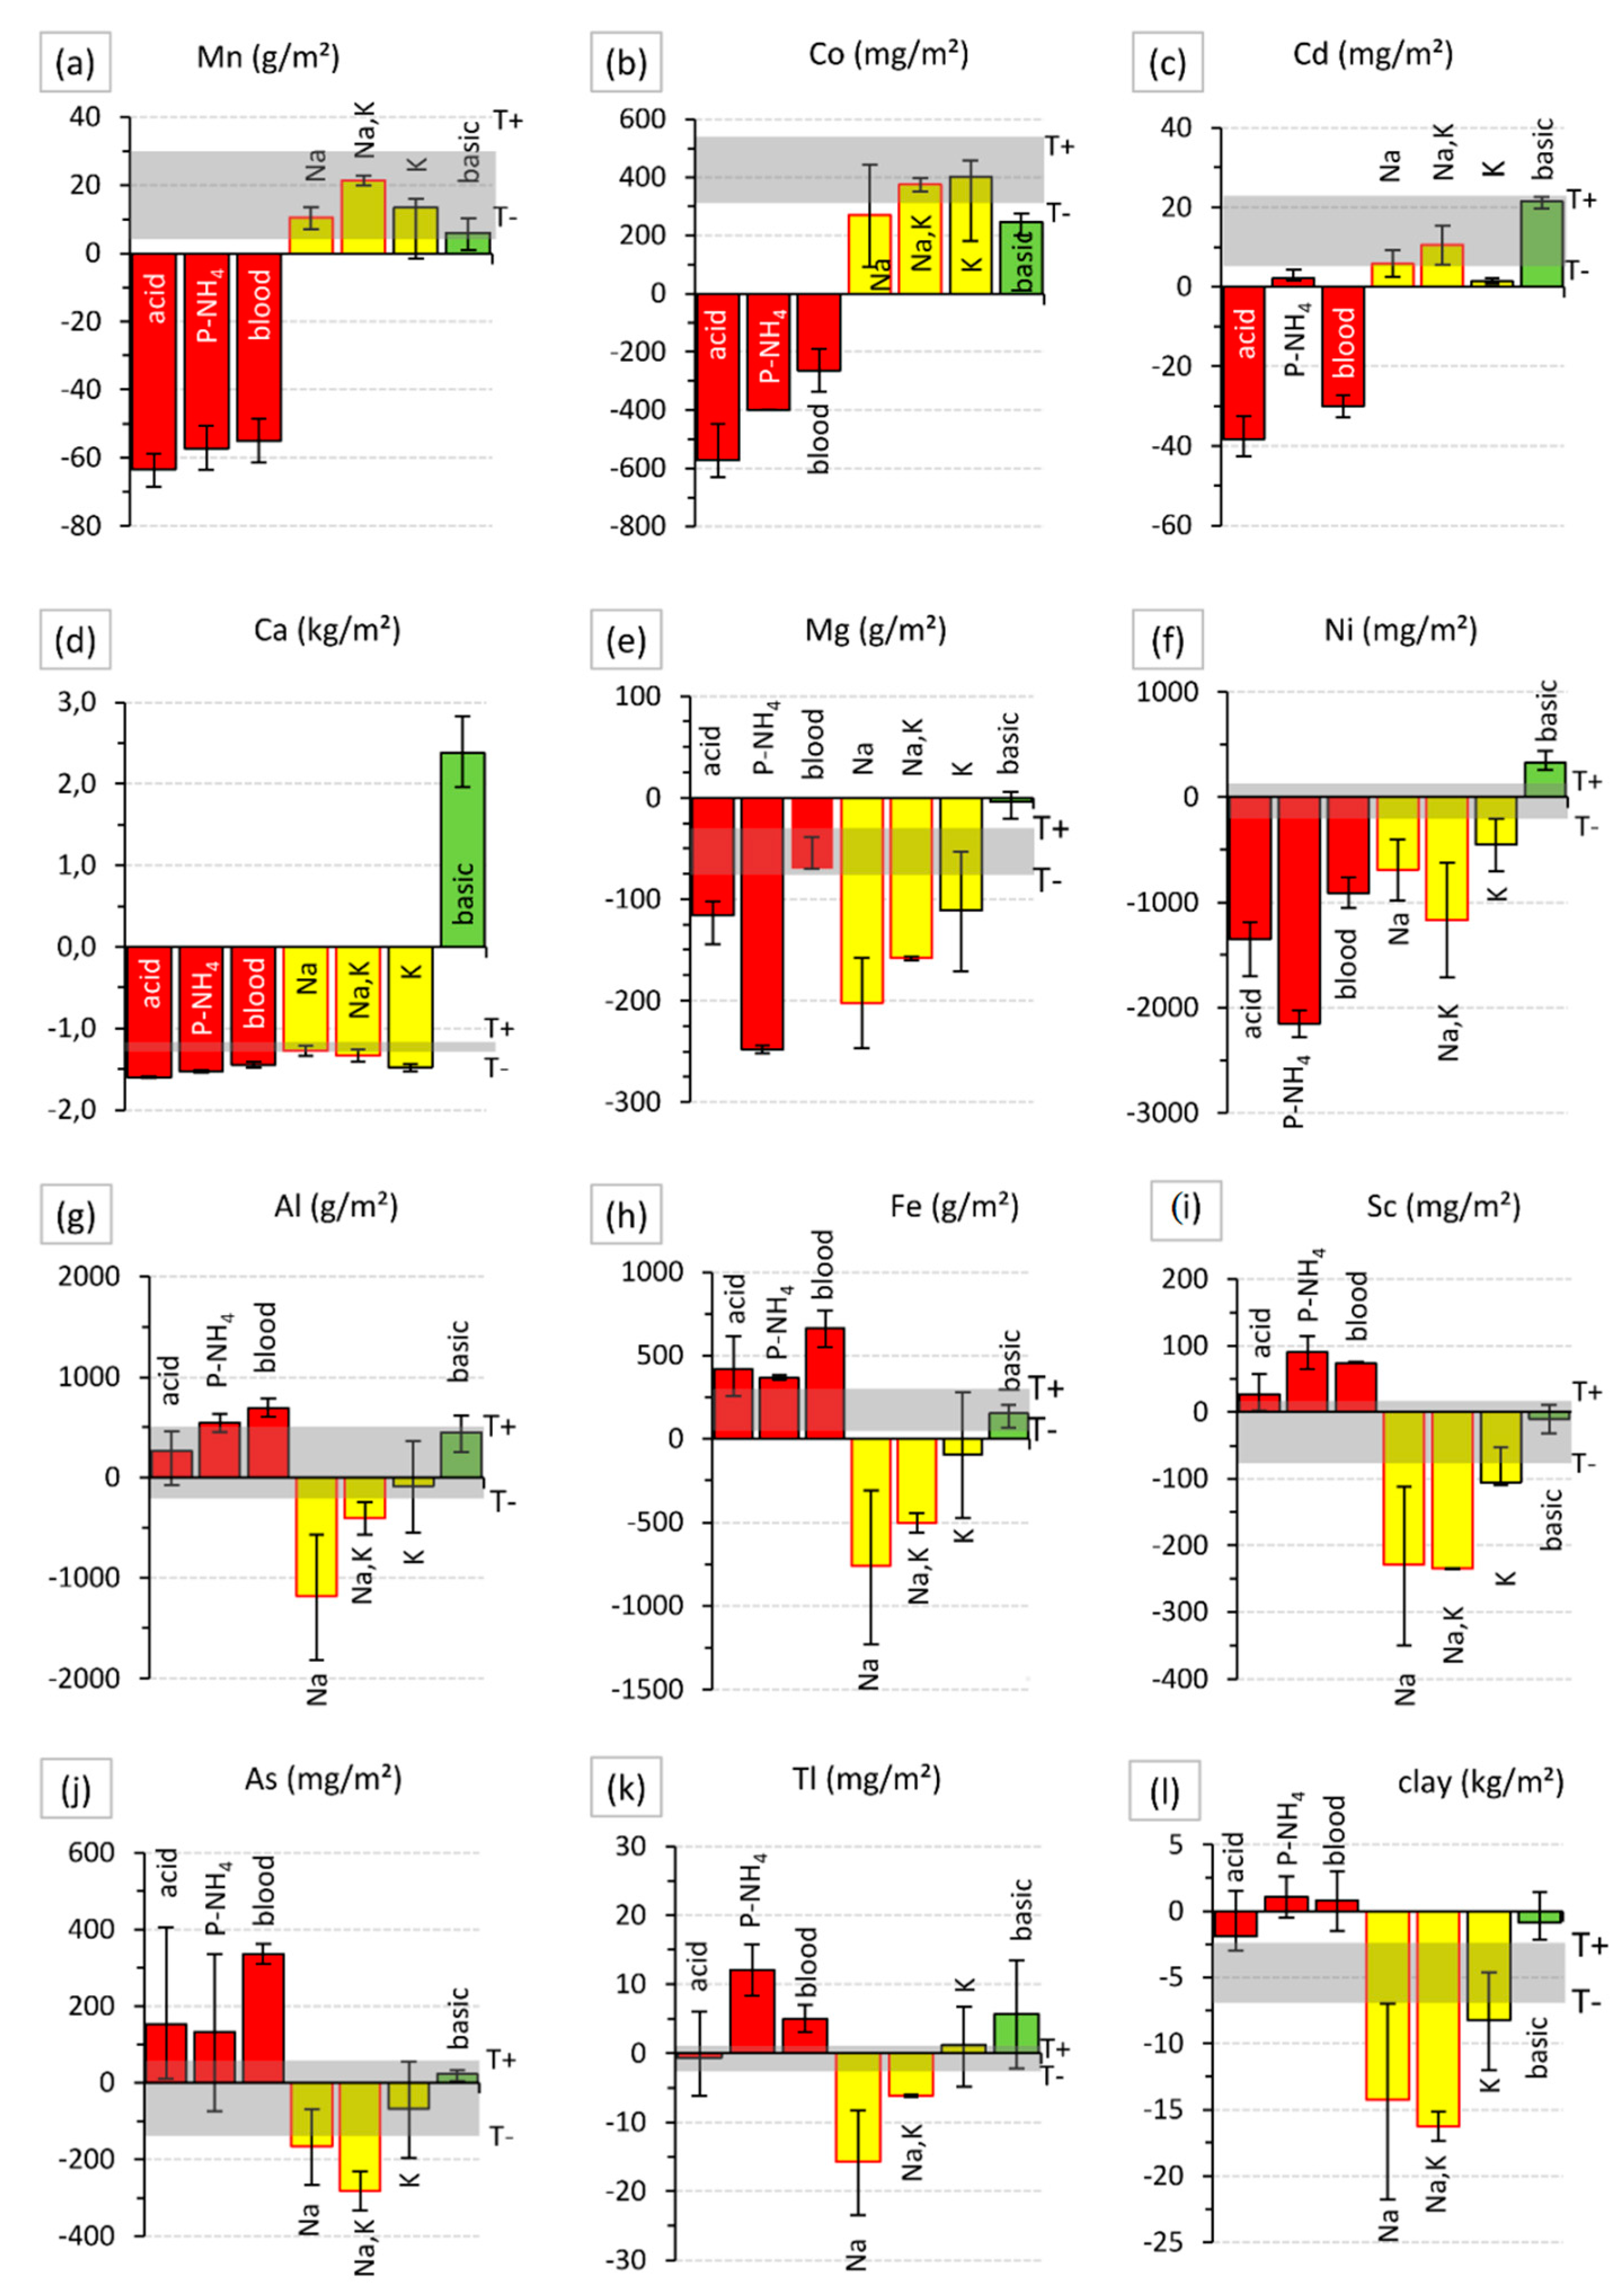
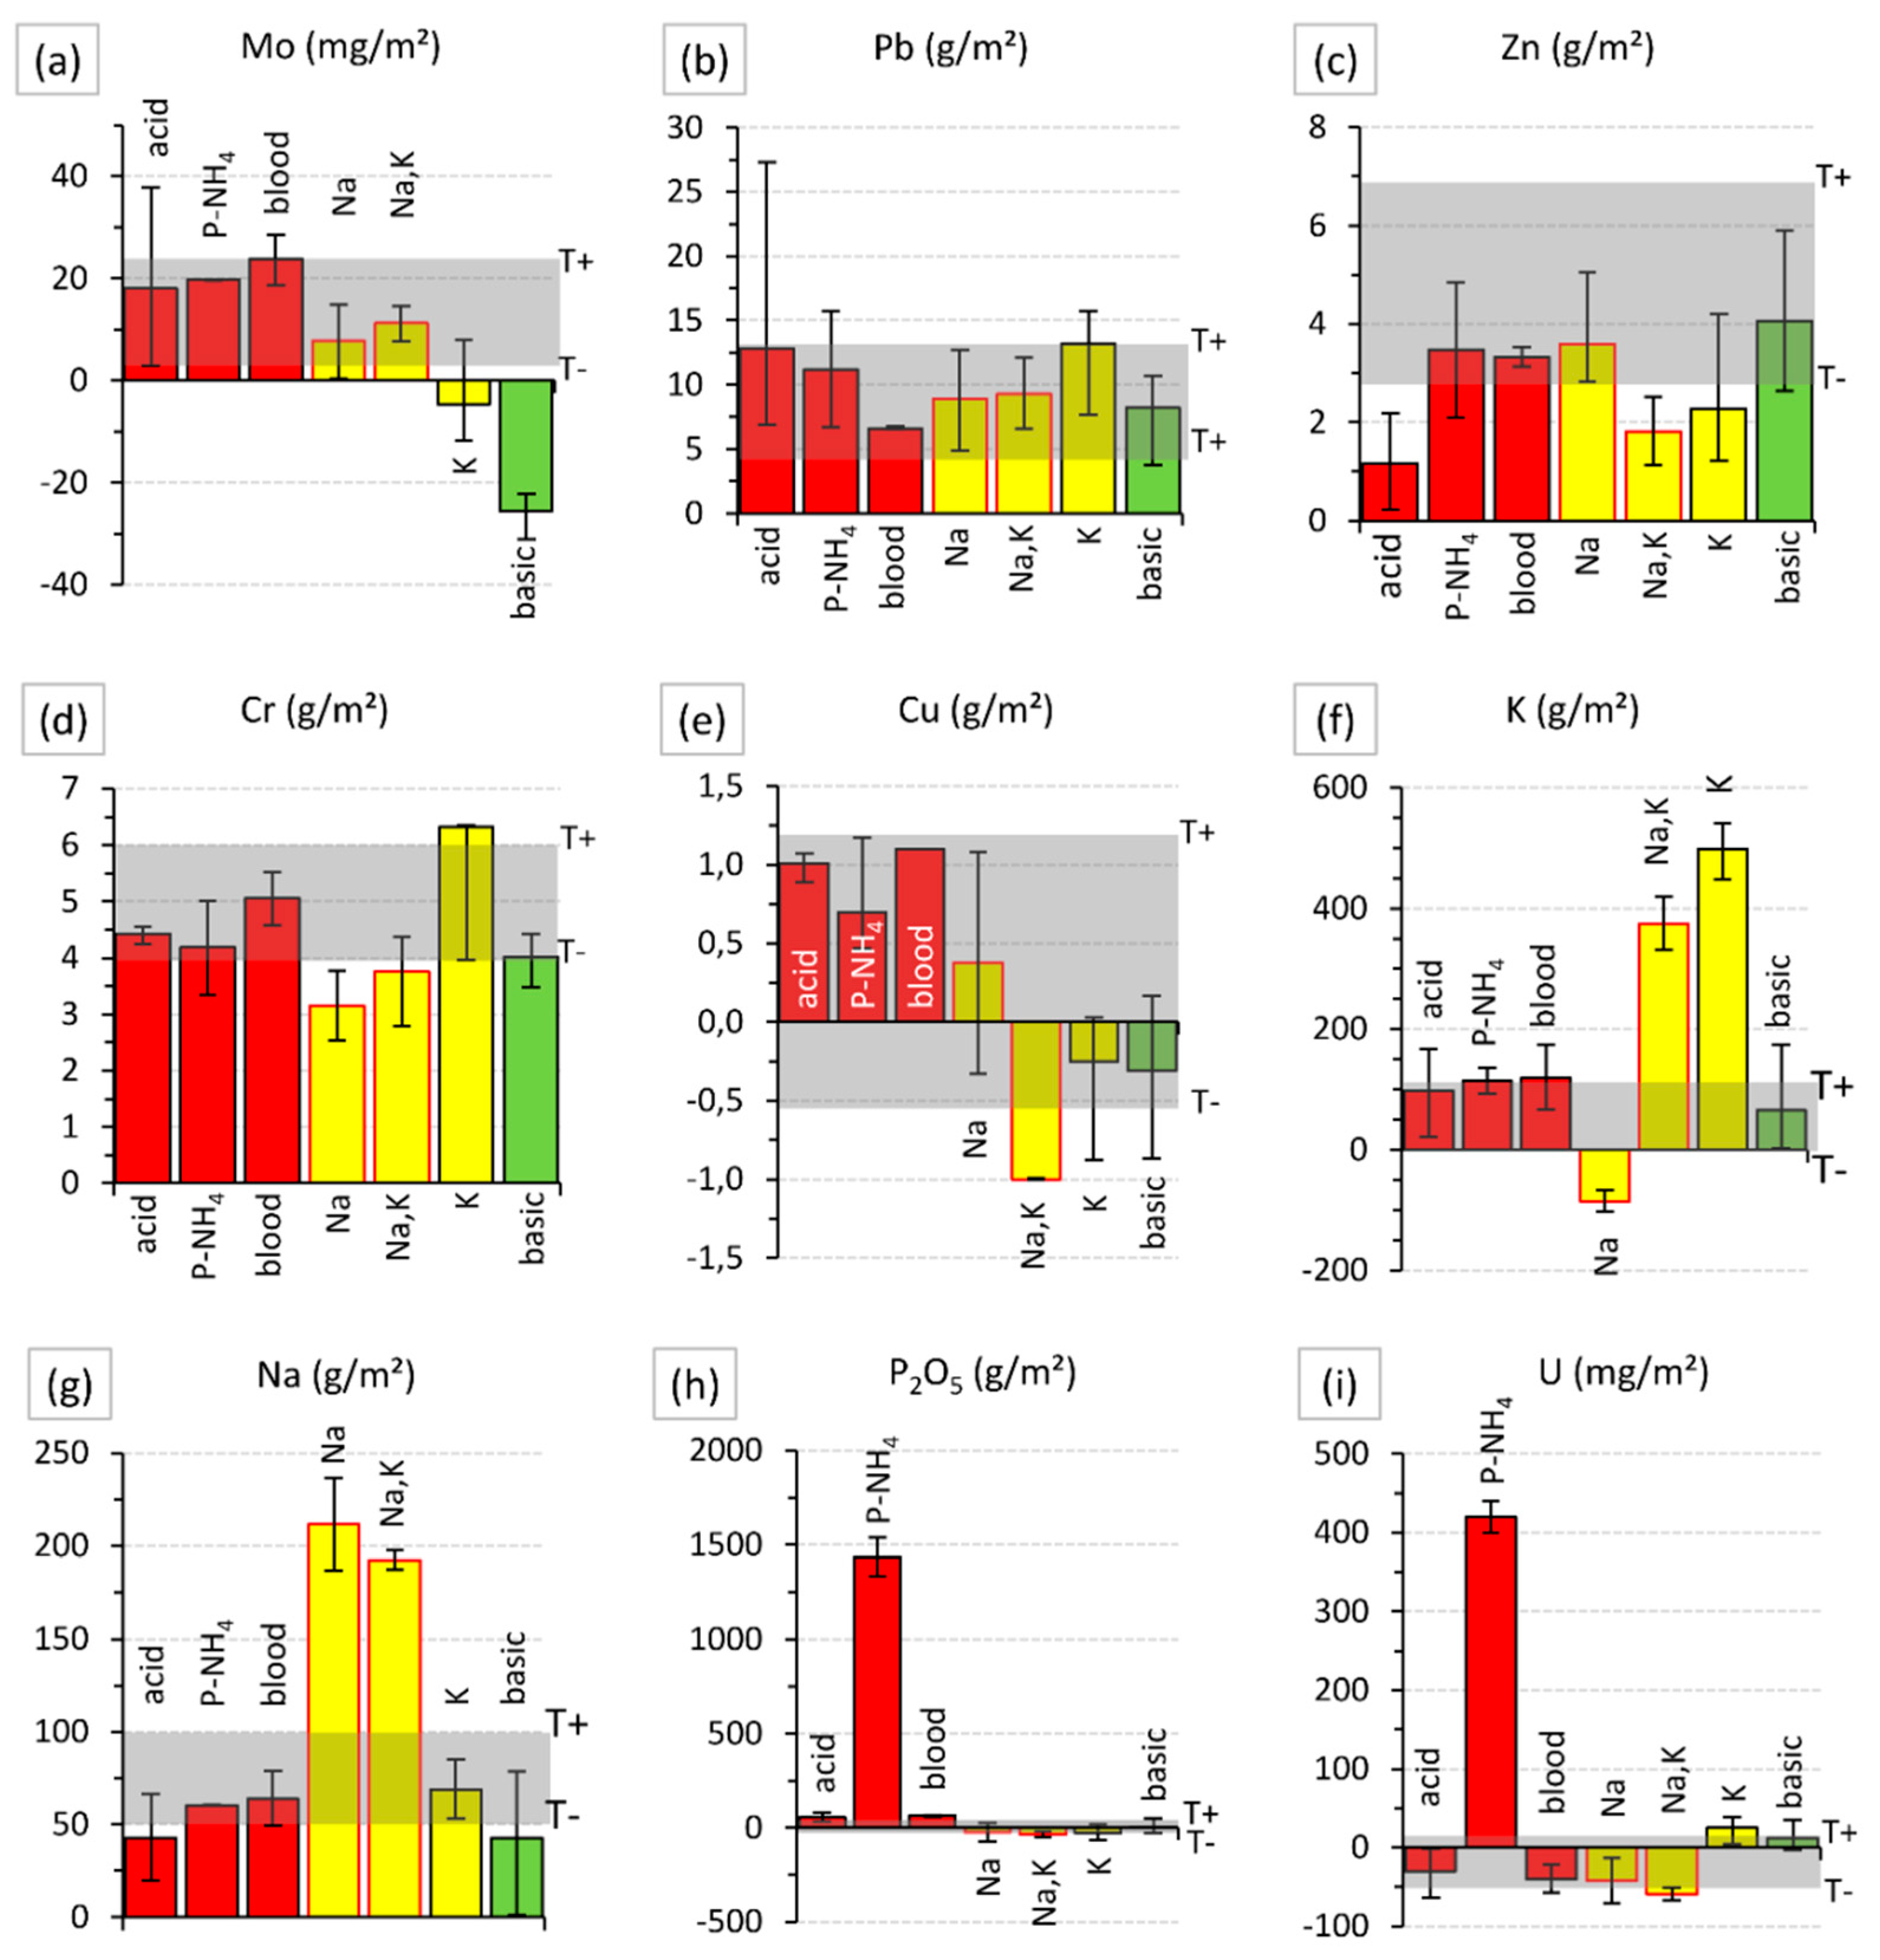
3.2.2. Element Budgets in Fertilized Plots

For plots receiving chemical fertilizers and amendments, budgets are presented in Figure 5 and Figure 6. The order of presentation is based on similar patterns of gain/loss distribution in the fertilization treatment groups. In the graphs, the gray right-angle represents the 95% confidence interval of element budgets calculated for the reference plots with maximum (T+) and minimum (T) values. In case of significant inputs of elements via atmospheric deposition (Table 1 and Table 2), the net element gains and losses in fertilized plots were estimated with respect to the T+ or T value, respectively.
A first group of elements (Mn, Co, and Cd) demonstrated distinct losses for ammonium-based fertilization and dried blood (Figure 5a–c). Budgets of monovalent and basic treatments were found within or close to the 95% confidence interval of the reference plots. In the acidified plots, Mn loss from the surface horizon reached −55 to −65 g/m2 in 85 years (Table 3). Cobalt budgets in these treatments were between about −250 and −600 mg/m2 (Figure 5b). When considering the Co input by atmospheric deposition, the net Co budgets represent a loss of −600 to −800 g/m2 (Table 3). Cadmium budgets showed a loss of −30 to −40 mg/m2 for the dried blood and acid plots, respectively. However, a small gain was observed under P–NH4 fertilization (Figure 5c), highlighting the frequently reported presence of Cd as an impurity in phosphate fertilizers [32]. When considering atmospheric deposition of Cd revealed in the reference plots (Table 3), the net budgets reached −45, +3.5, and −35 mg/m2 for the acid, N–PH4, and dried blood plots, respectively. It must be noted that a loss of −39 mg/m2 represents the total estimated Cd stock present in the 0–25 cm surface layer in 1929.
A second group of elements (Ca, Mg, and Ni) displayed losses for both the ammonium-based fertilizers and the monovalent plots (Figure 5d–f). Calcium loss was outstandingly high, between −1.4 and −1.6 kg/m2 (i.e., −14 to −16 t/ha), exceeding Ca loss in the reference plots by 200 to 400 g/m2. In the monovalent treatments, the loss of Ca also slightly exceeded that observed for the reference plots. In the basic amendments, the gain of Ca reached about +2.5 kg/m2 (i.e., +25 t/ha). The distribution of budgets for Mg and Ni showed comparable tendencies. Mg loss in soils under ammonium-based fertilization exceeded that in the reference plots, reaching −100 to −200 g/m2 (Figure 5e). Mg losses for dried blood and reference plots were similar, suggesting a supply of Mg via blood compensating for its loss in acidic soil conditions. In the monovalent treatments, the loss of magnesium varied between −100 and −200 g/m2, with decreasing amplitudes for Na > (Na + K) > K treatments. For Ni, the losses were high in the acid plots, between −0.9 and −2.1 g/m2 (Table 3), but also in the monovalent treatments (Figure 5f), reaching about −0.5 to −1.2 g/m² (i.e., −5 to −12 kg/ha).
A third group of elements (Al, Fe, Sc, As, and Tl) demonstrated negative budgets for the monovalent plots, and element losses for sodic treatments were systematically larger than for K treatments. Moreover, these element budgets were slightly or distinctly positive for the three acid treatments (Figure 5g–k). Such distribution patterns were similar to those observed for clay (Figure 5l).
Of note, a significant element loss under basic soil conditions was observed for molybdenum (Figure 6a), about 25 mg/m2.
For the elements of a fourth group (Pb, Zn, Cr, and Cu), only positive budgets were always positive (Figure 6b–e). No distinct differences between the treatments could be observed; they were to a large extent masked by the importance of atmospheric deposition, particularly for Pb (Figure 6b). For Zn, small losses were observed in the acid plots and under potassium-based fertilization. A loss of Cr was observed for the sodium-based treatments, pointing to Cr migration via clay leaching. For Cu, all budgets positive on the right side of the experiment were negative on the left side (Figure 6e), ascribed to local contamination by Cu-containing treatment for obscuration of glass houses located on the right side of the experiment [19].
Finally, for the last group (Na, K, P, and U), the distribution pattern of budgets was dominated by the input of target fertilizer elements (Figure 6f–i). Considering the application rates for K (250 kg K2O/ha/y), almost 900 g/m2 of K has been added to the soil since 1928, from which about 500 g/m2 presently subsists in the 0–25 cm layer for pure K fertilizers, and about 380 for the mixed (Na + K)Cl (sylvinite) treatment, suggesting a large K transfer toward depth. For ammonium phosphate, P input was based on the equivalent nitrogen dose (150 kg/ha/year). Hence, the theoretical input was 0.6 kg/m2 in 85 years, about 1.6 times higher than the P fertilizers applied at a dose of 200 kg P2O5/ha/y. The current P budget of 1.4 kg/m2 in the (NH4)2HPO4 plots (Figure 6h) revealed a loss of about −50% of the P inputs under strongly acidic soil conditions. Remarkably, the input of U in the ammonium phosphate treatment reached +4200 mg/m2 (Figure 6i) (i.e., 4.2 kg/ha). This is about 1.5–2 times higher than that observed under natural or super-phosphate fertilization [19].

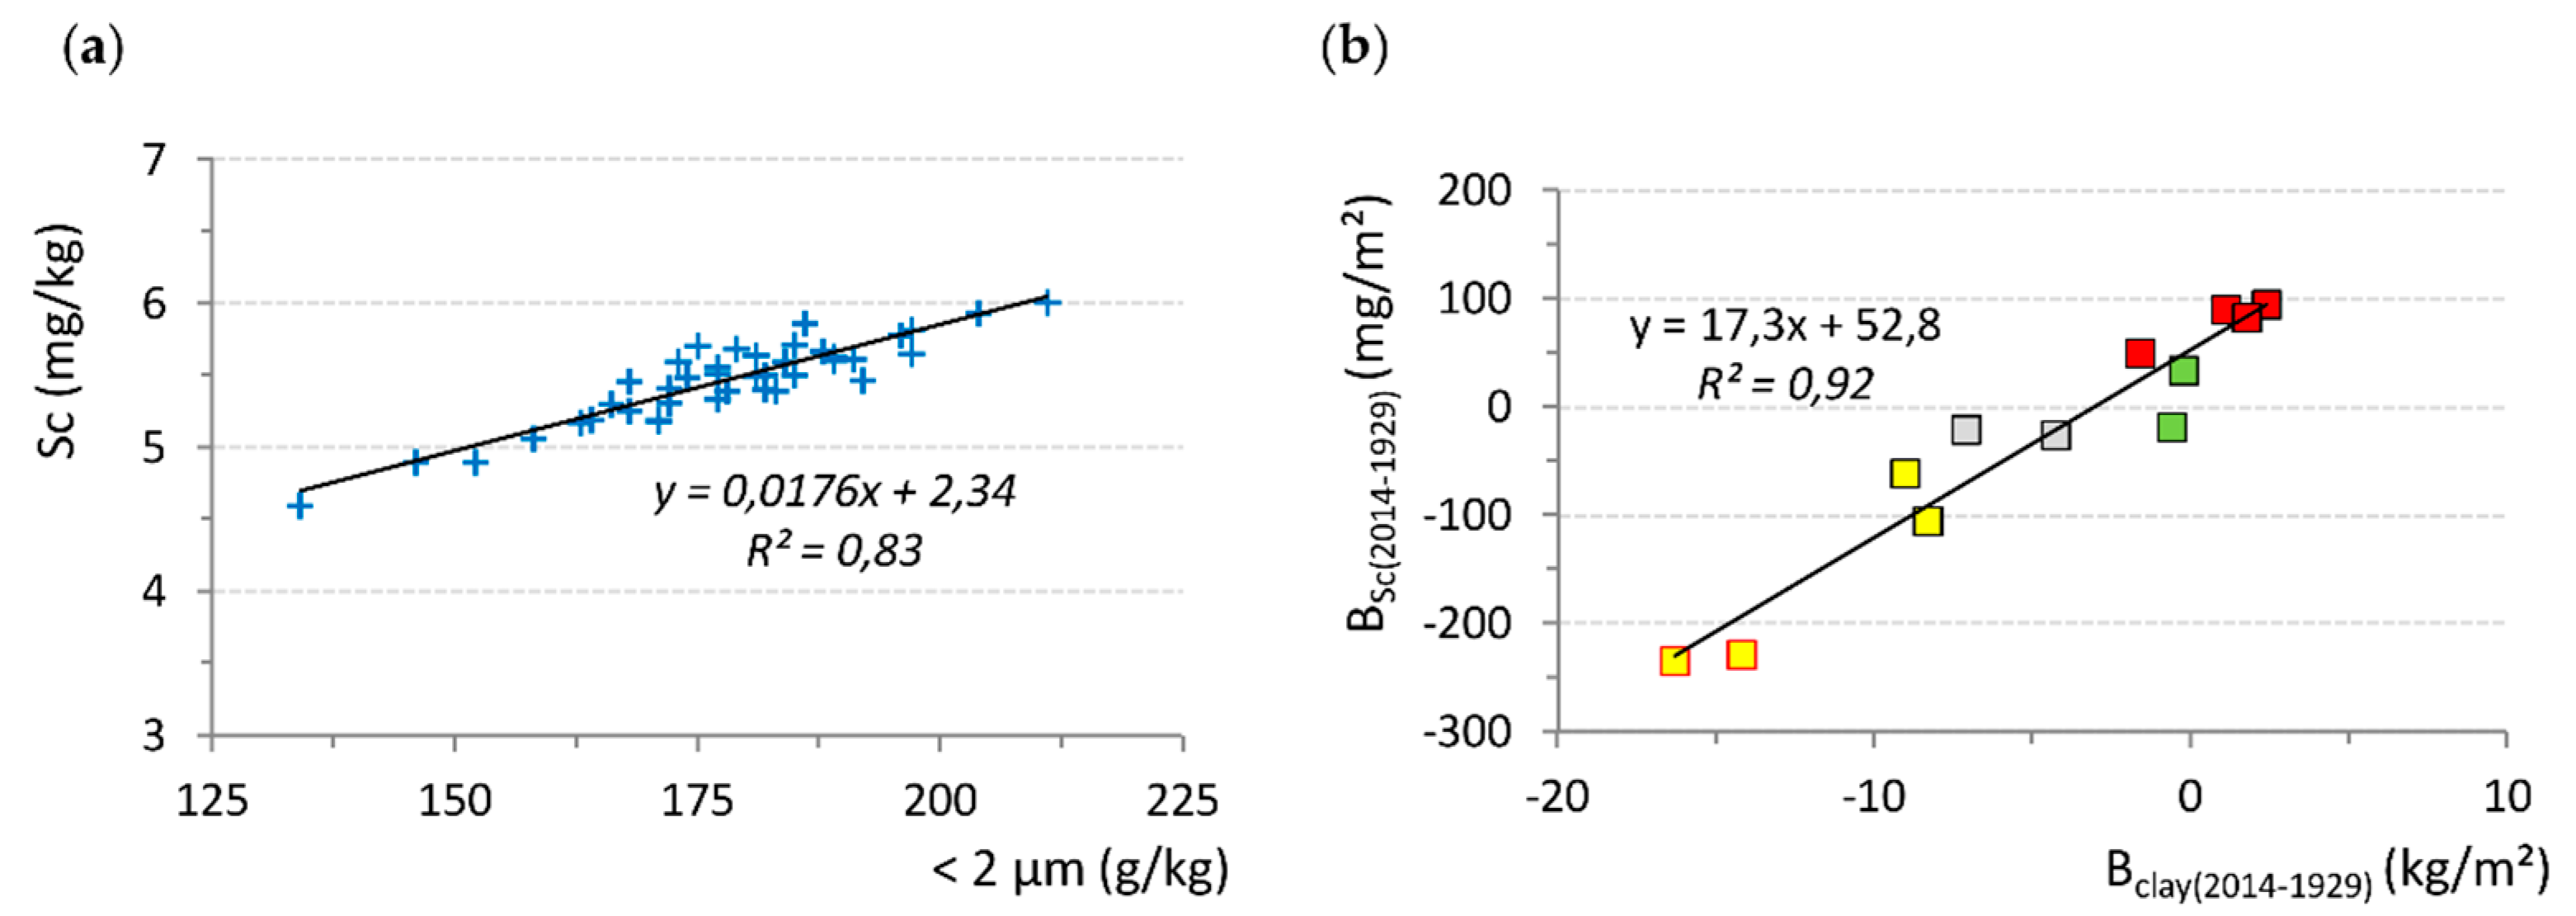
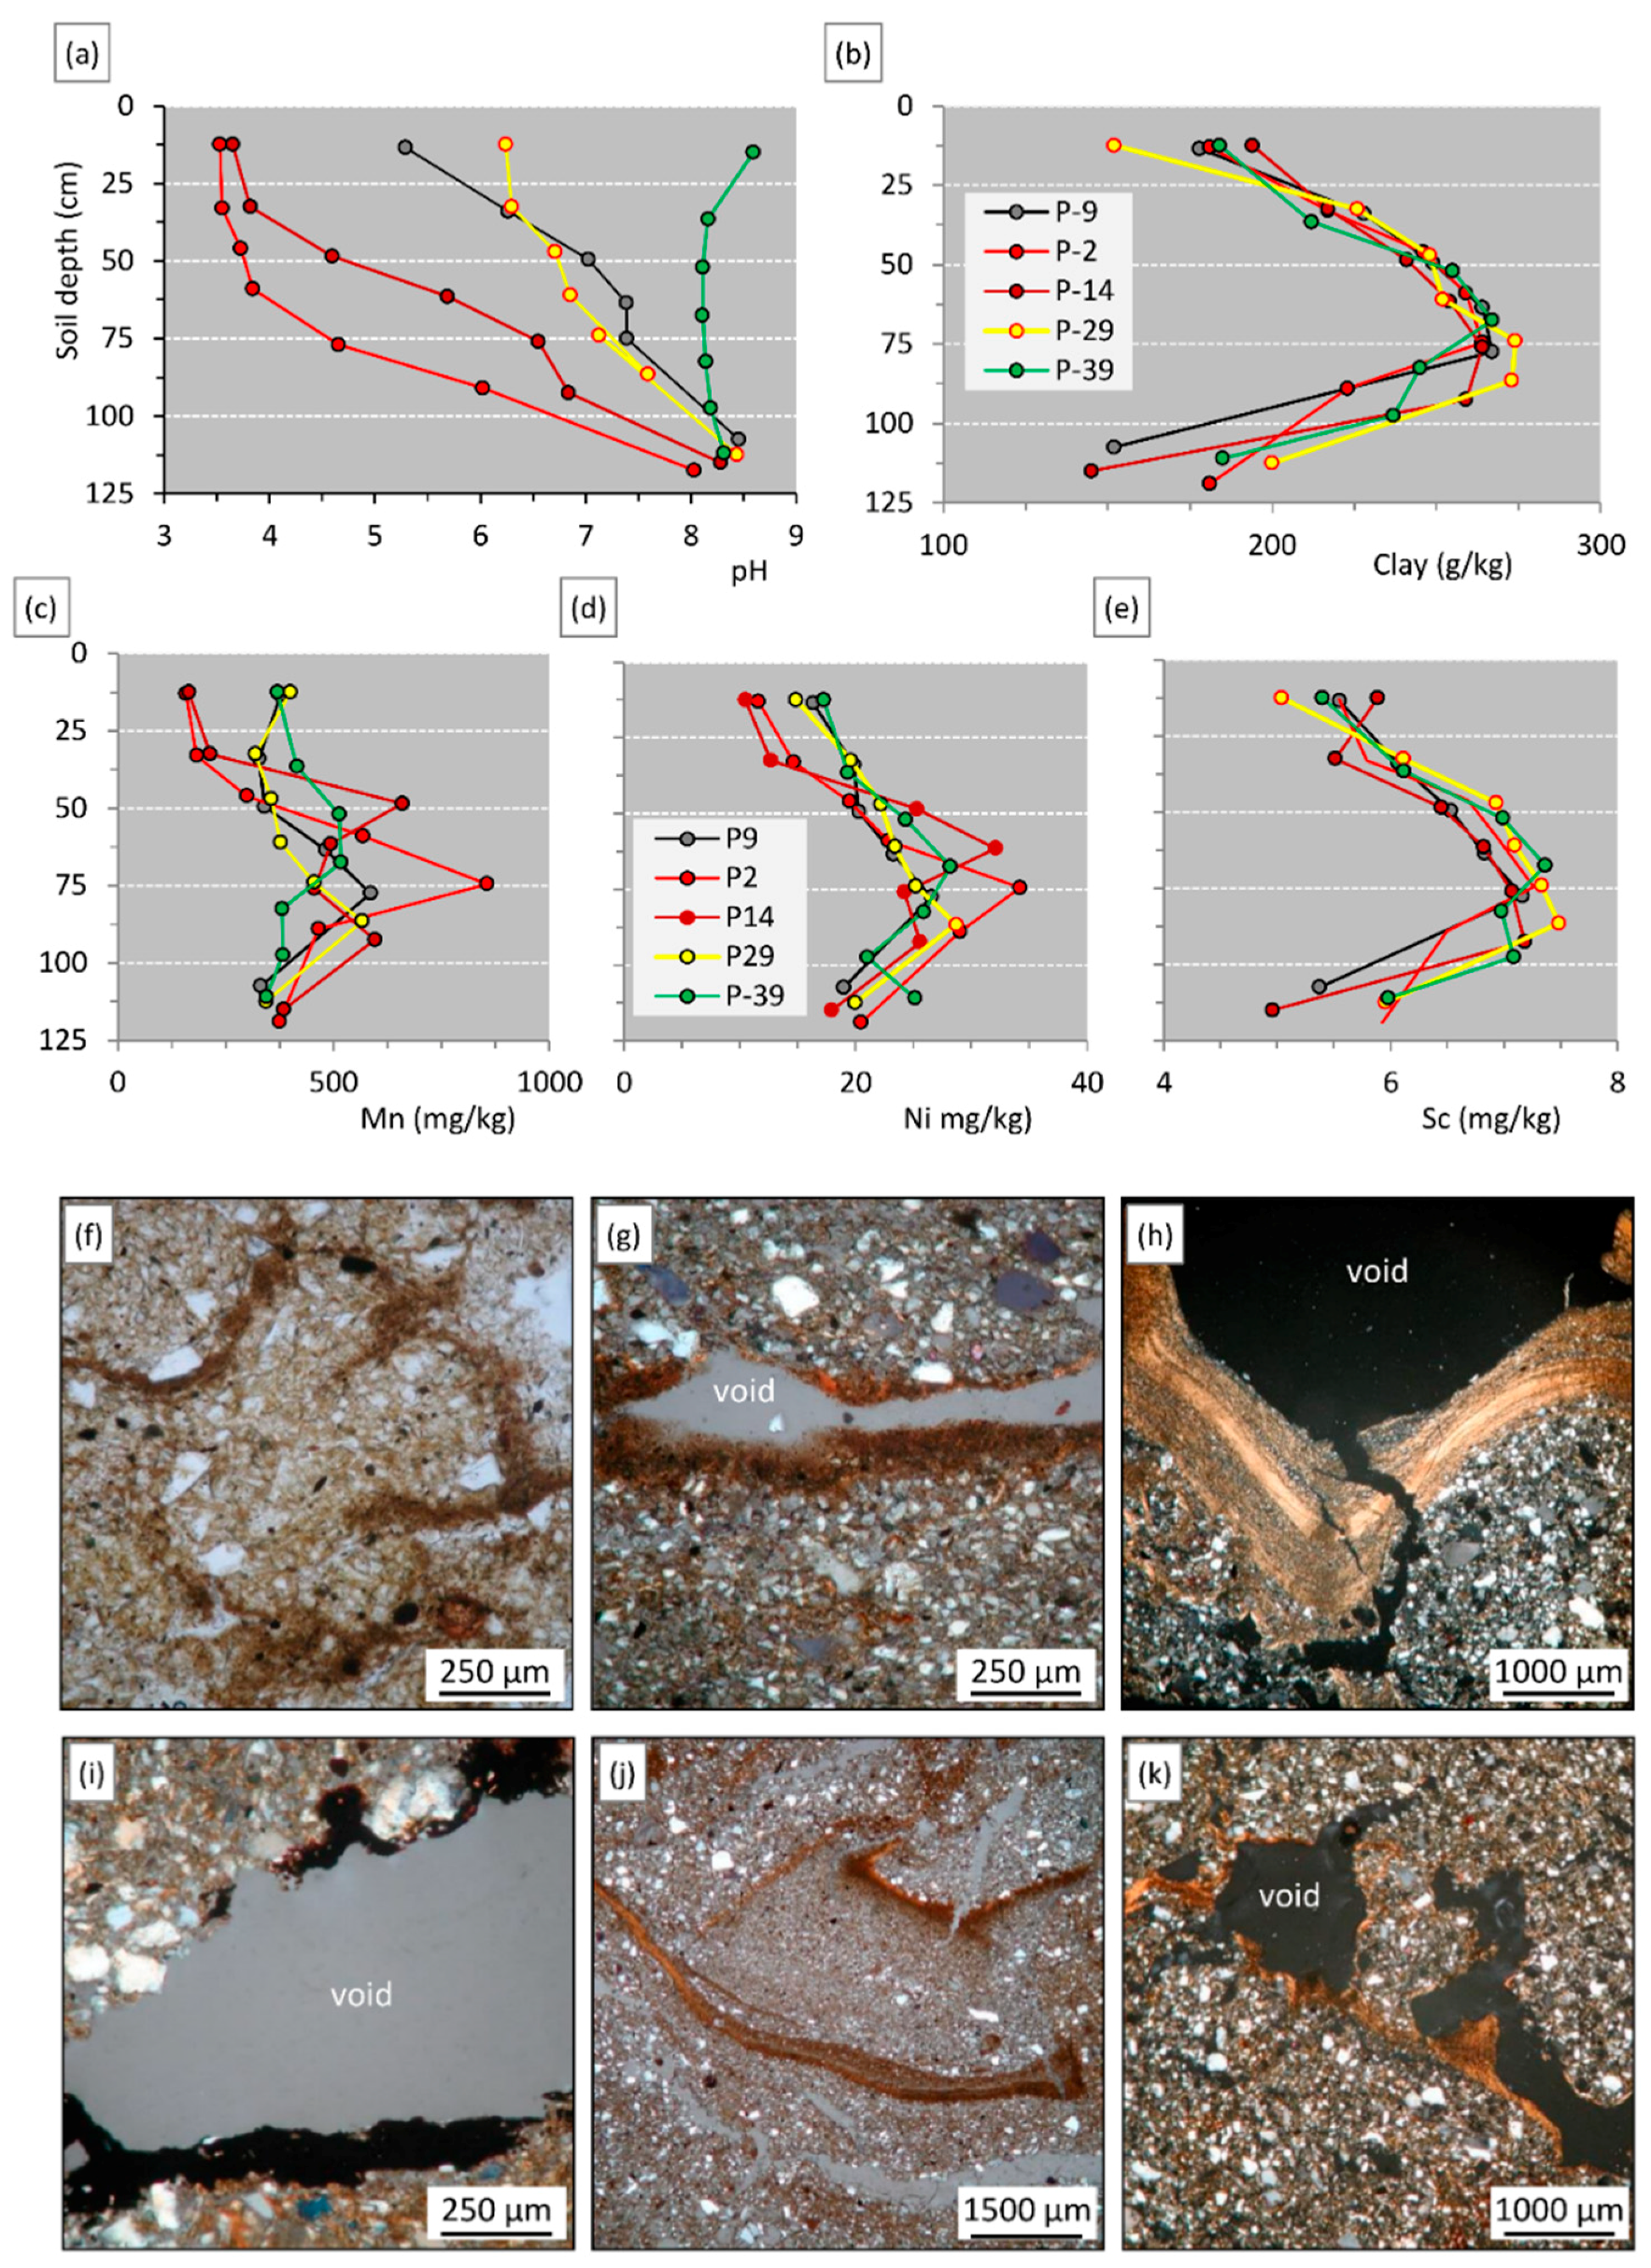
3.3. Selected Exploratory Analytical Data from Subsurface Horizons in 2014

3.3.1. Chemistry

Acidification or alkalinization effects produced by long-term application of fertilizers and amendments clearly affected the soils beyond the surface horizon (Figure 7a). In the ammonium sulfate plots, the pH was low until great depth, <4 between 0 and 60 cm and about 4.5 at 80 cm, whereas under ammonium phosphate application, the soil pH was >5 as soon as 50 cm depth. For both treatments, pH > 8 was reached at depths >110 cm. In the sylvinite plots, the pH was >6.3, equal to the reported initial surface pH [10], and gradually increased to pH 8 for depths <100 cm. In the reference plots, only the surface horizon acidified under natural local climatic conditions. Under basic amendments, the pH was >8 in all soil horizons. Elemental concentration profiles gave evidence for augmented lixiviation of mobile metal elements, such as Mn and Ni, in acidic soil conditions (Figure 7c,d). Their concentrations were highest at 75 cm soil depth under (NH4)2SO4 fertilization, but at 50 cm under (NH4)2HPO4 fertilization, they were consistent with the different pH depth gradients for these two types of ammonium fertilizers. By contrast, effects of enhanced clay leaching in the monovalent plots were not very noticeable. Nonetheless, between 0 and 50 cm soil depth, both the clay content (Figure 7b) and Sc concentration (Figure 7e) shifted from lowest to highest values in comparison to the other treatments, suggesting enhanced clay illuviation in the E, E/Bt, and upper Bt horizons.

3.3.2. Micromorphology

In the E and E/Bt horizons of acidified and reference soils, optical microscopy on thin sections demonstrated the occurrence of dark-brown dust coating composed of a mixture of clay and fine silt-sized particles (Figure 7f,g). Such pedofeatures are indicative of low aggregate stability in the Ap horizon with very low SOM content [2,15]. Under sylvinite application, layered silt and clay coatings were observed (Figure 7h), pointing to periodically contrasting conditions favoring either eluviation/illuviation processes due to the clay-dispersive action of Na and K or mass transport of clay-silt material following mechanical disturbance in the surface horizon [34]. In the E/Bt and upper Bt horizons under ammonium-based fertilization, numerous dark-brown to black impregnations of void walls (hypo-coatings) or the adjacent groundmass (quasi-coatings) were observed, suggesting migration via the soil solution and precipitation of dissolved or colloidal metal elements, particularly manganese (Figure 7i), in large soil pores.

4. Discussion

4.1. Dynamics of Major and Trace Element in Soils: Lessons from the 42-Plots LTBF Experiment

Distribution patterns of geochemical budgets, established for 8 major and 12 trace elements, indicated two main sources for element inputs in the soil surface layer, as well as two main soil processes that controlled their dynamics with time, notably in the strongly acidified soils and under Na and K fertilization (Figure 5 and Figure 6, Table 4).

4.1.1. Sources of Element Inputs

In the fertilized plots, clear positive budgets were observed for major target elements of fertilizers such as P (ammonium phosphate), Na, K (monovalent plots), and Ca for the basic amendments (Figure 5d and Figure 6f–h). Estimated ratios between the calculated 1929–2014 budgets (Figure 5 and Figure 6) and the theoretical cumulative inputs following the equivalent fertilizer doses (Figure 1) are as follows: P: 6/12 t/ha (≈50%); Ca 25/60 t/ha (≈40%); K: 4–5/17 t/ha (≈25–30%); Na (NaNO3 plots): 2/21 t/ha (≈10%). In the absence of vegetation, such estimations highlight the risks of transfer toward depth in bare fallow soils. An iron input of 660 g/m2 (Table 3), i.e., +6.6 t/ha, was observed for soils receiving dried blood fertilization (Figure 5i). Iron is an important component of dried blood, with a content of 20 to 30 g/kg [35], responsible for a theoretical input of 1.8–2.7 t/ha of Fe in 85 years. Among the trace elements, U, As, and Cd were added by ammonium phosphate fertilization. Their presence as impurities in phosphate is widely reported [32]. For U (Figure 6i), the calculated budget of +4.2 kg/ha represents an annual input of about +50 g/ha and an increase of U concentration in the 0–25 cm surface horizon from 1.9 to 3.1 mg/kg. The positive Ni budget observed in the basic amendment plots suggests input via agronomic liming practices. According to data in the general literature [36], average Ni content in lime is about 20 mg/kg. With an equivalent CaO dose of 1000 kg/ha/year, the theoretical input of Ni via CaCO3 would reach about 3 kg/ha in 85 years, consistent with the calculated +3.3 kg/ha Ni budget for the basic plots (Figure 5f).
In the absence of elemental uptake by plants, the nonamended plots of the 42-plots experiment act as valuable recorders of atmospheric deposition [12,13,37]. For the reference plots, significant positive element budgets were observed for Na, Cd, Co, Cr, Mo, Pb, and Zn (Table 1, Table 2, and Table 4), elements that are frequently reported in atmospheric deposition [32,38]. The Na enrichment may be ascribed to diffuse, long-distance atmospheric deposition of seawater salt, currently reported in Western Europe [39]. For trace elements, the estimations of equivalent inputs per hectare during the 85 years of experimentation reached about 125 g/ha for Cd, 170 g/ha for Mo, 4.3 kg for Co, 50 kg/ha for Zn and Cr, and 91 kg/ha for Pb, totaling an overall metal input of ≈195 kg/ha (i.e., ≈2.3 kg/ha/y). For the French territory, a quantitative inventory of sources for 10 trace elements (not including Co) was reported by [40]. Among six main identified sources, the contribution of atmospheric deposition to trace element inputs was assessed by the European heavy metal mosses survey based on four survey campaigns in 1996, 2000, 2006, and 2011. The ratios of annual atmospheric inputs of trace element inputs for the national inventory and our average data from 85 years of experiment in the 42-plots trial are: 0.60/2 g/ha for Mo (×3); 0.25/1.5 g/ha for Cd (×6); 55.7/595 g/ha for Zn (×11); 7.72/1070 g/ha for Pb (×140); and 2.39/591 g/ha for Cr (×240). Such widely diverging trace element input rates can be explained by several factors. First, Versailles lies in the suburban region of the Paris agglomeration, where atmospheric depositions may be far greater than in rural areas [41]. Second, the long-term experiment is situated about 150 m away from a main national motorway (N10), engendering local heavy-metal contamination that affects all plots via exhaust gas of gasoline and diesel vehicles, or by tire-wear abrasion [42]. Third, the 42 plots have recorded a cumulative budget since 1929, whereas the moss survey inventory presents data from a recent period, when many efforts were made to reduce atmospheric pollution. Lead fluxes measured in the Paris region in 1988 reached 0.36 kg/ha/y [43], decreasing to about 0.1 kg/ha/y in 1994–1995 and then lowering by a factor of five to about 0.02 kg/ha/y in 2000 [44]. Such drastically decreasing Pb emissions into the atmosphere were due to strongly improved filtering of industrial chimneys and the banning of leaded petrol. Therefore, the main period of atmospheric lead deposition on soils likely was before the 1990s, particularly between the 1950s and the 1970s [12], when Pb fluxes were about 10 times higher than in the period 1990–2000, reaching rates of several kg/ha/y. Hence, our estimate of 91 kg/ha accumulated between 1929 and 2014 seems reasonable.

4.1.2. Soil Processes

The PCA projection of 1929–2014 budgets of major and trace elements reveals close relationships between the changes in different element stocks and two key indicators of fertilization-induced soil processes over 85 years (Figure 8): the clay budgets and the 2014 soil pH, with axes PC1 and PC2 explaining about 60% of the variance. From this projection, the contributions of two main soil processes, clay leaching and lixiviation in acidic soil conditions, on the soil’s geochemistry can be itemized.

Clay Leaching

Decreasing clay content is illustrative of fine clay being washed out of the surface horizon and translocating to subsurface horizons. In Figure 8, clay and monovalent-cation budgets are strongly negatively correlated, notably the Na budgets. Such opposed budgets emphasize the dispersive action of Na, and to a lesser extent of K, that favors clay eluviation/illuviation processes in soils. On the contrary, the clay budget was strongly positively correlated with Sc, Fe, Tl, Al, and As, and to a lesser extent with Cr, confirming their preferential associations: Fe and Al are major constitutive elements of clay-mineral crystal structures [7]; Sc in loess soils was shown to be quasi-exclusively located in ferromagnesium phyllosilicates (biotite, chlorite) as a substitution of Al3+ or Fe3+ [29,30]; Tl has similar properties with respect to K; and Tl/K substitution in phyllosilicate minerals was frequently reported [45]. In France, a broad study on the contents of nine trace elements in surface horizons of 244 rural soils also showed clear positive correlation for Tl and clay content [21,46]. For As, some studies stressed the adsorption of arsenate on positive edge charges of clay minerals and their possible concomitant migration in soils [47], which would be primarily the case for the monovalent-fertilizer applied plots. However, As(III) was reported to be more stable and more mobile in mildly reduced conditions [48]. Such temporary reduced conditions recur in the sodic and potassic plots, with the highest bulk densities (Figure 4d) and low aggregate stability [2,15]. Hence, the behavior of As with respect to clay may be explained either as a direct effect of clay leaching or an indirect effect due to Na and K fertilization–induced hydromorphic soil conditions.

Acidification, Lixiviation, and Enhanced Chemical Weathering

In addition to the rapid decrease of pH after the start of the experiment, a second source of natural acidification is atmospheric deposition of dissolved gasses (CO2, NO2, SO2) via rain, forming acids on contact with water. Acid rain was a hot topic during the second half of the twentieth century, and was shown to enhance the leaching of nutriments and mineral weathering in deeper soil horizons of forest soils [49]. Effects of acid rain were supposed to diminish after the 2000s [50], due to more drastic control of anthropogenic emissions. Additional strong acidification was observed for soils under ammonium-based fertilization (Figure 1a) due to the nitrification reaction: NH4+ + 2 O2 → NO3 + 2 H+ + H2O. For equivalent N-dose inputs, the production of protons is two times higher for ammonium sulfate and chloride with regard to ammonium nitrate, and threefold higher for ammonium phosphate fertilization. Organic N also undergoes nitrification, and fertilization with dried blood displays a similar strong acidification effect. Soil acidification may cause severe damage to soil, water, vegetation, and living organisms. The impacts of acidification on soils depend on their buffering capacity, i.e., the ability to neutralize acidity [51]. Major soil constituents for such neutralizing actions are carbonates, organic matter, and finely divided, easily weatherable minerals.
In Figure 8, a strong correlation with soil pH can be observed for Mn, Co, Cd, and, to a lesser extent, Ni. Their highly mobile character in acidified soil conditions has been frequently reported [32]. In the absence of vegetation, such mobility of trace elements supposes their transfer and accumulation in deeper horizons. Increased Mn and Ni concentrations were observed at depth in the two acid plots (Figure 7). For Zn, however, although it is generally recognized as mobile in soils, no clear negative budgets were observed in soils of the 42 plots (Figure 6c), most likely due to high input by atmospheric deposition (Table 2). High losses were observed for Ca (Figure 5d) in the reference plots (−1.2 kg/m2) and for acid treatments (−1.6, −1.5, −1.4 kg/m2, respectively). Such magnitudes bring into question the origin of Ca washed out of the surface horizon. Data of exchangeable Ca in the reference plots decreased roughly from 15 to 5 cmol/kg between 1929 and 2014 [18], representing a loss of about 0.73 kg/m2 of Ca. In the strongly acidified plots, where virtually no more exchangeable Ca is detected at present, such a Ca loss accounted for about 0.98 kg/m2. These calculations indicate that, in view of total Ca loss, about 0.4–0.6 kg/m2 must be attributed to mineral dissolution, likely of the more weatherable plagioclase feldspars. Magnesium also washed out of the surface horizon in the reference soils (Table 1) and more in the acid and P–NH4 plots (Figure 5e). Loss of Mg was less evident for dried blood, suggesting consistent input via this organic nitrogen source.
A second indication of mineral weathering was given by positive budget data observed for Al, Fe, Sc, Tl, As, and clay in the acid, P–NH4, and dried blood plots (Figure 5g–l, Table 4). High inputs of H+ would expectedly lead to clay destruction and decreasing clay content (cf. Section 4.1). However, soils of the strongly acidified plots demonstrated the highest clay content (Figure 4c). Such apparently contradictory findings may be explained by subsidiary hydrolysis weathering of primary phyllosilicate minerals in loess soils (mica and chlorite) affecting the fine silt fractions. Their breakdown would produce clay-sized particles with low electric charge and thus compensate for the acid dissolution of clay. A mechanism of clay mineralogical development of silt fraction in acid loess soils was reported by [52]. Such a dissolution process of clay minerals in acid soils would explain the omnipresence of Al on the exchange complex (Figure 4b), and the decreasing CEC values inversely proportional with the produced proton loads by ammonium fertilizers reported by [18] is consistent with a mineralogical mechanism of breakdown of silt into clay-sized mica or chlorite particles. Positive element budgets for Al, Fe, Sc, Tl, and Sc suggest their immobilization by Al oxyhydroxides, or phosphate, in the surface horizon. The incorporation of a part of the underlying E horizon by constant 25 cm depth digging in a compacting A horizon would lead to a relative accumulation of Al, Fe, Sc, Tl, and Sc during the 85 years of the experiment. For Fe, its relative accumulation in strongly acidic soil conditions may explain the difference between the observed positive Fe budget in the dried blood plots (+6.6 t/ha) and the theoretical inputs (+1.8 to +2.7 t/ha) (cf. Section 4.1.1).
Remarkably, some elements, such as Mg, Ni, and Ca, were affected by both clay leaching and acidification (Table 4), explaining their intermediate position between clay and pH in the PCA budget projection (Figure 8). Furthermore, all three elements showed positive budgets for the basic amendment plots (Figure 5d–f).

Alkalinization

In Figure 8, molybdenum was opposed to the soil pH, illustrating a clear loss observed for the basic plots (≈400 g/ha), despite a diffuse input of Mo of about 170 g/ha by atmospheric deposition (Figure 6a). Actually, in neutral aerated soils, Mo is present in an anionic form (MoO4)2− whose mobility increases in alkaline soil conditions [45]. This finding demonstrates a distinct behavior of Mo with respect to the other trace elements studied here. Considering the input of Mo by atmospheric deposition (Table 2), its net loss reached −30 mg/m2 (Table 3). This finding is noteworthy, as it means that about 20% of the initial Mo stock has been lost by 85 years of liming practices.

4.2. Significance of Agronomic Experiments to Long-Term Soil Evolution Studies

Agronomic long-term experiments are of great interest for studies aiming at unraveling the physicochemical mechanisms of soil degradation and their consequences for declining sustainability of ecosystem quality and services. In the 42-plots trial, outstanding variable physicochemical and physical properties are observed today in the surface 0–25 cm horizon that relate the fascinating story of almost 90 years of application of fertilizers and amendments, or their absence. The changes of soil properties that have occurred since 1928 are due, in large part, to the cation composition of the soil exchange complex [53], i.e., the action of compensating cations in N, P, and K fertilizers (Na+ or H+) or Ca2+ in the basic amendments. Bivalent Ca2+ cations in soils favor the flocculation of electronegative colloids, enhancing aggregate stability [15], low bulk density (Figure 2d), and well-aerated hydrodynamic conditions. Exchangeable Na+ (and K+) is known to promote swelling of expendable clay minerals and clay dispersion [8]. When it exceeds 10 to 15% of the soil CEC (Figure 2b), Na+ may become toxic for plants and favors degradation of aggregate stability and soil compaction (Figure 2d), leading to temporary water stagnation and hydromorphic conditions [51]. High input of H+ (NH4+-based fertilizers) leads to strong soil acidification and the formation of hydrogen clay [54]. Such H+ clay is highly unstable and evolves rapidly into Al-saturated clay [55], explaining the presence of consistent amounts of exchangeable Al. In the presence of strong complexing organic agents that immobilize exchangeable Al, acidification leads to clay-mineral dissolution, as reported in podzol-B horizons [56,57]. Considering the low SOC content in soils of the 42-plots trial, strong complexing anions of ammonium fertilizers, such as (PO4)3− or (SO4)2−, may possibly play an Al-immobilizing role. Previous work on the impacts of 85 years of fertilization practices on pedological characteristics showed a large series of active soil processes: acidification, mineral dissolution, aluminization, neoformation of secondary phases, retrogression of phosphates or K via illitization of smectite, clay leaching, lixiviation, or temporary water logging [18]. In real field situations, study sites that offer such a wide panel of processes and physicochemical conditions united in a restricted area with initially identical soils are exceptional, if not nonexistent. Actually, due to continuous experimental constraints, the 42-plots experiment acts as a pedotron in real climatic conditions. Together with its historical soil archive, such a long-term bare fallow experiment enables access to synchronic and diachronic aspects of soil evolution on a centennial time scale.

5. Conclusions

In this work, the soils of the 42-plots LTBF tell fascinating stories about historical dynamics of major and trace elements and constraint by continuous application of fertilizers and amendments, or by their absence. Taking account of modified physical properties in the 0–25 cm surface horizon during the experiment, stocks of elements were calculated for 1929 and 2014 and budgets were established. The relevance of our computational approach was checked by the equivalent losses of scandium and clay in Na-based fertilized plots, under the hypothesis of a predominant location of Sc in phyllosilicate minerals in loess soil. The budgets demonstrated clear gains of elements by fertilizer inputs (notably P, K, Ca, Na, Cd, and U) or atmospheric deposition in the reference plots (Na, Cd, Co, Cr, Mo, Pb, and Zn). Additionally, the budgets gave insight into a series of diverging element losses controlled by different soil processes that were induced by changing physicochemical soil conditions over 85 years, which can be considered as a long-term time span in agronomic experimentation studies, but rather a short-term time span in soil development.
Clay leaching was strongly favored in Na- and K-based fertilizers and coincided with consistent losses of Al, Fe, Mg, Sc, Ni, Cr, Tl, and As. In the acidified soils under ammonium-based fertilization, large losses were observed for Ca, Mg, Mn, Co, and Ni, whereas under basic amendments with high soil pH, a clear loss of Mo was demonstrated. However, elements were sometimes affected by both inputs and losses, i.e., Cd inputs by phosphate fertilizers and atmospheric deposition and its lixiviation in acid soil conditions, but often the geochemical budgets provided insight into the main processes. Calculation of decreasing contents of total and exchangeable Ca gave evidence for enhanced mineral weathering in the acid and reference plots, probably of feldspars, whereas relative accumulations of Al, Fe, Sc, and Tl (and As) in the acid plots pointed to mineral weathering of phyllosilicate.
Presently, the 42-plots LTBF experiment shows a remarkable wide diversity of element dynamics in reaction to fertilization treatments. However, despite a strict and unchanged experimental plan, clear reactions were not found for all elements. For some elements, inputs may counterbalance losses. For elements such as Zn and Pb, the magnitude of inputs via atmospheric deposition masks their fate under the constraint of diverging physicochemical conditions. More comprehensive insight on element dynamics may be obtained from detailed study of samples from the historical soil archive, giving access to the chronology of geochemical changes of the soil surface.

Acknowledgments

The authors greatly acknowledge all people who were, since 1928, or are still today in charge of the maintenance and technical exploitation of the 42-plots experiment: application of fertilizers, soil digging, sample collection and preparation, removal of weeds, etc. Their conscientious efforts have made it possible to develop our geochemical budget approach and test its validity. Financial support came from INRA and from the Agence de l’Environnement et de la Maîtrise de l’Energie ADEME. R. Paradelo thanks the Spanish Ministry of Economy and Competitiveness (MINECO) for a Ramón y Cajal fellowship (RYC-2016-19286). We thank Sébastien Breuil for sample preparation and Christian Lelay for thin section preparation. We are grateful for two anonymous reviewers for their positive reactions to our work and helpful suggestions.

Author Contributions

Folkert van Oort conceived and designed the study; Folkert van Oort, Remigio Paradelo, Ghislaine Delarue, Nicolas Proix, Denis Baize and Fabrice Monna analyzed the experimental data; Nicolas Proix supervised the chemical analyses; Folkert van Oort wrote the paper with the help of Remigio Paradelo, Ghislaine Delarue, Nicolas Proix, Denis Baize and Fabrice Monna.

Conflicts of Interest

The authors declare no conflict of interest.

References

  1. Lal, R. Restoring Soil Quality to Mitigate Soil Degradation. Sustainability 2015, 7, 5875–5895. [Google Scholar] [CrossRef]
  2. Paradelo, R.; van Oort, F.; Chenu, C. Water-dispersible clay in bare fallow soils after 80 years of continuous fertilizers addition. Geoderma 2013, 200–201, 40–44. [Google Scholar] [CrossRef]
  3. Manlay, R.; Feller, C.; Swift, M. Historical evolution of soil organic matter concepts and their relationships with the fertility and sustainability of cropping systems. Agric. Ecosyst. Environ. 2007, 119, 217–233. [Google Scholar] [CrossRef]
  4. Rajan, K.; Natarajan, A.; Kumar, K.; Badrinath, M.; Gowda, R. Soil organic carbon—The most reliable indicator for monitoring land degradation by soil erosion. Curr. Sci. 2010, 99, 823–827. [Google Scholar]
  5. Reeves, D.W. The role of soil organic matter in maintaining soil quality in continuous cropping systems. Soil Tillage Res. 1997, 43, 131–167. [Google Scholar] [CrossRef]
  6. Balesdent, J.; Wagner, G.H.; Mariotti, A. Soil organic matter turnover in long-term field experiments as revealed by C-13 natural abundance. Soil Sci. Soc. Am. J. 1988, 52, 118–124. [Google Scholar] [CrossRef]
  7. Dixon, J.B.; Weed, S.B. Minerals in Soil Environments, 2nd ed.; SSSA Book Series 1; Soil Scientific Society American: Madison, WI, USA, 1989; ISBN 0-89118-787-1. [Google Scholar]
  8. Tessier, D. Behaviour and microstructure of clay minerals. Soil Colloids and Their Associations in Aggregates; De Boodt, M.F., Hayes, M.H.B., Herbillon, A., Eds.; Nato ASI Series B: Physics; Plenum Press: New York, NY, USA, 1990; Volume 215, pp. 387–415. ISBN 0-306-43419-9. [Google Scholar]
  9. Van Oort, F.; Thiry, M.; Foy, E.; Fujisaki, K.; Delarue, G.; Dairon, R.; Jongmans, A.G. Impacts of one century of wastewater discharge on soil transformation through ferrolysis and related metal pollutant distributions. Sci. Total Environ. 2017, 590–591, 1–13. [Google Scholar] [CrossRef] [PubMed]
  10. Burgevin, H.; Hénin, S. Dix années d’expériences sur l’action des engrais sur la composition et les propriétés d’un sol de limon. Ann. Agron. 1939, 9, 771–799. [Google Scholar]
  11. Barré, P.; Eglin, T.; Christensen, B.T.; Ciais, P.; Houot, S.; Kätterer, T.; van Oort, F.; Peylin, P.; Poulton, P.R.; Romanenkov, V.; et al. Quantifying and isolating stable carbon using long-term bare fallow experiments. Biogeosciences 2010, 7, 3839–3850. [Google Scholar] [CrossRef] [Green Version]
  12. Semlali, R.; Dessogne, J.; Monna, F.; Bolte, J.; Azimi, S.; Denaix, L.; Loubet, M.; van Oort, F. Modeling lead input and output in soils by using lead isotopic geochemistry. Environ. Sci. Technol. 2004, 38, 1513–1521. [Google Scholar] [CrossRef] [PubMed]
  13. Monna, F.; van Oort, F.; Hubert, P.; Dominik, J.; Bolte, J.; Loizeau, J.L.; Labanowski, J.; Lamri, J.; Petit, C.; Le Roux, G.; et al. Modelling of 137Cs migration in soils using an 80-years soil archive. Role of fertilizers and agricultural amendments. J. Environ. Radioact. 2009, 100, 9–16. [Google Scholar] [CrossRef] [PubMed]
  14. Barré, P.; Plante, A.F.; Cécillon, L.; Lutfalla, S.; Baudin, F.; Bernard, S.; Christensen, B.T.; Fernandez, J.M.; Houot, S.; Kätterer, T.; et al. The energetic and chemical signatures of persistent soil organic matter. Biogeochemistry 2016, 1–2, 1–12. [Google Scholar] [CrossRef]
  15. Paradelo, R.; van Oort, F.; Barré, P.; Billiou, D.; Chenu, C. Soil organic matter stabilization at the pluri-decadal scale: Insight from bare fallow soils with contrasting physicochemical properties and macrostructures. Geoderma 2016, 275, 48–54. [Google Scholar] [CrossRef]
  16. Haney, R.J. Are Fertilizers Punishing Our Soils? Yale School of Forestry & Environmental Studies: New Haven, CT, USA, 2017; Available online: http://e360.yale.edu/features/why-its-time-to-stop-punishing-our-soils-with-fertilizers-and-chemicals/ (accessed on 5 December 2017).
  17. IUSS Working Group WRB. World Reference Base for Soil Resources 2014, Update 2015. International soil Classification System for Naming Soils and Creating Legends for Soil Maps; World Soil Resources Reports No. 106; FAO: Rome, Italy, 2014; ISBN 978-92-5-108369-7. [Google Scholar]
  18. Van Oort, F.; Proix, N.; Paradelo, R.; Delarue, G.; Breuil, S.; Baize, D.; Richard, A. Dernières nouvelles de 42 vieilles parcelles. Indicateurs d’évolutions pédologiques infra-centenaires en Néoluvisol de lœss nu, sous contrainte d’applications continues de matières fertilisantes. Étude et Gestion des Sols 2016, 23, 143–162. [Google Scholar]
  19. Van Oort, F.; Paradelo, R.; Proix, N.; Breuil, S.; Delarue, G.; Trouvé, A.; Baize, D.; Monna, F.; Richard, A. Arsenic et Vieilles Parcelles. États et bilans géochimiques dans un Néoluvisol de lœss nu, avec ou sans apports de matières fertilisantes depuis 1928. Étude et Gestion des Sols 2017, 24, 99–126. [Google Scholar]
  20. AFNOR. Méthodes D’analyse Chimique. In Evaluation de la Qualité des Sols; Recueil Normes & Réglementation; AFNOR: Paris, France, 2004; Volume 1, pp. 401–409. ISBN 2.12.213151-9. [Google Scholar]
  21. Baize, D. Teneurs Totales en Eléments Traces Métalliques Dans les Sols (France); INRA: Paris, France, 1997; ISBN 2-7380-0747-3. [Google Scholar]
  22. Bresson, L.M.; Boiffin, J. Morphological characterization of soil crust development stages on an experimental field. Geoderma 1990, 47, 301–325. [Google Scholar] [CrossRef]
  23. Pernes-Debuyser, A.; Tessier, D. Soil physical properties affected by long-term fertilization. Eur. J. Soil Sci. 2004, 55, 505–512. [Google Scholar] [CrossRef]
  24. Doran, J.W.; Sarrantonio, M.; Liebig, M.A. Soil health and sustainability. Adv. Agron. 1996, 56, 1–54. [Google Scholar] [CrossRef]
  25. Ellert, B.H.; Bettany, J.R. Calculation of organic matter and nutrients stored in soils under contrasting management regimes. Can. J. Soil Sci. 1995, 75, 529–538. [Google Scholar] [CrossRef]
  26. Balabane, M.; Faivre, D.; van Oort, F.; Dahmani-Muller, H. Mutual effects of soil organic matter dynamics end heavy metals fate in a metallophyte grassland. Environ. Pollut. 1999, 105, 45–54. [Google Scholar] [CrossRef]
  27. Isambert, M. Etudes des Sols des Parcelles Expérimentales du CNRA Versailles, Parcelles des Closeaux; Internal Report; SESCPF: Orléans, France, 1979. [Google Scholar]
  28. Monni, C. Stabilisation Physique et Physico-Chimique de la Matière Organique dans les Horizons Profonds du Sol. Ph.D. Thesis, Université Pierre et Marie Curie, Paris, France, 2008. [Google Scholar]
  29. Horovitz, C.T.; Gschneidner, K.A., Jr.; Melson, G.A.; Youngblood, D.H.; Schock, H.H. Scandium. Its Occurrence, Chemistry, Physics, Metallurgy, Biology and Technology; Academic Press: London, UK, 1975; ISBN 978-0124125353. [Google Scholar]
  30. Mitchel, R.L. Trace Elements in Soils. Chemistry of the Soil, 2nd ed.; Bear, F.E., Ed.; Rheinholt: New York, NY, USA, 1964. [Google Scholar]
  31. Shotyk, W.; Weiss, D.; Kramers, J.; Frei, R.; Cherbukin, A.K.; Gloor, M.; Reese, S. Geochemistry of the peat bog at Étang de la Gruère, Jura Mountains, Switzerland, and its record of atmospheric Pb and lithogenic trace metals (Sc, Ti, Y, Zr, and REE) since 12 370 14C yr BP. Geochem. Cosmochim. Acta 2001, 65, 2337–2360. [Google Scholar] [CrossRef]
  32. Kabata Pendias, A. Trace Elements in Soils and Plants, 4th ed.; CRC Press: Boca Raton, FL, USA, 2010; ISBN 978-1-4200-9368-1. [Google Scholar]
  33. Pernes-Debuyser, A.; Tessier, D. Influence de matières fertilisantes sur les propriétés des sols : Cas des 42 parcelles de L’INRA à Versailles. Étude et Gestion des Sols 2002, 9, 177–186. [Google Scholar]
  34. Stoops, G.; Marcellino, V.; Mees, F. Interpretation of Micromorphological Features of Soils and Regoliths; Elsevier: Amsterdam, The Netherlands, 2010; 720p, ISBN 978-0-444-53156-8. [Google Scholar]
  35. Yunta, F.; Di Foggia, M.; Bellido-Díaz, V.; Morales-Calderón, M.; Tessarin, P.; López-Rayo, S.; Tinti, A.; Kovács, K.; Klencsár, Z.; Fodor, F.; et al. Blood meal-based compound. Good choice as iron fertilizer for organic farming. J. Agric. Food Chem. 2013, 61, 3995–4003. [Google Scholar] [CrossRef] [PubMed]
  36. Alloway, B.J. Heavy Metals in Soils, 3rd ed.; Springer: Dordrecht, The Netherlands, 2013; ISBN 9789400744691. [Google Scholar]
  37. Juste, C.; Tauzin, J. Evolution du contenu en métaux lourds d’un sol de limon maintenu en jachère nue après 56 années d’application continue de divers engrais et amendements. CR Acad. Agric. 1986, 72, 739–746. [Google Scholar]
  38. Ma, Y.; Hooda, P.S. Chromium, Nickel and Cobalt. In Trace Elements in Soils; Hooda, P.S., Ed.; Whiley: Chichester, UK, 2010; pp. 461–479. ISBN 978-1-405-16037-7. [Google Scholar]
  39. Van Leeuwen, E.P.; Draaijer, G.P.J.; Erisman, J.W. Mapping wet deposition of acidifying components and base cations over Europe using measurements. Atmos. Environ. 1996, 30, 2495–2511. [Google Scholar] [CrossRef]
  40. Belon, E.; Boisson, M.; Deportes, I.Z.; Eglin, T.K.; Feix, I.; Bispo, A.O.; Galsomies, L.; Leblond, S.; Guellier, C.R. An inventory of trace elements inputs to French agricultural soils. Sci. Total Environ. 2012, 439, 87–95. [Google Scholar] [CrossRef] [PubMed]
  41. Saby, N.; Arrouays, D.; Boulonne, L.; Jolivet, C.; Pochot, A. Geostatistical assessment of Pb in soil around Paris, France. Sci. Total Environ. 2006, 367, 212–221. [Google Scholar] [CrossRef] [PubMed]
  42. Rampazzo, G.; Innocente, E.; pecorari, E.; Squizzato, S.; Valotto, G. Potential harmful elements in the atmosphere. In PHE’s, Environment and Human Health; Bini, C., Bech, J., Eds.; Springer: Dordrecht, The Netherlands, 2014; pp. 1–36. ISBN 978-94-017-8964-6. [Google Scholar]
  43. Granier, L.; Chevreuil, M.; Carru, A.M.; Chesterikoff, A. Atmospheric fallout of organochlorines and heavy metals on the Paris area (France). Sci. Total Environ. 1992, 126, 165–172. [Google Scholar] [CrossRef]
  44. Azimi, S.; Ludwig, A.; Thévenot, D.R.; Colin, J.L. Trace metal determination in total atmospheric deposition in rural and urban areas. Sci. Total Environ. 2003, 308, 247–256. [Google Scholar] [CrossRef] [Green Version]
  45. Evans, L.J.; Barabash, S.J. Molybdenum, Silver, Thallium and Vanadium. In Trace Elements in Soils; Hooda, P.S., Ed.; Whiley: Chichester, UK, 2010; pp. 515–549. ISBN 978-1-405-16037-7. [Google Scholar]
  46. Tremel, A.; Masson, P.; Sterckeman, T.; Baize, D.; Mench, M. Thallium in French agrosystems. I. Thallium contents in arable soils. Environ. Pollut. 1997, 95, 293–302. [Google Scholar] [CrossRef]
  47. Punshon, T.; Jackson, B.P.; Meharg, A.A.; Warczak, T.; Scheckel, K.; Guerinot, M.L. Understanding arsenic dynamics in agronomic systems to predict and prevent uptake by crop plants. Sci. Total Environ. 2017, 581–582, 209–220. [Google Scholar] [CrossRef] [PubMed]
  48. Manning, B.A.; Goldberg, S. Adsorption and stability of arsenic(III) at the clay mineral-water interface. Environ. Sci. Technol. 1997, 31, 2005–2011. [Google Scholar] [CrossRef]
  49. Party, J.P.; Probst, A.; Dambrine, E.; Thomas, A.L. Critical loads of acidity to France: Sensitivity areas in the north-eastern France. Water Soil Air Pollut. 1995, 85, 2407–2412. [Google Scholar] [CrossRef]
  50. UNEP. Global Environment Outlook; GEO4; United Nations Environment Programme: Valetta, Malta, 2007; ISBN 978-92-807-2836-1. [Google Scholar]
  51. Van Breemen, N.; Buurman, P. Soil Formation; Springer: Dordrecht, The Netherlands, 2013; ISBN 978-1-4020-0718-7. [Google Scholar]
  52. Hardy, M.; Jamagne, M.; Elsass, F.; Robert, M.; Chesneau, D. Mineralogical development of the silt fractions of a Podzoluvisol on lœss in the ParisBasin (France). Eur. J. Soil Sci. 1999, 50, 443–456. [Google Scholar] [CrossRef]
  53. Bohn, H.L.; McNeal, B.L.; O’Connor, G.A. Soil Chemistry, 4th ed.; John Wiley & Sons: New York, NY, USA, 2015; ISBN 978-1118629253. [Google Scholar]
  54. Bolt, G.H.; Bruggenwert, M.G.M. Soil Chemistry. A. Basic Elements; Elsevier: Amsterdam, The Netherlands, 1978. [Google Scholar]
  55. Eeckman, J.P.; Laudelout, H. Chemical stability of hydrogen-montmorillonite suspensions. Colloid Polym. Sci. 1961, 178, 99–107. [Google Scholar] [CrossRef]
  56. Robert, M.; Razzaghe, M.H.; Ranger, J. Rôle du facteur biochimique dans la podzolisation. In Podzols et Podzolisation; Righi, D., Chauvel, A., Eds.; AFES-INRA: Paris, France, 1987; pp. 207–223. [Google Scholar]
  57. Robert, M.; Razzaghe, M.H.; Vicente, M.A.; Veneau, G. Rôle du facteur biochimique dans l’altération des minéraux silicatés. Science du Sol 1979, 2–3, 153–174. [Google Scholar]
Figure 1. Experimental design of the 42-plots trial, groups of selected plots with their color codes, and equivalent annual fertilizer input rates per hectare. White plots were not considered in this work.
Soilsystems 02 00023 g001
Figure 2. Effects of soil deepening or heightening (Δept) of the 0–25 cm layer due to changing bulk density caused by fertilizing treatments (Δep) and repetitive soil sampling (Δ’ep) since 1929. The manure treatment is added here to demonstrate the amplitude of soil height (modified after [19]).
Soilsystems 02 00023 g002
Figure 3. Linear correlation between clay (<2 µm fractions) and scandium in soils of the 42-plots experiment. (a) Soil concentrations of all plots (except manure plots); (b) scandium and clay budgets for the selected fertilizer groups.
Soilsystems 02 00023 g003
Figure 4. Remarkable physicochemical data in selected plots of the long-term bare fallow (LTBF) experiment: (a) soil pH; (b) proportion of exchangeable cations on cation exchange capacity (CEC); (c) clay content; (d) bulk density. The acid plots include ammonium sulfate, chloride, and nitrate; P–NH4: ammonium phosphate fertilization; reference L and reference R: mean data of four reference plots for the left and right blocks, respectively; sodic plots include NaNO3 and sylvinite treatments, potassic plots include KCl and K2SO4 treatments, basic plots include CaO and CaCO3 amendments. Data modified after [18].
Soilsystems 02 00023 g004
Figure 5. Element budgets between 2014 and 1929 in the 0–25 cm layer of fertilized plots. The color code is according to Figure 1. The gray-tone box represents the maximum (T+) and minimum (T) values of the 95% confidence interval of the element budget calculated in the reference plots: (a) manganese; (b) cobalt; (c) cadmium; (d) calcium; (e) magnesium; (f) nickel; (g) aluminum; (h) iron; (i) scandium; (j) arsenic; (k) thallium; (l) clay.
Soilsystems 02 00023 g005
Figure 6. Element budgets between 2014 and 1929 in the 0–25 cm layer of fertilized plots. The color code is according to Figure 1. The gray-tone box represents the maximum (T+) and minimum (T) values of the 95% confidence interval of the element budget calculated in the reference plots: (a) molybdenum; (b) lead; (c) zinc; (d) chrome; (e) copper; (f) potassium; (g) sodium; (h) phosphorus; (i) uranium.
Soilsystems 02 00023 g006
Figure 7. Concentration profiles and micromorphology images of subsurface horizons for selected fertilization treatments: P-9: nonamended reference; P-2: ammonium sulfate; P-14: ammonium phosphate; P-29: sylvinite; P-39 calcium carbonate. (a) pH (water); (b) clay content; (c) manganese; (d) nickel; (e) scandium concentration; (fh) microscopy photographs from the eluvial E horizon (30–45 cm); (f) dusty clay coating in the ammonium sulfate plot; (g) dusty clay coating in the reference plot; (h) layered clay and silt coatings in the sylvinite plot; (ik) images from the transition between the eluvial E to the illuvial Bt horizon (E/Bt) and upper Bt horizons (50–70 cm); (i) manganese-rich hypocoating at the surface of large pores; (j) dusty clay coating in the groundmass; (k) translucent clay coating in the sylvinite plot.
Soilsystems 02 00023 g007
Figure 8. Projection by principal component analysis (PCA) of 1929–2014 element and clay budgets and present soil pH for the 0–25 cm surface horizon of selected plots of the long-term bare fallow experiment.
Soilsystems 02 00023 g008
Table 1. Median values of major element stocks calculated for reference plots in 1929 and 2014; significance of differences estimated by paired Wilcoxon test at p <0.05; ** significant at 99%.
ElementPKCaMgNaAlFeMn
S1929 (g/m2)15642502069918176611,8235913114
S2014 (g/m2)1584248876862187712,0066091129
p-value0.640.15<0.01 **<0.01 **<0.01 **0.250.0550.31
B2014–1929 (kg/m2)−1.2−0.05+0.1
Table 2. Median values of trace element stocks calculated for reference plots in 1929 and 2014; significance of differences estimated by paired Wilcoxon test at p <0.05; ** significant at 99%.
ElementCuZnCoCrNiMoAsCdPbUTlSc
S1929 (mg/m2)653015,380206213,3125328161258339.516,7536151291781
S2014 (mg/m2)689520,437249218,3745285178253952.025,8565931281743
p-value0.31<0.01 **<0.01 **<0.01 **0.55<0.01 **0.31<0.01 **<0.01 **0.310.550.11
B2014−1929 (mg/m2)+5057+430+5026+17+12.5+9103
Table 3. Net element budget estimates in the 0–25 cm surface Ap horizons of fertilized plots. In case of significant element input by atmospheric deposition, gains and losses were calculated with respect to the T+ and T values of the 95% confidence interval of reference plots.
TreatmentnPKCaMgNaAlFeMnCuZn
g/m2mg/m2
acid4+30−1600−110-+420−65−2000
N–PH42+630−1500−250+550+370−60
dried blood2+25−1400−70+700+660−55
Na2−80−1300−200+110−1200−760
Na + K2+380−1300−160+90−400−500−1000−1000
K3+500−1500−110-−100
basic3+2500--
CoCrNiMoAsCdPbUTlSc
mg/m2
acid4−800−1350−45+30
N–PH42−700−2150+3.5+4200+12+90
dried blood2−600−900+330−35+5+70
Na2−1000−700−16−230
Na + K2−500−1200−280−6−230
K3−500−15−5 −100
basic3−70+330−35+7
Table 4. Inputs and losses of major and trace elements in the selected plots of the 42-plots experiment: sources and soil-driving processes.
Element Input SourcesMajor ElementsTrace Elements
ammonium phosphateP, NU, Cd, Tl, As
dried bloodN, FeTl, As
monovalentK, Na
basic amendmentsCaTl, Ni
atmospheric deposition (reference plots)NaPb, Zn, Cr, Co, Mo, Cd
Soil Processes Controlling Element Dynamics
clay leachingFe, Al, Ca, Mg, KSc, As, Tl, Ni, Cr, As
acid lixiviationCa, MgMn, Cd, Co, Zn, Ni
alkalinization Mo
mineral weathering (relative accumulation)Al, FeSc, Tl, As

