Point of Zero Charge: Role in Pyromorphite Formation and Bioaccessibility of Lead and Arsenic in Phosphate-Amended Soils


Abstract
:1. Introduction
2. Materials and Methods
2.1. Soil Characterization
2.2. Physicochemical Characterization
2.3. Batch Experiment Setup and Sample Collection
2.4. Assessment of Pb and As Bioaccessibility
2.5. Quality Assurance and Quality Control (QA/QC) Checks
2.6. XAS Data Collection and Analyses
2.7. Statistical Analysis
3. Results and Discussions
3.1. Effect of P-Amendment on Soil pH
3.2. Pre-Amendment XAS-Based Pb- and As-Mineralogy in Tested Soils
3.3. Effect of P-Amendment and Different pHs on Pb- and As-Chemistry in Tested Soils
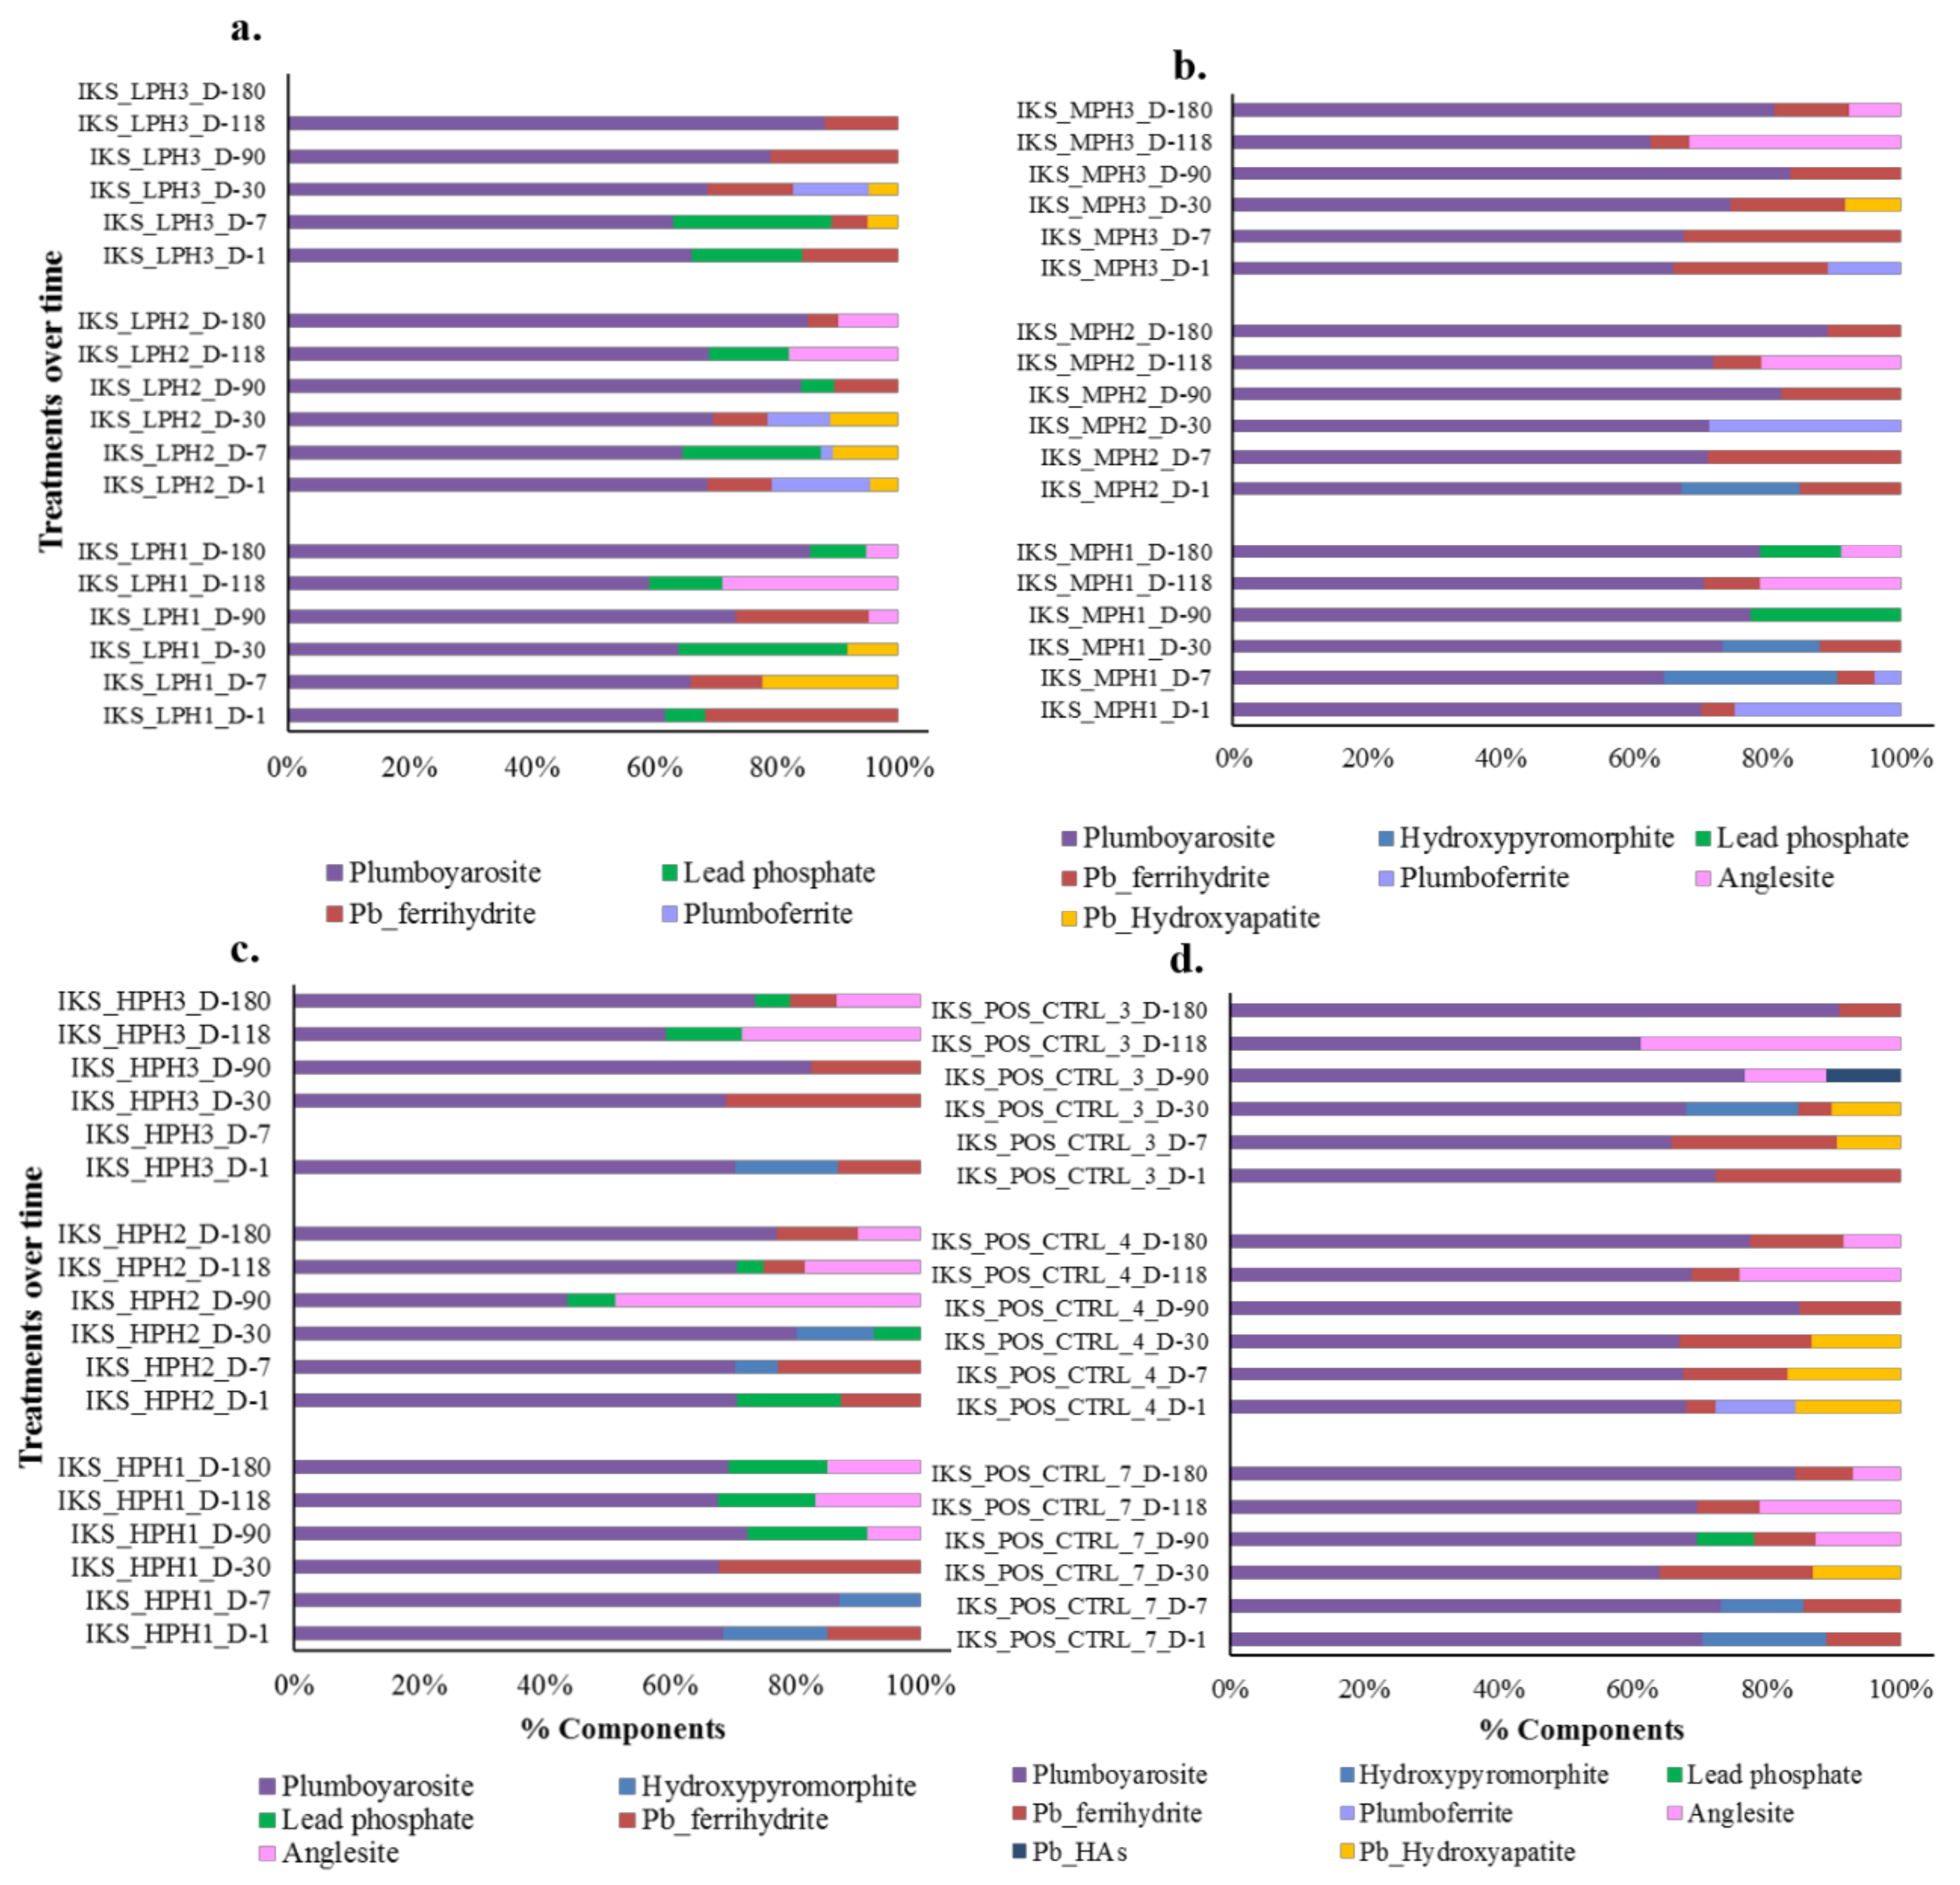
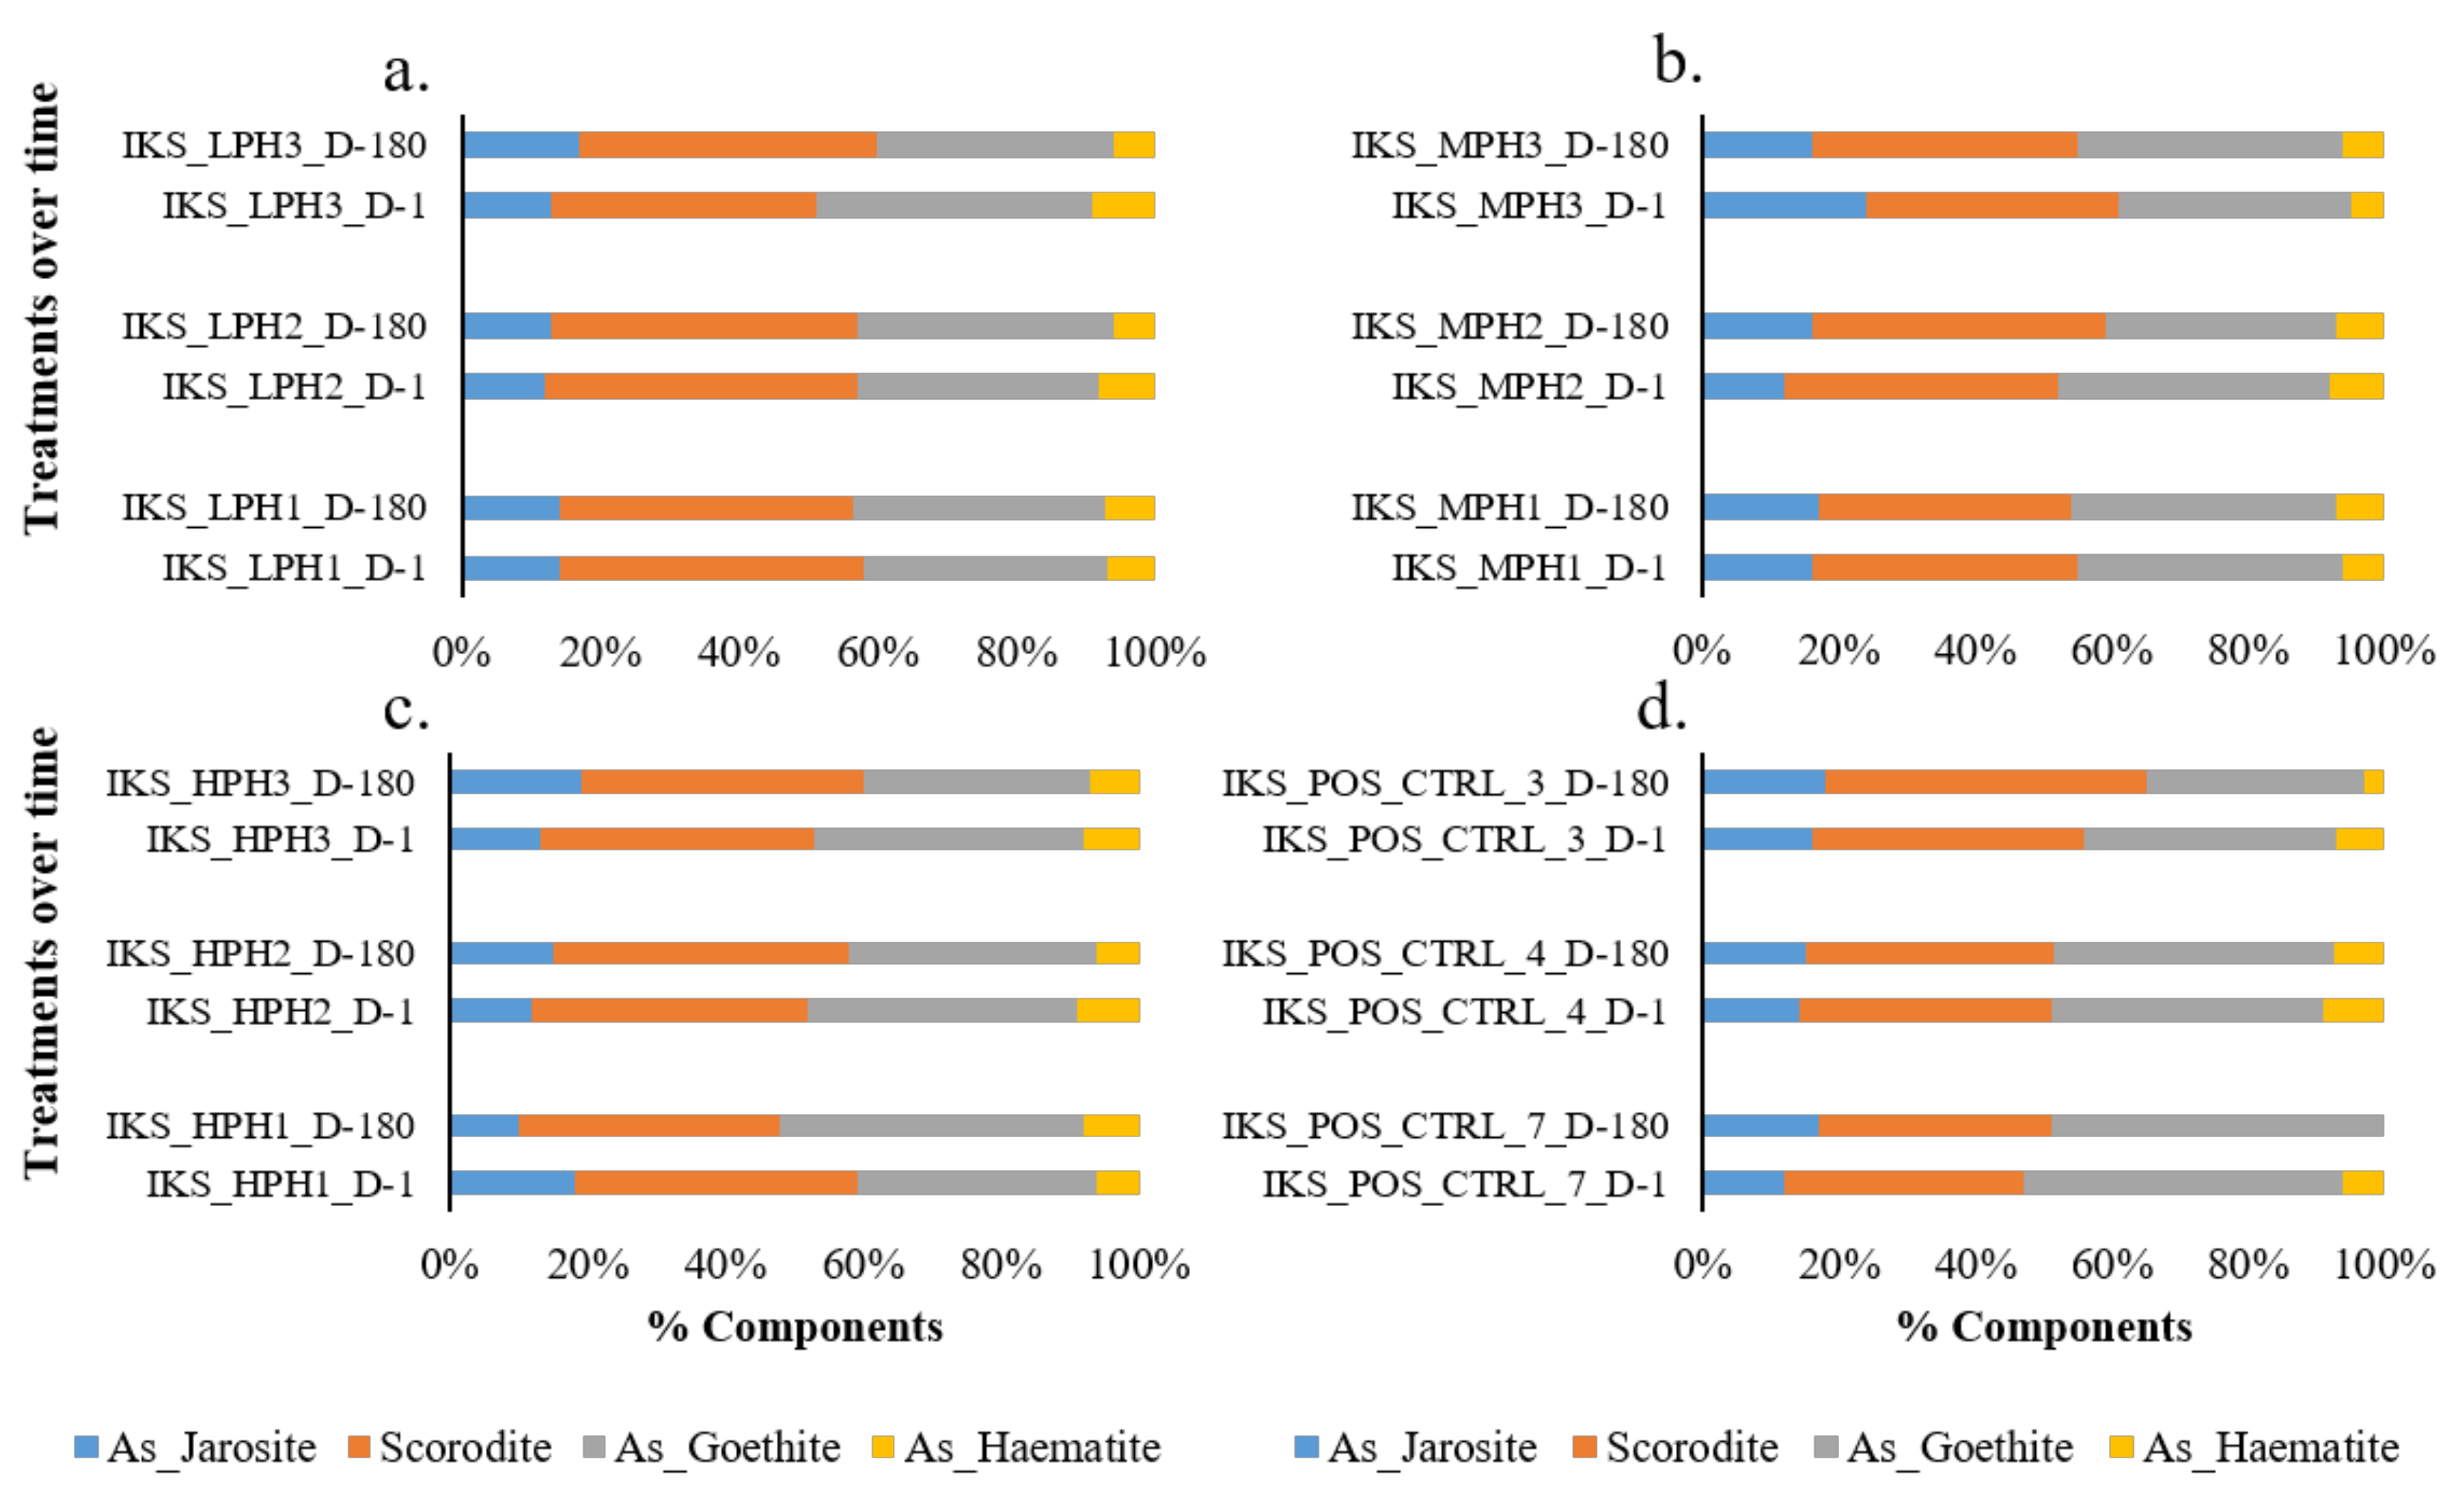
3.3.1. IKS (IKJ 583)
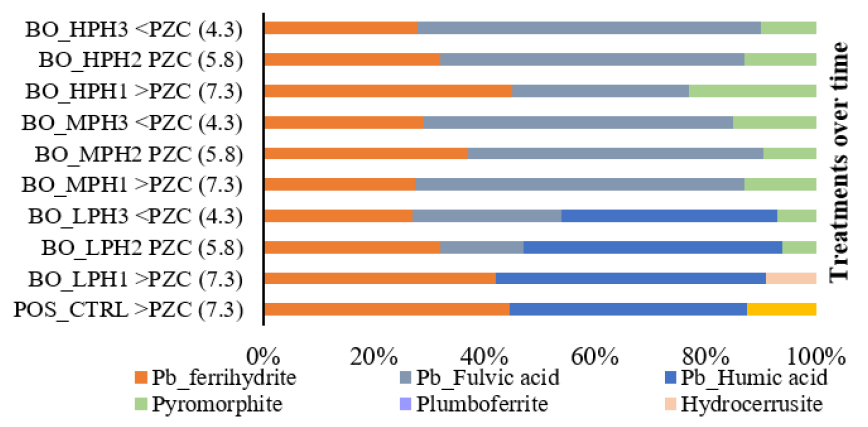
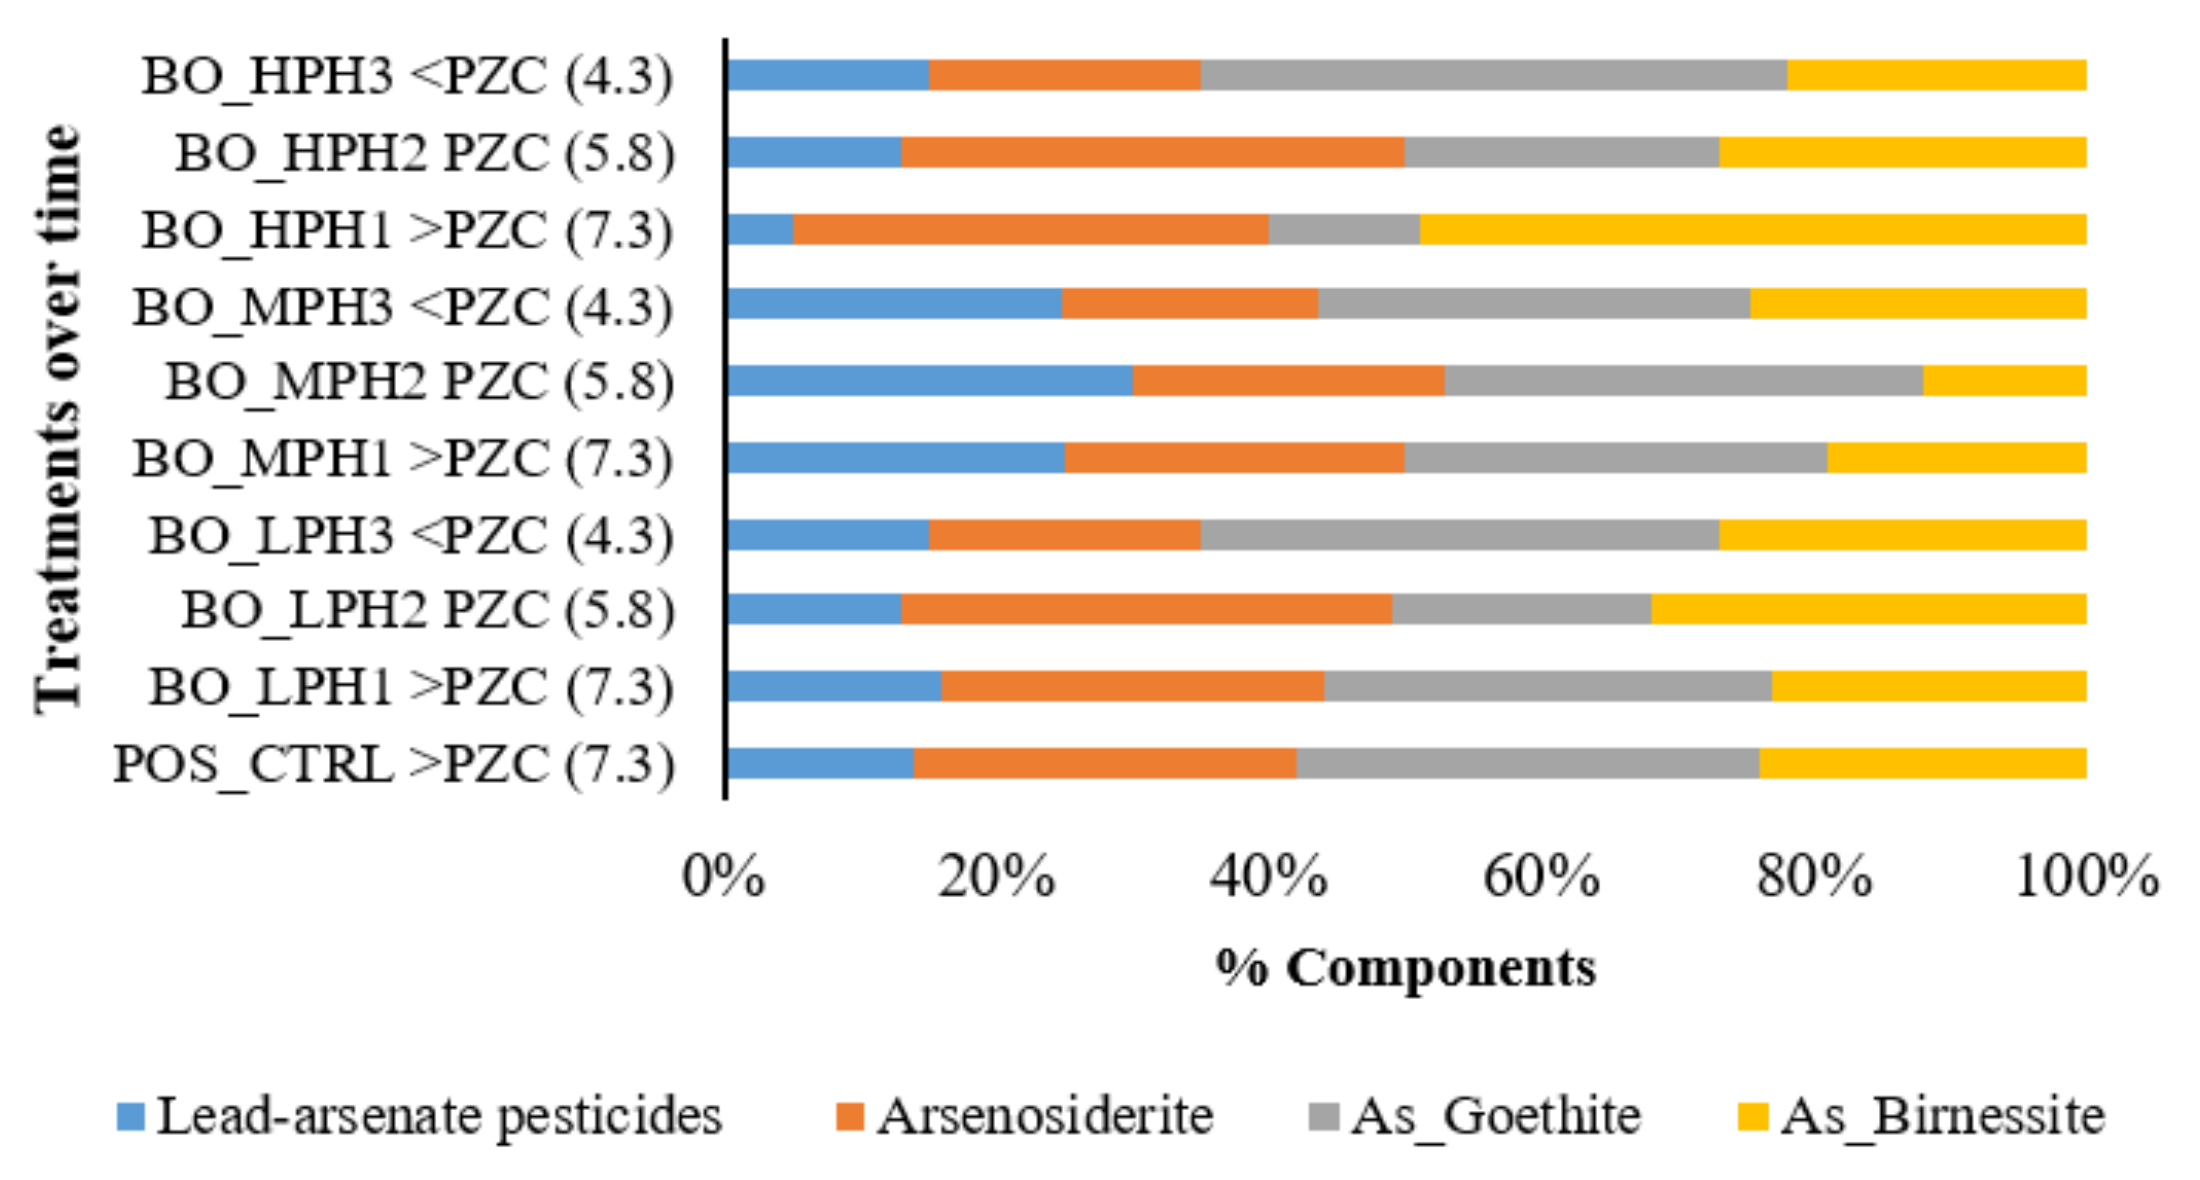
3.3.2. BO
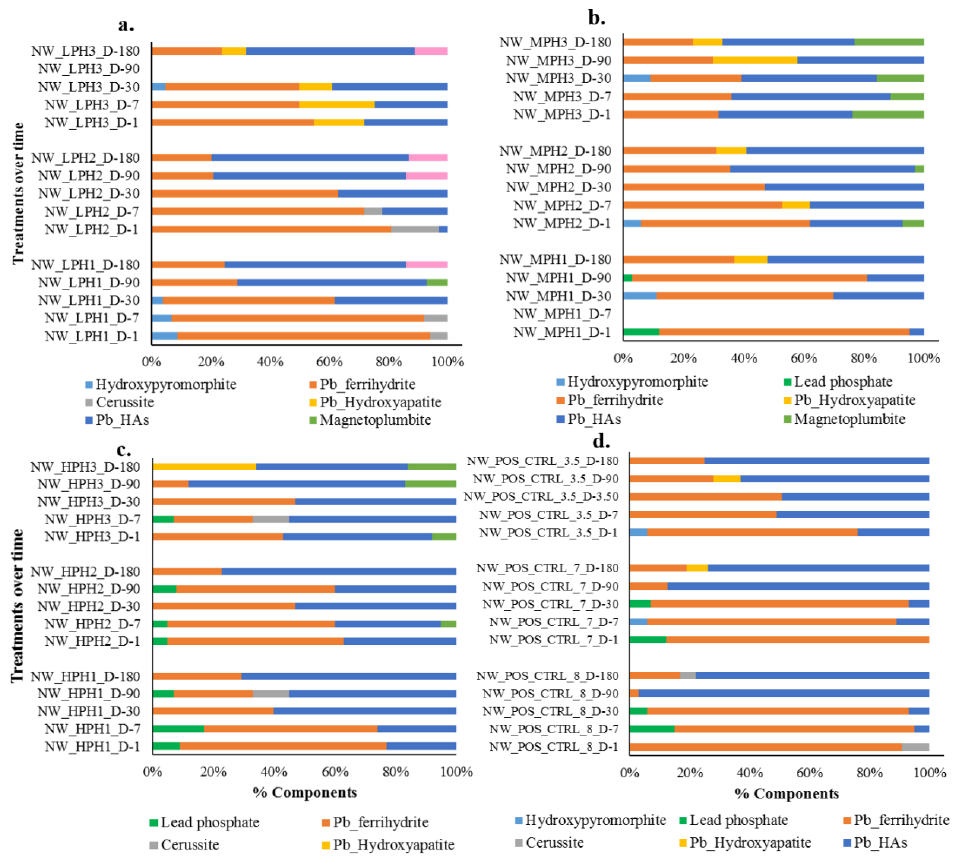
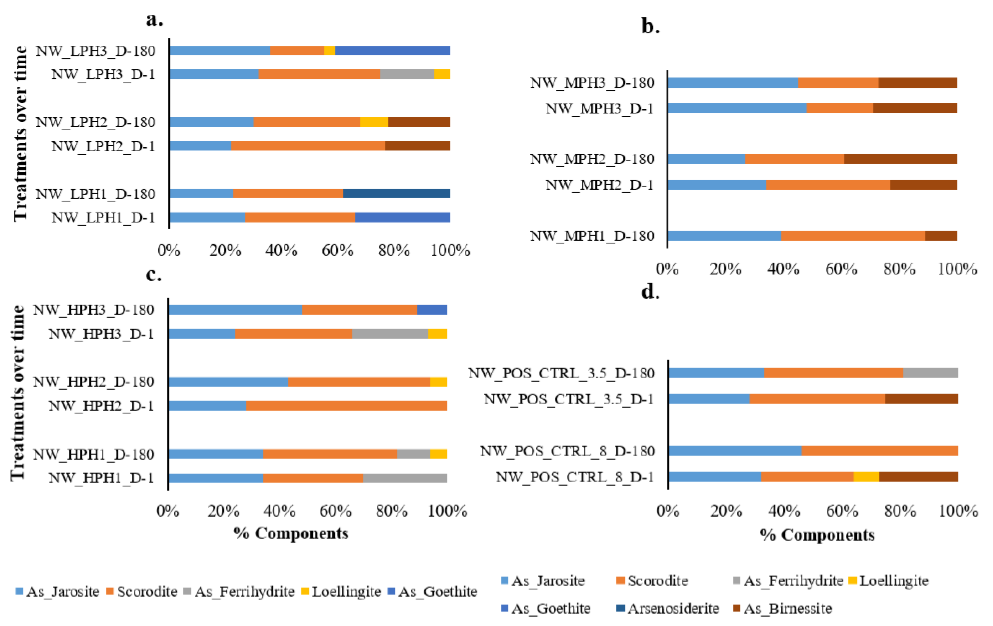
3.3.3. NW
4. Conclusions
Supplementary Materials
Acknowledgments
Author Contributions
Conflicts of Interest
References
- Hettiarachchi, G.M.; Pierzynski, G.M. Soil lead bioavailability and in situ remediation of lead-contaminated soils: A review. Environ. Prog. Sustain. Energy 2004, 23, 78–93. [Google Scholar] [CrossRef]
- Porter, S.K.; Scheckel, K.G.; Impellitteri, C.A.; Ryan, J.A. Toxic metals in the environment: Thermodynamic considerations for possible immobilization strategies for Pb, Cd, As, and Hg. Crit. Rev. Environ. Sci. Technol. 2004, 34, 495–604. [Google Scholar] [CrossRef]
- Scheckel, K.G.; Ryan, J.A. Spectroscopic speciation and quantification of lead in phosphate-amended soils. J. Environ. Qual. 2004, 33, 1288–1295. [Google Scholar] [CrossRef] [PubMed]
- US EPA. Q’s and A’s Fact Sheet on MTBE in Water; Office of Water: Washington, DC, USA, 1996.
- Cao, X.; Wahbi, A.; Ma, L.; Li, B.; Yang, Y. Immobilization of Zn, Cu, and Pb in contaminated soils using phosphate rock and phosphoric acid. J. Hazard. Mater. 2009, 164, 555–564. [Google Scholar] [CrossRef] [PubMed]
- Hettiarachchi, G.M.; Pierzynski, G.M.; Ransom, M.D. In situ stabilization of soil lead using phosphorus and manganese oxide. Environ. Sci. Technol. 2000, 34, 4614–4619. [Google Scholar] [CrossRef]
- Ma, Q.Y.; Traina, S.J.; Logan, T.J.; Ryan, J.A. In situ lead immobilization by apatite. Environ. Sci. Technol. 1993, 27, 1803–1810. [Google Scholar] [CrossRef]
- Nriagu, J.O. Lead orthophosphates—IV Formation and stability in the environment. Geochim. Cosmochim. Acta 1974, 38, 887–898. [Google Scholar] [CrossRef]
- Scheckel, K.G.; Diamond, G.L.; Burgess, M.F.; Klotzbach, J.M.; Maddaloni, M.; Miller, B.W.; Partridge, C.R.; Serda, S.M. Amending soils with phosphate as means to mitigate soil lead hazard: A critical review of the state of the science. J. Toxicol. Environ. Health 2013, 16, 337–380. [Google Scholar] [CrossRef] [PubMed]
- Chappell, M.A.; Scheckel, K.G. Pyromorphite formation and stability after quick lime neutralisation in the presence of soil and clay sorbents. Environ. Chem. 2007, 4, 109–113. [Google Scholar] [CrossRef]
- Zhang, P.; Ryan, J.A.; Yang, J. In vitro soil Pb solubility in the presence of hydroxyapatite. Environ. Sci. Technol. 1998, 32, 2763–2768. [Google Scholar] [CrossRef]
- Butkus, M.A.; Johnson, M.C. Reevaluation of phosphate as a means of retarding lead transport from sandy firing ranges. Soil Sediment Contam. 2011, 20, 172–187. [Google Scholar] [CrossRef]
- Debela, F.; Arocena, J.; Thring, R.; Whitcombe, T. Organic acid-induced release of lead from pyromorphite and its relevance to reclamation of Pb-contaminated soils. Chemosphere 2010, 80, 450–456. [Google Scholar] [CrossRef] [PubMed]
- Darland, J.E.; Inskeep, W.P. Effects of pH and phosphate competition on the transport of arsenate. J. Environ. Qual. 1997, 26, 1133–1139. [Google Scholar] [CrossRef]
- Peryea, F.; Kammereck, R. Phosphate-enhanced movement of arsenic out of lead arsenate-contaminated topsoil and through uncontaminated subsoil. Water Air Soil Pollut. 1997, 93, 243–254. [Google Scholar] [CrossRef]
- Brown, G.E., Jr.; Foster, A.L.; Ostergren, J.D. Mineral surfaces and bioavailability of heavy metals: A molecular-scale perspective. Proc. Natl. Acad. Sci. USA 1999, 96, 3388–3395. [Google Scholar] [CrossRef] [PubMed]
- Barrow, N.; Bowden, J. A comparison of models for describing the adsorption of anions A on a variable charge mineral surface. J. Colloid Interface Sci. 1987, 119, 236–250. [Google Scholar] [CrossRef]
- Lewis-Russ, A. Measurement of surface charge of inorganic geologic materials: Techniques and their consequences. Adv. Agron. 1991, 46, 199–243. [Google Scholar]
- Sposito, G. On points of zero charge. Environ. Sci. Technol. 1998, 32, 2815–2819. [Google Scholar] [CrossRef]
- Casteel, S.W.; Weis, C.P.; Henningsen, G.M.; Brattin, W.J. Estimation of relative bioavailability of lead in soil and soil-like materials using young Swine. Environ. Health Perspect. 2006, 114, 1162–1171. [Google Scholar] [CrossRef] [PubMed]
- Scheckel, K.G.; Chaney, R.L.; Basta, N.T.; Ryan, J.A. Advances in assessing bioavailability of metal (loid) s in contaminated soils. Adv. Agron. 2009, 104, 1–52. [Google Scholar]
- Isaure, M.; Laboudigue, A.; Manceau, A.; Sarret, G.; Tiffreau, C.; Trocellier, P.; Lamble, G.; Hazemann, J.; Chateigner, D. Quantitative Zn speciation in a contaminated dredged sediment by μ-PIXE, μ-SXRF, EXAFS spectroscopy and principal component analysis. Geochim. Cosmochim. Acta 2002, 66, 1549–1567. [Google Scholar] [CrossRef]
- Karna, R.R.; Hettiarachchi, G.M.; Newville, M.; Sun, C.; Ma, Q. Synchrotron-based X-ray spectroscopy studies for redox-based remediation of lead, zinc, and cadmium in mine waste materials. J. Environ. Qual. 2016, 45, 1883–1893. [Google Scholar] [CrossRef] [PubMed]
- Nachtegaal, M.; Marcus, M.; Sonke, J.; Vangronsveld, J.; Livi, K.; van Der Lelie, D.; Sparks, D. Effects of in situ remediation on the speciation and bioavailability of zinc in a smelter contaminated soil. Geochim. Cosmochim. Acta 2005, 69, 4649–4664. [Google Scholar] [CrossRef]
- Roberts, D.R.; Scheinost, A.; Sparks, D. Zinc speciation in a smelter-contaminated soil profile using bulk and microspectroscopic techniques. Environ. Sci. Technol. 2002, 36, 1742–1750. [Google Scholar] [CrossRef] [PubMed]
- Karna, R.R.; Noerpel, M.; Betts, A.R.; Scheckel, K.G. Lead and Arsenic Bioaccessibility and Speciation as a Function of Soil Particle Size. J. Environ. Qual. 2017, 46, 1225–1235. [Google Scholar] [CrossRef] [PubMed]
- Schumacher, B.; Shines, K.; Burton, J.; Papp, M. Comparison of three methods for soil homogenization. Soil Sci. Soc. Am. J. 1990, 54, 1187–1190. [Google Scholar] [CrossRef]
- US EPA. Method 3051a: Microwave Assisted Acid Dissolution of Sediments, Sludges, Soils, and Oils, 2nd ed.; US Government Print Office: Washington, DC, USA, 1997.
- Sparks, D.L.; Fendorf, S.E.; Toner, C.V.; Carski, T.H. Kinetic Methods and Measurements; Soil Science Society of America, American Society of Agronomy: Madison, WI, USA, 1996. [Google Scholar]
- Geebelen, W.; Adriano, D.; van der Lelie, D.; Mench, M.; Carleer, R.; Clijsters, H.; Vangronsveld, J. Selected bioavailability assays to test the efficacy of amendment-induced immobilization of lead in soils. Plant Soil 2003, 249, 217–228. [Google Scholar] [CrossRef]
- Juhasz, A.L.; Scheckel, K.G.; Betts, A.R.; Smith, E. Predictive capabilities of in vitro assays for estimating Pb relative bioavailability in phosphate amended soils. Environ. Sci. Technol. 2016, 50, 13086–13094. [Google Scholar] [CrossRef] [PubMed]
- Segre, C.; Leyarovska, N.; Chapman, L.; Lavender, W.; Plag, P.; King, A.; Kropf, A.; Bunker, B.; Kemner, K.; Dutta, P. The MRCAT insertion device beamline at the advanced photon source. In Proceedings of the Eleventh US National Conference Synchrotron Radiation Instrumentation, Stanford, CA, USA, 13–15 October 1999. [Google Scholar]
- Kropf, A.; Katsoudas, J.; Chattopadhyay, S.; Shibata, T.; Lang, E.; Zyryanov, V.; Ravel, B.; McIvor, K.; Kemner, K.; Scheckel, K. The new MRCAT (Sector 10) bending magnet beamline at the advanced photon source. In Proceedings of the 10th International Conference on Radiation Instrumentation, Melbourne, Australia, 27 September–2 October 2009. [Google Scholar]
- Davis, A.; Drexler, J.W.; Ruby, M.V.; Nicholson, A. Micromineralogy of mine wastes in relation to lead bioavailability, Butte, Montana. Environ. Sci. Technol. 1993, 27, 1415–1425. [Google Scholar] [CrossRef]
- Alpers, C.N.; Rye, R.O.; Nordstrom, D.K.; White, L.D.; King, B. Chemical, crystallographic and stable isotopic properties of Alunite and Jarosite from acid—Hypersaline Australian lakes. Chem. Geol. 1992, 96, 203–226. [Google Scholar] [CrossRef]
- Bigham, J.; Schwertmann, U.; Traina, S.; Winland, R.; Wolf, M. Schwertmannite and the chemical modeling of iron in acid sulfate waters. Geochim. Cosmochim. Acta 1996, 60, 2111–2121. [Google Scholar] [CrossRef]
- Bothe, J.V.; Brown, P.W. Arsenic immobilization by calcium arsenate formation. Environ. Sci. Technol. 1999, 33, 3806–3811. [Google Scholar] [CrossRef]
- Hongshao, Z.; Stanforth, R. Competitive adsorption of phosphate and arsenate on goethite. Environ. Sci. Technol. 2001, 35, 4753–4757. [Google Scholar] [CrossRef] [PubMed]
- Jackson, B.P.; Miller, W. Effectiveness of phosphate and hydroxide for desorption of arsenic and selenium species from iron oxides. Soil Sci. Soc. Am. J. 2000, 64, 1616–1622. [Google Scholar] [CrossRef]
- Manning, B.A.; Goldberg, S. Modeling competitive adsorption of arsenate with phosphate and molybdate on oxide minerals. Soil Sci. Soc. Am. J. 1996, 60, 121–131. [Google Scholar] [CrossRef]
- Lindsay, W.L. Chemical Equilibria in Soils; John Wiley and Sons Ltd.: Hoboken, NJ, USA, 1979. [Google Scholar]
- Zhang, J.; Stanforth, R. Slow adsorption reaction between arsenic species and goethite (α-FeOOH): Diffusion or heterogeneous surface reaction control. Langmuir 2005, 21, 2895–2901. [Google Scholar] [CrossRef] [PubMed]
- Zhang, P.; Ryan, J.A. Formation of chloropyromorphite from galena (PbS) in the presence of hydroxyapatite. Environ. Sci. Technol. 1999, 33, 618–624. [Google Scholar] [CrossRef]
- Burton, E.D.; Bush, R.T.; Sullivan, L.A.; Johnston, S.G.; Hocking, R.K. Mobility of arsenic and selected metals during re-flooding of iron-and organic-rich acid-sulfate soil. Chem. Geol. 2008, 253, 64–73. [Google Scholar] [CrossRef]
- Garelick, H.; Jones, H.; Dybowska, A.; Valsami-Jones, E. Arsenic pollution sources. Rev. Environ. Contam. Toxicol. 2008, 197, 17–60. [Google Scholar] [PubMed]
- Hansel, C.M.; Benner, S.G.; Fendorf, S. Competing Fe (II)-induced mineralization pathways of ferrihydrite. Environ. Sci. Technol. 2005, 39, 7147–7153. [Google Scholar] [CrossRef] [PubMed]
- Burton, E.D.; Johnston, S.G.; Planer-Friedrich, B. Coupling of arsenic mobility to sulfur transformations during microbial sulfate reduction in the presence and absence of humic acid. Chem. Geol. 2013, 343, 12–24. [Google Scholar] [CrossRef]
- Strawn, D.G.; Sparks, D.L. Effects of soil organic matter on the kinetics and mechanisms of Pb (II) sorption and desorption in soil. Soil Sci. Soc. Am. J. 2000, 64, 144–156. [Google Scholar] [CrossRef]
- Kaštelan-Macan, M.; Petrovic, M. Competitive sorption of phosphate and marine humic substances on suspended particulate matter. Water Sci. Technol. 1995, 32, 349–355. [Google Scholar]
- Zhou, S.; Song, Z.; Xu, M.; Chen, S. Effect of phosphate addition on mobility and phytoavailability of heavy metals in soils. In Phosphate in Soils: Interaction with Micronutrients. Radionuclides and Heavy Metals; CRC Press: Boca Raton, FL, USA, 2015; pp. 203–235. [Google Scholar]
- Beak, D.G.; Basta, N.T.; Scheckel, K.G.; Traina, S.J. Bioaccessibility of lead sequestered to corundum and ferrihydrite in a simulated gastrointestinal system. J. Environ. Qual. 2006, 35, 2075–2083. [Google Scholar] [CrossRef] [PubMed]
- Beak, D.G.; Basta, N.T.; Scheckel, K.G.; Traina, S.J. Linking solid phase speciation of Pb sequestered to birnessite to oral Pb bioaccessibility: Implications for soil remediation. Environ. Sci. Technol. 2007, 42, 779–785. [Google Scholar] [CrossRef]
- Smith, E.; Weber, J.; Naidu, R.; McLaren, R.G.; Juhasz, A.L. Assessment of lead bioaccessibility in peri-urban contaminated soils. J. Hazard. Mater. 2011, 186, 300–305. [Google Scholar] [CrossRef] [PubMed]
- Ying, S.C.; Kocar, B.D.; Fendorf, S. Oxidation and competitive retention of arsenic between iron-and manganese oxides. Geochim. Cosmochim. Acta 2012, 96, 294–303. [Google Scholar] [CrossRef]
- Paktunc, D.; Majzlan, J.; Huang, A.; Thibault, Y.; Johnson, M.B.; White, M.A. Synthesis, characterization, and thermodynamics of arsenates forming in the Ca-Fe (III)-As (V)-NO3 system: Implications for the stability of Ca-Fe arsenates. Am. Mineral. 2015, 100, 1803–1820. [Google Scholar] [CrossRef]
- Smedley, P.; Kinniburgh, D. A review of the source, behaviour and distribution of arsenic in natural waters. Appl. Geochem. 2002, 17, 517–568. [Google Scholar] [CrossRef]
- Stollenwerk, K. Geochemical processes controlling transport of arsenic in groundwater: A review of adsorption. In Arsenic Ground Water; Springer: Boston, MA, USA, 2003; pp. 67–100. [Google Scholar]
- Pierce, M.L.; Moore, C.B. Adsorption of Arsenite and Arsenate on Amorphous Iron Hydroxide. Water Res. 1982, 16, 1247–1253. [Google Scholar] [CrossRef]
- Wang, S.; Terdkiatburana, T.; Tadé, M. Adsorption of Cu (II), Pb (II) and humic acid on natural zeolite tuff in single and binary systems. Sep. Purif. Technol. 2008, 62, 64–70. [Google Scholar] [CrossRef]
- Baron, D.; Palmer, C.D. Solid-solution aqueous-solution reactions between jarosite (KFe3 (SO4)2 (OH)6) and its chromate analog. Geochim. Cosmochim. Acta 2002, 66, 2841–2853. [Google Scholar] [CrossRef]
- Kendall, M.R.; Madden, A.S.; Madden, M.E.E.; Hu, Q. Effects of arsenic incorporation on Jarosite dissolution rates and reaction products. Geochim. Cosmochim. Acta 2013, 112, 192–207. [Google Scholar] [CrossRef]


| Soil Label | IKS | NW | BO |
|---|---|---|---|
| Source | Mining Slag | Smelter Impacted | Pesticide Spray Lead Arsenate |
| (mg kg−1) | (mg kg−1) | (mg kg−1) | |
| Al | 11,378 | 15,653 | 42,342 |
| As | 3958 | 19 | 308 |
| Ca | 26,648 | 14,453 | 5275 |
| Cd | 9 | 6 | 0.1 |
| Co | 10 | 10 | 19 |
| Cr | <DL | 26 | 106 |
| Cu | 327 | 513 | 212 |
| Fe | 138,400 | 25,010 | 38,874 |
| Mg | 9074 | 3431 | 11,405 |
| Mn | 408 | 517 | 1590 |
| P | 952 | 1354 | 1472 |
| Pb | 2462 | 1730 | 2065 |
| Zn | 4195 | 2141 | 180 |
| S | 85,864 | 1582 | 858 |
| Lead | pH 1.5 | pH 2.5 | ||||||||||
|---|---|---|---|---|---|---|---|---|---|---|---|---|
| Day 1 | Day 7 | Day 30 | Day 90 | Day 118 | Day 180 | Day 1 | Day 7 | Day 30 | Day 90 | Day 118 | Day 180 | |
| Treatment | TER | TER | TER | TER | TER | TER | TER | TER | TER | TER | TER | TER |
| IKS_LPH1 > PZC (7.0) | 0.34 | 0.29 | 0.39 | 0.49 | 0.57 | 0.71 | 0.17 | 0.21 | 0.25 | 0.35 | 0.34 | 0.37 |
| IKS_LPH2 PZC (4.0) | 0.72 | 0.79 | 0.97 | 2.38 | 2.26 | 0.99 | 0.44 | 0.49 | 0.68 | 0.69 | 1.76 | 0.53 |
| IKS_LPH3 < PZC (3.0) | 0.86 | 2.17 | 1.96 | 1.55 | 1.46 | 1.13 | 0.65 | 0.59 | 1.75 | 0.7 | 1.69 | 0.41 |
| IKS_MPH1 > PZC (7.0) | 0.35 | 0.34 | 0.38 | 0.41 | 0.41 | 0.72 | 0.17 | 0.19 | 0.18 | 0.16 | 0.16 | 0.48 |
| IKS_MPH2 PZC (4.0) | 0.91 | 0.94 | 1.08 | 2.15 | 2.66 | 1.58 | 0.58 | 0.76 | 0.62 | 1.39 | 2.26 | 0.53 |
| IKS_MPH3 < PZC (3.0) | 1.04 | 2.63 | 2.25 | 1.74 | 1.65 | 2.00 | 1.00 | 0.94 | 1.74 | 1.48 | 1.5 | 1.14 |
| IKS_HPH1 > PZC (7.0) | 0.38 | 0.40 | 0.37 | 0.39 | 0.40 | 0.56 | 0.17 | 0.21 | 0.23 | 0.24 | 0.19 | 0.52 |
| IKS_HPH2 PZC (4.0) | 1.05 | 1.04 | 1.19 | 2.66 | 2.49 | 1.74 | 0.60 | 0.75 | 0.46 | 1.02 | 1.44 | 0.85 |
| IKS_HPH3 < PZC (3.0) | 1.16 | 3.28 | 2.11 | 3.60 | 1.82 | 1.80 | 1.06 | 0.74 | 1.53 | 2.46 | 1.82 | 0.46 |
| Arsenic | pH 1.5 | pH 2.5 | ||||||||||
| Day 1 | Day 7 | Day 30 | Day 90 | Day 118 | Day 180 | Day 1 | Day 7 | Day 30 | Day 90 | Day 118 | Day 180 | |
| Treatment | TER | TER | TER | TER | TER | TER | TER | TER | TER | TER | TER | TER |
| IKS_LPH1 > PZC (7.0) | 1.51 | 1.65 | 1.80 | 1.58 | 1.84 | 2.07 | 3.68 | 4.53 | 4.93 | 2.86 | 3.95 | 4.65 |
| IKS_LPH2 PZC (4.0) | 1.14 | 1.25 | 1.50 | 1.14 | 1.34 | 1.57 | 2.22 | 2.48 | 2.88 | 1.73 | 2.99 | 2.48 |
| IKS_LPH3 < PZC (3.0) | 0.93 | 0.91 | 1.08 | 1.10 | 1.13 | 1.35 | 2.01 | 2.09 | 2.18 | 1.94 | 2.20 | 2.01 |
| IKS_MPH1 > PZC (7.0) | 0.70 | 1.98 | 2.45 | 1.84 | 1.34 | 2.28 | 5.34 | 7.92 | 10.89 | 5.19 | 8.29 | 8.01 |
| IKS_MPH2 PZC (4.0) | 0.93 | 0.93 | 0.94 | 0.50 | 1.04 | 0.95 | 1.53 | 1.42 | 1.30 | 1.06 | 1.73 | 1.23 |
| IKS_MPH3 < PZC (3.0) | 0.75 | 0.64 | 0.57 | 0.60 | 0.63 | 0.62 | 0.93 | 1.11 | 0.86 | 0.79 | 0.94 | 0.85 |
| IKS_HPH1 > PZC (7.0) | 1.52 | 1.79 | 2.22 | 1.83 | 2.16 | 2.31 | 4.94 | 7.14 | 9.66 | 5.09 | 7.50 | 8.55 |
| IKS_HPH2 PZC (4.0) | 0.81 | 0.80 | 0.69 | 0.79 | 0.74 | 0.69 | 2.01 | 1.13 | 0.86 | 0.76 | 1.22 | 0.89 |
| IKS_HPH3 < PZC (3.0) | 0.68 | 0.55 | 0.41 | 0.46 | 0.46 | 0.41 | 1.35 | 0.84 | 0.56 | 0.58 | 0.73 | 0.68 |
| Lead | pH 1.5 | pH 2.5 |
|---|---|---|
| Day 37 | ||
| Treatment | TER | TER |
| BO_LPH1 > PZC (7.3) | 0.79 | 0.75 |
| BO_LPH2 PZC (5.8) | 0.79 | 0.75 |
| BO_LPH3 < PZC (4.3) | 0.77 | 0.71 |
| BO_MPH1 > PZC (7.3) | 0.77 | 0.72 |
| BO_MPH2 PZC (5.8) | 0.65 | 0.60 |
| BO_MPH3 < PZC (4.3) | 0.83 | 0.69 |
| BO_HPH1 > PZC (7.3) | 0.78 | 0.71 |
| BO_HPH2 PZC (5.8) | 0.66 | 0.60 |
| BO_HPH3 < PZC (4.3) | 0.82 | 0.53 |
| Arsenic | ||
| BO_LPH1 > PZC (7.3) | 1.12 | 1.12 |
| BO_LPH2 PZC (5.8) | 1.35 | 1.53 |
| BO_LPH3 < PZC (4.3) | 0.86 | 0.82 |
| BO_MPH1 > PZC (7.3) | 0.96 | 0.87 |
| BO_MPH2 PZC (5.8) | 1.11 | 1.12 |
| BO_MPH3 < PZC (4.3) | 0.72 | 0.60 |
| BO_HPH1 > PZC (7.3) | 0.90 | 0.75 |
| BO_HPH2 PZC (5.8) | 0.94 | 0.84 |
| BO_HPH3 < PZC (4.3) | 0.69 | 0.42 |
| Lead | pH 1.5 | pH 2.5 | ||||||||
|---|---|---|---|---|---|---|---|---|---|---|
| Day 1 | Day 7 | Day 30 | Day 90 | Day 180 | Day 1 | Day 7 | Day 30 | Day 90 | Day 180 | |
| NW_LPH1 > PZC (8.0) | 1.01 | 0.93 | 0.91 | 0.96 | 0.97 | 0.91 | 0.89 | 0.97 | 0.92 | 1.00 |
| NW_LPH2 PZC (7.0) | 1.02 | 0.92 | 0.89 | 0.92 | 0.99 | 0.95 | 0.85 | 0.89 | 0.84 | 0.95 |
| NW_LPH3 < PZC (3.5) | 0.95 | 0.91 | 1.11 | 1.17 | 1.19 | 0.97 | 1.05 | 1.10 | 1.24 | 1.33 |
| NW_MPH1 > PZC (8.0) | 0.94 | 0.90 | 0.86 | 0.93 | 0.97 | 0.71 | 0.70 | 0.80 | 0.74 | 0.81 |
| NW_MPH2 PZC (7.0) | 0.98 | 0.88 | 0.85 | 0.89 | 0.93 | 0.75 | 0.63 | 0.72 | 0.66 | 0.79 |
| NW_MPH3 < PZC (3.5) | 0.94 | 0.95 | 1.12 | 1.14 | 1.22 | 0.98 | 1.00 | 1.05 | 1.08 | 1.21 |
| NW_HPH1 > PZC (8.0) | 0.94 | 0.93 | 0.85 | 0.88 | 0.93 | 0.69 | 0.67 | 0.75 | 0.64 | 0.69 |
| NW_HPH2 PZC (7.0) | 0.97 | 0.86 | 0.86 | 0.84 | 0.93 | 0.67 | 0.59 | 0.67 | 0.64 | 0.69 |
| NW_HPH3 < PZC (3.5) | 0.96 | 0.93 | 1.12 | 1.09 | 1.11 | 0.93 | 0.95 | 0.94 | 0.95 | 1.07 |
| Arsenic | pH 1.5 | pH 2.5 | ||||||||
| Day 1 | Day 7 | Day 30 | Day 90 | Day 180 | Day 1 | Day 7 | Day 30 | Day 90 | Day 180 | |
| Treatment | TER | TER | TER | TER | TER | TER | TER | TER | TER | TER |
| NW_LPH1 > PZC (8.0) | 1.16 | 1.06 | 1.11 | 1.15 | 1.18 | 1.09 | 1.09 | 1.21 | 1.27 | 1.22 |
| NW_LPH2 PZC (7.0) | 1.09 | 1.02 | 0.97 | 1.03 | 1.55 | 1.12 | 1.05 | 1.14 | 1.05 | 1.01 |
| NW_LPH3 < PZC (3.5) | 0.88 | 0.84 | 0.98 | 1.00 | 1.06 | 0.91 | 0.95 | 0.86 | 1.04 | 1.08 |
| NW_MPH1 > PZC (8.0) | 1.04 | 1.04 | 1.03 | 1.23 | 1.13 | 0.95 | 1.01 | 1.09 | 1.28 | 1.19 |
| NW_MPH2 PZC (7.0) | 0.92 | 0.92 | 0.96 | 1.07 | 1.02 | 0.93 | 1.32 | 0.96 | 1.01 | 0.81 |
| NW_MPH3 < PZC (3.5) | 0.75 | 0.76 | 0.75 | 0.74 | 0.75 | 0.89 | 0.82 | 0.73 | 0.70 | 0.76 |
| NW_HPH1 > PZC (8.0) | 0.79 | 0.71 | 0.61 | 0.55 | 0.54 | 0.73 | 0.64 | 0.50 | 0.43 | 0.42 |
| NW_HPH2 PZC (7.0) | 0.76 | 0.63 | 0.60 | 0.56 | 0.82 | 0.72 | 0.90 | 0.52 | 0.47 | 0.45 |
| NW_HPH3 < PZC (3.5) | 0.64 | 0.69 | 0.65 | 0.60 | 0.62 | 0.72 | 0.73 | 0.59 | 0.50 | 0.59 |
© 2018 by the authors. Licensee MDPI, Basel, Switzerland. This article is an open access article distributed under the terms and conditions of the Creative Commons Attribution (CC BY) license (http://creativecommons.org/licenses/by/4.0/).
Share and Cite
Karna, R.R.; Noerpel, M.R.; Luxton, T.P.; Scheckel, K.G. Point of Zero Charge: Role in Pyromorphite Formation and Bioaccessibility of Lead and Arsenic in Phosphate-Amended Soils. Soil Syst. 2018, 2, 22. https://doi.org/10.3390/soilsystems2020022
Karna RR, Noerpel MR, Luxton TP, Scheckel KG. Point of Zero Charge: Role in Pyromorphite Formation and Bioaccessibility of Lead and Arsenic in Phosphate-Amended Soils. Soil Systems. 2018; 2(2):22. https://doi.org/10.3390/soilsystems2020022
Chicago/Turabian StyleKarna, Ranju R., Matthew R. Noerpel, Todd P. Luxton, and Kirk G. Scheckel. 2018. "Point of Zero Charge: Role in Pyromorphite Formation and Bioaccessibility of Lead and Arsenic in Phosphate-Amended Soils" Soil Systems 2, no. 2: 22. https://doi.org/10.3390/soilsystems2020022