
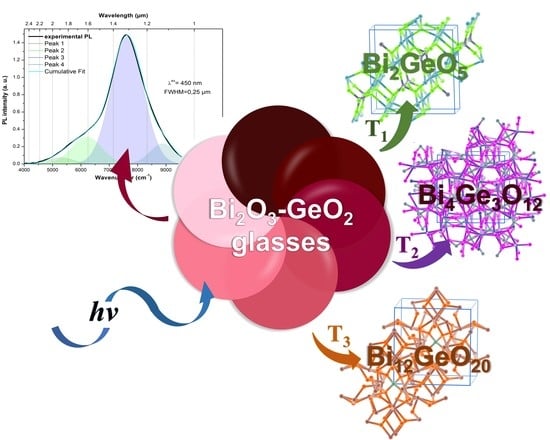
Bismuth-Germanate Glasses: Synthesis, Structure, Luminescence, and Crystallization

 ,
,
Abstract
:
1. Introduction
2. Materials and Methods
3. Results
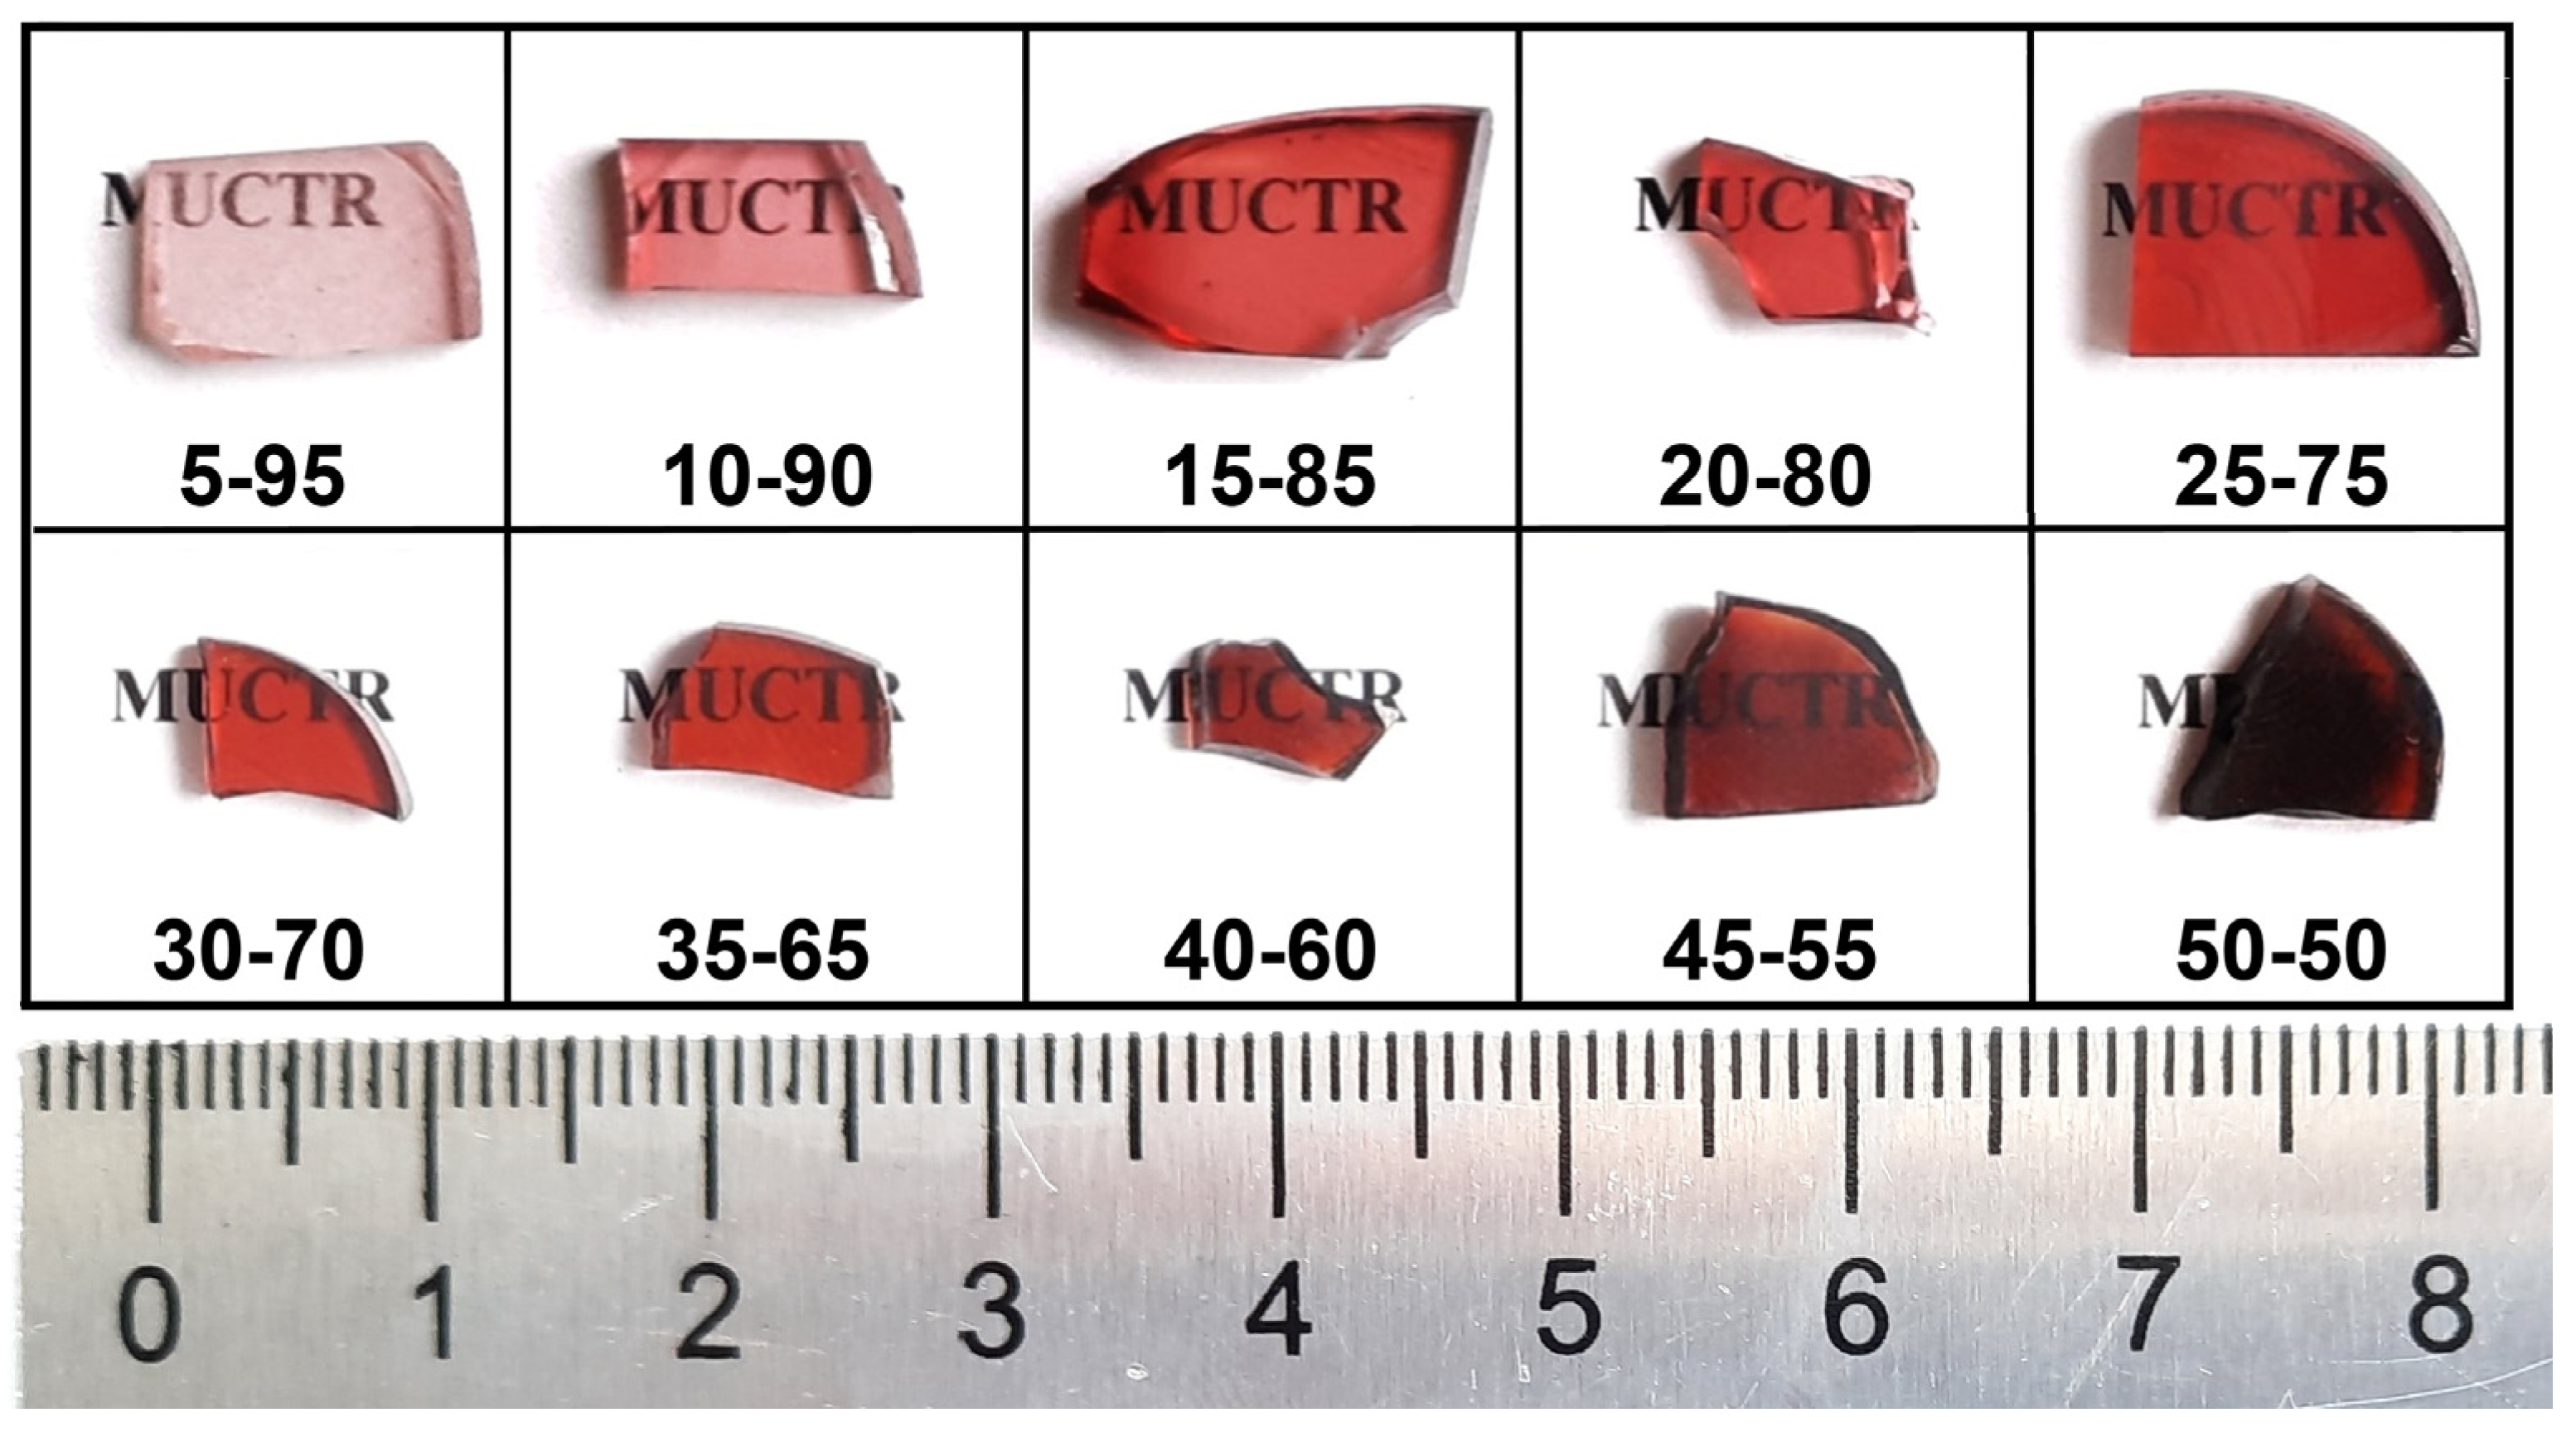
3.1. Glass Samples
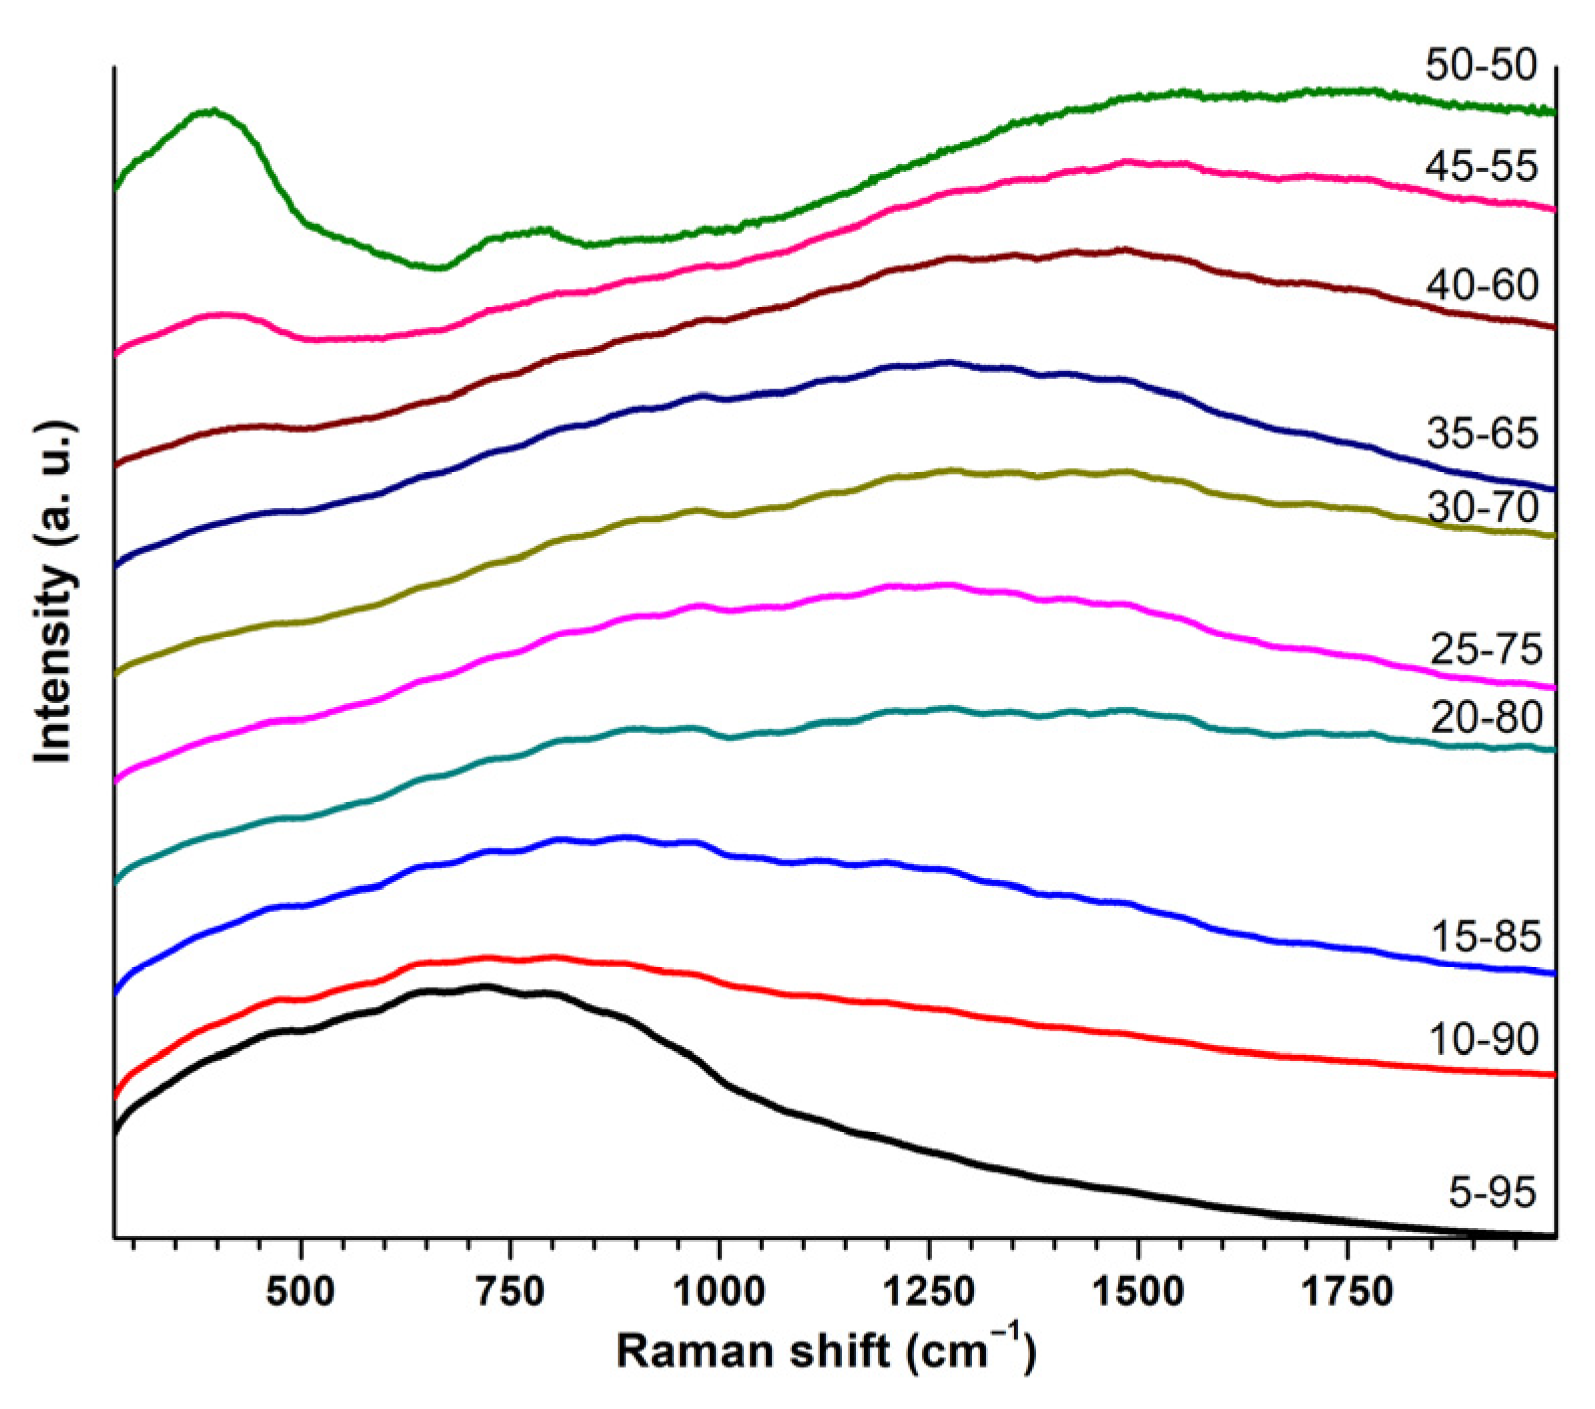
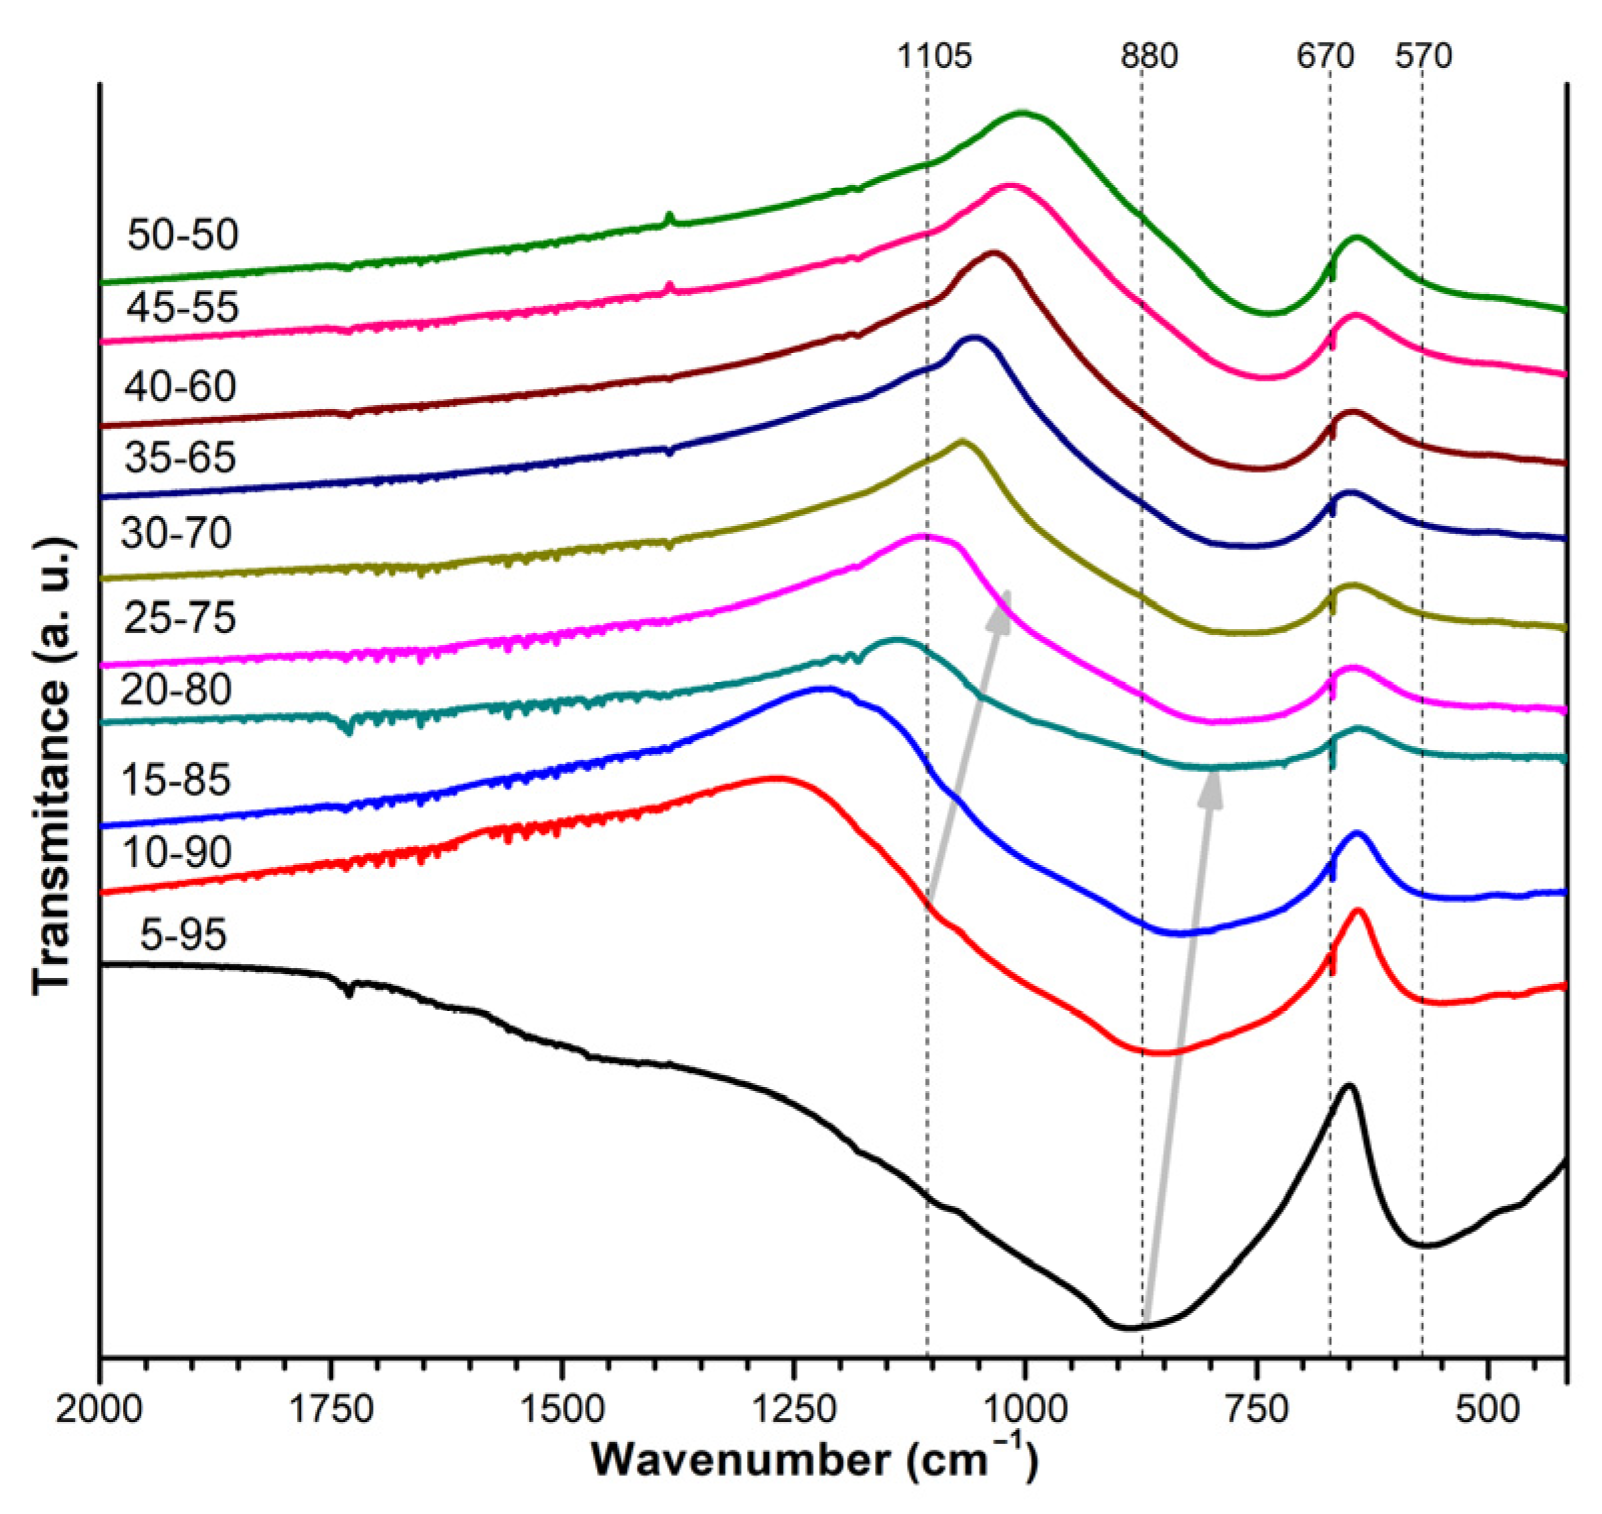
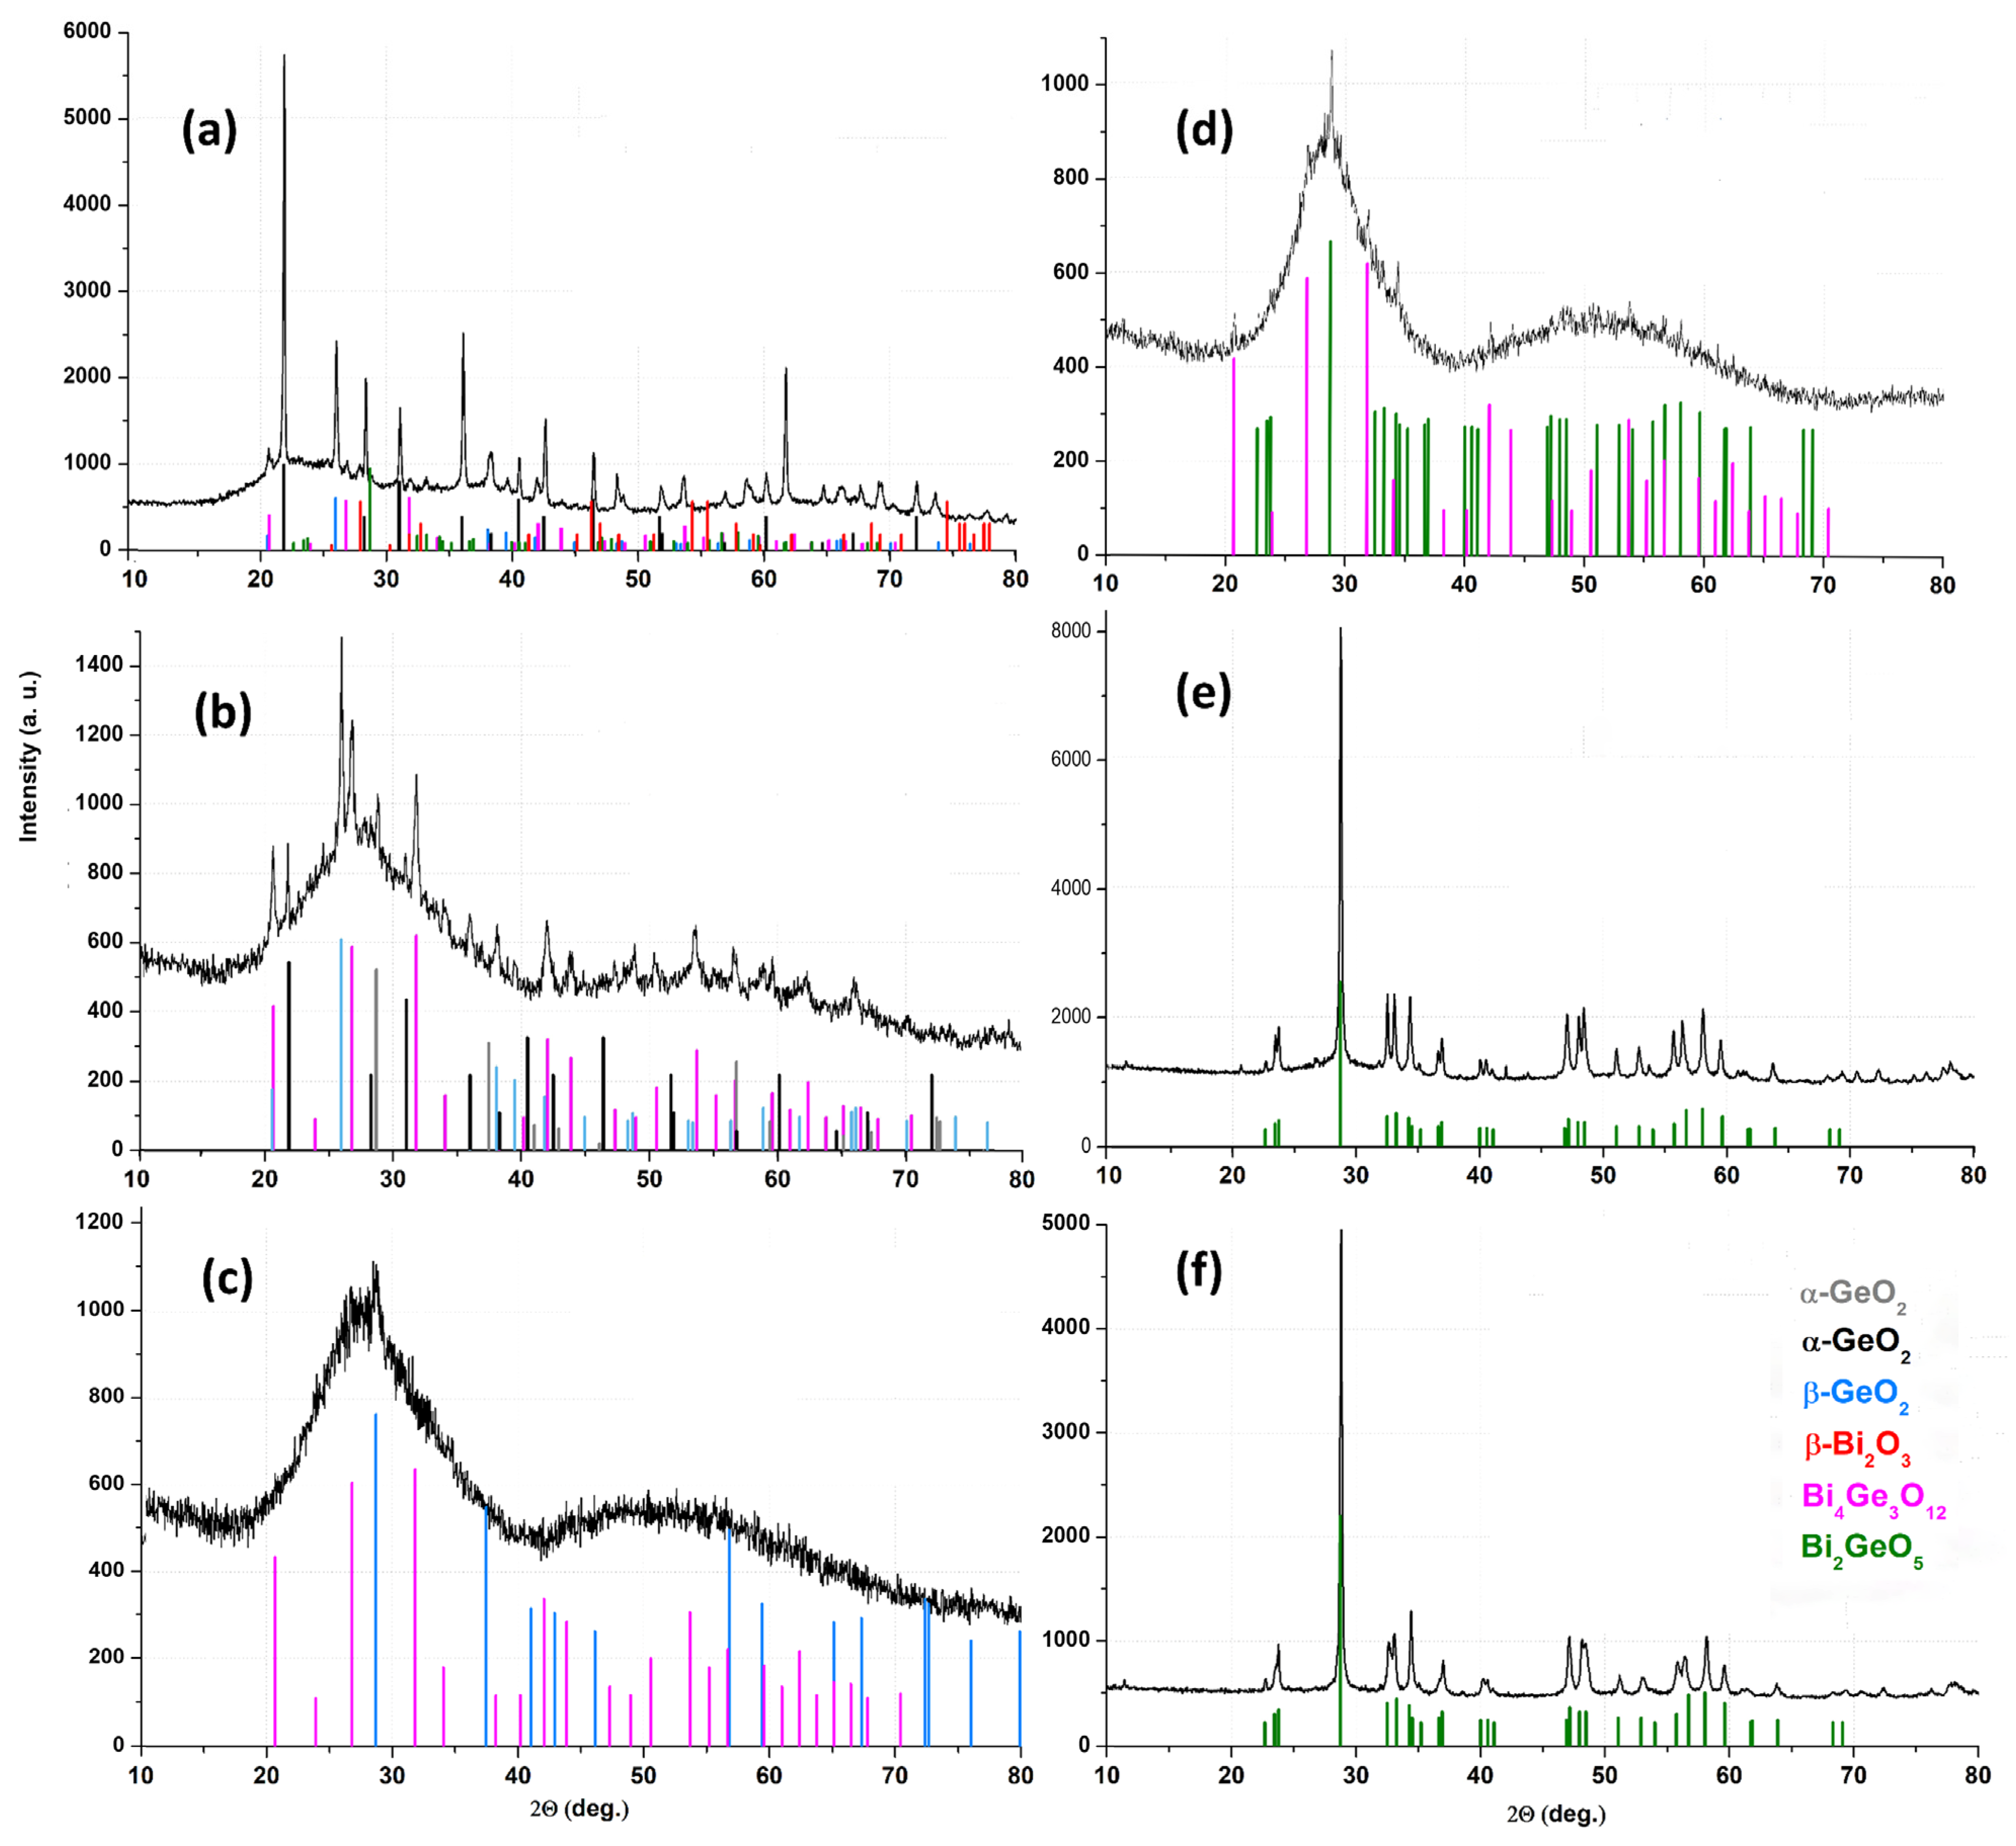
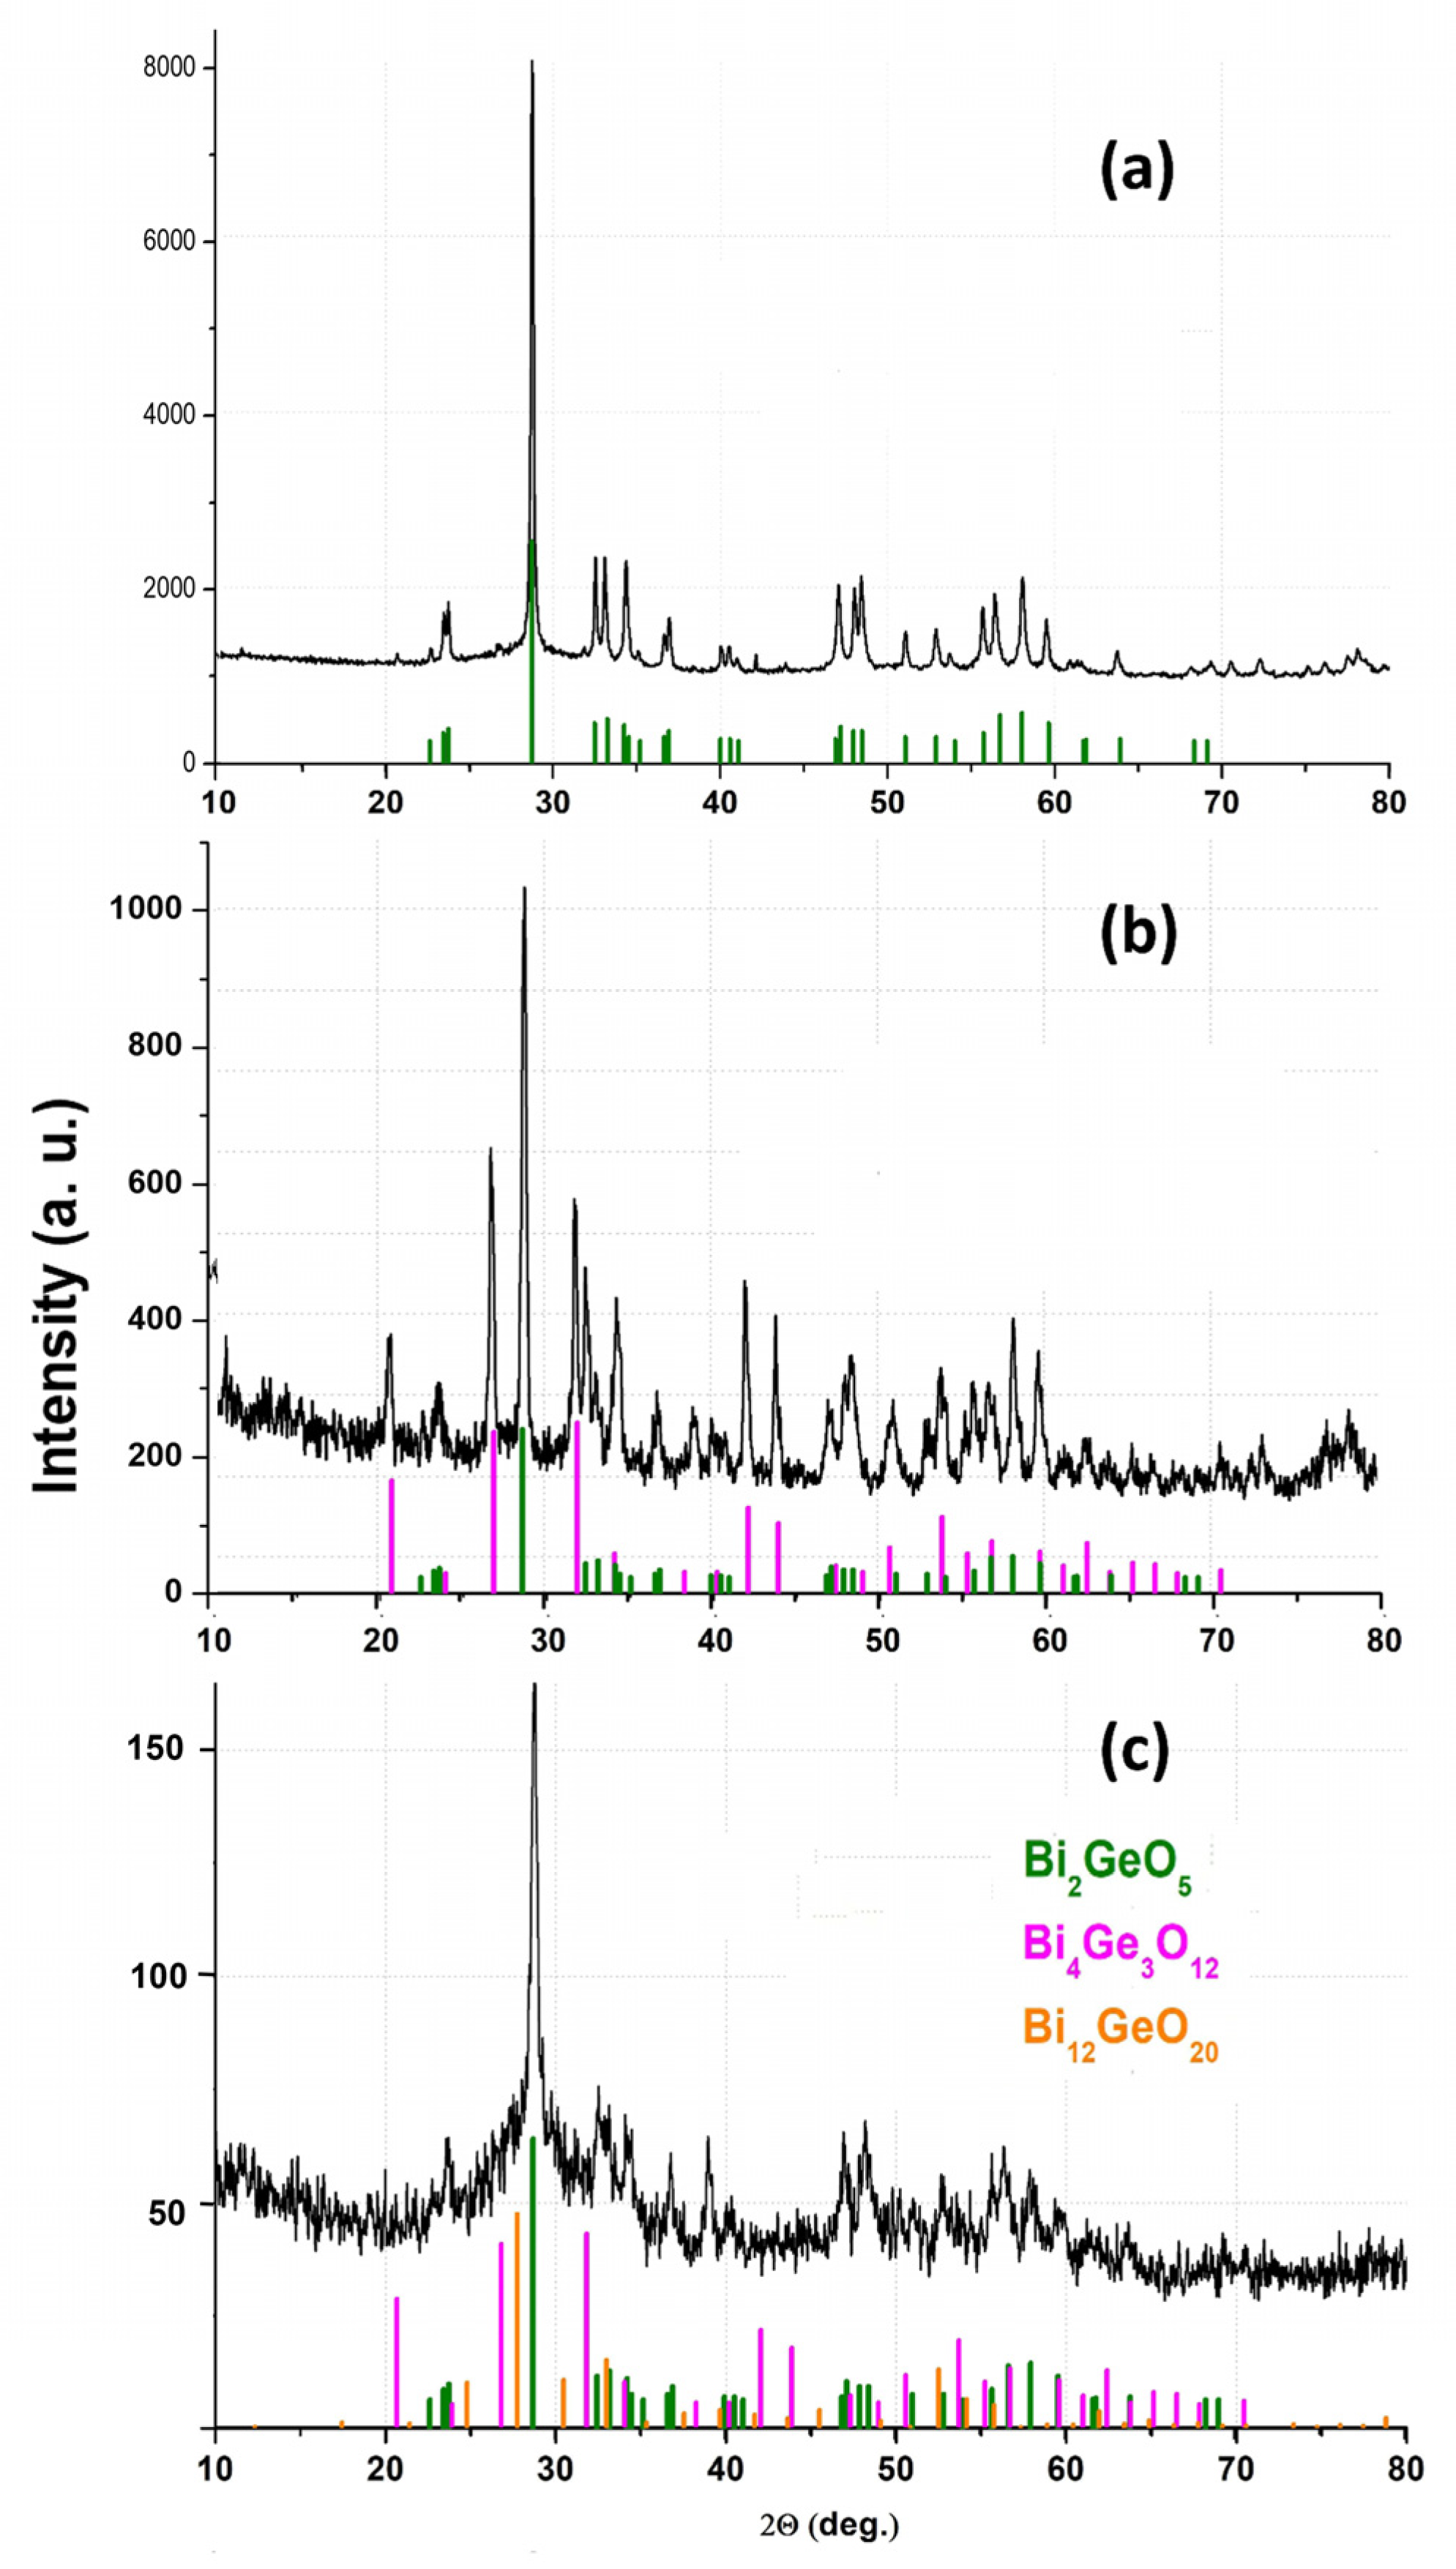
3.2. Glass Structure Characterization
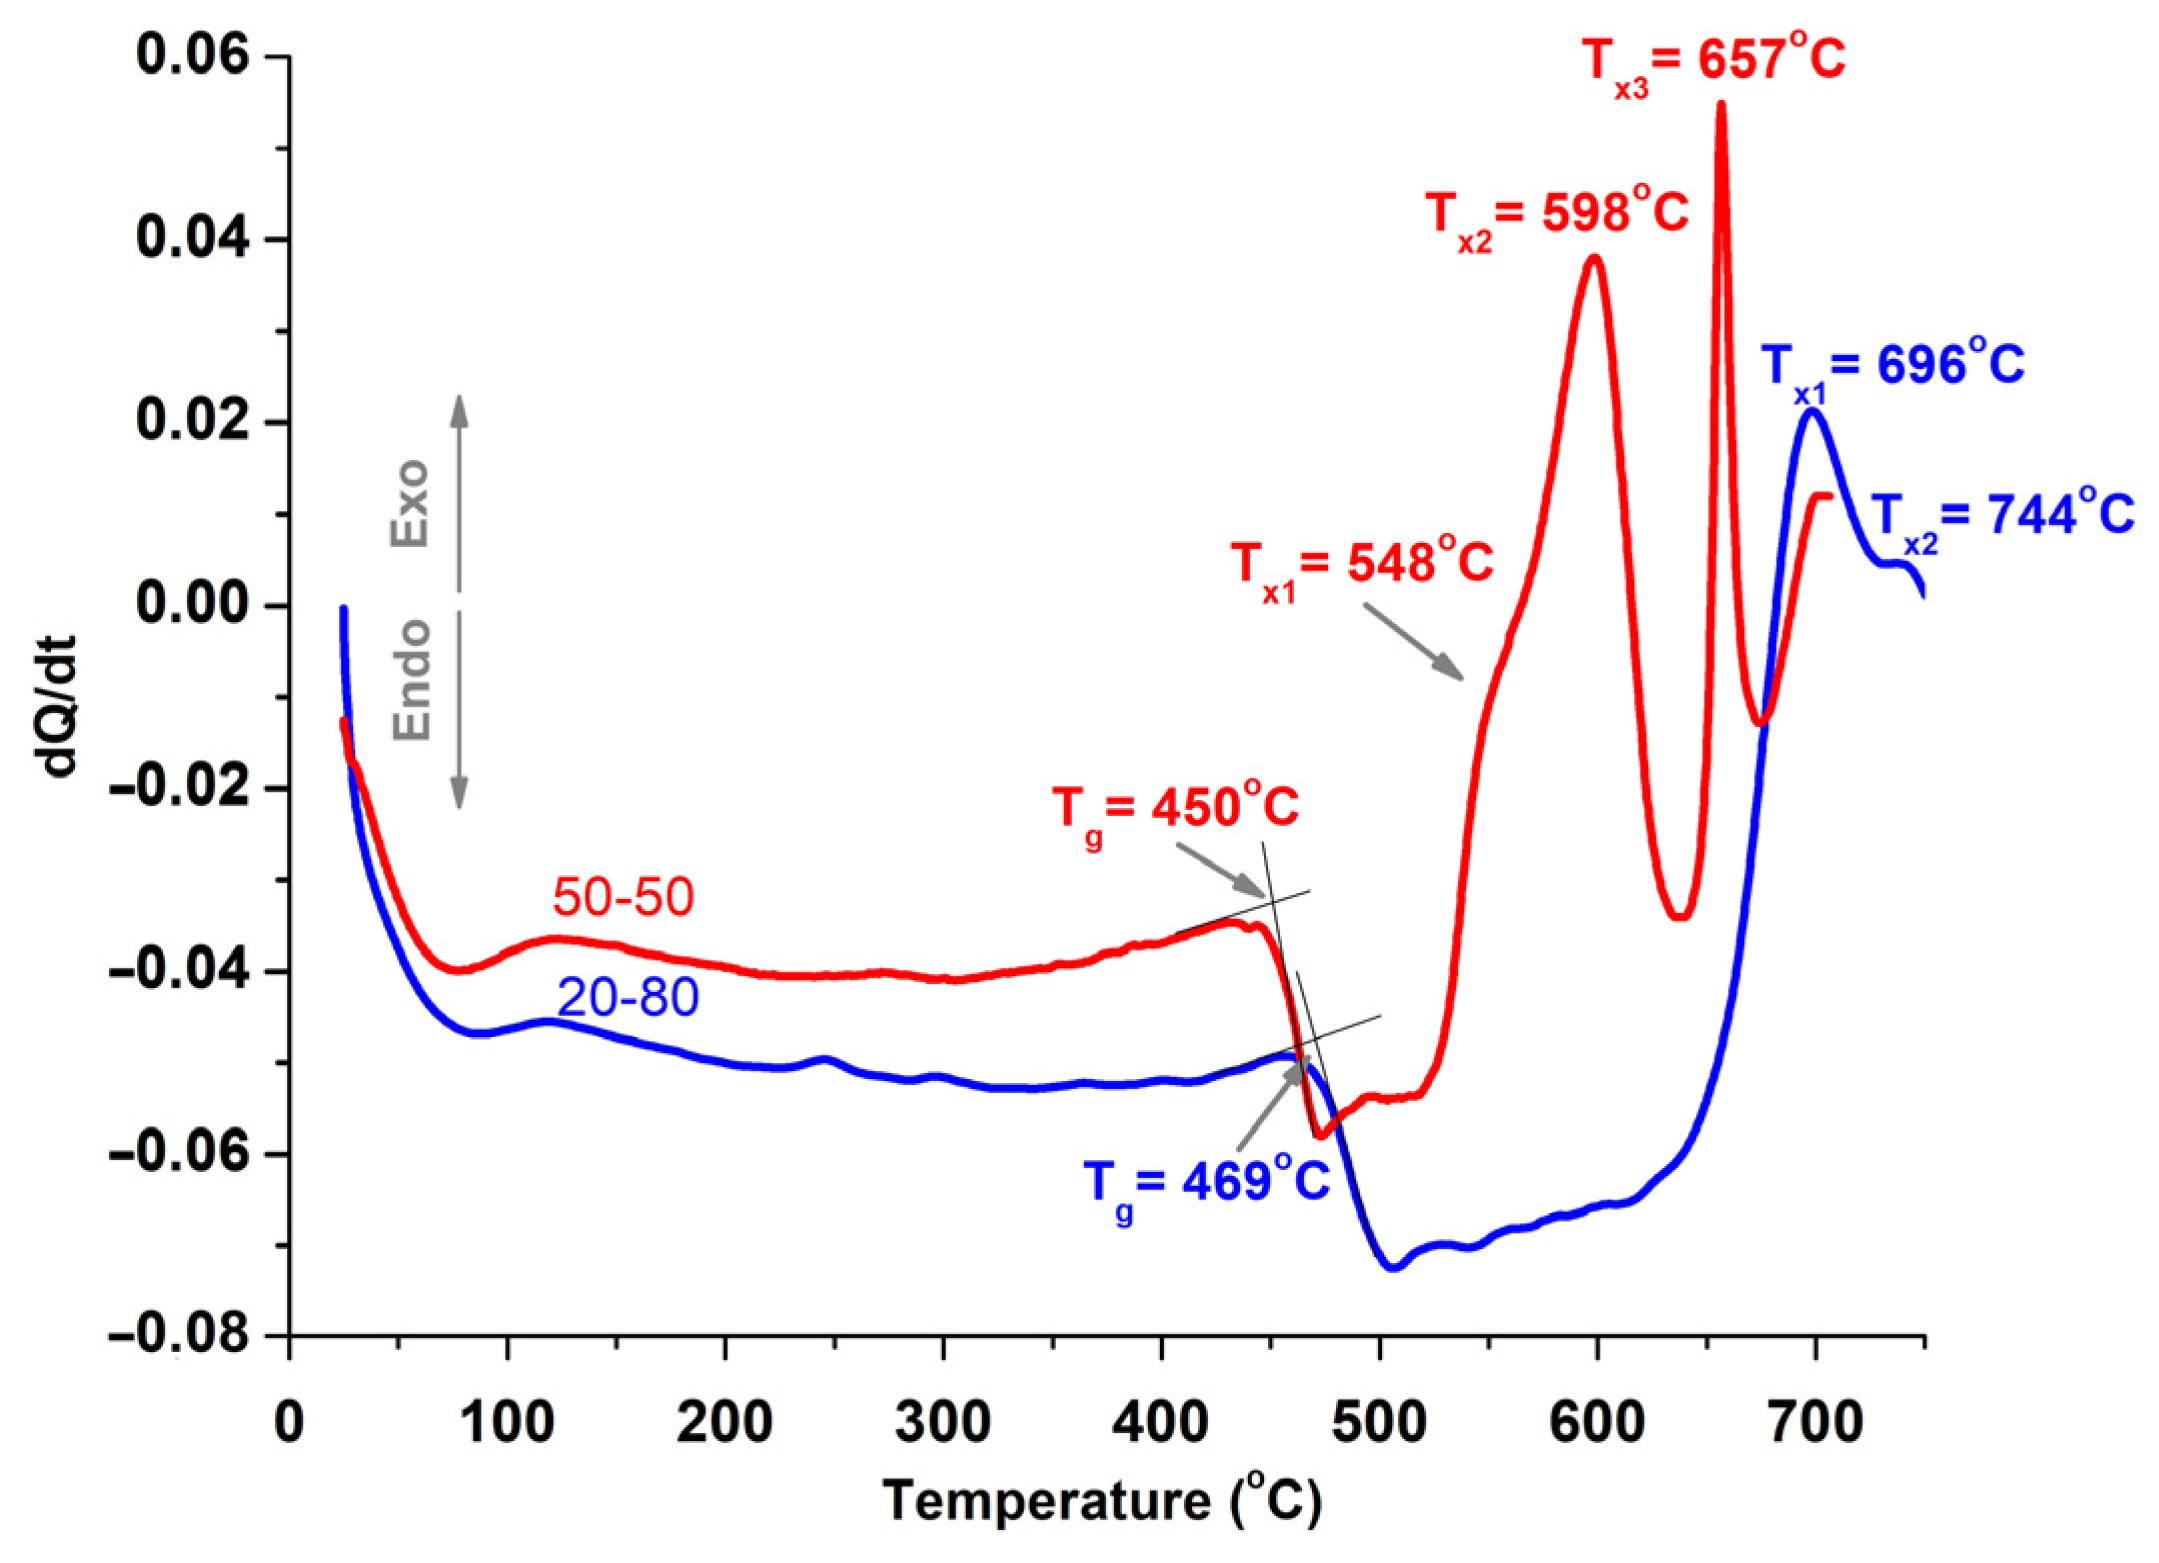
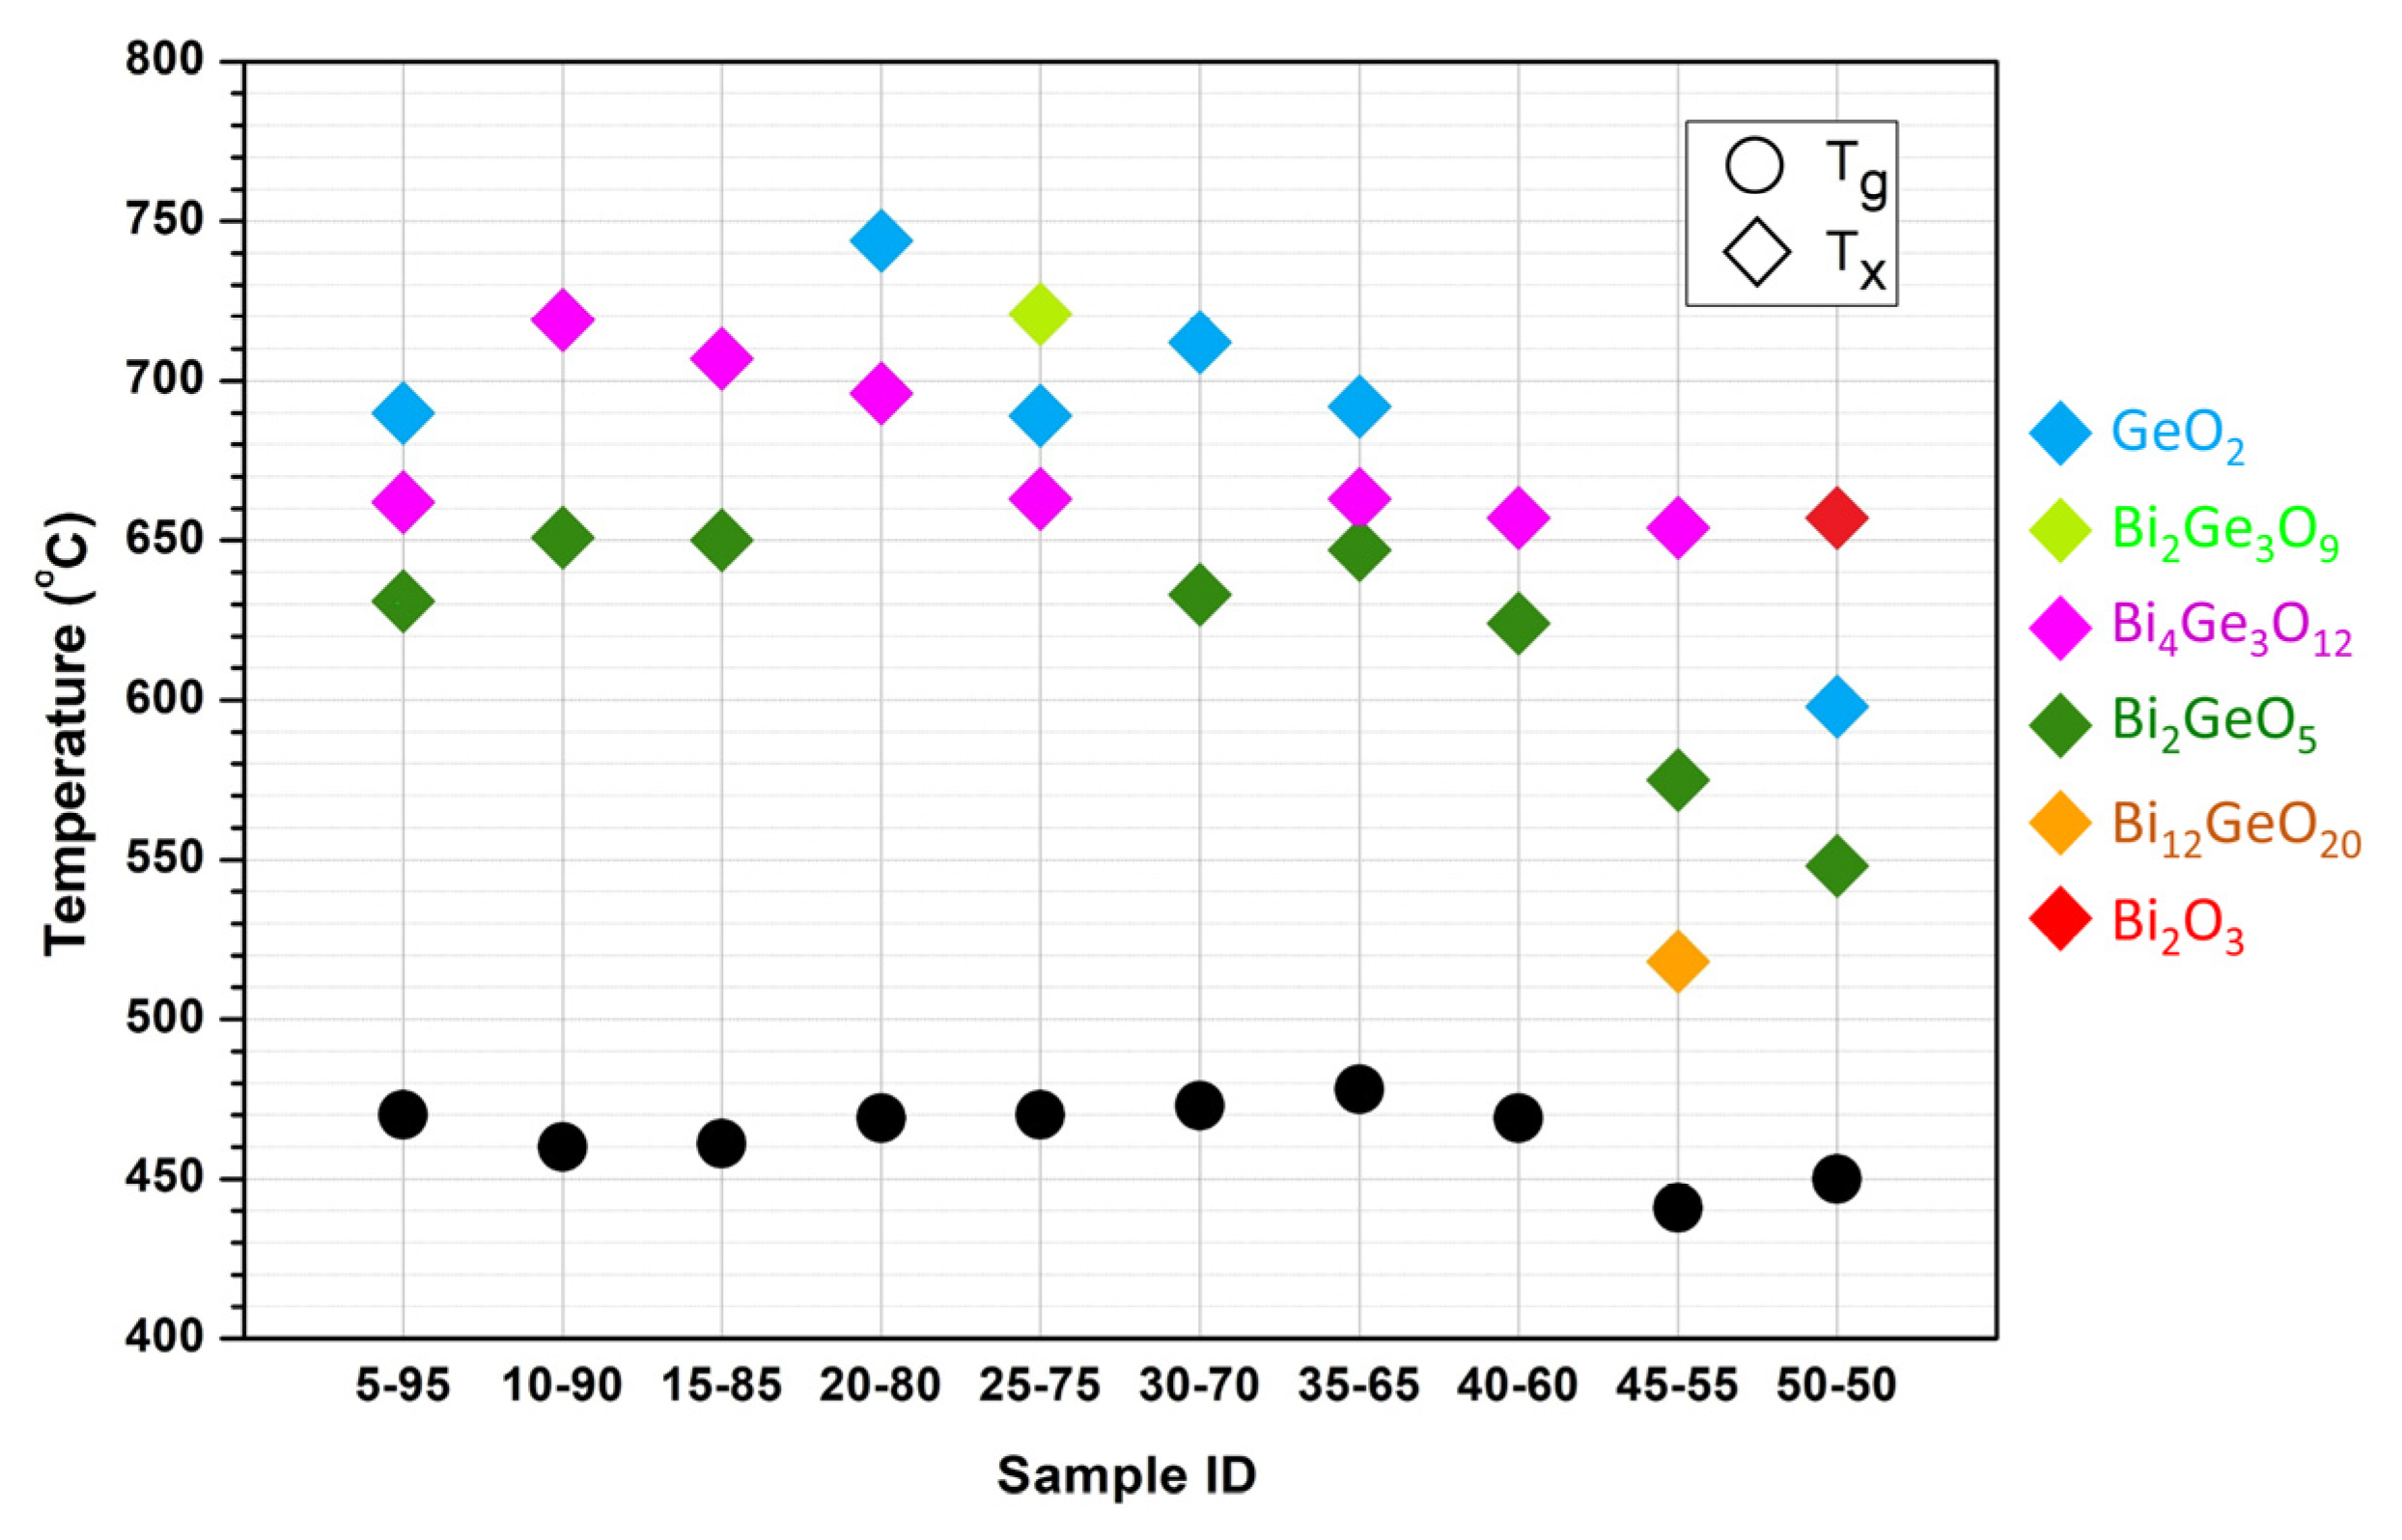
3.3. DSC Characterization and Physical Properties
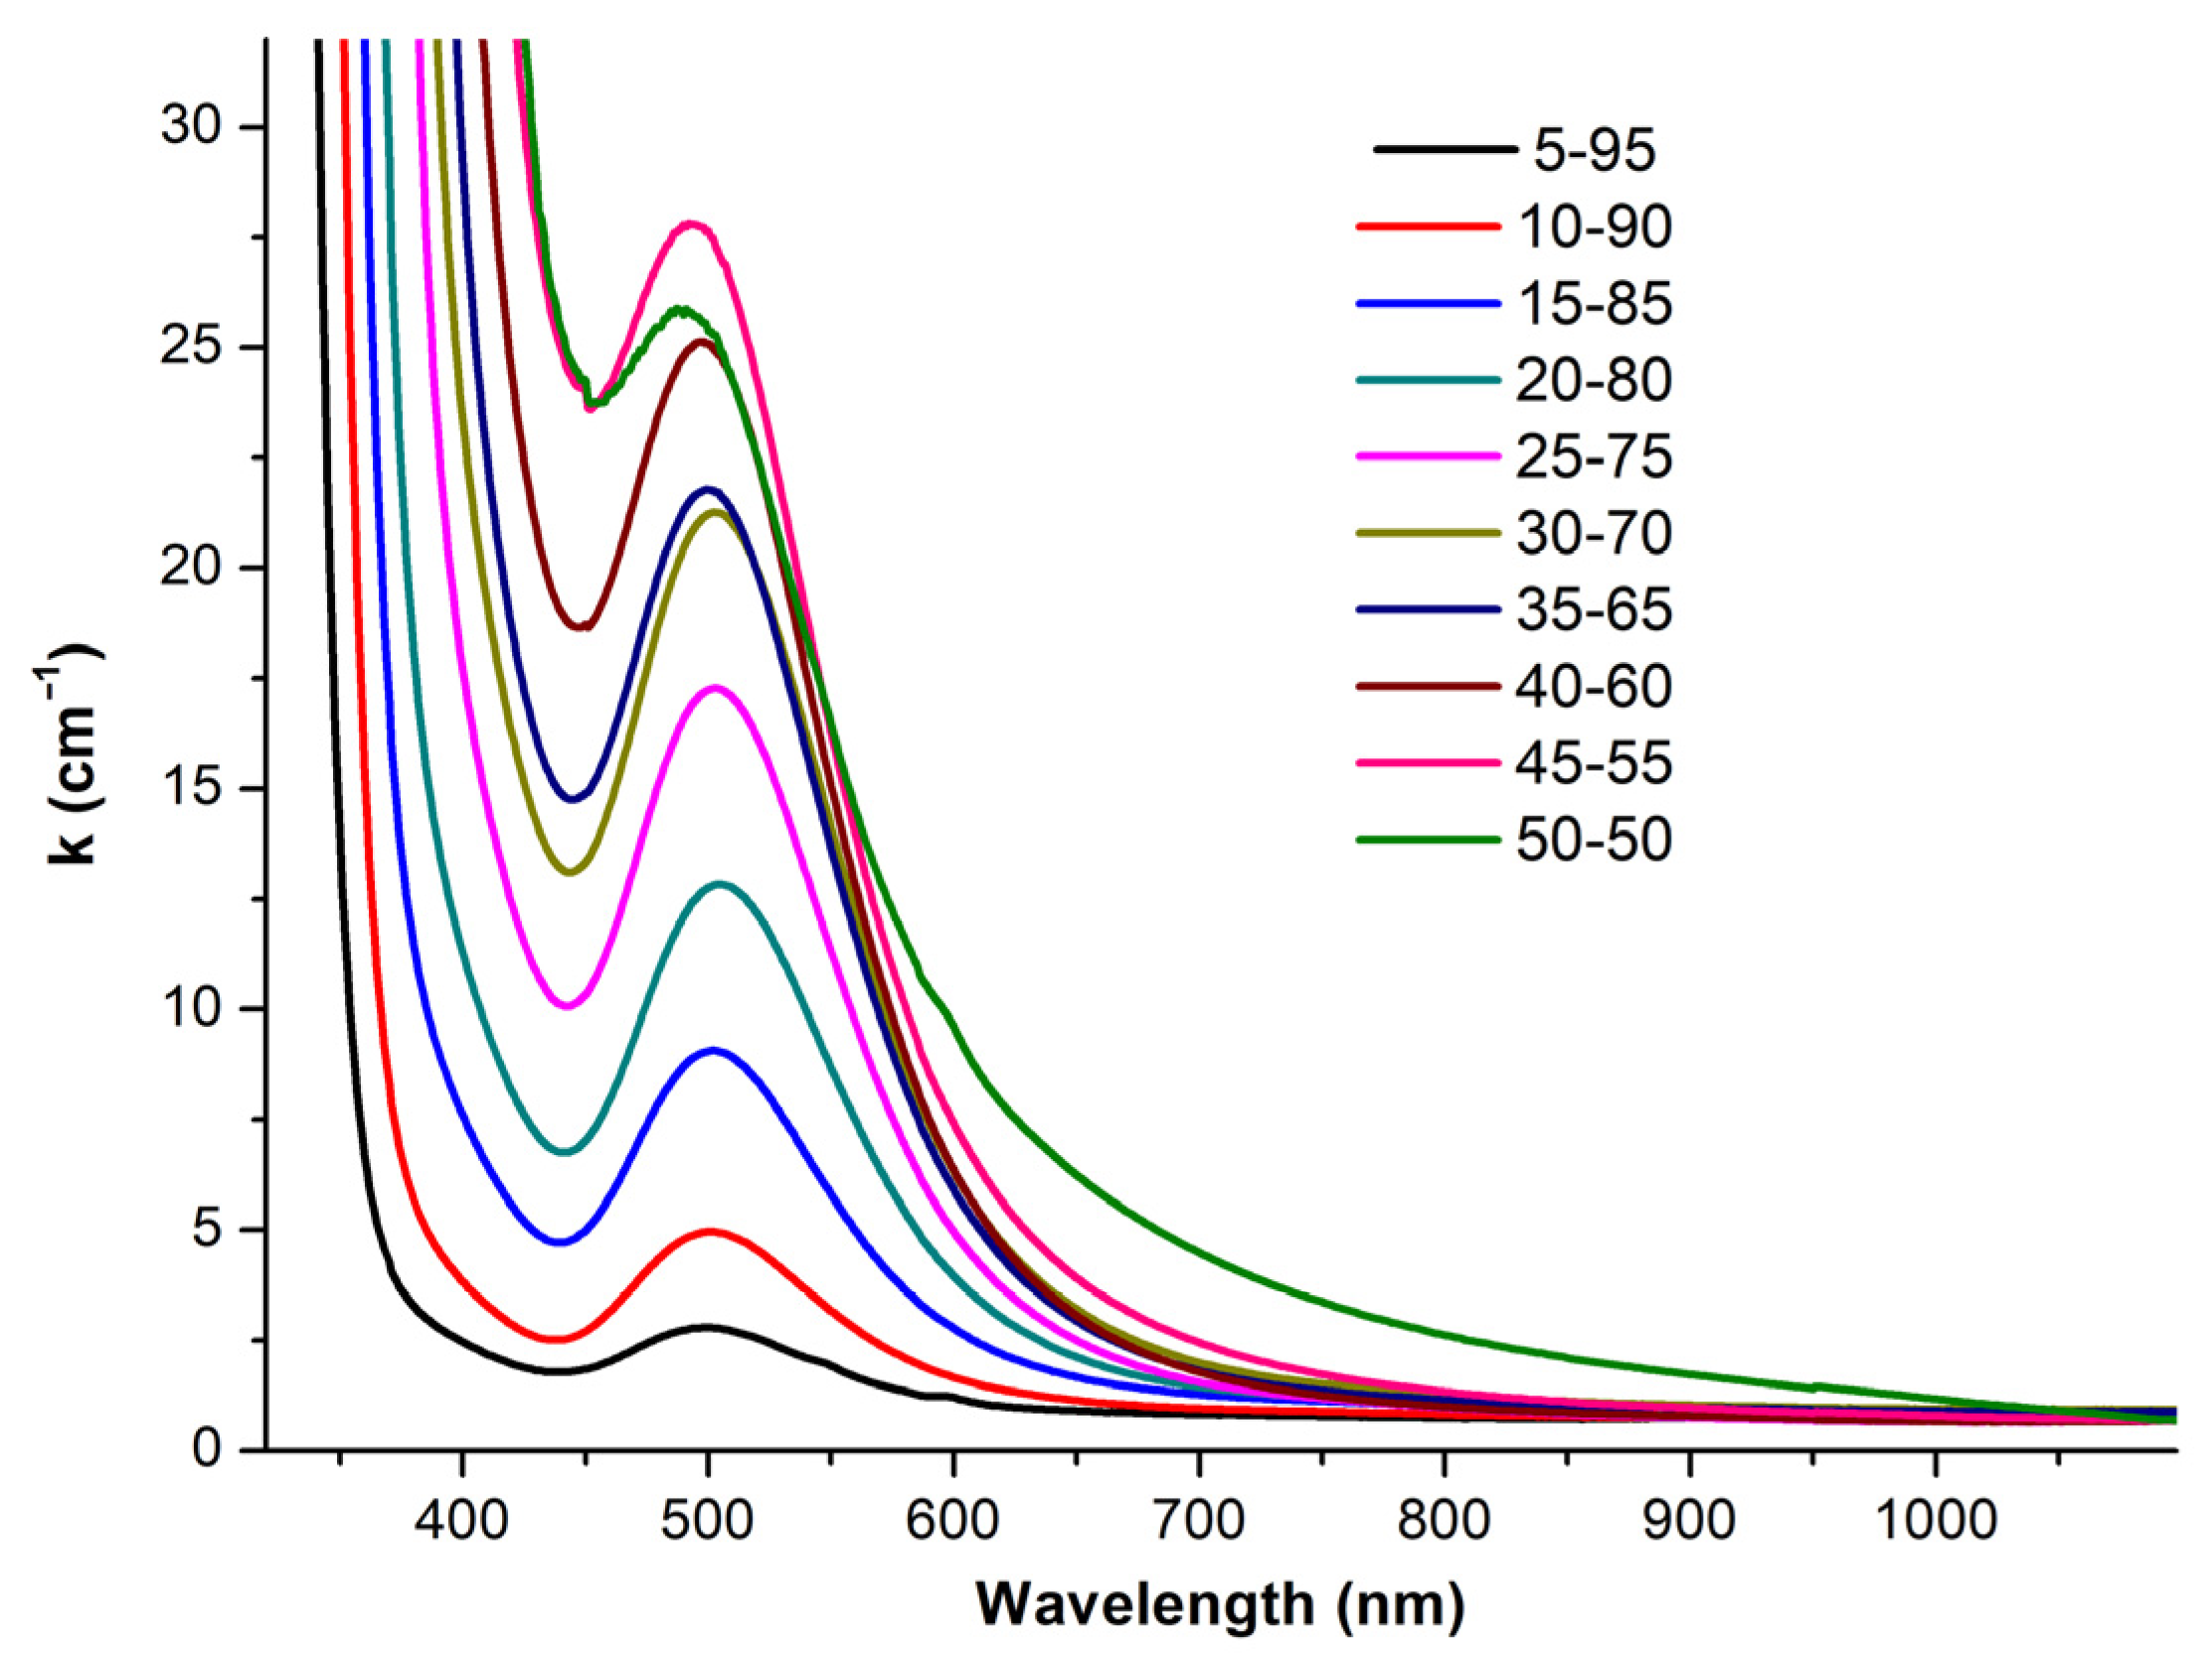
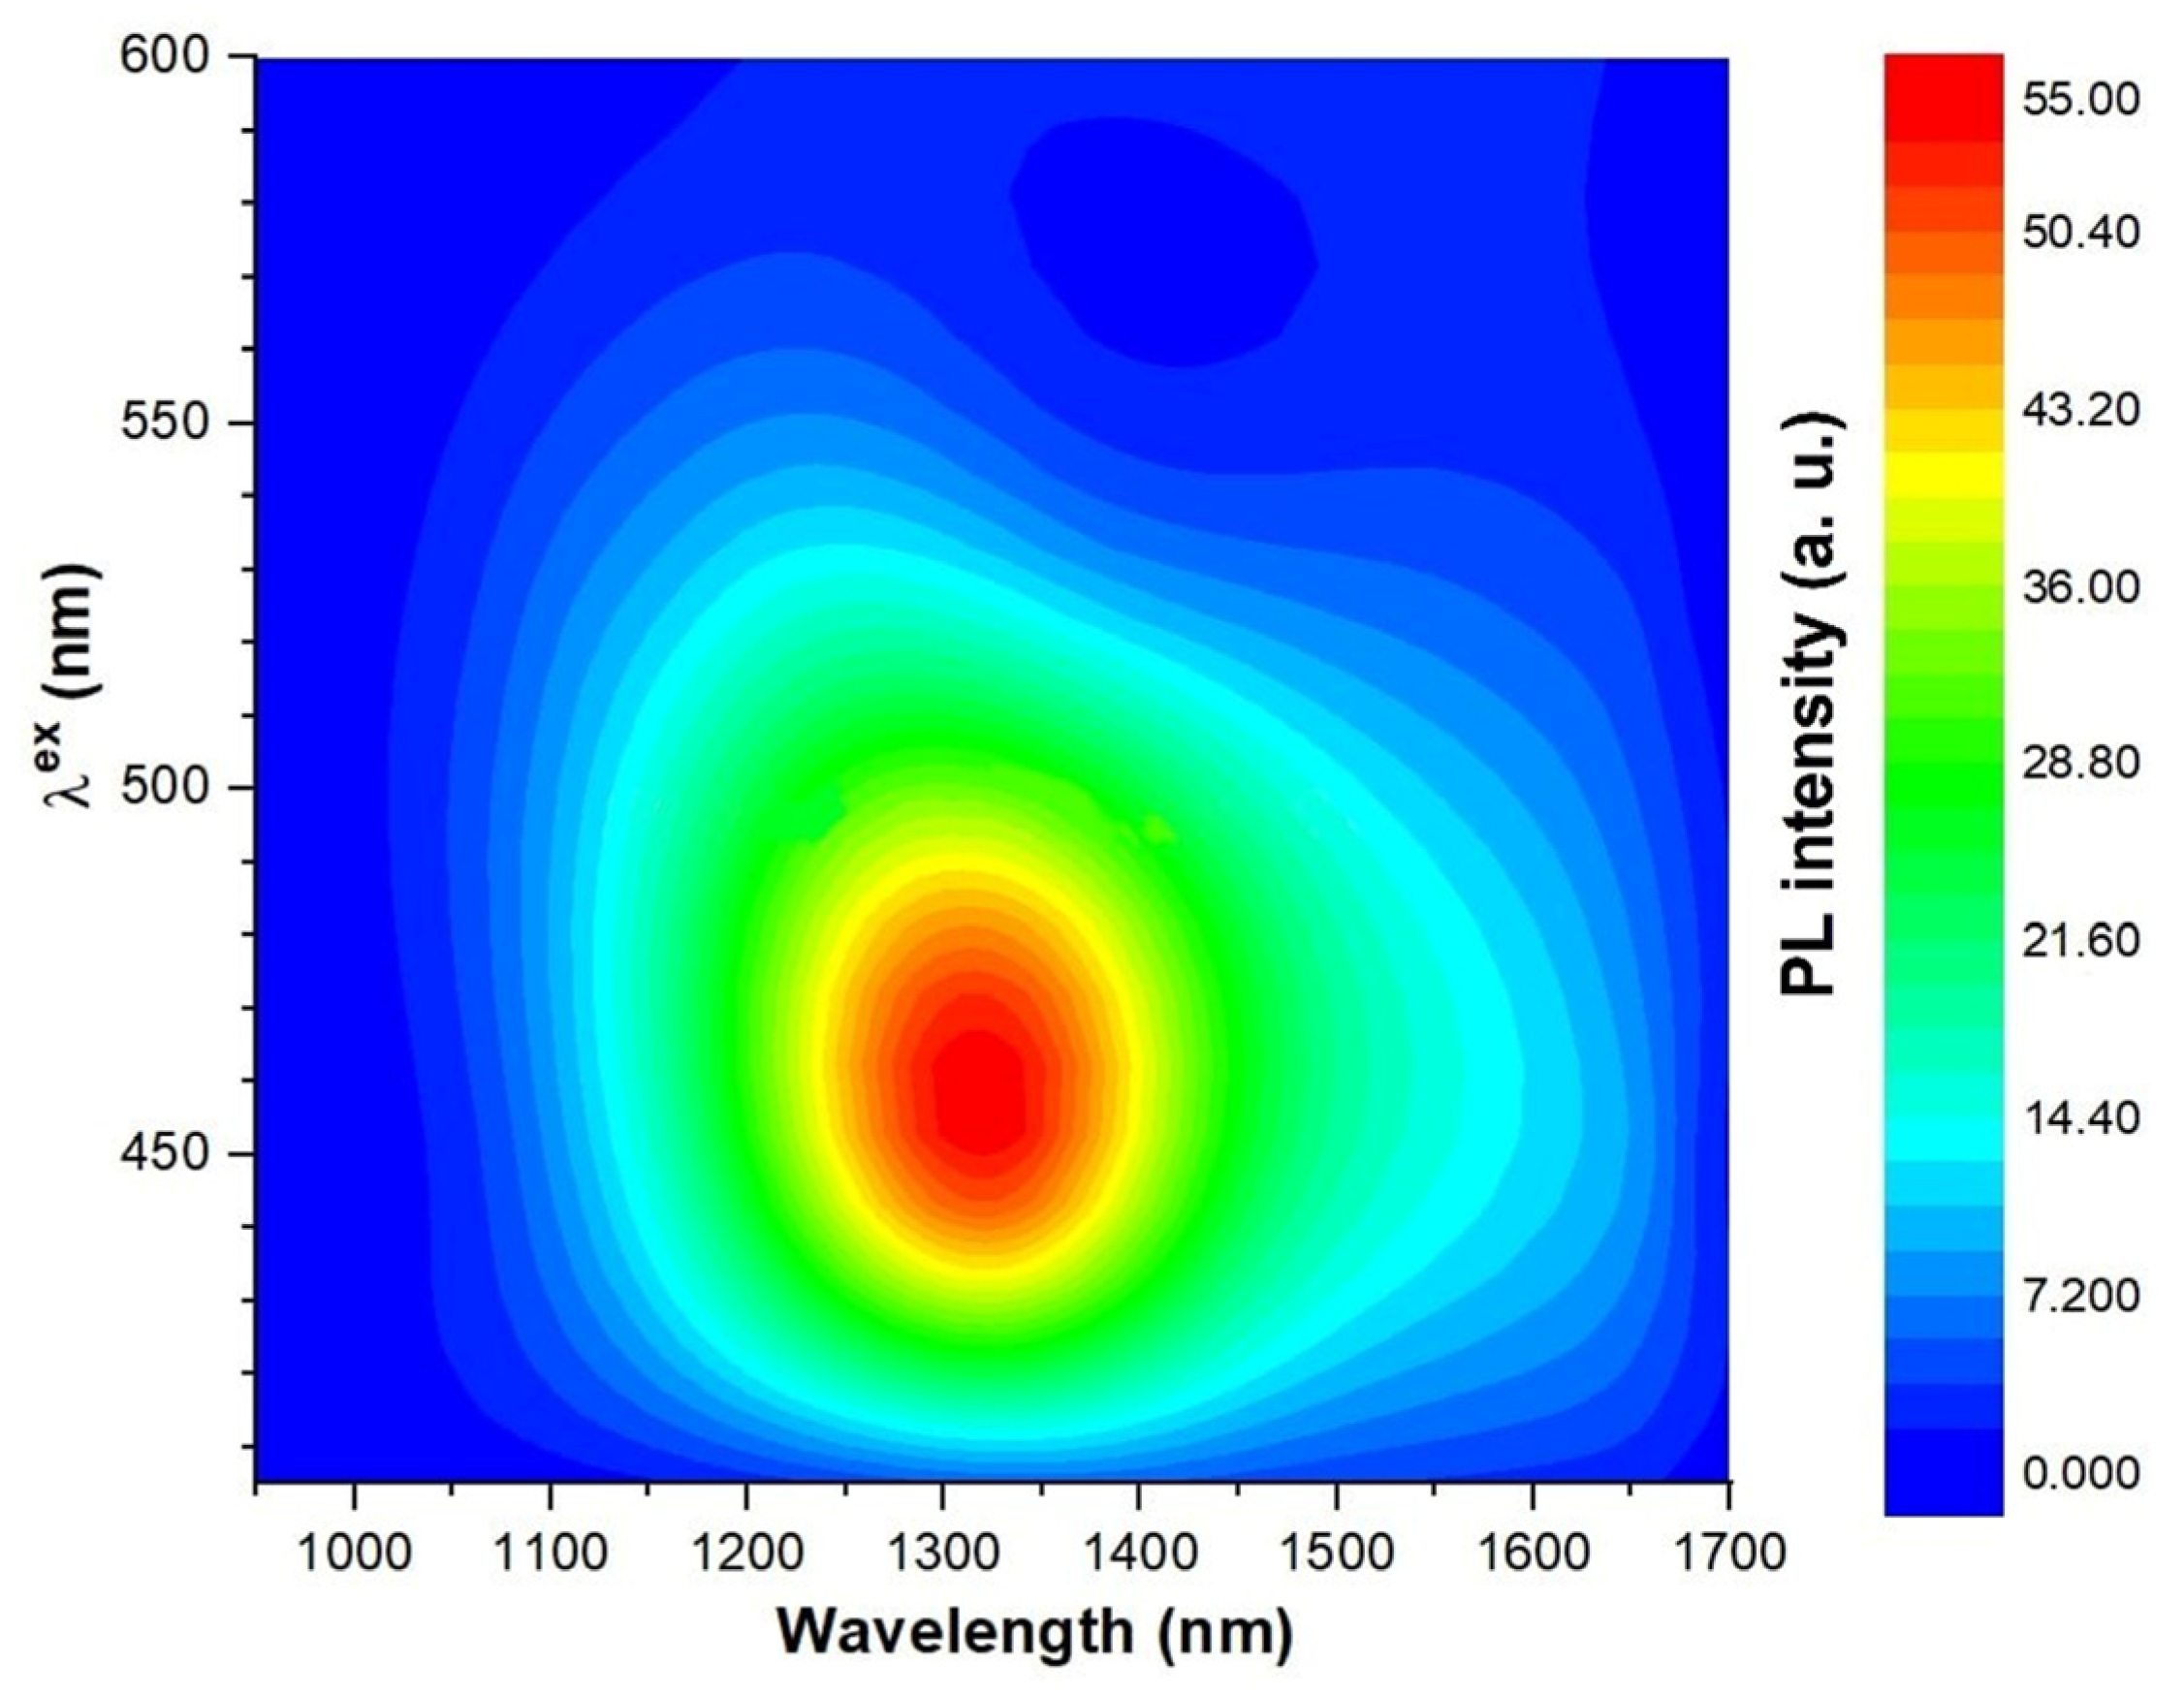
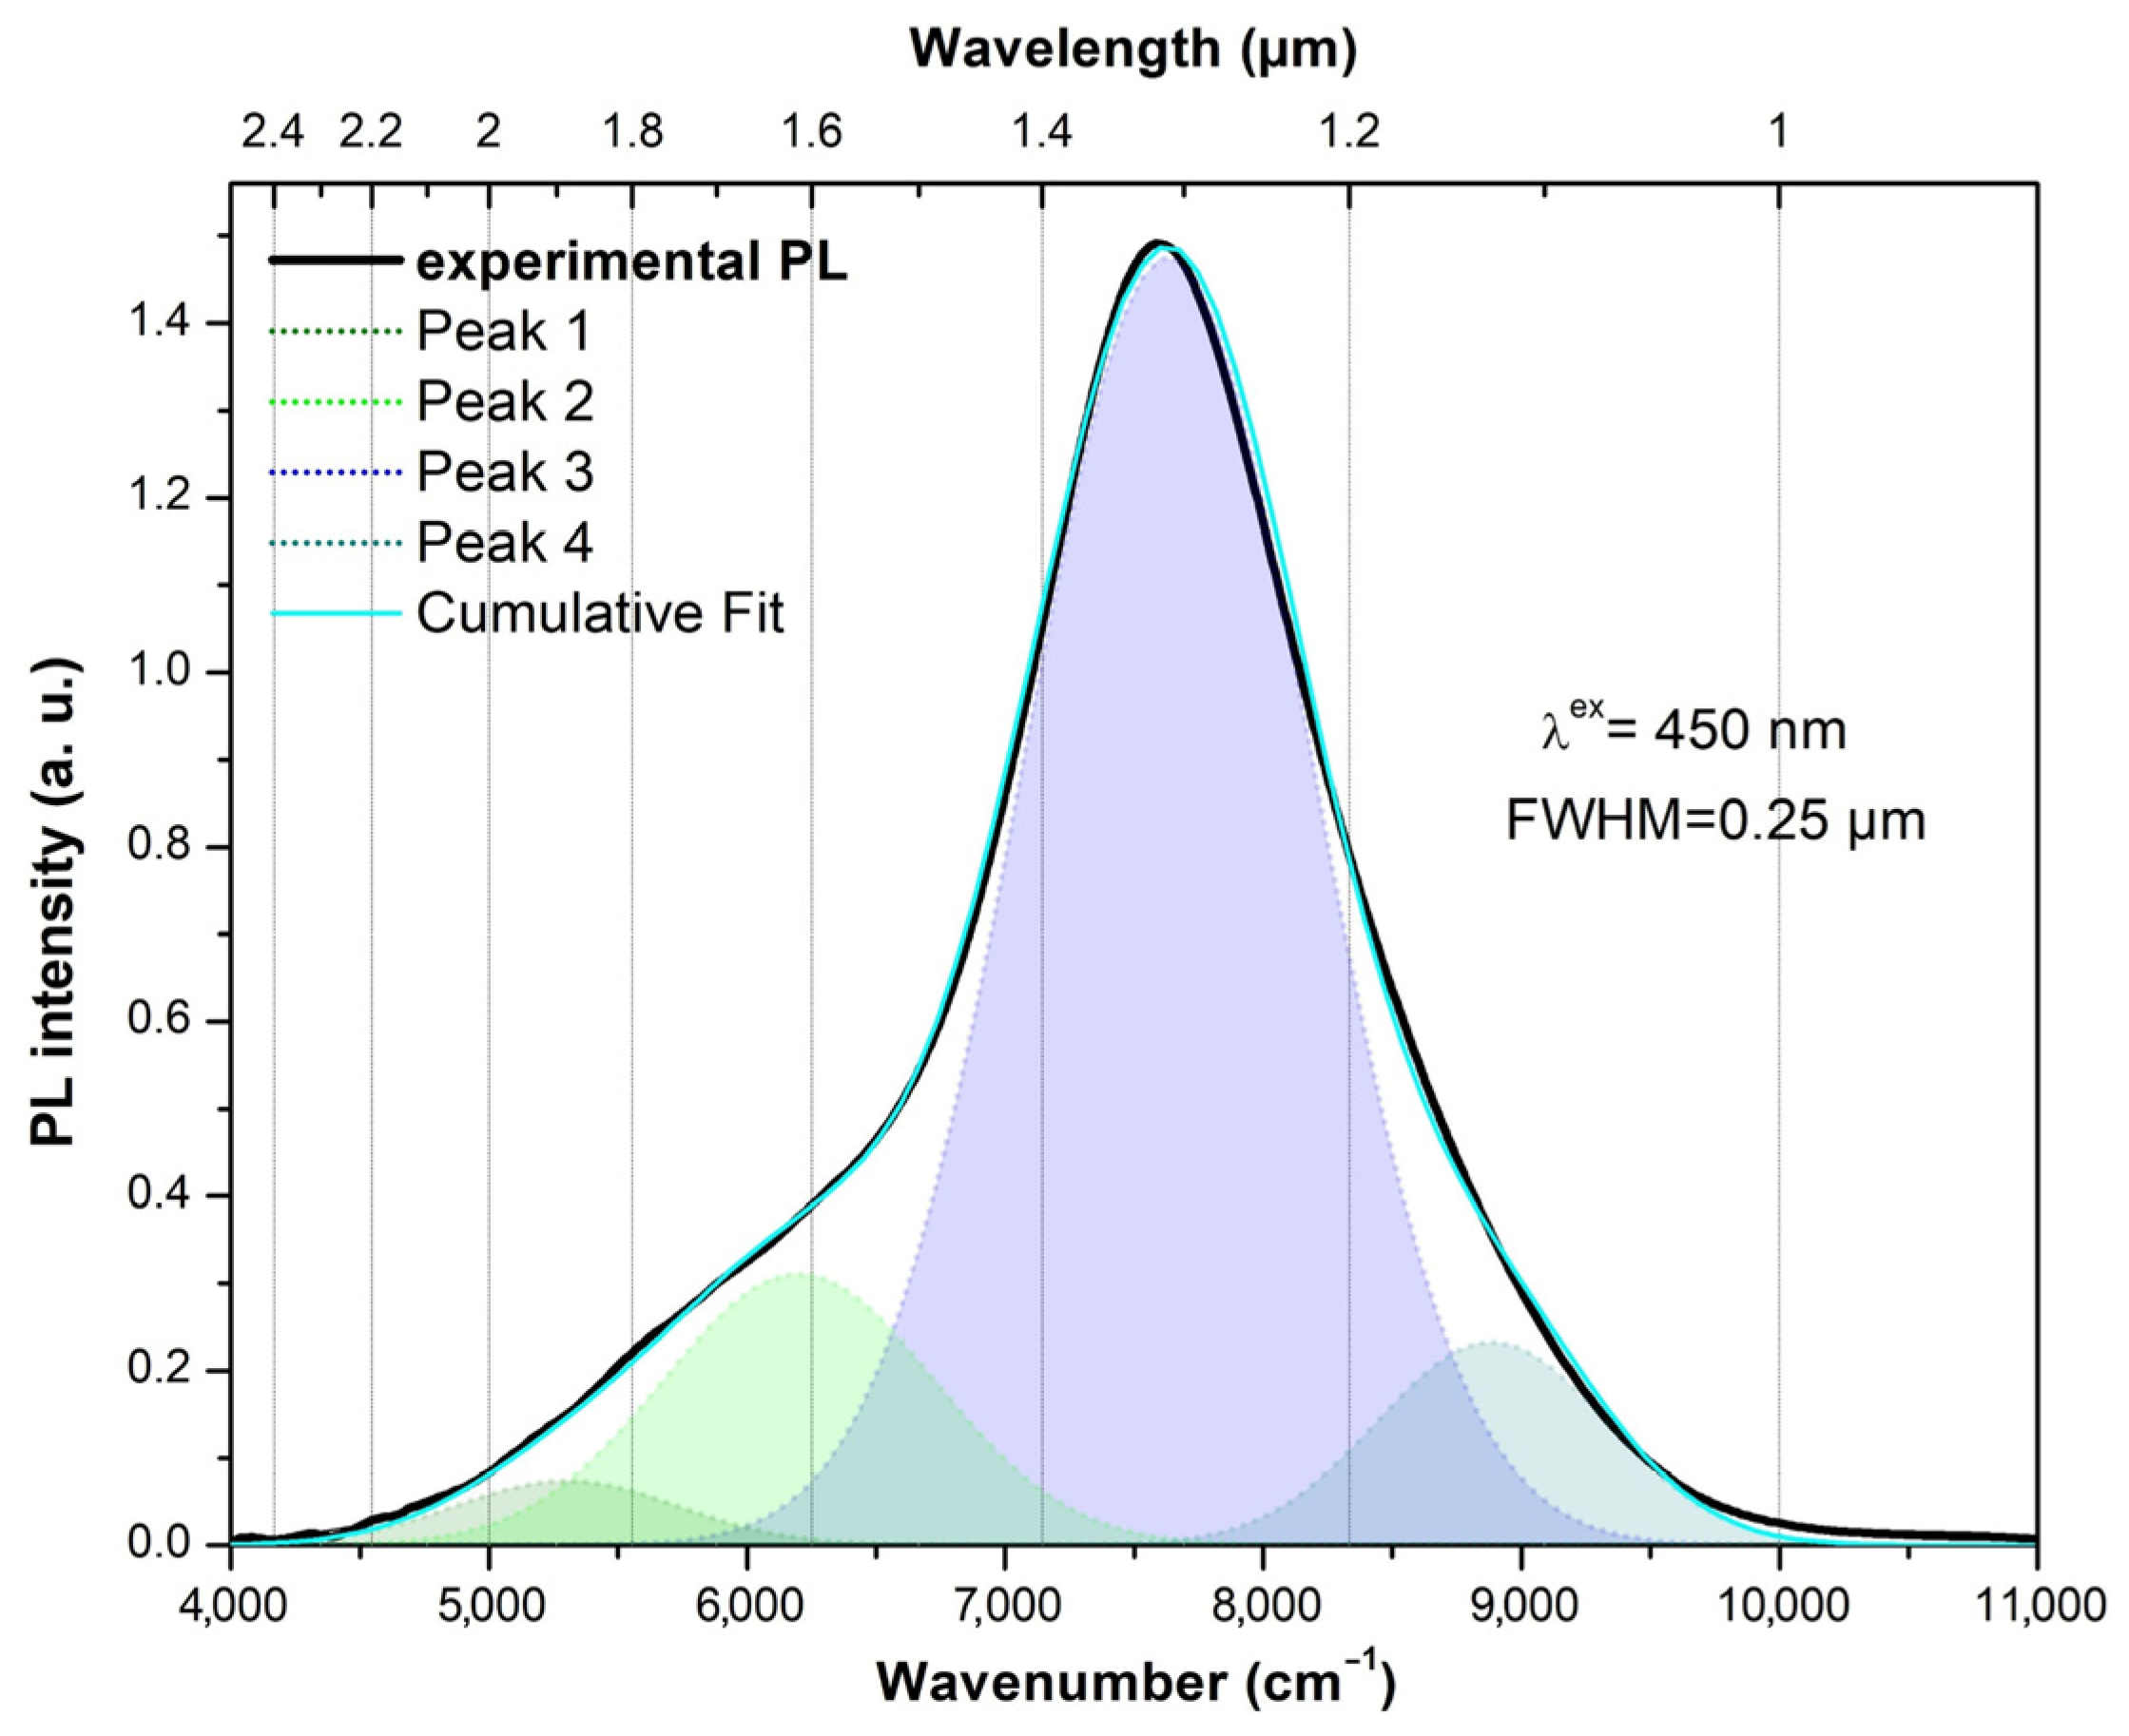
3.4. Spectral-Luminescent Properties
4. Discussion
5. Conclusions
Supplementary Materials
Author Contributions
Funding
Institutional Review Board Statement
Informed Consent Statement
Data Availability Statement
Conflicts of Interest
References
- Fedelesh, V.I.; Kutsenko, Y.P.; Turyanitsa, I.D.; Chepur, D.V. Elastooptic characteristics of glasses of the Bi2O3-GeO2 system. Fiz. Khim. Stekla 1983, 9, 247–248. [Google Scholar]
- Beneventi, P.; Bersani, D.; Lottici, P.P.; Kovács, L.; Cordioli, F.; Montenero, A.; Gnappi, G. Raman study of Bi2O3-GeO2-SiO2 glasses. J. Non-Cryst. Solids 1995, 192–193, 258–262. [Google Scholar] [CrossRef]
- Zhereb, V.P.; Skorikov, V.M. Metastable states in bismuth-containing oxide systems. Inorg. Mater. 2003, 39, S121–S145. [Google Scholar] [CrossRef]
- Maeder, T. Review of Bi2O3-based glasses for electronics and related applications. Int. Mater. Rev. 2012, 58, 3–40. [Google Scholar] [CrossRef]
- Kusz, B.; Trzebiatowski, K. Bismuth germanate and bismuth silicate glasses cryogenic detectors. J. Non-Cryst. Solids 2003, 319, 257–262. [Google Scholar] [CrossRef]
- Riebling, E.F. Depolymerization of GeO2 and GeO2·Sb2O3 glasses by Bi2O3. J. Mater. Sci. 1974, 9, 753–760. [Google Scholar] [CrossRef]
- Fujimoto, Y.; Nakatsuka, M. Infrared luminescence from bismuth-doped silica glass. J. Jpn. Appl. Phys. 2001, 40, L279–L281. [Google Scholar] [CrossRef]
- Meng, X.; Qiu, J.; Peng, M.; Chen, D.; Zhao, Q.; Jiang, X.; Zhu, C. Near infrared broadband emission of bismuth-doped aluminophosphate glass. Opt. Express 2005, 13, 1635–1642. [Google Scholar] [CrossRef]
- Denker, B.; Galagan, B.; Osiko, V.; Sverchkov, S.; Dianov, E. Luminescent properties of Bi-doped boro-alumino-phosphate glasses. J. Appl. Phys. 2007, 87, 135–137. [Google Scholar] [CrossRef]
- Hughes, M.; Akada, T.; Suzuki, T.; Ohishi, Y.; Hewak, D.W. Ultrabroad emission from a bismuth doped chalcogenide glass. Opt. Express 2009, 17, 19345–19355. [Google Scholar] [CrossRef] [Green Version]
- Sokolov, V.O.; Plotnichenko, V.G.; Dianov, E.M. Origin of near-IR luminescence in Bi2O3-GeO2 and Bi2O3-SiO2 glasses: First-principle study. Opt. Mater. Exp. 2015, 5, 163–168. [Google Scholar] [CrossRef]
- Pengpat, K.; Holland, D. Glass-ceramics containing ferroelectric bismuth germanate (Bi2GeO5). J. Eur. Ceram. Soc. 2003, 23, 1599–1607. [Google Scholar] [CrossRef]
- Macedo, Z.S.; Silva, R.S.; Valerio, M.; Martinez, A.; Hernandes, A. Laser-sintered bismuth germanate ceramics as scintillator devices. J. Am. Ceram. Soc. 2004, 87, 1076–1081. [Google Scholar] [CrossRef]
- Garcia dos Santos, M.; Moreira, R.C.M.; Gouveia de Souza, A.; Lebullenger, R.; Hernandes, A.C.; Leite, E.R.; Paskocimas, C.A.; Longo, E. Ceramic crucibles: A new alternative for melting of PbO-BiO1.5-GaO1.5 glasses. J. Non-Cryst. Solids 2003, 319, 304–310. [Google Scholar] [CrossRef]
- Zhao, Y.; Wondraczek, L.; Mermet, A.; Peng, M.; Zhang, Q.; Qiu, J. Homogeneity of bismuth-distribution in bismuth-doped alkali germanate laser glasses towards superbroad fiber amplifiers. Opt. Express 2015, 23, 12423–12433. [Google Scholar] [CrossRef]
- Henderson, G.S.; Wang, H.M. Germanium coordination and the germanate anomaly. Opt. Mater. 2014, 5, 163–168. [Google Scholar] [CrossRef]
- Zhang, X.; Yin, S.; Wan, S.; You, J.; Chen, H.; Zhao, S.; Zhang, Q. Raman spectrum analysis on the solid–liquid boundary layer of BGO crystal growth. Chin. Phys. Lett. 2007, 24, 1898–1900. [Google Scholar]
- Di Martino, D.; Santos, L.F.; Marques, A.; Almeida, R. Vibrational spectra and structure of alkali germanate. J. Non-Cryst. Solids 2001, 293–295, 394–401. [Google Scholar] [CrossRef]
- Koroleva, O.N.; Shtenberg, M.V.; Ivanova, T.N. The structure of potassium germanate glasses as revealed by Raman and IR spectroscopy. J. Non-Cryst. Solids 2019, 510, 143–150. [Google Scholar] [CrossRef]
- Pascuta, P.; Pop, L.; Rada, S.; Bosca, M.; Culea, E. The local structure of bismuth borate glasses doped with europium ions evidenced by FT-IR spectroscopy. J. Mater. Sci. 2008, 19, 424–428. [Google Scholar] [CrossRef]
- Laudisio, G.; Catauro, M. The non-isothermal devitrification of Li2O·TiO2·6GeO2 glass. Thermochim. Acta 1998, 320, 155–159. [Google Scholar] [CrossRef]
- Cho, J.H.; Kim, S.J.; Yang, Y.S. Structural change in Bi4(SixGe1−x)3O12 glasses during crystallization. Solid State Commun. 2001, 119, 465–470. [Google Scholar] [CrossRef]
- Yu, P.; Su, L.; Cheng, J.; Zhang, X.; Xu, J. Study on spectroscopic properties and effects of tungsten ions in 2Bi2O3-3GeO2/SiO2 glasses. Appl. Radiat. Isot. 2017, 122, 106–110. [Google Scholar] [CrossRef]
- Veber, A.A.; Usovich, O.V.; Trusov, L.A.; Kazin, P.E.; Tsvetkov, V.B. Luminescence centers in silicate and germanate glasses activated by bismuth. Bull. Lebedev Phys. Inst. 2012, 39, 305–310. [Google Scholar] [CrossRef]
- Dianov, E.M. On the nature of near-IR emitting Bi centres in glass. Quantum Electron. 2010, 40, 283–285. [Google Scholar] [CrossRef]
- Wang, R.; Liu, J.; Zhang, Z. Luminescence and energy transfer progress in Bi-Yb co-doped germanate glass. J. Alloys Compd. 2016, 688, 332–336. [Google Scholar] [CrossRef]
- Zhang, N.; Qiu, J.; Dong, G.; Yang, Z.; Zhang, Q.; Peng, M. Broadband tunable near-infrared emission of Bi-doped composite germanosilicate glasses. J. Mater. Chem. 2012, 22, 3154. [Google Scholar] [CrossRef]
- Jiang, X.; Su, L.; Guo, X.; Tang, H.; Fan, X.; Zhan, Y.; Wang, Q.; Zheng, L.; Li, H.; Xu, J. Near-infrared to mid-infrared photoluminescence of Bi2O3-GeO2 binary glasses. Opt. Lett. 2012, 37, 4260. [Google Scholar] [CrossRef]
- Płonska, M.; Plewa, J. Crystallization of GeO2-Al2O3-Bi2O3 glass. Crystals 2020, 10, 522. [Google Scholar] [CrossRef]
- Rojas, S.S.; De Souza, J.E.; Andreeta, M.R.B.; Hernandes, A.C. Influence of ceria addition on thermal properties and local structure of bismuth germanate glasses. J. Non-Cryst. Solids 2010, 356, 2942–2946. [Google Scholar] [CrossRef]
- Aldica, G.; Polosan, S. Investigations of the non-isothermal crystallization of Bi4Ge3O12 (2:3) glasses. J. Non-Cryst. Solids 2012, 358, 1221–1227. [Google Scholar] [CrossRef]
- Shi, Z.; Lv, S.; Tang, G.; Tang, J.; Jiang, L.; Qian, Q.; Zhou, S.; Yang, Z. Multiphase transition toward colorless bismuth-germanate scintillating glass and fiber for radiation detection. ACS Appl. Mater. Interfaces 2020, 12, 17752–17759. [Google Scholar] [CrossRef]
- Bermeshev, T.V.; Zhereb, V.P.; Bundin, M.P.; Yasinsky, A.S.; Yushkova, O.V.; Voroshilov, D.S.; Zaloga, A.N.; Kovaleva, A.A.; Yakiv’yuk, O.V.; Samoilo, A.S.; et al. Synthesis of Bi2Ge3O9. Inorg. Mater. 2022, 58, 1274–1283. [Google Scholar] [CrossRef]
- Jiang, X.; Su, L.; Yu, P.; Guo, X.; Tang, H.; Xu, X.; Zheng, L.; Li, H.; Xu, J. Broadband photoluminescence of Bi2O3-GeO2 binary systems: Glass, glass-ceramics and crystals. Laser Phys. 2013, 23, 105812. [Google Scholar] [CrossRef]
- Gökçe, M.; Koçyiğit, D. Structural and optical properties of Gd3+ doped Bi2O3-GeO2 glasses and glass-ceramics. Mater. Res. Exp. 2018, 6, 025203. [Google Scholar] [CrossRef]
- Dimesso, L.; Gnappi, G.; Montenero, A.; Fabeni, P.; Pazzi, G.P. The crystallization behaviour of bismuth germanate glasses. J. Mater. Sci. 1991, 26, 4215–4219. [Google Scholar] [CrossRef]
- Stepanova, I.V.; Petrova, O.B.; Korolev, G.M.; Guslistov, M.I.; Zykova, M.P.; Avetisov, R.I.; Avetissov, I.C. Synthesis of the Bi2GeO5 ferroelectric crystalline phase from a nonstoichiometric batch. Phys. Status Solidi A 2022, 219, 2100666. [Google Scholar] [CrossRef]


| Sample ID | Bi Content (mol%) | Ge Content (mol%) | O Content (mol%) | Al Content (mol%) | ||||
|---|---|---|---|---|---|---|---|---|
| Raw | EDS | Raw | EDS | Raw | EDS * | Raw | EDS | |
| 10-90 | 6.25 | 8.51 ± 0.29 | 28.13 | 25.89 ± 0.13 | 65.62 | 65.18 | 0.00 | 0.42 ± 0.02 |
| 15-85 | 9.09 | 10.91 ± 0.37 | 25.76 | 22.35 ± 0.11 | 65.15 | 63.25 | 0.00 | 3.49 ± 0.14 |
| 20-80 | 11.76 | 10.52 ± 0.36 | 23.53 | 21.77 ± 0.11 | 64.71 | 65.97 | 0.00 | 1.74 ± 0.07 |
| 25-75 | 14.29 | 13.54 ± 0.46 | 21.43 | 18.21 ± 0.09 | 64.28 | 63.62 | 0.00 | 4.63 ± 0.18 |
| 30-70 | 16.67 | 15.43 ± 0.52 | 19.45 | 16.36 ± 0.08 | 63.88 | 63.30 | 0.00 | 4.90 ± 0.19 |
| 35-65 | 18.92 | 17.01 ± 0.58 | 17.57 | 14.22 ± 0.07 | 63.51 | 62.84 | 0.00 | 5.93 ± 0.23 |
| 40-60 | 21.05 | 18.61 ± 0.63 | 15.79 | 12.78 ± 0.07 | 63.15 | 62.58 | 0.00 | 6.03 ± 0.24 |
| 45-55 | 23.08 | 20.93 ± 0.71 | 14.10 | 11.35 ± 0.06 | 62.82 | 62.22 | 0.00 | 5.50 ± 0.21 |
| 50-50 | 25.00 | 22.80 ± 0.78 | 12.50 | 9.76 ± 0.05 | 62.50 | 61.90 | 0.00 | 5.54 ± 0.22 |
| Sample ID | Tg, °C | Tx1, °C | Tx2, °C | Tx3, °C |
|---|---|---|---|---|
| 5-95 | 470 | 631 | 662 | 690 |
| 10-90 | 460 | 651 | 719 | – |
| 15-85 | 461 | 650 | 707 | – |
| 20-80 | 469 | 696 | 744 | – |
| 25-75 | 470 | 663 | 689 | 721 |
| 30-70 | 473 | 633 | 712 | – |
| 35-65 | 478 | 647 | 663 | 692 |
| 40-60 | 469 | 624 | 657 | – |
| 45-55 | 441 | 518 | 575 | 654 |
| 50-50 | 450 | 548 | 598 | 657 |
| Sample | Density (g/cm3) | Refractive Index at 589 nm |
|---|---|---|
| 0-100 * | 4.25 | |
| 5-95 | 4.085 ± 0.005 | 1.68 ± 0.01 |
| 10-90 | 4.645 ± 0.005 | 1.76 ± 0.01 |
| 15-85 | 5.185 ± 0.005 | 1.80 ± 0.04 |
| 20-80 | 5.370 ± 0.005 | 1.86 ± 0.06 |
| 25-75 | 5.945 ± 0.005 | 2.06 ± 0.06 |
| 30-70 | 6.015 ± 0.005 | 2.08 ± 0.02 |
| 35-65 | 6.330 ± 0.005 | 2.10 ± 0.04 |
| 40-60 | 6.685 ± 0.005 | 2.12 ± 0.02 |
| 45-55 | 6.760 ± 0.005 | 2.14 ± 0.04 |
| 50-50 | 7.085 ± 0.005 | 2.14 ± 0.04 |
| 100-0 * | 8.90 |
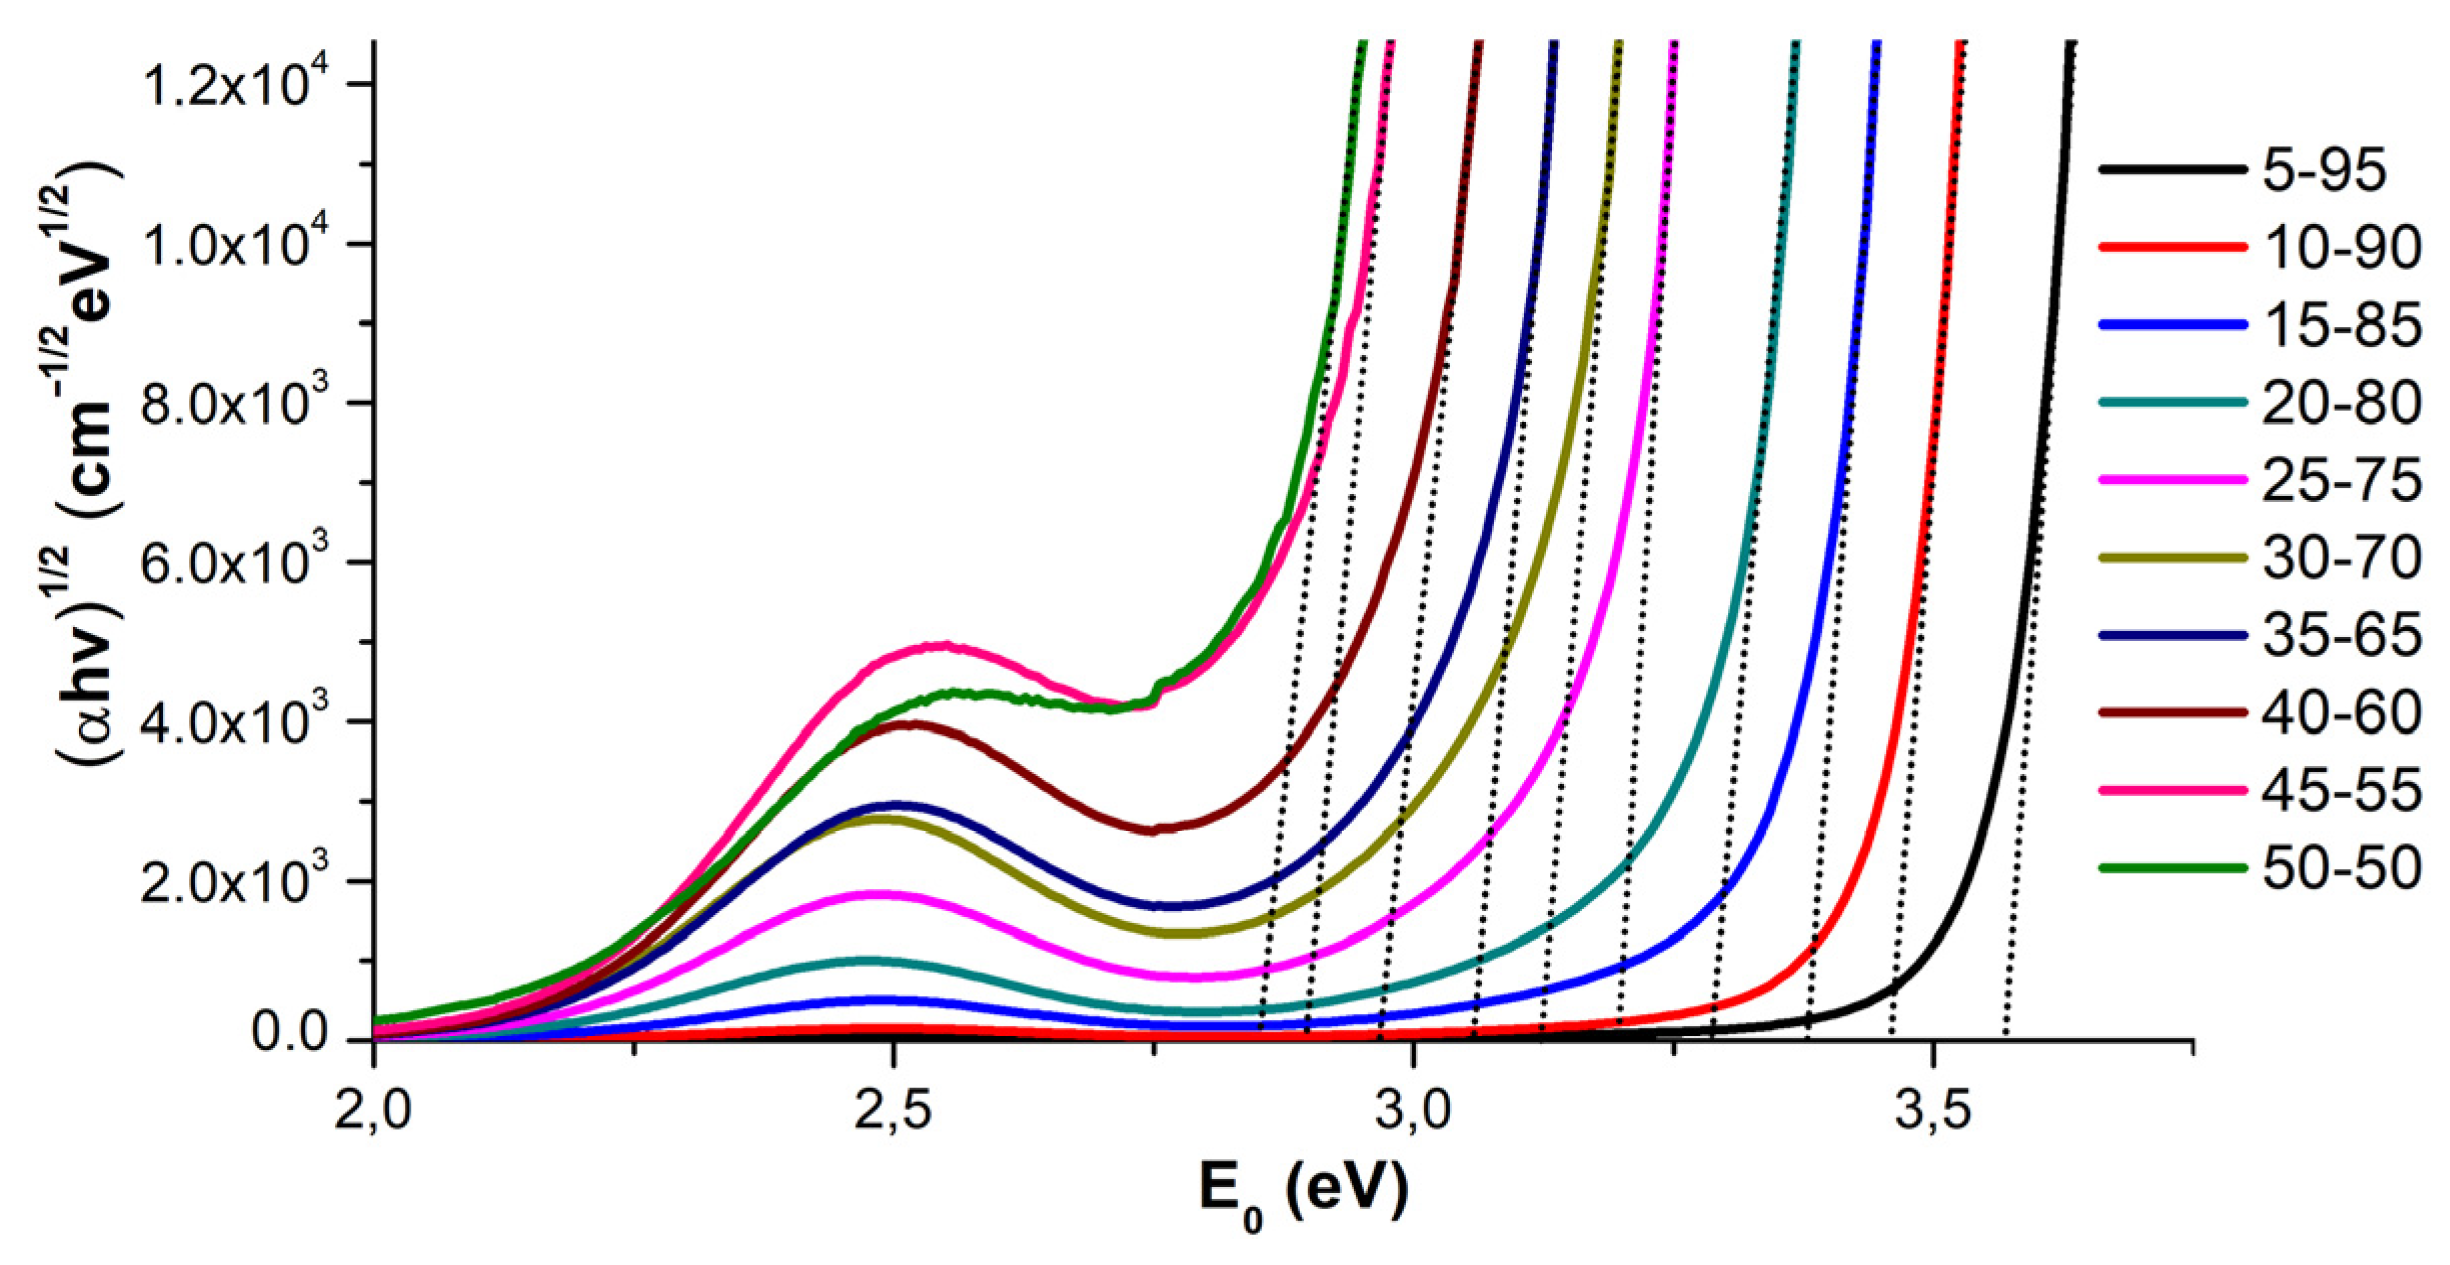
| Sample ID | Eg (eV) * |
|---|---|
| 5-95 | 3.54 |
| 10-90 | 3.47 |
| 15-85 | 3.35 |
| 20-80 | 3.28 |
| 25-75 | 3.20 |
| 30-70 | 3.08 |
| 35-65 | 3.04 |
| 40-60 | 2.95 |
| 45-55 | 2.86 |
| 50-50 | 2.82 |
Disclaimer/Publisher’s Note: The statements, opinions and data contained in all publications are solely those of the individual author(s) and contributor(s) and not of MDPI and/or the editor(s). MDPI and/or the editor(s) disclaim responsibility for any injury to people or property resulting from any ideas, methods, instructions or products referred to in the content. |
© 2023 by the authors. Licensee MDPI, Basel, Switzerland. This article is an open access article distributed under the terms and conditions of the Creative Commons Attribution (CC BY) license (https://creativecommons.org/licenses/by/4.0/).
Share and Cite
Serkina, K.; Stepanova, I.; Pynenkov, A.; Uslamina, M.; Nishchev, K.; Boldyrev, K.; Avetisov, R.; Avetissov, I. Bismuth-Germanate Glasses: Synthesis, Structure, Luminescence, and Crystallization. Ceramics 2023, 6, 1559-1572. https://doi.org/10.3390/ceramics6030097
Serkina K, Stepanova I, Pynenkov A, Uslamina M, Nishchev K, Boldyrev K, Avetisov R, Avetissov I. Bismuth-Germanate Glasses: Synthesis, Structure, Luminescence, and Crystallization. Ceramics. 2023; 6(3):1559-1572. https://doi.org/10.3390/ceramics6030097
Chicago/Turabian StyleSerkina, Ksenia, Irina Stepanova, Aleksandr Pynenkov, Maria Uslamina, Konstantin Nishchev, Kirill Boldyrev, Roman Avetisov, and Igor Avetissov. 2023. "Bismuth-Germanate Glasses: Synthesis, Structure, Luminescence, and Crystallization" Ceramics 6, no. 3: 1559-1572. https://doi.org/10.3390/ceramics6030097