
Bayesian Network Structural Learning Using Adaptive Genetic Algorithm with Varying Population Size

Department of Electrical and Computing Engineering, University of São Paulo, São Carlos 13566-590, SP, Brazil
*
Author to whom correspondence should be addressed.
Mach. Learn. Knowl. Extr. 2023, 5(4), 1877-1887; https://doi.org/10.3390/make5040090
Submission received: 3 October 2023
/
Revised: 16 November 2023
/
Accepted: 28 November 2023
/
Published: 1 December 2023
(This article belongs to the Section Learning)
Abstract
:A Bayesian network (BN) is a probabilistic graphical model that can model complex and nonlinear relationships. Its structural learning from data is an NP-hard problem because of its search-space size. One method to perform structural learning is a search and score approach, which uses a search algorithm and structural score. A study comparing 15 algorithms showed that hill climbing (HC) and tabu search (TABU) performed the best overall on the tests. This work performs a deeper analysis of the application of the adaptive genetic algorithm with varying population size (AGAVaPS) on the BN structural learning problem, which a preliminary test showed that it had the potential to perform well on. AGAVaPS is a genetic algorithm that uses the concept of life, where each solution is in the population for a number of iterations. Each individual also has its own mutation rate, and there is a small probability of undergoing mutation twice. Parameter analysis of AGAVaPS in BN structural leaning was performed. Also, AGAVaPS was compared to HC and TABU for six literature datasets considering F1 score, structural Hamming distance (SHD), balanced scoring function (BSF), Bayesian information criterion (BIC), and execution time. HC and TABU performed basically the same for all the tests made. AGAVaPS performed better than the other algorithms for F1 score, SHD, and BIC, showing that it can perform well and is a good choice for BN structural learning.
1. Introduction
A Bayesian network (BN) is a probabilistic graphical model that can model complex and nonlinear relationships between variables [1,2,3,4]. It is composed of a directed acyclic graph (DAG) and conditional probabilities tables (CPTs) that are used to quantify the dependence relationships between random variables defined as nodes [1,5,6,7]. BNs have been applied to a variety of research fields, including water quality [3], medical problems [2], network traffic prediction [8], and risk assessment [9].
To learn the BN model from data, the DAG (also called structure) must first be learned from it [10]. BN structure learning is challenging because the search space has a super-exponential character [11,12]. This characteristic makes the structural learning of BN an NP-hard [13] problem [11]. Three different kinds of methods can achieve structural learning: constraint-based (CB) methods, search and score methods (also called score-based (SB)), and hybrid methods, that combine the two previous methods [10,14,15]. The CB methods are based on applying conditional independence (CI) tests to the data. In contrast, the SB methods are based on a search throughout the space of possible structures using a score function to determine the fit of the structures to the data [10,15].
There are recent papers that tackle BN structural learning methods. In [16], a review of 74 algorithms, including CB and SB methods, was performed. It described these algorithms, including state-of-the-art, well-established, and prototypical approaches, and discussed how they were evaluated and compared. In addition to that, it also discussed approaches to deal with data noise and approaches on how to include expert knowledge in structural learning.
Complementing this work, in [14], 15 structural learning algorithms were investigated, and their performance was compared. Four CB algorithms were tested (PC-Stable, FCI, Inter-IAMB, and GS), six SB algorithms (FGES, HC, TABU, ILP, WINASOBS, and NOTEARS), and five hybrid methods (GFCI, RFCI-BSC, MMHC, H2PC, and SaiyanH). The experiments showed that HC and TABU were the algorithms that performed the best in most of the tests made. Hill climbing (HC) is a gradient ascent algorithm that searches the space of DAGs by adding, removing, or inverting edges [14,17]. The TABU algorithm is an improved version of HC in which candidates considered on previous iterations are not considered again to search new regions [14,17].
Recent works have also proposed new algorithms to perform BN structural learning. A discrete firefly optimization algorithm is proposed in [18]. The firefly algorithm imitates the behavior of fireflies being attracted to light [18]. In [19], a Prufer-leaf coding genetic algorithm was proposed. This algorithm prioritizes connection to nodes with high mutual information [19]. Finally, in [20], the adaptive genetic algorithm with varying population size (AGAVaPS) is proposed. In this algorithm, each solution has its own mutation rate and number of iterations that will be a part of the population. This algorithm was tested for different applications and performed well in problems with huge search spaces. A preliminary test on BN structural learning was also carried out and showed that it could be a good algorithm to be used on it [20].
In this paper, a deeper analysis of the application of AGAVaPS in BN structural learning is carried out. A small-scale analysis of different algorithm parameters was performed. Finally, AGAVaPS was compared to HC and TABU, considering datasets from the literature with different sizes. In this comparison, the score value, F1 score, structural Hamming distance (SHD), balanced scoring function (BSF) and execution time were considered. Thirty executions for each algorithm were performed, and the algorithms’ performance was compared.
2. Materials and Methods
This section describes the algorithms used and the tests and analysis performed.
2.1. Algorithms
For the comparison, three algorithms were considered: AGAVaPS, the algorithm under analysis, and HC and TABU, which are used for comparison. These two algorithms were chosen based on the results of [14] that showed that HC and TABU were the best-performing algorithms overall in the tests.
2.1.1. Genetic Algorithm Terminology
In genetic algorithms (GAs), a population of possible solutions is evolved to perform a search over the problem search space. A solution in the population can be named an individual. At each iteration, solutions are selected to create new solutions. These solutions can be named parents. The parents undergo crossover or reproduction to generate some new solutions. These new solutions can be named descendants or children. The children undergo mutation, a process that changes a part of these solutions to increase the randomness of the search. Then, these new solutions and the current population are combined, creating a new population. A more extensive explanation of these terminologies and an example can be found in [21].
In this process, many parameters are used, such as reproduction rate, which affects the reproduction process, mutation rate, which affects the mutation process, and the initial population size. Some of these parameters are selected to improve the search in a specific problem, and some are determined from the project to result in an algorithm behavior. The specific parameters for AGAVaPS, their meaning, and how many of them were chosen can be seen in [20], the article where AGAVaPS was proposed.
2.1.2. Adaptive Genetic Algorithm with Varying Population Size (AGAVaPS)
AGAVaPS was proposed in [20], and a detailed explanation of its procedure and parameters can be seen in this work. A shorter description of the algorithm and details of how it was used in this article can be seen below.
On AGAVaPS, each individual has its own mutation rate; there is a slight possibility that an individual will undergo mutation twice, and each individual has a life parameter that determines the number of iterations that the individual will undergo in the population.
The mutation rate for each individual is sampled from a normal distribution with mean and standard deviation , with the mutation rate being in the interval . is updated every iteration considering the last value of and , the mean mutation rate of the current population. The update follows the equation:
is a sampling of a uniform distribution between 0.1 and 0.3. This variation enables the algorithm to balance between exploration and exploitation.
The mutation procedure is performed considering Equation (2). There is a 15% chance of an individual undergoing mutation twice. This double mutation increases the exploration capacity of the algorithm. This procedure is performed by sampling a value r from and following Equation (2).
Regarding the life parameter, its value is obtained by
where is a sampling of a normal distribution with and , and life . At the end of each iteration, the life of the individuals is decremented by one. The best 10% of individuals are spared from the decrement. All individuals that reach a zero value of life are removed from the population. Because of this life parameter, the population size is not constant.
For this application, the multi-objective version of AGAVaPS was used. For this, for each parent selection, one of the objectives is randomly chosen to be used. The protection of the best 10% of individuals was achieved by equally dividing this protection between the objectives being used in the search. The parent selection was achieved using a tournament of size 3, with two parents generating one individual. The reproduction rate () controls the number of new individuals that are generated at each iteration.
The mutation was performed by randomly adding, removing or inverting an edge. Meanwhile, reproduction was performed by obtaining the common edges between the parents and adding a random number of the different edges while keeping the structure a DAG. Also, the first population was created by selecting a random number of edges and adding them to an empty structure as long as it did not create a cycle. When randomly selecting edges for adding in the first population and in the mutation procedure, the mutual information (MI) between the variables was used as the weight for the sampling.
One of the objectives used was the Bayesian information criterion (BIC). This score is based on the Schwarz information criterion. Its objective is to minimize the conditional entropy of the variables considering their parents [22]. This score is a maximization score of negative values. The other objective used was the number of edges. This objective was used to make the algorithm search smaller structures, since structures with a higher number of edges tend to have better scores. However, structures with fewer edges often have very close scores to those with more straightforward and more desirable structures.
A small-scale analysis of different algorithm parameters was performed. In this analysis, and were varied, and ten executions were performed for the datasets used in the analysis. The mean score was used to rank the performance of each parameter configuration for each dataset. Then, a mean rank was also employed to evaluate which parameters were best for the algorithm comparison. Table 1 shows the values tested for each parameter.
2.1.3. Hill Climbing (HC)
HC is a gradient ascent algorithm that tests all possible changes considering adding, removing, or inverting an edge. The change that brings the most significant increase in the objective function is selected. The search is halted when all possible changes to the DAG currently under analysis would only decrease the value of the objective function compared to the current DAG score. The HC algorithm is often used for performing BN structural learning [7,14]. The pgmpy implementation HillClimbing was used for the tests with [23]. The score used was also BIC for consistency of comparison.
2.1.4. Tabu Search (TABU)
TABU is a variant of HC where a k number of the last structures evaluated are not re-evaluated. This restriction is to increase the search for new regions. For the tests, the pgmpy implementation HillClimbing was used with [23]. The score used was also BIC for consistency of comparison.
2.2. Datasets
2.3. Test Procedure
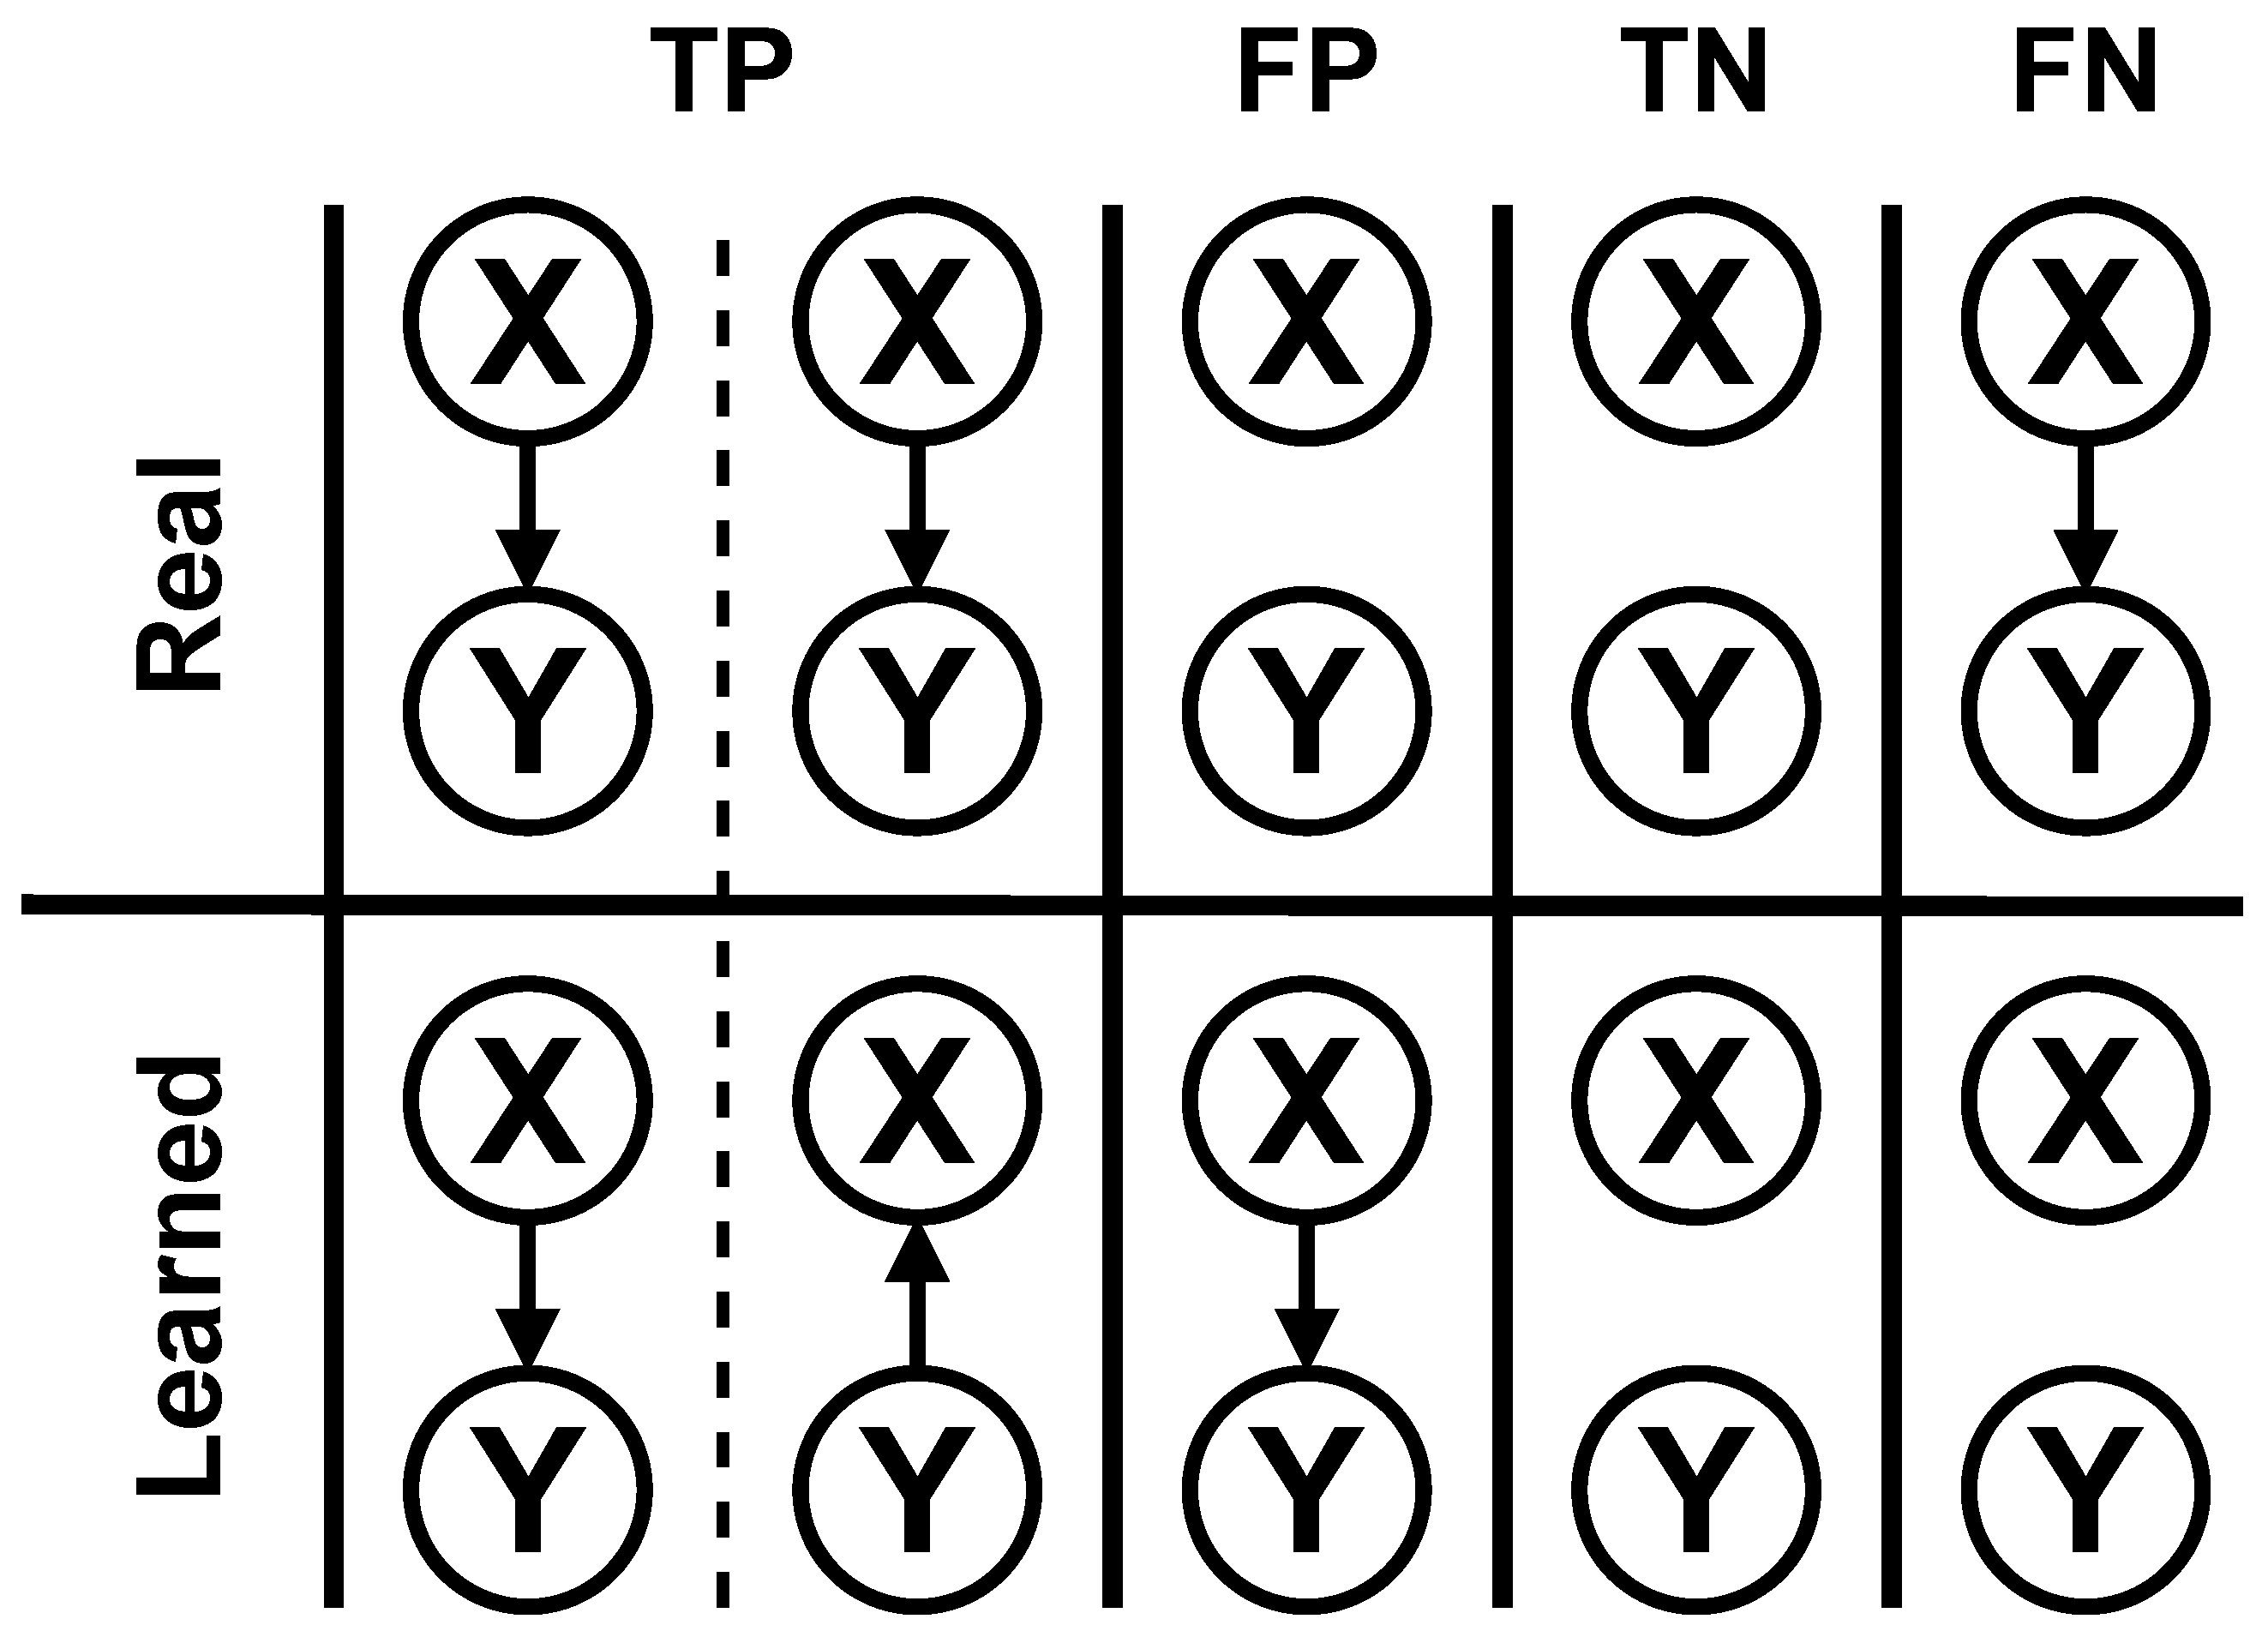
All three algorithms were executed for all the datasets thirty times for the test. For each execution, five metrics were measured and saved to compare the algorithms. These metrics were the BIC score of the best structure found, execution time, F1 score, structural Hamming distance (SHD), and balanced scoring function (BSF). F1, SHD, and BSF use the concepts of true positives (TPs), false positives (FPs), true negatives (TNs) and false negatives (FNs). An example of how these concepts are considered in BN structure learning can be seen in Figure 1. For the AGAVaPS, which is multi-objective, all the solutions in the final Pareto set were measured for the metrics, and the highest value was used for comparison. This decision was made because when a multi-objective algorithm is used, the user can choose whichever solution in the Pareto set it thinks is the best.
F1 is the harmonic mean between precision and recall and is given by Equation (4) [25]. It ranges from 0 to 1, where 1 is the highest score and 0 is the lowest.
The SHD score compares the structure learned to the real networks. It penalizes having extra edges, inverted edges, and not having edges from the real network [26]. The SHD is given by Equation (5) [27]. The best score for the SHD is 0.
The BSF score is a score that removes the bias of the SHD score and is given by Equation (6), where a is the number of edges of the real network, and i is the independence of the real network that is calculated using Equation (7), where is the number of variables [27]. The BSF score ranges from −1 to 1, where 1 is the highest score and −1 is the lowest.
All the executions were performed on a computer running on Ubuntu 22.04.3 LTS with processor Intel Core i7-8750H and 12 GB of RAM. For the datasets Asia, Coronary, and Sachs, the value of 10,000 evaluations for the AGAVaPS was kept for this test. Meanwhile, the number of evaluations was increased for the Alarm, Hailfinder, and Insurance datasets, which have much bigger search spaces (bigger than possible DAGs). The number of evaluations for the AGAVaPS for each dataset can be seen in Table 3. Table 3 shows the max in-degree used in the structural learning. The max in-degree limit is used to limit the CPT size, which can cause memory overflow if not limited. This limitation is effective by limiting the number of parents a variable can have (in-degree) as the CPT size is given by
where is the number of states of the variable, p is the number of parents of the variable, and are the number of states of the parent variables [28]. These maximum in-degree values were used for all the algorithms.
The results were compared pairwise using the Wilcoxon signed-rank test with a significance level 0.05. The Wilcoxon test tests if two observations from different populations have a median difference between them equal to zero [29]. This test was used to group the algorithms by performance and rank them. If the Wilcoxon test indicated that the algorithms had the same performance, the algorithms received the same rank. The mean rank for each algorithm in all test cases was also calculated and used to compare the performance of the algorithms.
3. Results and Discussion
In this section, the results obtained are presented and discussed. The results of the AGAVaPS parameter analysis can be seen in Table 4 and Table 5. Table 4 shows the mean BIC score of each parameter combination for the datasets tested, considering the highest BIC score of the structures included in the Pareto set. Table 5 shows the ranks of each parameter combination for the datasets tested considering the values from Table 4. From the results, it can be seen that in many of the cases, the difference between them was minimal. The best combination was and , performing best for four test cases. Thus, and are the parametrizations used for the comparison test with the other algorithms.
The results of the comparison between the algorithms can be seen in Table 6, Table 7, Table 8, Table 9 and Table 10. In Table 6, Table 7 and Table 8, the mean, standard deviation, and rank of the F1, SHD, and BSF metrics can be seen. In Table 9 and Table 10, the mean, standard deviation, and rank of the BIC score and execution time can be seen. For each dataset and metric, the best value obtained is highlighted, and in the row “Mean Rank” the mean rank for the algorithm for all test cases is shown.
When considering the F1 score, the algorithms showed a tied performance for half of the test cases. Despite that, AGAVaPS performed better for the other half of the test cases and ranked first for all the tests. Interestingly, HC and TABU performed the same for all tests, with no improvement observed when using the tabu list.
When considering the SHD metric, AGAVaPS was again the best-performing algorithm, ranking first for all the test cases. The algorithms were all tied in rank for Coronary, the smallest test case, with six nodes. In addition to that, HC and TABU were tied for all test cases.
When considering the BSF metric, all algorithms were tied in the overall mean rank. Again, HC and TABU were tied for all the test cases. Moreover, AGAVaPS outperformed the other algorithms for three test cases (Asia, Sachs, and Sachs 2 ), and they were all tied for the first rank for Coronary. These results indicate that AGAVaPS deals better with datasets with fewer nodes when considering the BSF. Meanwhile, HC and TABU performed better in the datasets that had a higher number of variables.
When considering the BIC score, it can be seen that AGAVaPS performed better than the other two algorithms for four test cases (Asia, Coronary, Sachs, and Sachs 2 ), and all algorithms were tied for Insurance. The datasets for which AGAVaPS performed best all have 27 nodes or less, indicating that AGAVaPS could have performed better for datasets with more variables. However, this may be a result of AGAVaPS not evaluating enough structures; this is especially true for the Hailfinder dataset, where the execution time of AGAVaPS is closer to the execution time of HC and TABU than in other test cases and where the search space is much bigger than the other datasets. Also, again, HC and TABU had the same ranks for all the test cases.
When looking at the execution time, TABU was faster for all datasets. However, it was tied with HC in five of seven test cases. This result was expected since the HC and TABU are much simpler search algorithms than AGAVaPS.
4. Conclusions
From the parameter test, it was indicated that and was the best overall parameter combination to be used when performing BN structural learning. From the comparative test between HC, TABU, and AGAVaPS, it was seen that for basically all metrics, HC and TABU performed the same, having a difference in only one of the execution times. This result means no relevant difference between HC and TABU was seen in this work. Looking at the proposed method, AGAVaPS performed better for the F1 score, SHD, and BIC score.
For the F1 score and SHD, AGAVaPS was ranked first for all test cases, tying with other algorithms for some of the tests. For the BIC score, AGAVaPS was ranked first in test cases with 27 nodes or less, showing that it could not beat HC and TABU for the bigger test cases. However, there may be a need to let the algorithm evaluate enough structures, especially for the Hailfinder dataset, where the execution of AGAVaPS was relatively close to the execution time of HC and TABU compared to other test cases. For BSF, all algorithms were tied as the best-performing algorithms. AGAVaPS performed the best for test cases with a smaller number of nodes.
This better performance of the AGAVaPS over HC and TABU can be associated with the strong diversity preservation mechanism that AGAVaPS has, and that is something necessary to search complex spaces and escape local optima. The high capacity for coverage of the search space of the AGAVaPS was seen and better analyzed in [20]. In [20], it was also seen that the AGAVaPS has a behavior of changing between global and local search according to what is achieving better results. This behavior could be one of the reasons that AGAVaPS obtained better results than HC and TABU for datasets with a smaller number of nodes.
When considering the execution time, the results were that HC and TABU were the quickest. This result was expected, as HC and TABU are much simpler algorithms. Although AGAVaPS takes longer, since the BN structural learning is only performed once in most cases, taking more time to learn a better structure can be considered when modeling a system. AGAVaPS performed very well, being the best-performing algorithm for three out of four structure quality metrics. AGAVaPS performed poorer on datasets with many variables for two of the metrics. With this in mind, future work will study how to improve AGAVaPS’s performance in this kind of dataset, exploring the form of the problem definition, reproduction, and mutation process, and parameter analysis for datasets with many variables. Another thing to explore is using parallelism in AGAVaPS to speed it up and thus obtain a better execution time.
Author Contributions
Conceptualization, R.R.M.R. and C.D.M.; methodology, R.R.M.R.; software, R.R.M.R.; validation, R.R.M.R.; formal analysis, R.R.M.R.; investigation, R.R.M.R.; resources, R.R.M.R. and C.D.M.; data curation, R.R.M.R.; writing—original draft preparation, R.R.M.R.; writing—review and editing, R.R.M.R. and C.D.M.; visualization, R.R.M.R.; supervision, C.D.M.; project administration, C.D.M.; funding acquisition, R.R.M.R. and C.D.M. All authors have read and agreed to the published version of the manuscript.
Funding
This research and APC was funded by Sao Paulo Research Foundation (FAPESP) grant number #2018/23139-8.
Data Availability Statement
All the datasets used were obtained from the R package bnlearn that can be found in https://www.bnlearn.com/ (accessed on 1 August 2023). All datasets used and the AGAVaPS code are also available at https://doi.org/10.5281/zenodo.10222540 (accessed on 1 August 2023).
Conflicts of Interest
The authors declare no conflict of interest.
References
- Fang, W.; Zhang, W.; Ma, L.; Wu, Y.; Yan, K.; Lu, H.; Sun, J.; Wu, X.; Yuan, B. An efficient Bayesian network structure learning algorithm based on structural information. Swarm Evol. Comput. 2023, 76, 101224. [Google Scholar] [CrossRef]
- Tian, T.; Kong, F.; Yang, R.; Long, X.; Chen, L.; Li, M.; Li, Q.; Hao, Y.; He, Y.; Zhang, Y.; et al. A Bayesian network model for prediction of low or failed fertilization in assisted reproductive technology based on a large clinical real-world data. Reprod. Biol. Endocrinol. 2023, 21, 8. [Google Scholar] [CrossRef]
- Bertone, E.; Rousso, B.Z.; Kufeji, D. A probabilistic decision support tool for prediction and management of rainfall-related poor water quality events for a drinking water treatment plant. J. Environ. Manag. 2023, 332, 117209. [Google Scholar] [CrossRef]
- Jackson-Blake, L.A.; Clayer, F.; Haande, S.; Sample, J.E.; Moe, S.J. Seasonal forecasting of lake water quality and algal bloom risk using a continuous Gaussian Bayesian network. Hydrol. Earth Syst. Sci. 2022, 26, 3103–3124. [Google Scholar] [CrossRef]
- Hao, J.; Yue, K.; Zhang, B.; Duan, L.; Fu, X. Transfer learning of Bayesian network for measuring QoS of virtual machines. Appl. Intell. 2021, 51, 8641–8660. [Google Scholar] [CrossRef]
- Luo, G.; Zhao, B.; Du, S. Causal inference and Bayesian network structure learning from nominal data. Appl. Intell. 2019, 49, 253–264. [Google Scholar] [CrossRef]
- Koller, D.; Friedman, N. Probabilistic Graphical Models: Principles and Techniques; MIT Press: Cambridge, MA, USA, 2009. [Google Scholar]
- Shiomoto, K.; Otoshi, T.; Murata, M. A novel network traffic prediction method based on a Bayesian network model for establishing the relationship between traffic and population. Ann. Telecommun. 2023, 78, 53–70. [Google Scholar] [CrossRef]
- Xu, Q.; Liu, H.; Song, Z.; Dong, S.; Zhang, L.; Zhang, X. Dynamic risk assessment for underground gas storage facilities based on Bayesian network. J. Loss Prev. Process. Ind. 2023, 82, 104961. [Google Scholar] [CrossRef]
- Neapolitan, R. Learning Bayesian Networks; Pearson Prentice Hall: Upper Saddle River, NJ, USA, 2003. [Google Scholar] [CrossRef]
- Gross, T.J.; Bessani, M.; Junior, W.D.; Araújo, R.B.; Vale, F.A.C.; Maciel, C.D. An analytical threshold for combining Bayesian Networks. Knowl. Based Syst. 2019, 175, 36–49. [Google Scholar] [CrossRef]
- Robinson, R.W. Counting unlabeled acyclic digraphs. In Combinatorial Mathematics V, Proceedings of the Fifth Australian Conference, Melbourne, Australia, 24–26 August 1976; Little, C.H.C., Ed.; Springer: Berlin/Heidelberg, Germany, 1977; pp. 28–43. [Google Scholar]
- Alridha, A.; Salman, A.M.; Al-Jilawi, A.S. The Applications of NP-hardness optimizations problem. J. Phys. Conf. Ser. 2021, 1818, 012179. [Google Scholar] [CrossRef]
- Constantinou, A.C.; Liu, Y.; Chobtham, K.; Guo, Z.; Kitson, N.K. Large-scale empirical validation of Bayesian Network structure learning algorithms with noisy data. Int. J. Approx. Reason. 2021, 131, 151–188. [Google Scholar] [CrossRef]
- Contaldi, C.; Vafaee, F.; Nelson, P.C. Bayesian network hybrid learning using an elite-guided genetic algorithm. Artif. Intell. Rev. 2019, 52, 245–272. [Google Scholar] [CrossRef]
- Kitson, N.K.; Constantinou, A.C.; Guo, Z.; Liu, Y.; Chobtham, K. A survey of Bayesian Network structure learning. Artif. Intell. Rev. 2023, 56, 8721–8814. [Google Scholar] [CrossRef]
- Scutari, M.; Vitolo, C.; Tucker, A. Learning Bayesian networks from big data with greedy search: Computational complexity and efficient implementation. Stat. Comput. 2021, 29, 1095–1108. [Google Scholar] [CrossRef]
- Wang, X.; Ren, H.; Guo, X. A novel discrete firefly algorithm for Bayesian network structure learning. Knowl. Based Syst. 2022, 242, 108426. [Google Scholar] [CrossRef]
- Yu, Y.; Luo, S.; He, Y.; Huang, H.; Zhang, W. A Prufer-leaf Coding Genetic Algorithm for Bayesian Network Structure Learning. In Proceedings of the 2022 Global Conference on Robotics, Artificial Intelligence and Information Technology (GCRAIT), Chicago, IL, USA, 30–31 July 2022; pp. 173–176. [Google Scholar] [CrossRef]
- Ribeiro, R.R.M.; Maciel, C.D. AGAVaPS—Adaptive Genetic Algorithm with Varying Population Size. In Proceedings of the 2022 IEEE Congress on Evolutionary Computation (CEC), Padua, Italy, 18–23 July 2022; pp. 1–8. [Google Scholar] [CrossRef]
- Bies, R.R.; Muldoon, M.F.; Pollock, B.G.; Manuck, S.; Smith, G.; Sale, M.E. A Genetic Algorithm-Based, Hybrid Machine Learning Approach to Model Selection. J. Pharmacokinet. Pharmacodyn. 2006, 33, 195–221. [Google Scholar] [CrossRef]
- de Campos, L.M. A Scoring Function for Learning Bayesian Networks Based on Mutual Information and Conditional Independence Tests. J. Mach. Learn. Res. 2006, 7, 2149–2187. [Google Scholar]
- Ankan, A.; Panda, A. pgmpy: Probabilistic graphical models using python. In Proceedings of the 14th Python in Science Conference (SCIPY 2015), Austin, TX, USA, 6–12 July 2015. [Google Scholar]
- Scutari, M. Learning Bayesian Networks with the bnlearn R Package. J. Stat. Softw. 2010, 35, 1–22. [Google Scholar] [CrossRef]
- Chicco, D.; Jurman, G. The advantages of the Matthews correlation coefficient (MCC) over F1 score and accuracy in binary classification evaluation. BMC Genom. 2020, 21, 6. [Google Scholar] [CrossRef]
- Tsamardinos, I.; Brown, L.E.; Aliferis, C.F. The max-min hill-climbing Bayesian network structure learning algorithm. Mach. Learn. 2006, 65, 31–78. [Google Scholar] [CrossRef]
- Constantinou, A.C. Evaluating structure learning algorithms with a balanced scoring function. arXiv 2020. [Google Scholar] [CrossRef]
- Rohmer, J. Uncertainties in conditional probability tables of discrete Bayesian Belief Networks: A comprehensive review. Eng. Appl. Artif. Intell. 2020, 88, 103384. [Google Scholar] [CrossRef]
- Ohyver, M.; Moniaga, J.V.; Sungkawa, I.; Subagyo, B.E.; Chandra, I.A. The Comparison Firebase Realtime Database and MySQL Database Performance using Wilcoxon Signed-Rank Test. Procedia Comput. Sci. 2019, 157, 396–405. [Google Scholar] [CrossRef]
Figure 1.
Examples of true positives (TPs), false positives (FPs), true negatives (TNs), and false negatives (FNs) for BN structural learning used for calculating F1 score, SHD, and BSF for the comparison of the performance of the search algorithms.
Figure 1.
Examples of true positives (TPs), false positives (FPs), true negatives (TNs), and false negatives (FNs) for BN structural learning used for calculating F1 score, SHD, and BSF for the comparison of the performance of the search algorithms.

Table 1.
Parameter values used in the AGAVaPS parameter analysis for BN structural learning, including the initial mutation mean (), reproduction rate (), and number of evaluations.
Table 1.
Parameter values used in the AGAVaPS parameter analysis for BN structural learning, including the initial mutation mean (), reproduction rate (), and number of evaluations.
| Parameter | Values |
|---|---|
| 0.1, 0.3, and 0.5 | |
| 0.3 and 0.5 | |
| Number of evaluations | 10,000 |
Table 2.
Dataset parameters, including number of nodes (number of variables), number of edges, which is the number of edges of the expected structure, number of samples of the dataset, and the number of possible DAGs that the BN structure search space for the dataset has.
Table 2.
Dataset parameters, including number of nodes (number of variables), number of edges, which is the number of edges of the expected structure, number of samples of the dataset, and the number of possible DAGs that the BN structure search space for the dataset has.
| Dataset | Number of Nodes | Number of Edges | Number of Samples | Number of DAGs |
|---|---|---|---|---|
| Alarm | 37 | 46 | 20,000 | 3.01 |
| Asia | 8 | 8 | 5000 | 7.84 |
| Coronary | 6 | 9 | 1841 | 3.78 |
| Hailfinder | 56 | 66 | 20,000 | ≫2.11 |
| Insurance | 27 | 52 | 20,000 | 1.90 |
| Sachs | 11 | 17 | 100,000 | 3.16 |
| Sachs 2 | 11 | 17 | 20,000 | 3.16 |
Table 3.
Maximum in-degree value used by all algorithms for each dataset and number of evaluations used for AGAVaPS for each dataset for comparison with the other search algorithms.
Table 3.
Maximum in-degree value used by all algorithms for each dataset and number of evaluations used for AGAVaPS for each dataset for comparison with the other search algorithms.
| Dataset | Number of Evaluations | Max In-Degree |
|---|---|---|
| Alarm | 1,000,000 | 4 |
| Asia | 10,000 | 4 |
| Coronary | 10,000 | 5 |
| Hailfinder | 1,000,000 | 4 |
| Insurance | 100,000 | 3 |
| Sachs | 10,000 | 3 |
| Sachs 2 | 10,000 | 3 |
Table 4.
Results obtained for the parameter analysis. For each combination of parameters, the mean BIC score value is shown. is the initial mutation mean and is the reproduction rate. The best values for each dataset are marked in bold.
Table 4.
Results obtained for the parameter analysis. For each combination of parameters, the mean BIC score value is shown. is the initial mutation mean and is the reproduction rate. The best values for each dataset are marked in bold.
| Dataset | ||||||
|---|---|---|---|---|---|---|
| Alarm | −237,238.73 | −236,307.90 | −236,341.33 | −236,970.01 | −237,319.48 | −236,152.09 |
| Asia | −11,113.07 | −11,113.09 | −11,112.20 | −11,113.08 | −11,112.26 | −11,111.43 |
| Coronary | −6717.78 | −6718.03 | −6718.03 | −6717.71 | −6718.35 | −6717.65 |
| Hailfinder | −1,058,908.27 | −1,056,481.45 | −1,056,888.71 | −1,055,479.40 | −1,055,095.71 | −1,053,574.88 |
| Insurance | −279,586.47 | −279,470.58 | −278,965.12 | −279,035.66 | −279,547.27 | −279,198.98 |
| Sachs | −719,733.24 | −720,224.68 | −720,133.82 | −720,506.56 | −720,161.80 | −720,588.25 |
Table 5.
Results obtained for the parameter analysis. For each combination of parameters, the ranks for each problem in the parameter analysis are shown. The mean rank of each combination for all the tests made is also shown on the line “Mean”. All the best values between the parameter combinations are marked in bold.
| Dataset | ||||||
|---|---|---|---|---|---|---|
| Alarm | 5 | 2 | 3 | 4 | 6 | 1 |
| Asia | 4 | 6 | 2 | 5 | 3 | 1 |
| Coronary | 3 | 5 | 4 | 2 | 6 | 1 |
| Hailfinder | 6 | 4 | 5 | 3 | 2 | 1 |
| Insurance | 6 | 4 | 1 | 2 | 5 | 3 |
| Sachs | 1 | 4 | 2 | 5 | 3 | 6 |
| Mean | 4.17 | 4.17 | 2.83 | 3.50 | 4.17 | 2.17 |
Table 6.
Result of the comparison of the algorithms. The mean and standard deviation (mean (std)) of F1 for each dataset and algorithm are shown in the first half of the table. In the second half, the rank of each algorithm for that test is shown. On the “Mean Rank” line, the mean rank of the algorithm for all tests is shown. The best values are marked in bold.
| Dataset | HC F1 | TABU F1 | AGAVaPS F1 |
|---|---|---|---|
| Alarm | 0.744 (0.049) | 0.732 (0.054) | 0.776 (0.026) |
| Asia | 0.655 (0.135) | 0.732 (0.118) | 0.899 (0.032) |
| Coronary | 0.892 (0.060) | 0.879 (0.060) | 0.859 (0.051) |
| Hailfinder | 0.554 (0.053) | 0.560 (0.043) | 0.554 (0.042) |
| Insurance | 0.683 (0.064) | 0.661 (0.072) | 0.659 (0.023) |
| Sachs | 0.823 (0.099) | 0.836 (0.120) | 0.926 (0.021) |
| Sachs 2 | 0.843 (0.112) | 0.850 (0.103) | 0.932 (0.022) |
| Alarm rank | 2 | 2 | 1 |
| Asia rank | 2 | 2 | 1 |
| Coronary rank | 1 | 1 | 1 |
| Hailfinder rank | 1 | 1 | 1 |
| Insurance rank | 1 | 1 | 1 |
| Sachs rank | 2 | 2 | 1 |
| Sachs 2 rank | 2 | 2 | 1 |
| Mean Rank | 1.57 | 1.57 | 1.00 |
Table 7.
Result of the comparison of the algorithms. The mean and standard deviation (mean (std)) of SHD for each dataset and algorithm are shown in the first half of the table. In the second half, the rank of each algorithm for that test is shown. On the “Mean Rank” line, the mean rank of the algorithm for all tests is shown. The best values are marked in bold.
| Dataset | HC SHD | TABU SHD | AGAVaPS SHD |
|---|---|---|---|
| Alarm | 28.367 (6.253) | 30.033 (7.418) | 18.467 (2.045) |
| Asia | 6.500 (2.872) | 4.933 (2.421) | 1.533 (0.499) |
| Coronary | 1.867 (0.991) | 2.100 (0.978) | 2.400 (0.841) |
| Hailfinder | 68.900 (10.543) | 67.867 (8.671) | 45.700 (2.923) |
| Insurance | 34.167 (7.572) | 36.967 (8.503) | 30.533 (1.688) |
| Sachs | 6.500 (3.704) | 6.067 (4.546) | 2.533 (0.763) |
| Sachs 2 | 5.700 (4.157) | 5.467 (3.845) | 2.367 (0.752) |
| Alarm rank | 2 | 2 | 1 |
| Asia rank | 2 | 2 | 1 |
| Coronary rank | 1 | 1 | 1 |
| Hailfinder rank | 2 | 2 | 1 |
| Insurance rank | 2 | 2 | 1 |
| Sachs rank | 2 | 2 | 1 |
| Sachs 2 rank | 2 | 2 | 1 |
| Mean Rank | 1.86 | 1.86 | 1.00 |
Table 8.
Result of the comparison of the algorithms. The mean and standard deviation (mean (std)) of BSF for each dataset and algorithm are shown in the first half of the table. In the second half, the rank of each algorithm for that test is shown. On the “Mean Rank” line, the mean rank of the algorithm for all tests is shown.
| Dataset | HC BSF | TABU BSF | AGAVaPS BSF |
|---|---|---|---|
| Alarm | 0.852 (0.045) | 0.839 (0.040) | 0.728 (0.018) |
| Asia | 0.520 (0.203) | 0.636 (0.162) | 0.836 (0.045) |
| Coronary | 0.748 (0.121) | 0.719 (0.118) | 0.728 (0.088) |
| Hailfinder | 0.613 (0.053) | 0.622 (0.040) | 0.445 (0.055) |
| Insurance | 0.642 (0.072) | 0.621 (0.081) | 0.563 (0.024) |
| Sachs | 0.760 (0.144) | 0.776 (0.175) | 0.899 (0.030) |
| Sachs 2 | 0.785 (0.162) | 0.797 (0.149) | 0.911 (0.038) |
| Alarm rank | 1 | 1 | 2 |
| Asia rank | 2 | 2 | 1 |
| Coronary rank | 1 | 1 | 1 |
| Hailfinder rank | 1 | 1 | 2 |
| Insurance rank | 1 | 1 | 2 |
| Sachs rank | 2 | 2 | 1 |
| Sachs 2 rank | 2 | 2 | 1 |
| Mean Rank | 1.43 | 1.43 | 1.43 |
Table 9.
Result of the comparison of the algorithms. The mean and standard deviation (mean (std)) of the BIC score for each dataset and algorithm are shown in the first half of the table. In the second half, the rank of each algorithm for that test is shown. On the “Mean Rank” line, the mean rank of the algorithm for all tests is shown. The best values are marked in bold.
| Dataset | HC Score | TABU Score | AGAVaPS Score |
|---|---|---|---|
| Alarm | −2.232759 (1.8 ) | −2.230440 (1.7 ) | −2.275161 (1.1) |
| Asia | −1.116352 (1.4 ) | −1.113056 (1.7 ) | −1.111352 (4.7) |
| Coronary | −6.719031 (1.4) | −6.719848 (2.3) | −6.717676 (6.9 ) |
| Hailfinder | −1.002213 (6.5 ) | −1.001578 (4.9 ) | −1.043391 (6.7 ) |
| Insurance | −2.735643 (4.4 ) | −2.749877 (5.9 ) | −2.744720 (1.1 ) |
| Sachs | −7.299457 (9.5 ) | −7.302275 (1.1 ) | −7.201837 (1.4 ) |
| Sachs 2 | −1.466913 (2.2 ) | −1.465159 (1.9 ) | −1.447779 (2.8 ) |
| Alarm rank | 1 | 1 | 2 |
| Asia rank | 2 | 2 | 1 |
| Coronary rank | 2 | 2 | 1 |
| Hailfinder rank | 1 | 1 | 2 |
| Insurance rank | 1 | 1 | 1 |
| Sachs rank | 2 | 2 | 1 |
| Sachs 2 rank | 2 | 2 | 1 |
| Mean Rank | 1.57 | 1.57 | 1.28 |
Table 10.
Result of the comparison of the algorithms. The mean and standard deviation (mean (std)) of the execution time for each dataset and algorithm are shown in the first half of the table. In the second half, the rank of each algorithm for that test is shown. On the “Mean Rank” line, the mean rank of the algorithm for all tests is shown. The best values are marked in bold.
| Dataset | HC Time | TABU Time | AGAVaPS Time |
|---|---|---|---|
| Alarm | 88.35 (68.35) | 77.44 (38.65) | 18,319.84 (3005.39) |
| Asia | 0.55 (0.09) | 0.53 (0.06) | 357.56 (29.58) |
| Coronary | 0.26 (0.04) | 0.26 (0.02) | 500.70 (30.09) |
| Hailfinder | 1128.75 (1245.82) | 1233.54 (1455.88) | 15,699.09 (946.69) |
| Insurance | 13.12 (1.22) | 11.44 (0.94) | 784.67 (34.78) |
| Sachs | 71.80 (9.80) | 66.62 (13.84) | 418.22 (6.50) |
| Sachs 2 | 3.87 (0.61) | 3.66 (0.60) | 70.04 (3.81) |
| Alarm rank | 1 | 1 | 2 |
| Asia rank | 1 | 1 | 2 |
| Coronary rank | 1 | 1 | 2 |
| Hailfinder rank | 1 | 1 | 2 |
| Insurance rank | 2 | 1 | 3 |
| Sachs rank | 1 | 1 | 2 |
| Sachs 2 rank | 1 | 1 | 2 |
| Mean Rank | 1.14 | 1.00 | 2.14 |
Disclaimer/Publisher’s Note: The statements, opinions and data contained in all publications are solely those of the individual author(s) and contributor(s) and not of MDPI and/or the editor(s). MDPI and/or the editor(s) disclaim responsibility for any injury to people or property resulting from any ideas, methods, instructions or products referred to in the content. |
© 2023 by the authors. Licensee MDPI, Basel, Switzerland. This article is an open access article distributed under the terms and conditions of the Creative Commons Attribution (CC BY) license (https://creativecommons.org/licenses/by/4.0/).
Share and Cite
MDPI and ACS Style
Rodrigues Mendes Ribeiro, R.; Dias Maciel, C. Bayesian Network Structural Learning Using Adaptive Genetic Algorithm with Varying Population Size. Mach. Learn. Knowl. Extr. 2023, 5, 1877-1887. https://doi.org/10.3390/make5040090
AMA Style
Rodrigues Mendes Ribeiro R, Dias Maciel C. Bayesian Network Structural Learning Using Adaptive Genetic Algorithm with Varying Population Size. Machine Learning and Knowledge Extraction. 2023; 5(4):1877-1887. https://doi.org/10.3390/make5040090
Chicago/Turabian StyleRodrigues Mendes Ribeiro, Rafael, and Carlos Dias Maciel. 2023. "Bayesian Network Structural Learning Using Adaptive Genetic Algorithm with Varying Population Size" Machine Learning and Knowledge Extraction 5, no. 4: 1877-1887. https://doi.org/10.3390/make5040090