Article

Similarity-Based Framework for Unsupervised Domain Adaptation: Peer Reviewing Policy for Pseudo-Labeling

1
Institute of Thermal Turbomachinery, Karlsruhe Institute of Technology (KIT), 76137 Karlsruhe, Germany
2
Artificial Intelligence Research Institute (IIIA), CSIC, 08193 Bellaterra, Spain
*
Authors to whom correspondence should be addressed.
Mach. Learn. Knowl. Extr. 2023, 5(4), 1474-1492; https://doi.org/10.3390/make5040074
Submission received: 21 July 2023 / Revised: 27 September 2023 / Accepted: 10 October 2023 / Published: 12 October 2023
(This article belongs to the Special Issue Deep Learning in Image Analysis and Pattern Recognition)

Abstract

:
The inherent dependency of deep learning models on labeled data is a well-known problem and one of the barriers that slows down the integration of such methods into different fields of applied sciences and engineering, in which experimental and numerical methods can easily generate a colossal amount of unlabeled data. This paper proposes an unsupervised domain adaptation methodology that mimics the peer review process to label new observations in a different domain from the training set. The approach evaluates the validity of a hypothesis using domain knowledge acquired from the training set through a similarity analysis, exploring the projected feature space to examine the class centroid shifts. The methodology is tested on a binary classification problem, where synthetic images of cubes and cylinders in different orientations are generated. The methodology improves the accuracy of the object classifier from 60% to around 90% in the case of a domain shift in physical feature space without human labeling.

1. Introduction

Labeling huge amounts of unlabeled data becomes more and more challenging for models with an increasing complexity. Different forms of labeling strategies such as semi-supervised, self-supervised, and active learning including generative and adversarial methods have created a vibrant research field to solve this common problem with many successful demonstrations [1,2,3].
In the case of semi-supervised learning, generative models aim to learn and sample from explicit or implicit probability distributions, whereas consistency regularization utilizes the unlabeled data with perturbations for model robustness [4]. In such data-centric methods, including image augmentation techniques, it is assumed that the boundaries of the original or the extracted feature space engulfs the whole possibility space, and synthetic data generation provides a mean to increase the data density. In active learning, the objective shifts to select unlabeled data instances to be labeled in an optimal way so that the expensive human annotator/oracle is consulted at a minimum rate while updating the prior on the data distribution. Herein, the objective function for adding new examples can vary, such as maximizing diversity or the accuracy of the model [2]. Nonetheless, the standard approach for active learning relies heavily on human interaction for labeling uncertain samples. This limitation increases the time and cost of the process, especially when working with large datasets. N-shot learning is an alternative, model-centric approach that aims to increase the predictive capability of machine learning methods with few training instances by either looking for similarities in embedded feature spaces or relying on a meta-learner that can adapt to different tasks [2]. There are also reported works that merge the strengths of unsupervised, self-supervised, and semi-supervised methods [5,6,7]. We refer the reader to a recent literature review for a more detailed overview [2,3,8,9,10,11,12,13].
The main objective of this work is to propose an alternative, similarity-based framework to label unknown instances, particularly in the presence of a domain shift (i.e., feature statistics of the unlabeled instances are different than those of the labeled ones). The essence of the underlying learning mechanism mimics the peer reviewing process in the scientific community. Pseudo-labels created by the hypothesis generator (e.g., a classifier model) are examined by the reviewer via metric learning. Herein, the shifts in class centroids in a projected feature space due to the proposed hypothesis (pseudo-labels) is taken into consideration in terms of direction and magnitude. Representing the current knowledge (labeled instances) as centroids and tracking its relative change with the added pseudo-labels has eliminated the need for human labeling in a case study and improved the accuracy of the object classifier in the presence of a drastic domain shift. In the following, we will give a brief overview of the relevant recent work, explain our methodology, and discuss the further steps.

2. Related Work

The field of semi-/self-supervised and transfer learning has raised a great interest in the community. Herein, we will highlight some of the recent works that have some similarities with the different aspects of the proposed idea. One significant issue with semi-supervised strategies is the assumption that the data of both the training and test data are drawn from the same distribution. This domain shift between training (source domain) and test data (target domain) can lead to a poor model performance for target instances. Domain adaptation, as a subfield of transfer learning, focuses on generalizing models trained on a source domain to be applied to different target domains. The case where no target labels are available is referred to as unsupervised domain adaptation [14]. Various methods have been developed in the last decade to overcome the problem of domain shift. Those methods can be categorized according to [15] into instance-based, feature-based, and parameter-based methods. Because parameter-based methods focus on adjusting the model’s parameters, which is not in the scope of our work, we refer to [14] for related methods.
(1) Instance-based methods adjust the weights of the instances in a way such that the distributions of both domains are similar [15]. Gong et al. [16] automatically selected instances from the source domain (“landmarks”) that were distributed similarly to the target domain in order to mitigate the domain shift problem. As in our work, Bruzzone and Marconcini [17] followed a pseudo-labeling strategy for domain adaptation in support vector machines, where pseudo-labeled target instances were moved to the training dataset based on their distance to the upper and lower bound of the decision margin. Both studies include only different parts (similarity analysis or pseudo-labeling) of our proposed method.
(2) Feature-based methods achieve domain adaptation by adjusting the features of two domains [15]. Many approaches try to alleviate the domain discrepancy by projecting both domains in a common embedding space [18,19,20]. In a recent work, Deng et al. [21] used a deep ladder-suppression network to extract expressive cross-domain shared representations by suppressing domain-specific variations, which can be integrated with metric discrepancy-based methods such as D-CORAL [22], DAN [23] and JAN [24]. Deep frequency filtering was introduced by [25], where they used a simple spatial attention mechanism as a filtering step in the frequency domain in order to keep transferable frequency components, leading to higher generalization across different domains.
Several studies have utilized a pseudo-labeling approach, known from semi-supervised learning, to enhance the model’s performance on the target data. Similar to our work, Gu et al. [26] accepted or rejected pseudo-labels of target instances based on their distance to the corresponding class center in a spherical feature space. Their approach can be implemented based on adversarial domain adaptation models such as DANN [27] and MSTN [28]. Karim et al. [29] divided the predicted pseudo-labels of the source model into “more reliable” and “less reliable” ones based on their prediction confidence and uncertainty. By using a curriculum learning strategy, they focused on the more reliable pseudo-labeled target samples in the first iterations before continuously integrating the remaining target samples in the training process. Similarly, Litrico et al. [30] attempted to refine the pseudo-labels made by the source model based on an uncertainty score derived from the pseudo-labels of neighbor samples. In contrast to our method, they select the neighbor samples of a target sample by comparing features of weakly augmented target samples in the target feature space. The pseudo-labels then become refined by employing a soft-voting strategy that aggregates predictions from neighbor samples. With their approach, they reach a state-of-the-art accuracy score of 90% for the VisDa-C dataset and 69.6 % for the DomainNet dataset.
The idea of iteratively improving the pseudo-label predictions of a base classifier is part of the visual domain adaptation (VDA) model by [31]. Their approach employs domain-invariant clustering by minimizing the joint marginal and conditional distribution distances across domains in the latent space iteratively. In a recent study, Liu et al. [32] presented a novel unsupervised domain adaptation strategy that draws inspiration from the optimal transport phenomenon. This approach focuses on aligning sub-domain clusters between the source and target domains to facilitate effective adaptation. Their method demonstrates particularly high performance, especially in scenarios marked by class imbalance in the dataset.

3. Our Contribution

Semi-/self-supervised methods assume that the labeled fraction of the data is informative enough to learn/sample from the underlying probability distributions, despite being sparsely distributed. N-shot learning methods are exploring the unseen classes by accessing information through matching semantic labels with the extracted features. Herein, it is still assumed a priori that the physical feature space is represented by the semantic content, through which the embedded clustering of unique combinations are assigned to new classes. Active learning relies on dissimilarities and queries the most informative instances to oracles. In the case of domain shift, however, such a methodology would demand a large number of samples to be labeled with human supervision.
In this work, we target scenarios during which drastic domain shifts in the physical feature space are expected, which is in turn reflected into the observed state features or their projected representations. The proposed methodology mimics the peer reviewing process in the scientific community. The current knowledge (labeled data) is treated as centroids acting as attractors. The new hypothesis (pseudo-labels coming from the classifier) is checked by the reviewer model based on metric learning. One unique aspect of our work is the use of the concept shift in each class that may happen with the new proposal as a decision criterion to accept, revise, or reject the proposed hypothesis. As in scientific peer reviewing, the decision is made based on the consistency of the new proposal with the current knowledge and the self-consistency of the new proposal. The consistency here is defined as vectors constituted by the current and proposed cluster centroids in the latent space. Herein, peer-reviewing policy acts as an autonomous learning mechanism with no reliance on any oracles. In other words, the unlabeled data space (suspected to be different than the training feature space) is explored via relative information and similarity-based learning, rather than accessing absolute information as needed. The details of the methodology is described in the following section.

4. Materials and Methods

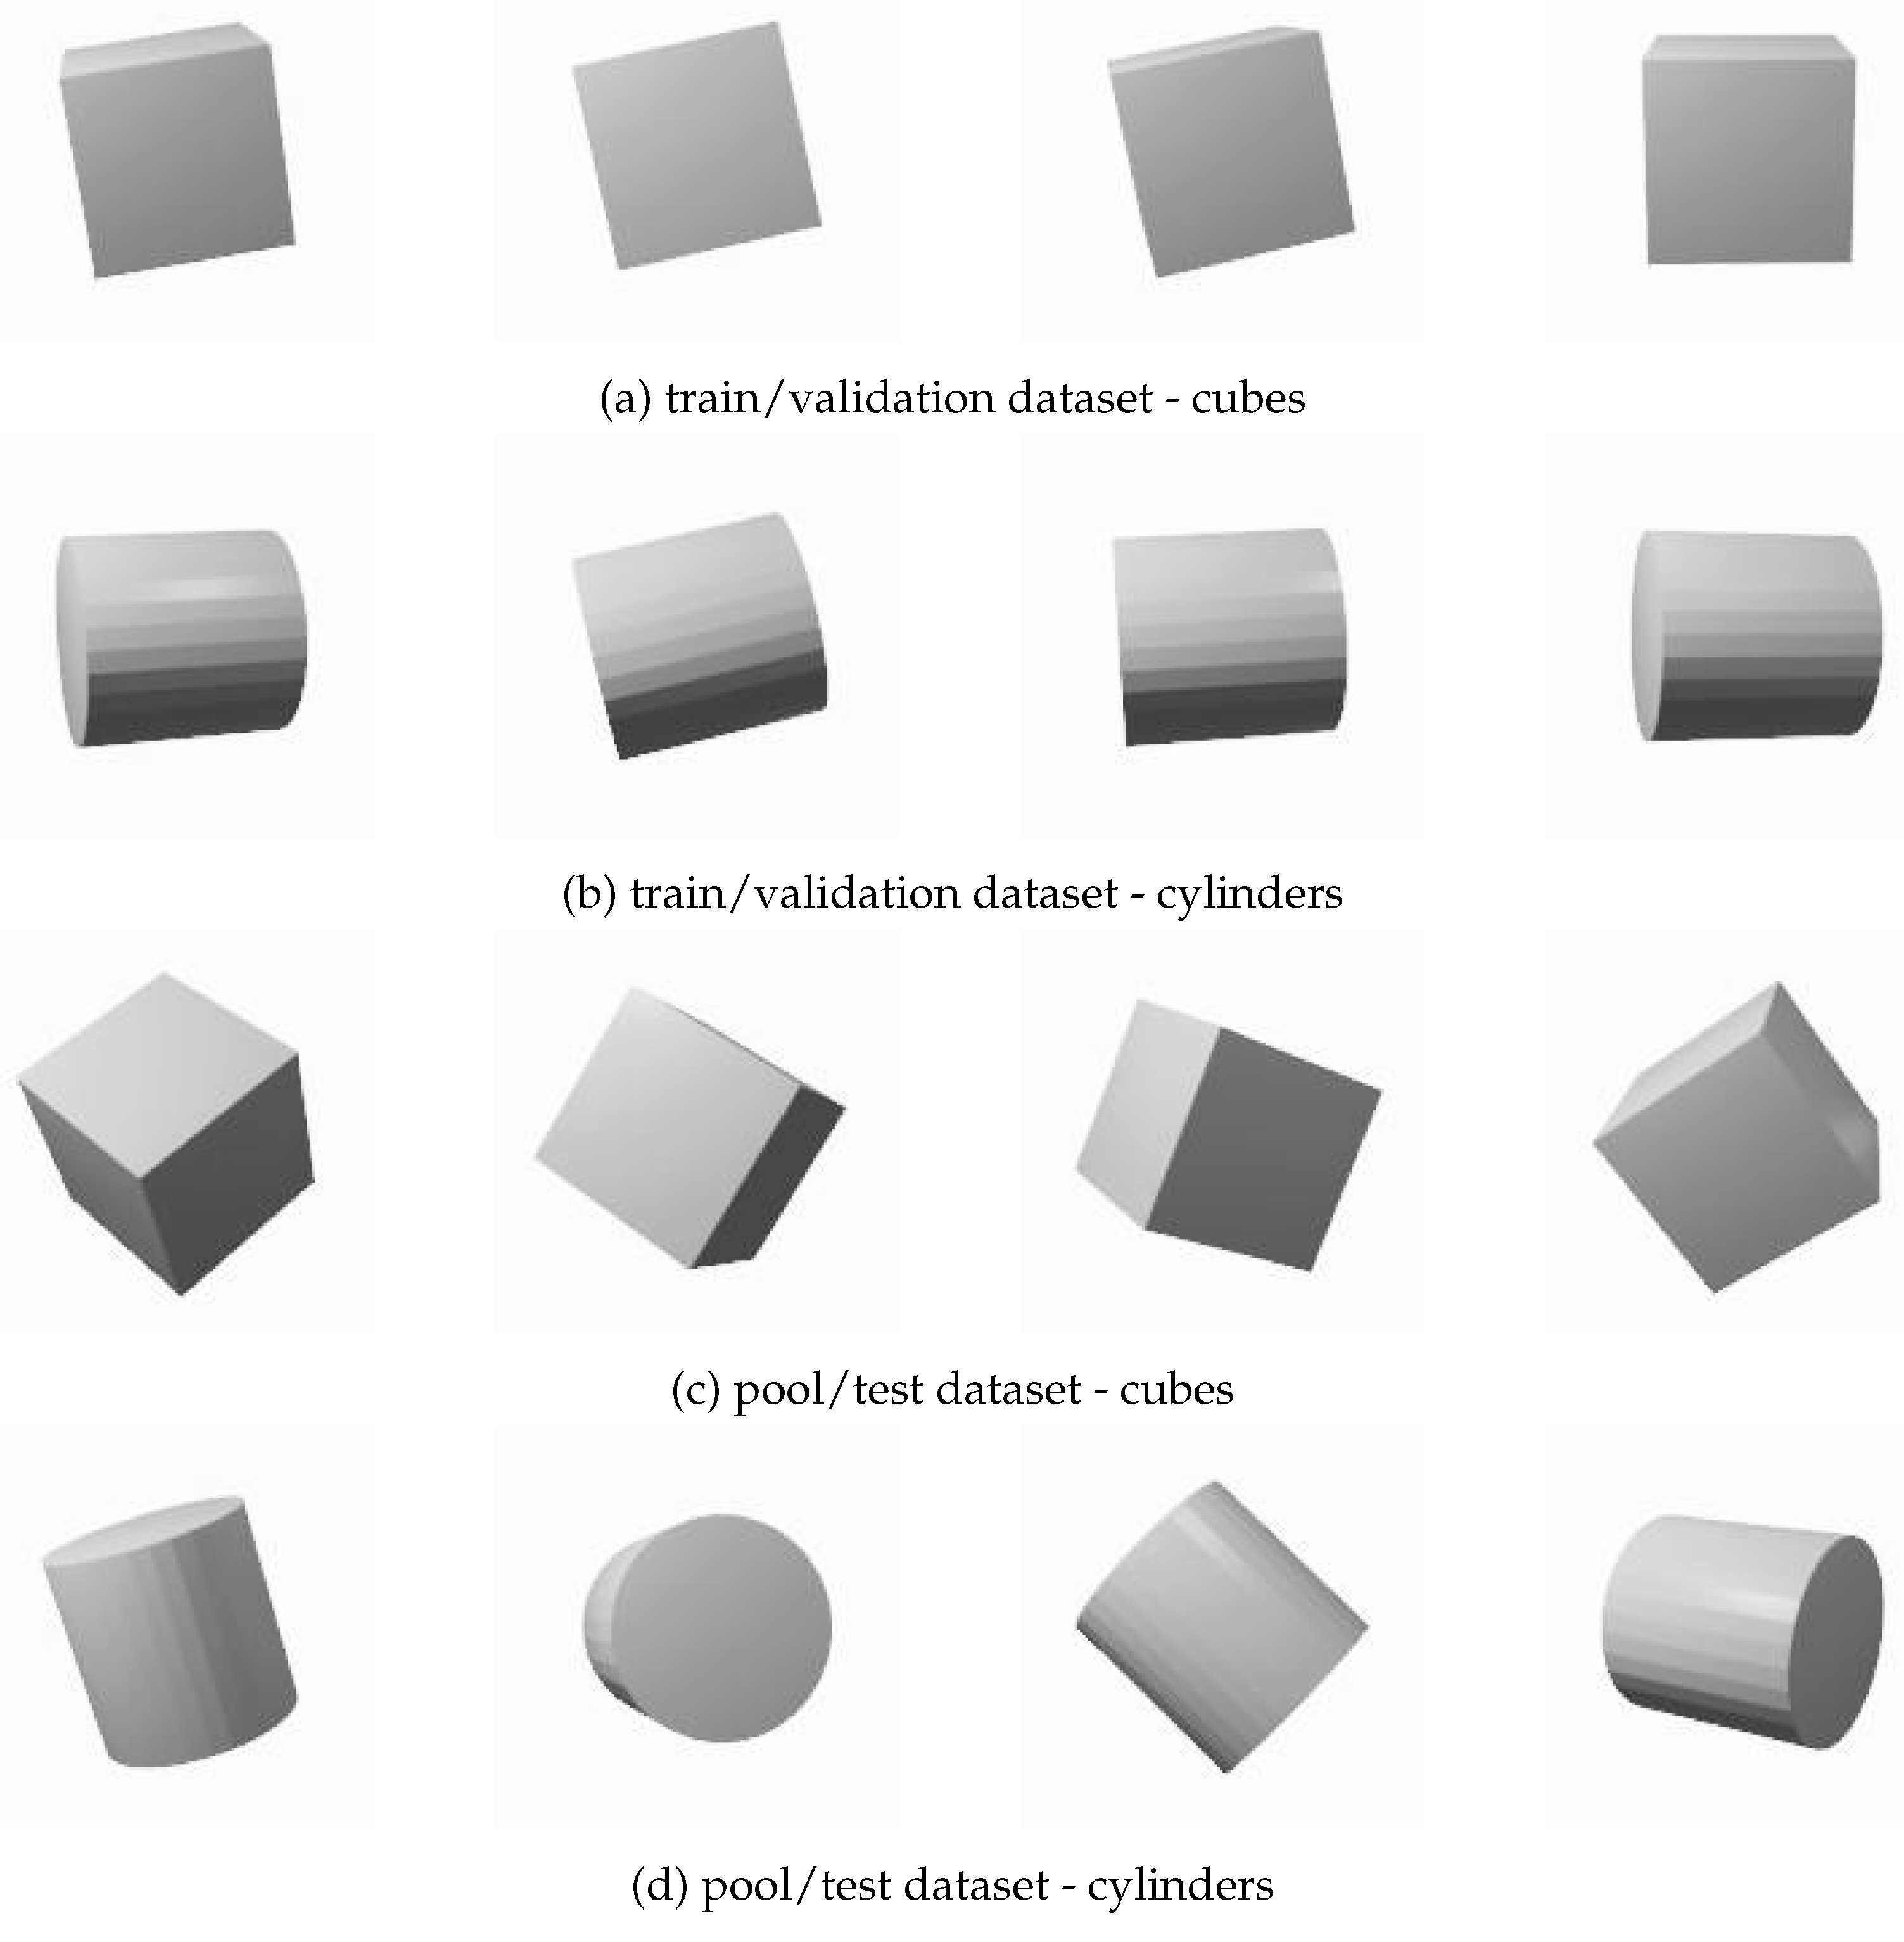
4.1. Case Study: Synthetic Basic Shapes Dataset

In this study, we present a case from the multiphase flow community related to the particle segregation and distribution analysis of a wood recycling unit operating in the dilute flow regime. The domain shift aspect of the problem comes from the fact that while designing the equipment, particle characterization experiments (as in the work of [33]) are conducted within a certain flow settings (physical features of the gas and solid phases). In gas-solid flows, particle segregation and entrainment strongly depend on the balance between the drag, gravitational, and buoyancy forces [34]. As the velocity of the gas phase increases (i.e., Reynolds number for particles (Re) increases), particles that are well-oriented with respect to the flow direction (when Re < 100) start to exhibit complex secondary motions due to the difference in the center of gravity and the center of pressure, which is typically the case in the real operation (Re > 1000). Herein, the orientation of the particle further affects the instantaneous drag force acting on the particle, which in turn changes the force distribution on the particle, further changing its orientation and the distribution along the chamber. Depending on the material batch and pre-processing steps (e.g., milling), particle properties such as size distribution and shape features (base shape, aspect ratio) can also introduce further shifts in the physical feature space, leading to a multi-layered, hierarchical relation network. On the other hand, such orientation/flow alignment statistics (e.g., [35]) are needed to be able to design the recycling unit targeting a certain material or mixing patterns within the chamber (e.g., separating viable wood from waste).
The dataset is created by considering a typical flow characterization experiment, where particles are fed to the setup and their distribution is typically monitored via high-speed imaging, followed by masking, object detection, shape classification, and building orientation statistics for many events at the same operating conditions [34]. In order to test the proposed idea, we reduced the problem complexity and first examined the classification problem (we will return the whole framework in the discussion part). Synthetic images of cubes and cylinders in different orientations were generated using the open-source 3D creation software ”Blender”, which also provides us with the corresponding labels (shape, orientation). Both the cubes and cylinders have an aspect ratio (AR) of 1 to add more overlapping shape projections at different orientations. All objects are centered in the images, which are 224 × 224 px in size. Herein, it is assumed that object detection is handled via a simple tool such as background subtraction, which is a rather easy task with high-speed imaging in dilute flows (i.e., particle volume fractions are low by design). The generated images differ only in the shape and rotation around the x- and y-axes. The training, validation, and initial test datasets for the base classifier include images of cubes and cylinders with rotations around both axes limited to 15 ° (source domain D S ). Herein, it is analogous to conduct an experiment with real particles (e.g., more complex shape classes) at low Re and create an initial labeled dataset. The test data (the second set to analyze the proposed idea), on the other hand, include random rotations of the objects that are exhibited at high Re flows (target domain D T ). We created two different test datasets: one for pseudo-labeling called the pool dataset, and the other (test dataset) for evaluating classifier performance as it explores unknown feature space during the learning process which is used only for model performance assessment. Table 1 summarizes the number of samples and the range of possible rotation angles for each. Figure 1 shows example images of cubes and cylinder for both the training/validation and pool/test dataset.

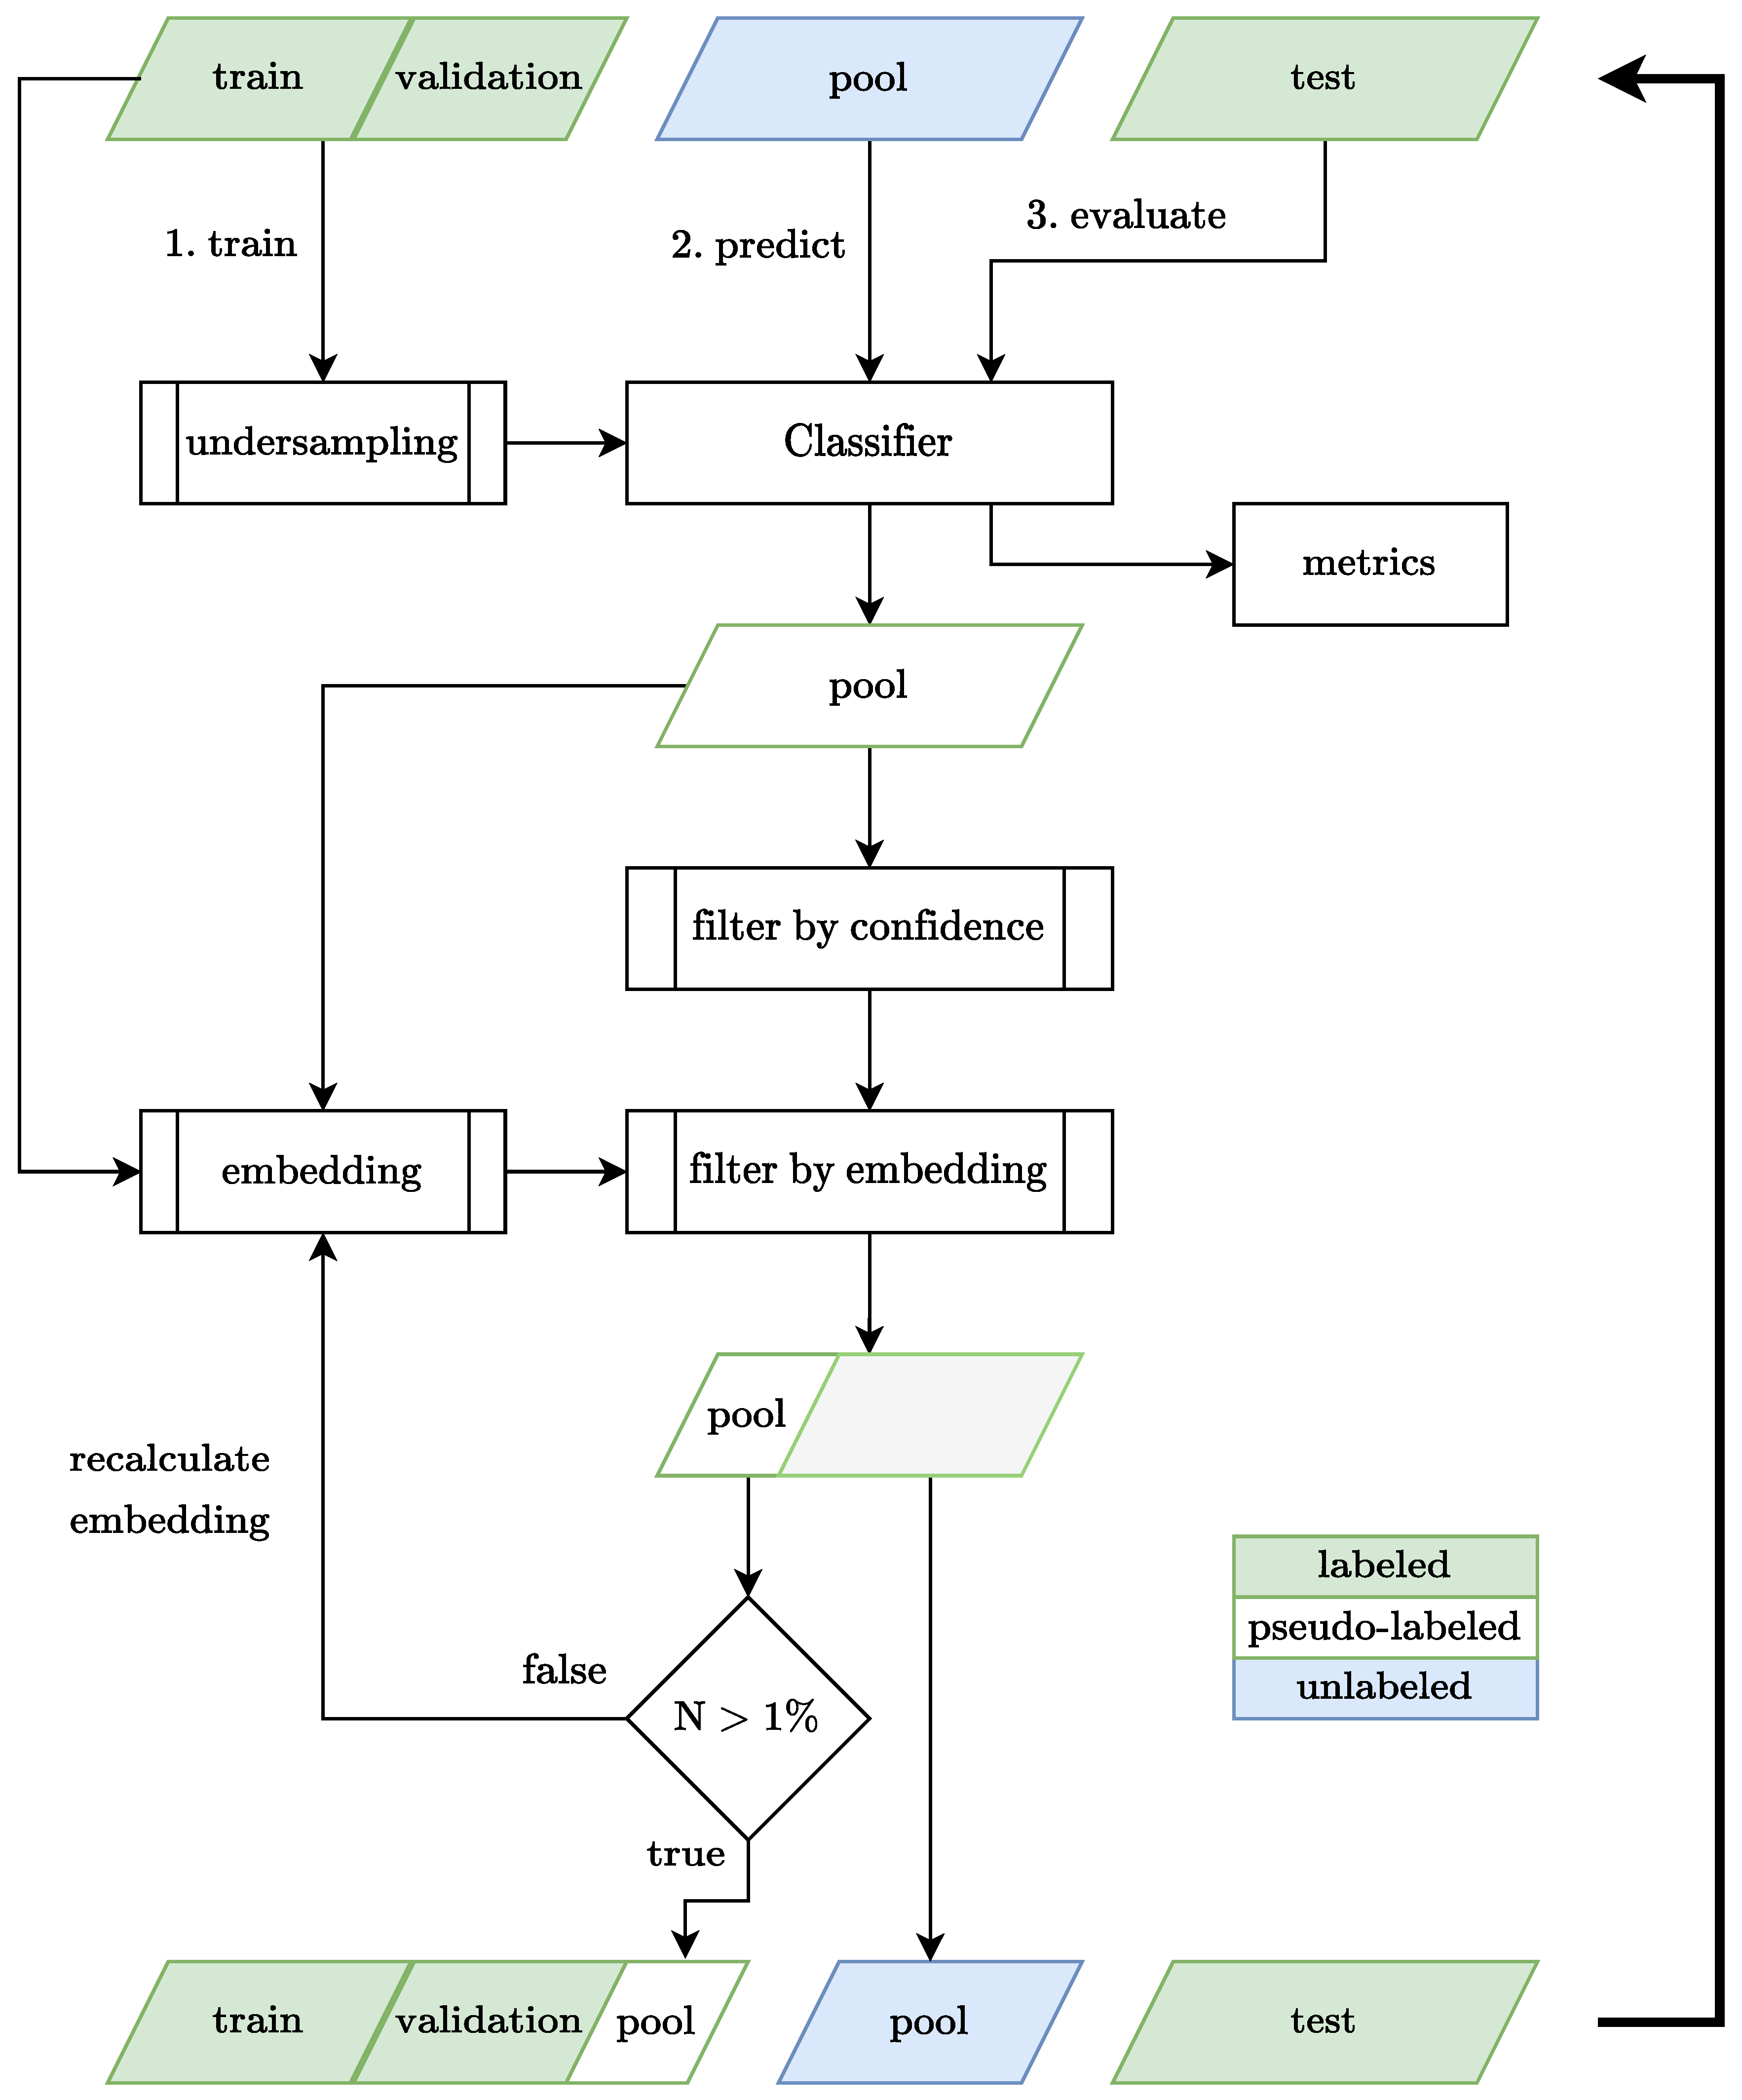
4.2. Algorithm Details

The proposed method relies on an autonomous peer reviewing process to eliminate the need for human labeling, even in the presence of a domain shift. As illustrated in the algorithm flowchart (Appendix A), we begin by creating four datasets ( X train , X val , X pool , X test ) as described in Section 4.1, where { X train , X val } D S and { X pool , X test } D T . In the first step, we use the initial training and validation datasets to train a basic classifier, for instance a ResNet18 [36] model. Before training the model, we check the training data for class imbalance and apply undersampling if necessary. At this stage, the goal is to create an accurate model given the observations. In the second stage, the classifier—which has been trained on images of particles with rotations limited to 15 ° —is used to predict pseudo-labels for the pool dataset, which includes images of particles with any rotation. It should be reminded here that the particles are literally rotated in the Blender environment, as if it is caused by secondary particle motions and images are captured at a fixed camera position. Before passing the pseudo-labels to the reviewer, we use the class probabilities output by the network’s softmax output layer to discard predictions that fall below a 80% confidence threshold in order to filter out predictions where the model is not confident.
In the next step, the proposed classes are checked by the reviewer via a novel metric learning approach. Similar to many similarity-based assessments, we first project the training and pool data into a two-dimensional embedding space using two different dimensionality reduction techniques, namely t-SNE [37] and Ivis [38], which preserve local and structural similarities of the original images in the low-dimensional representations. The hypothesis is that the model is more likely to accurately predict samples that are similar and therefore closer to the training data in the embedding space, akin to how humans tend to build upon their prior knowledge by solving problems that are similar to ones they have already solved. By selecting those samples during each iteration, the model will be able to systematically explore the entire data space in the presence of concept shift. What is unique in our approach is to use both the magnitude and the direction of the centroids for all classes simultaneously in the form of a domain split task. A more detailed description of the acceptance/rejection policy is provided in Section 4.3. After the reviewing process, the algorithm checks if more than 1% of the pool data have been accepted. If more than 1% of the recent pool data are selected, these samples and their corresponding pseudo-labels are added to the training dataset for the next iteration, effectively treating them as true labels. This process continues until, in theory, the entire pool dataset is correctly labeled. If not, the algorithm reapplies the dimensionality reduction method, resulting in a different embedding space as t-SNE and Ivis are non-deterministic. In this inner loop, the similarity constraint is further relaxed via increasing the allowable maximum distance from the class centroid by 20%. If the recalculated embedding space does not lead to a higher number of selected pool samples for five consecutive iterations, the algorithm stops. As some incorrect predictions may be added to the training dataset, leading to a confirmation bias, we calculate the accuracy metrics on an independent test data during each iteration of the learning process. It is important to note that no external information is used during the training and it is merely used for demonstration of the improved performance of the classifier due to selective use of self-improved pseudo-labels. The algorithms details are summarized in Algorithm 1.

4.3. Reviewing Policy

In essence, the reviewer checks how the newly labeled dataset is aligned with the current centroids and how the class centroids will shift if the proposed labels are accepted. To generate the necessary low-dimensional embeddings, we deployed two dimensionality reduction techniques, t-SNE and Ivis, which both produce two-dimensional representations of the training and pool images. We set the number of nearest neighbors to 30 for both. Ivis is selected due to its demonstrated ability to preserve the data structure and whether that proves to be more useful than the t-SNE approach. It is also considered that the performance comparisons with different projection policies can provide further insights on whether we can benefit from multi-review approach in the follow-up studies.
For the review process, we first calculate the centroids for both the training data and the pseudo-labeled pool data for each class. The centroids calculated from the training set represent the current “state of the art”. The centroids of the pseudo-labels proposed by the most recent classifier, on the other hand, represent the “proposed hypothesis”. Let l 1 , A and l 1 , B denote the distances between the training centroid and the pool centroid for Classes A and B, respectively. Herein, l 1 , A and l 1 , B provides relative information about the magnitudes of the domain shift. Next, the directions of the vectors starting from the previous class centroid to the newly observed class centroid are computed to decide in which direction it is reasonable to expand for each class based on how the classifier interprets the “world” and the pool data (unlabeled set). Herein, we used semicircles to explore the projected feature space. At each iteration, we add all pseudo-labels that are inside the semicircle of one class but not inside the semicircle of the other. By doing so, in a single step, we account for both negative and positive feedbacks coming from the previous and the proposed knowledge states. Herein, each projection with t-SNE or Ivis acts similar to the perspective of the reviewer(s) to the current state of the art, and its relation to the proposed hypothesis (pseudo-labels). A more detailed mathematical description of the reviewing process can be found in Algorithm 1.
Figure 2 shows an example plot of the filtering in the embedding space using t-SNE from both the perspectives of classes A and B. In each view, the blue color shows the class of interest, whereas the gray color denotes the other (i.e., data space is viewed based on one vs. others). The training data are represented by large, thicker points. The pseudo-labeled pool data are represented by smaller points if the model predictions was right; otherwise, they are represented by a cross symbol. From the figure, it is immediately seen that the pool data exhibit a concept shift and the unlabeled pool data have drastically different representations for classes.
The green-shaded semicircle area defines the zone where the pseudo-labeled pool data are to be added if we only take the class of interest into account (blue color). Correspondingly, the red semicircle defines the area of rejection if we consider the feedback coming from the concept shift in the other class. The selected pool data samples are highlighted in red.
One important hyperparameter here is the radius of the semicircles, which is analogous to the learning rate concept. In the study, it is calculated via two different methods:
r 1 , i = 0.8 l 1 , i i [ A , B ]
r 2 , i = ( μ l 1 , i ) + l 1 , i ( 1 l 1 , i l 0 ) = μ l 1 , i 2 l 0 i [ A , B ]
for both classes A and B. The first definition is simply scaled with the available subjective information about the concept shift. The second definition is considered as an alternative approach, which is regularized with respect to the data projection. For that purpose, we introduce two new terms into the equation. μ is the average distance between pseudo-labels of class i and the training centroid of the same class, whereas l 0 is the distance between the two training centroids, which is considered as a relative similarity measure between current class representations in the projected space. Such a regularization is considered to be useful particularly if the domain shift in the projected feature is manifested as a symmetric expansion around the training centroids. In such a case, l 1 , i would be close to zero, resulting in a stagnation in the learning process (no pseudo-labels would be accepted). If the concept shift is highly asymmetric, then the first term of Equation (2) would converge to zero and domain exploration would be driven by the shifts in class centroids. This is considered to be similar to weight regularization.
Algorithm 1 Algorithm details with Peer Reviewing Policy for Pseudo-Labeling
Ensure:  { X train , X val } D S
Ensure:  { X pool , X test } D T
      f D R : R d R k                   ▹ Dimensionality Reduction
Require:  k < d (in this work: k = 2 )
      X ˜ n = f D R ( X n ) n [ train , val , pool ]
      X ˜ S = X ˜ train X ˜ val
      X ˜ T = X ˜ pool
     scaling factor: s = 1
     for every iteration i do
           Train model F θ on X ˜ S
           Predict pseudo-labels for target domain: Y ^ T = F θ ( X T )
           Filter by confidence: X ˜ T = { x ˜ T confidence ( y ^ T ) 0.8 , x ˜ T X ˜ T , y ^ T Y ^ T }
           for every class j do
                Calculate centroid of source domain embedding: C j , S = 1 m i = l m x ˜ l , S x ˜ S X ˜ j , S
                Calculate centroid of target domain embedding: C j , T = 1 m i = l m x ˜ l , T x ˜ T X ˜ j , T
                 l 1 , j = d i s t ( C j , S , C j , T )
                 r 1 , j = s · 0.8 l 1 , j             ▹ or r 2 , j according to Equation (2)
                Define semi-circle for each class: SC j = sc(location =  C j , S , direction =  C j , S C j , T , radius =  r 1 , j )
                Target samples in semicircle: S j = { x ˜ T x ˜ T X ˜ j , T , x ˜ T inside SC j }
           end for
           for everly class j do
                for every remaining class n j  do
                      Accepted samples: X ˜ T , accepted = X ˜ T S j S n
                end for
           end for
           Test predictions: Y ^ test = F θ ( X test )
           Update source domain: X ˜ S = X ˜ S X ˜ T , accepted
           Update target domain: X ˜ T = X ˜ T X ˜ T , accepted
            if  | X ˜ T , accepted | | X pool | 1 %  then
                  X ˜ n = f D R ( X n ) n [ train , val , pool ]     ▹ Refit embedding (non-deterministic)
                  X ˜ S = X ˜ train X ˜ val
                  X ˜ T = X ˜ pool
                  s = 1.2 s               ▹ Increase semi-circle radius with scaling factor
           end if
end for

5. Results

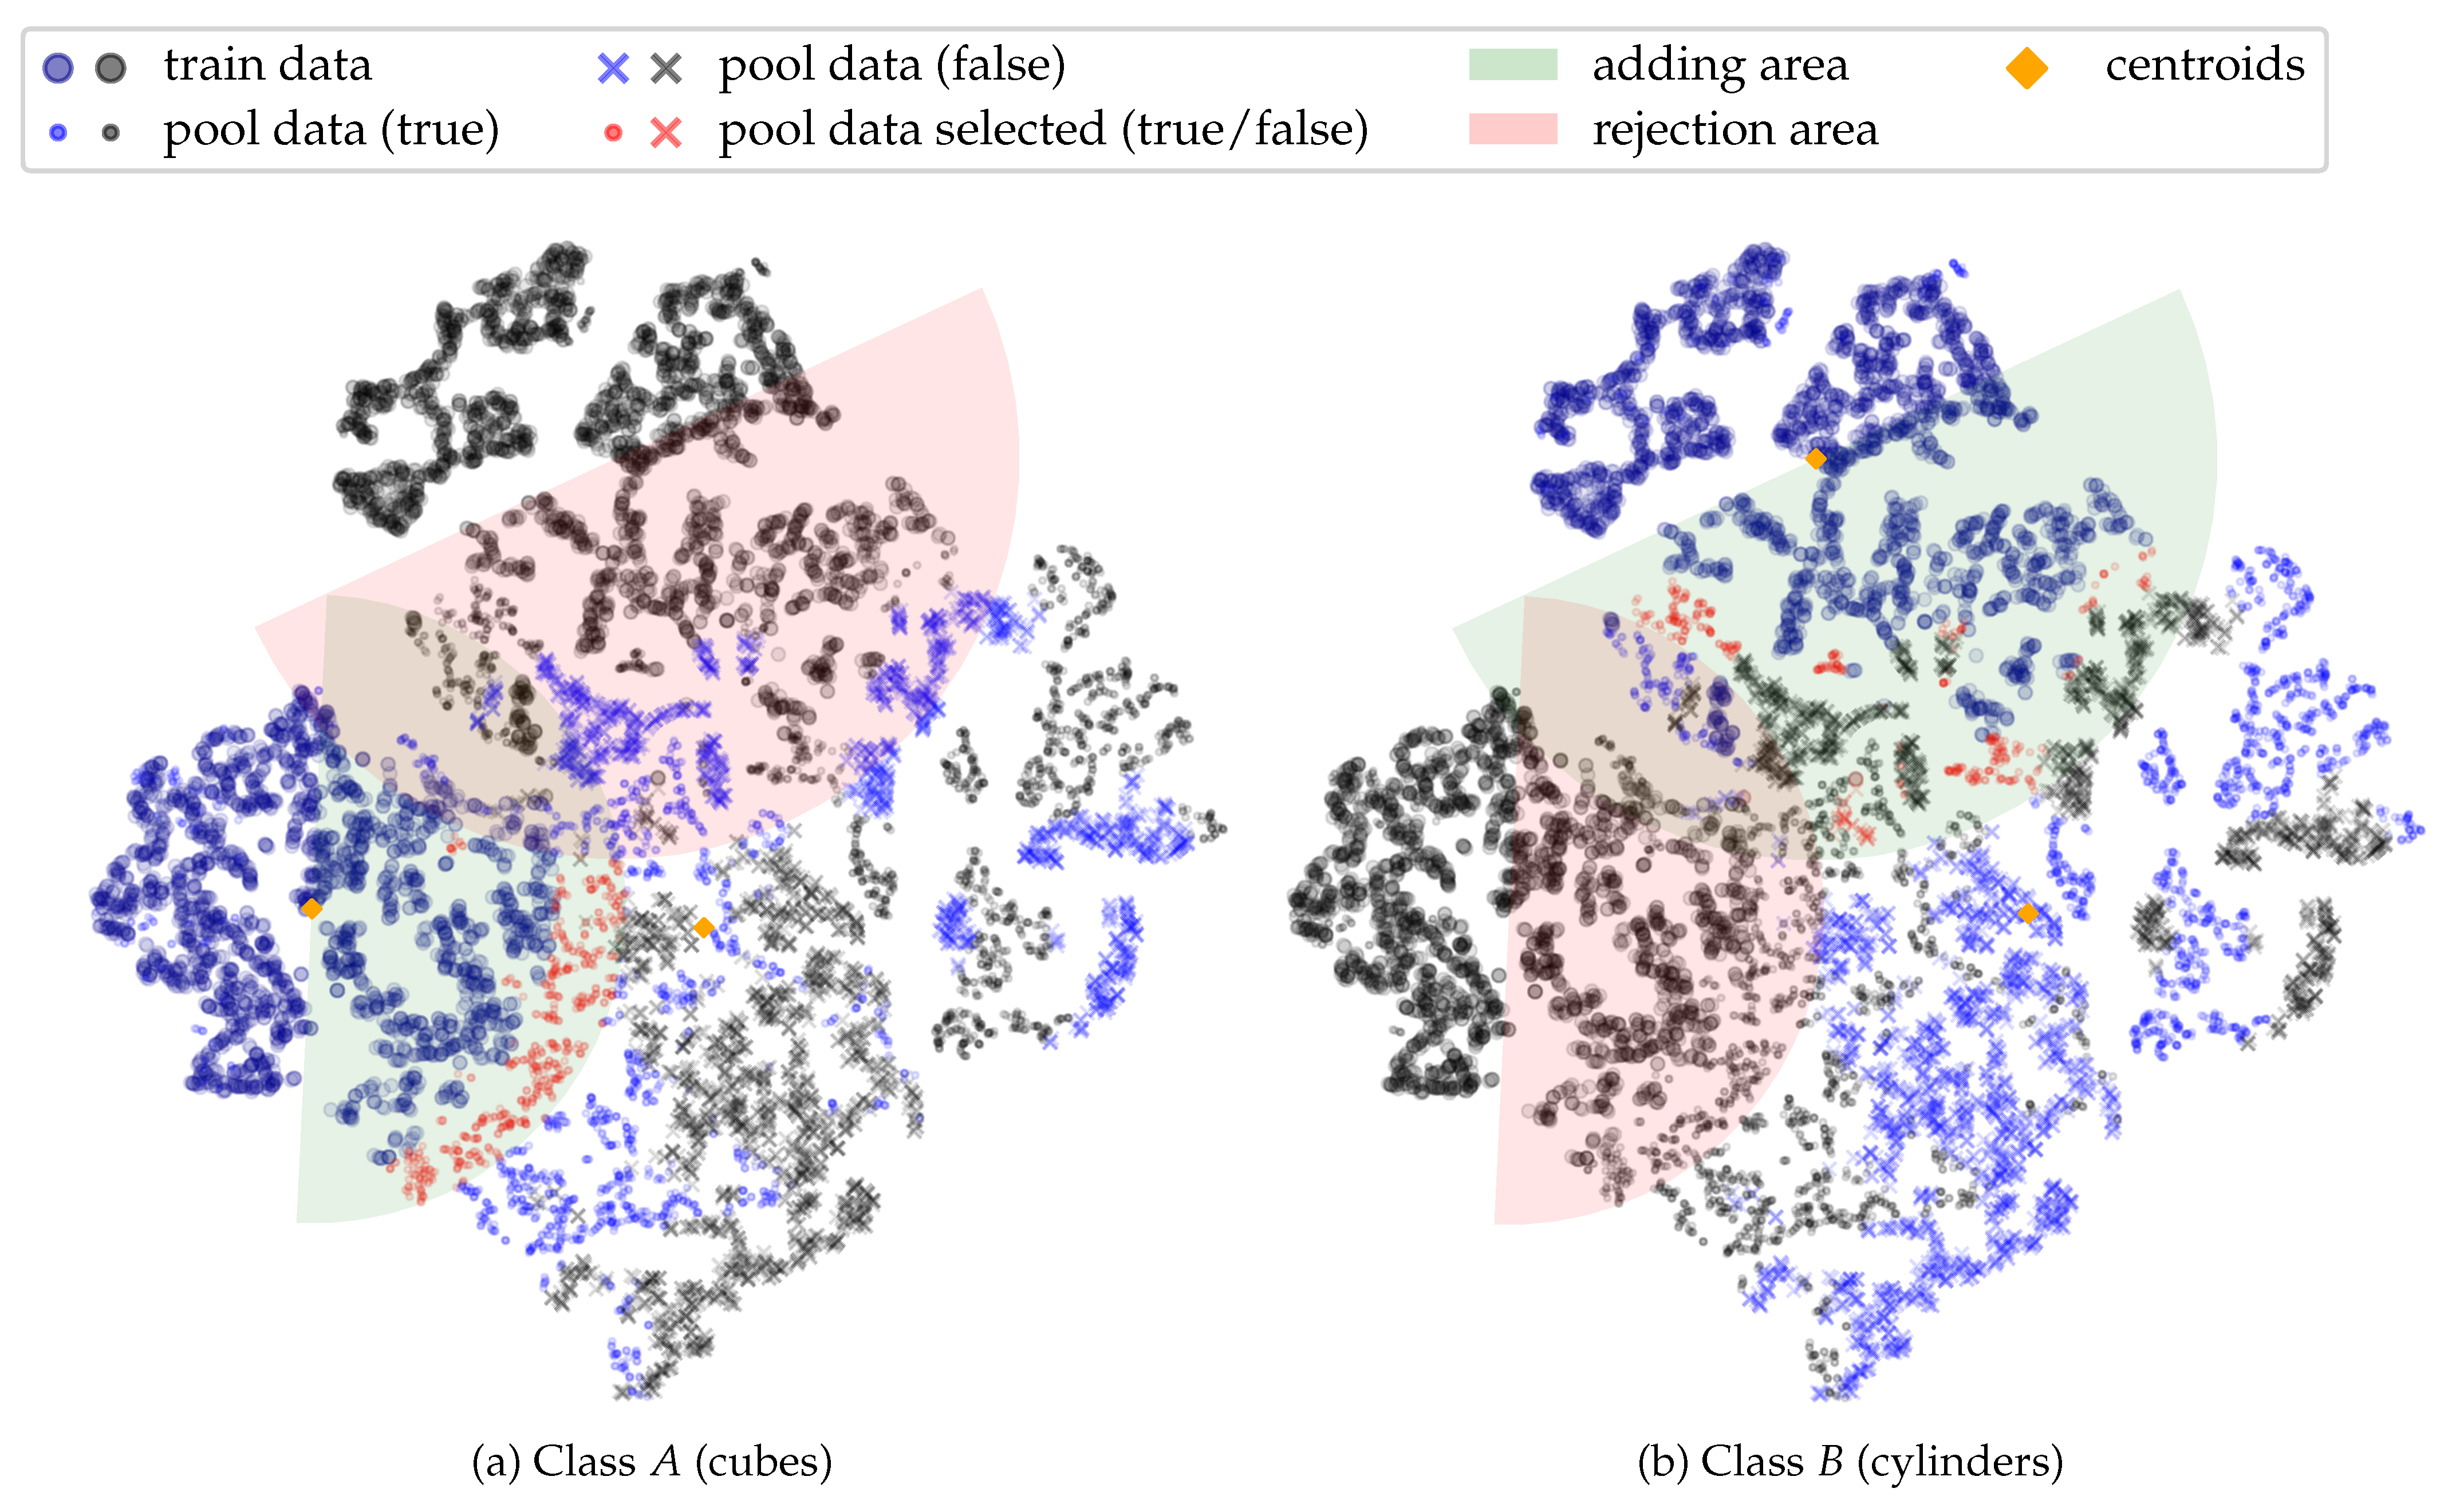
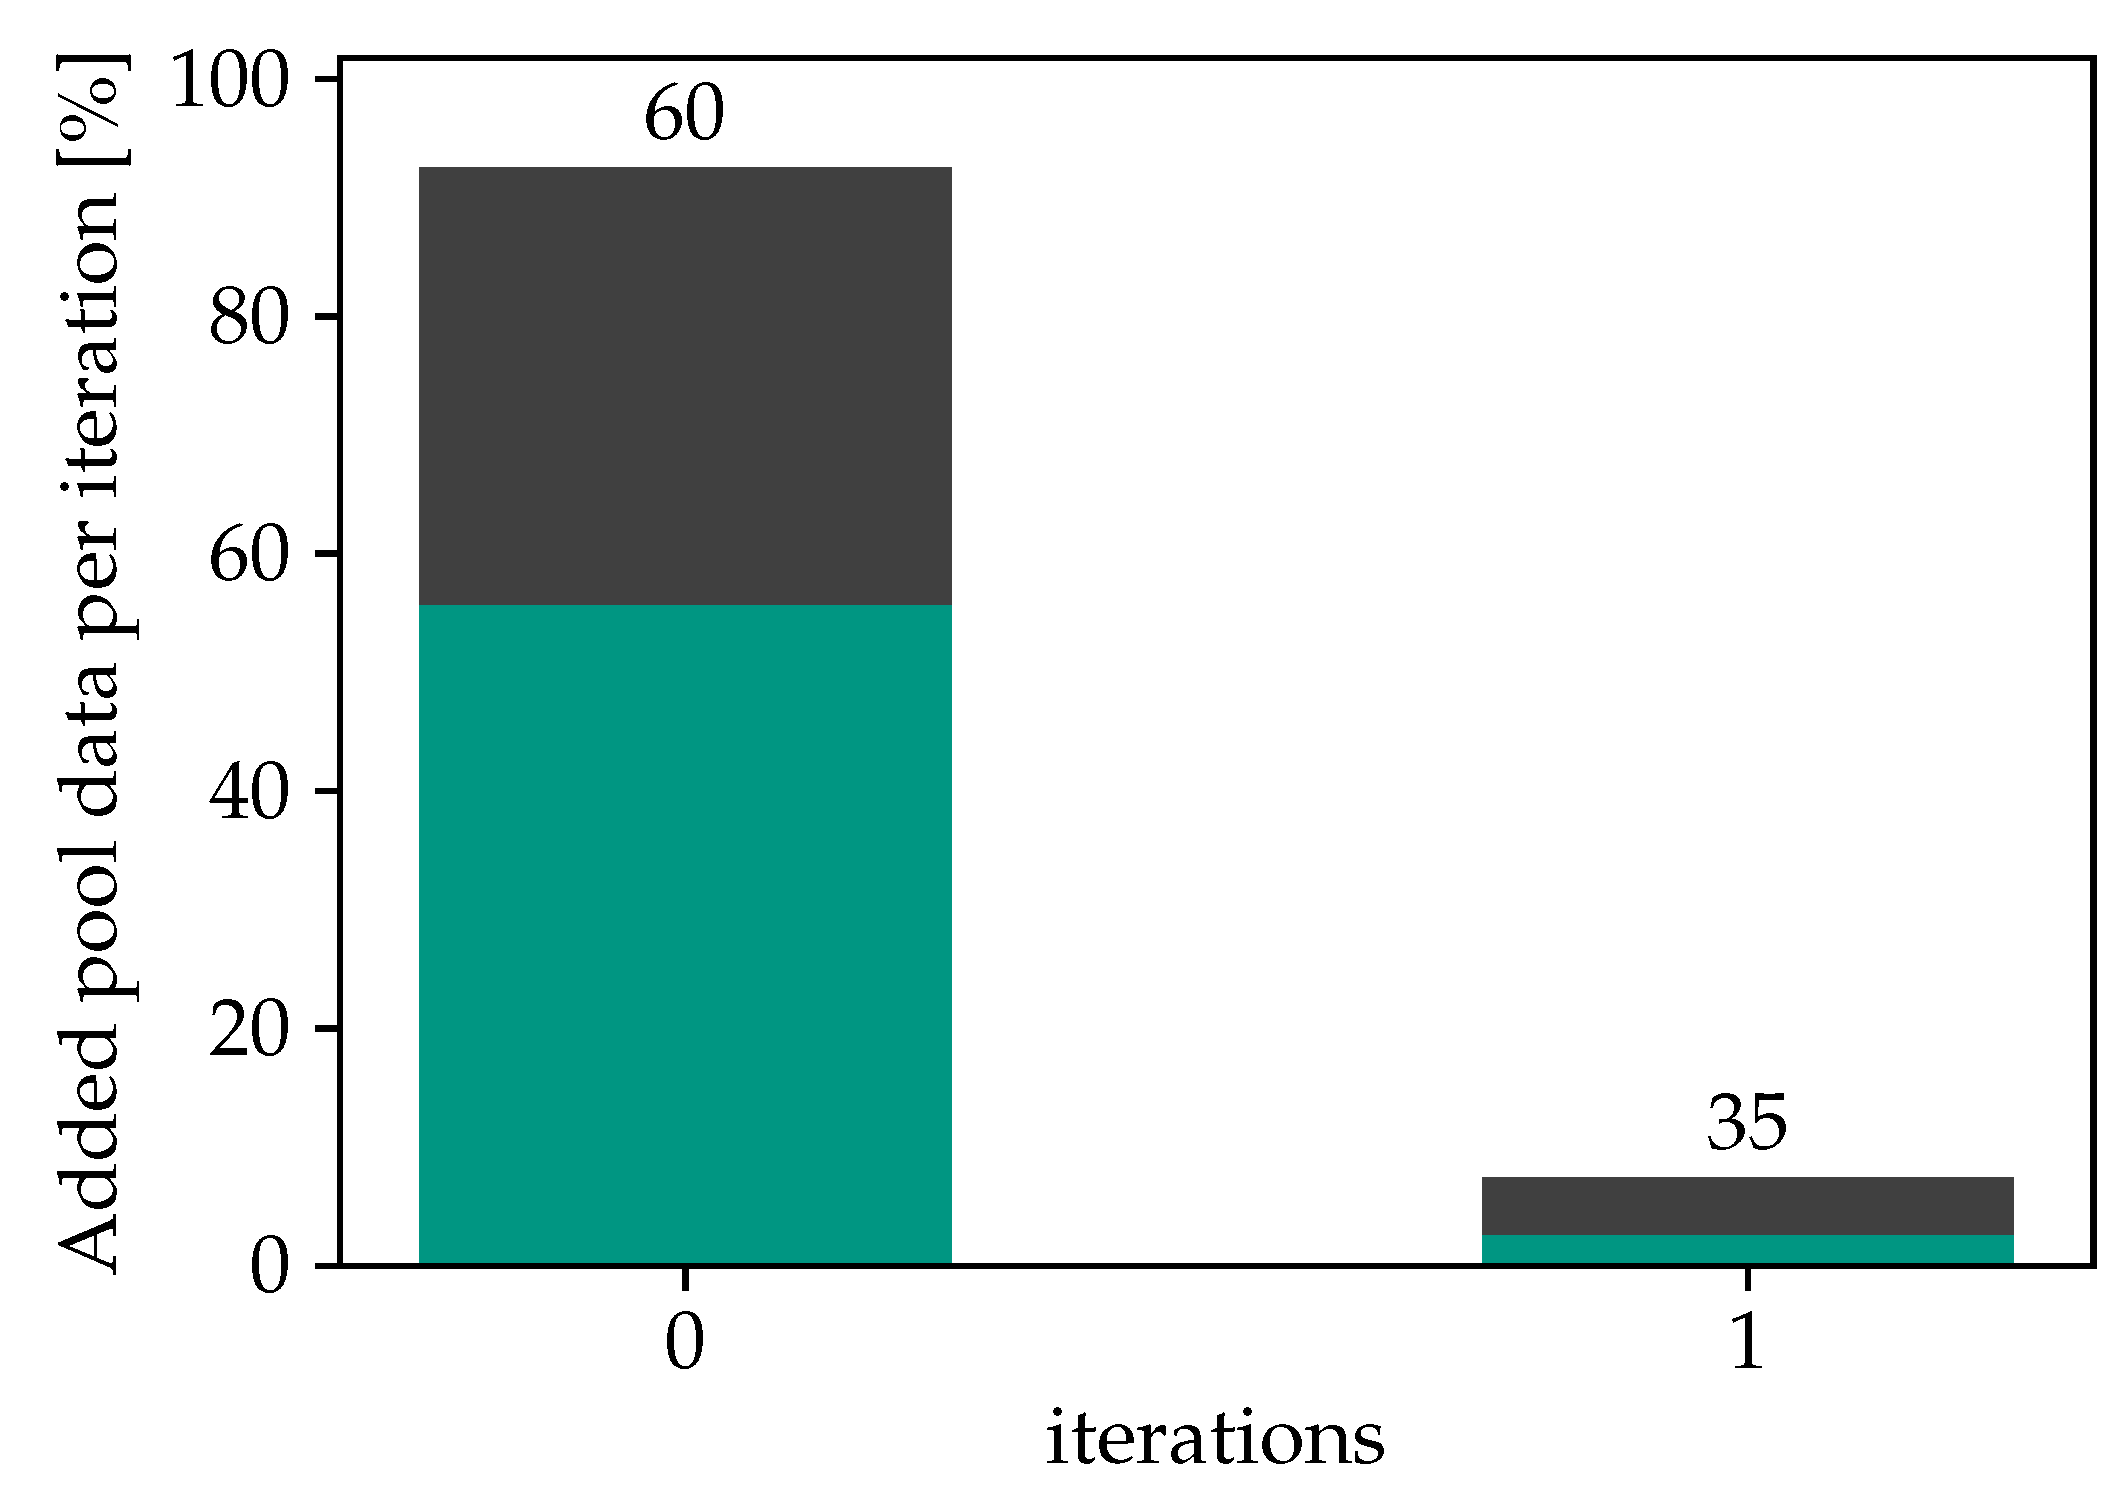
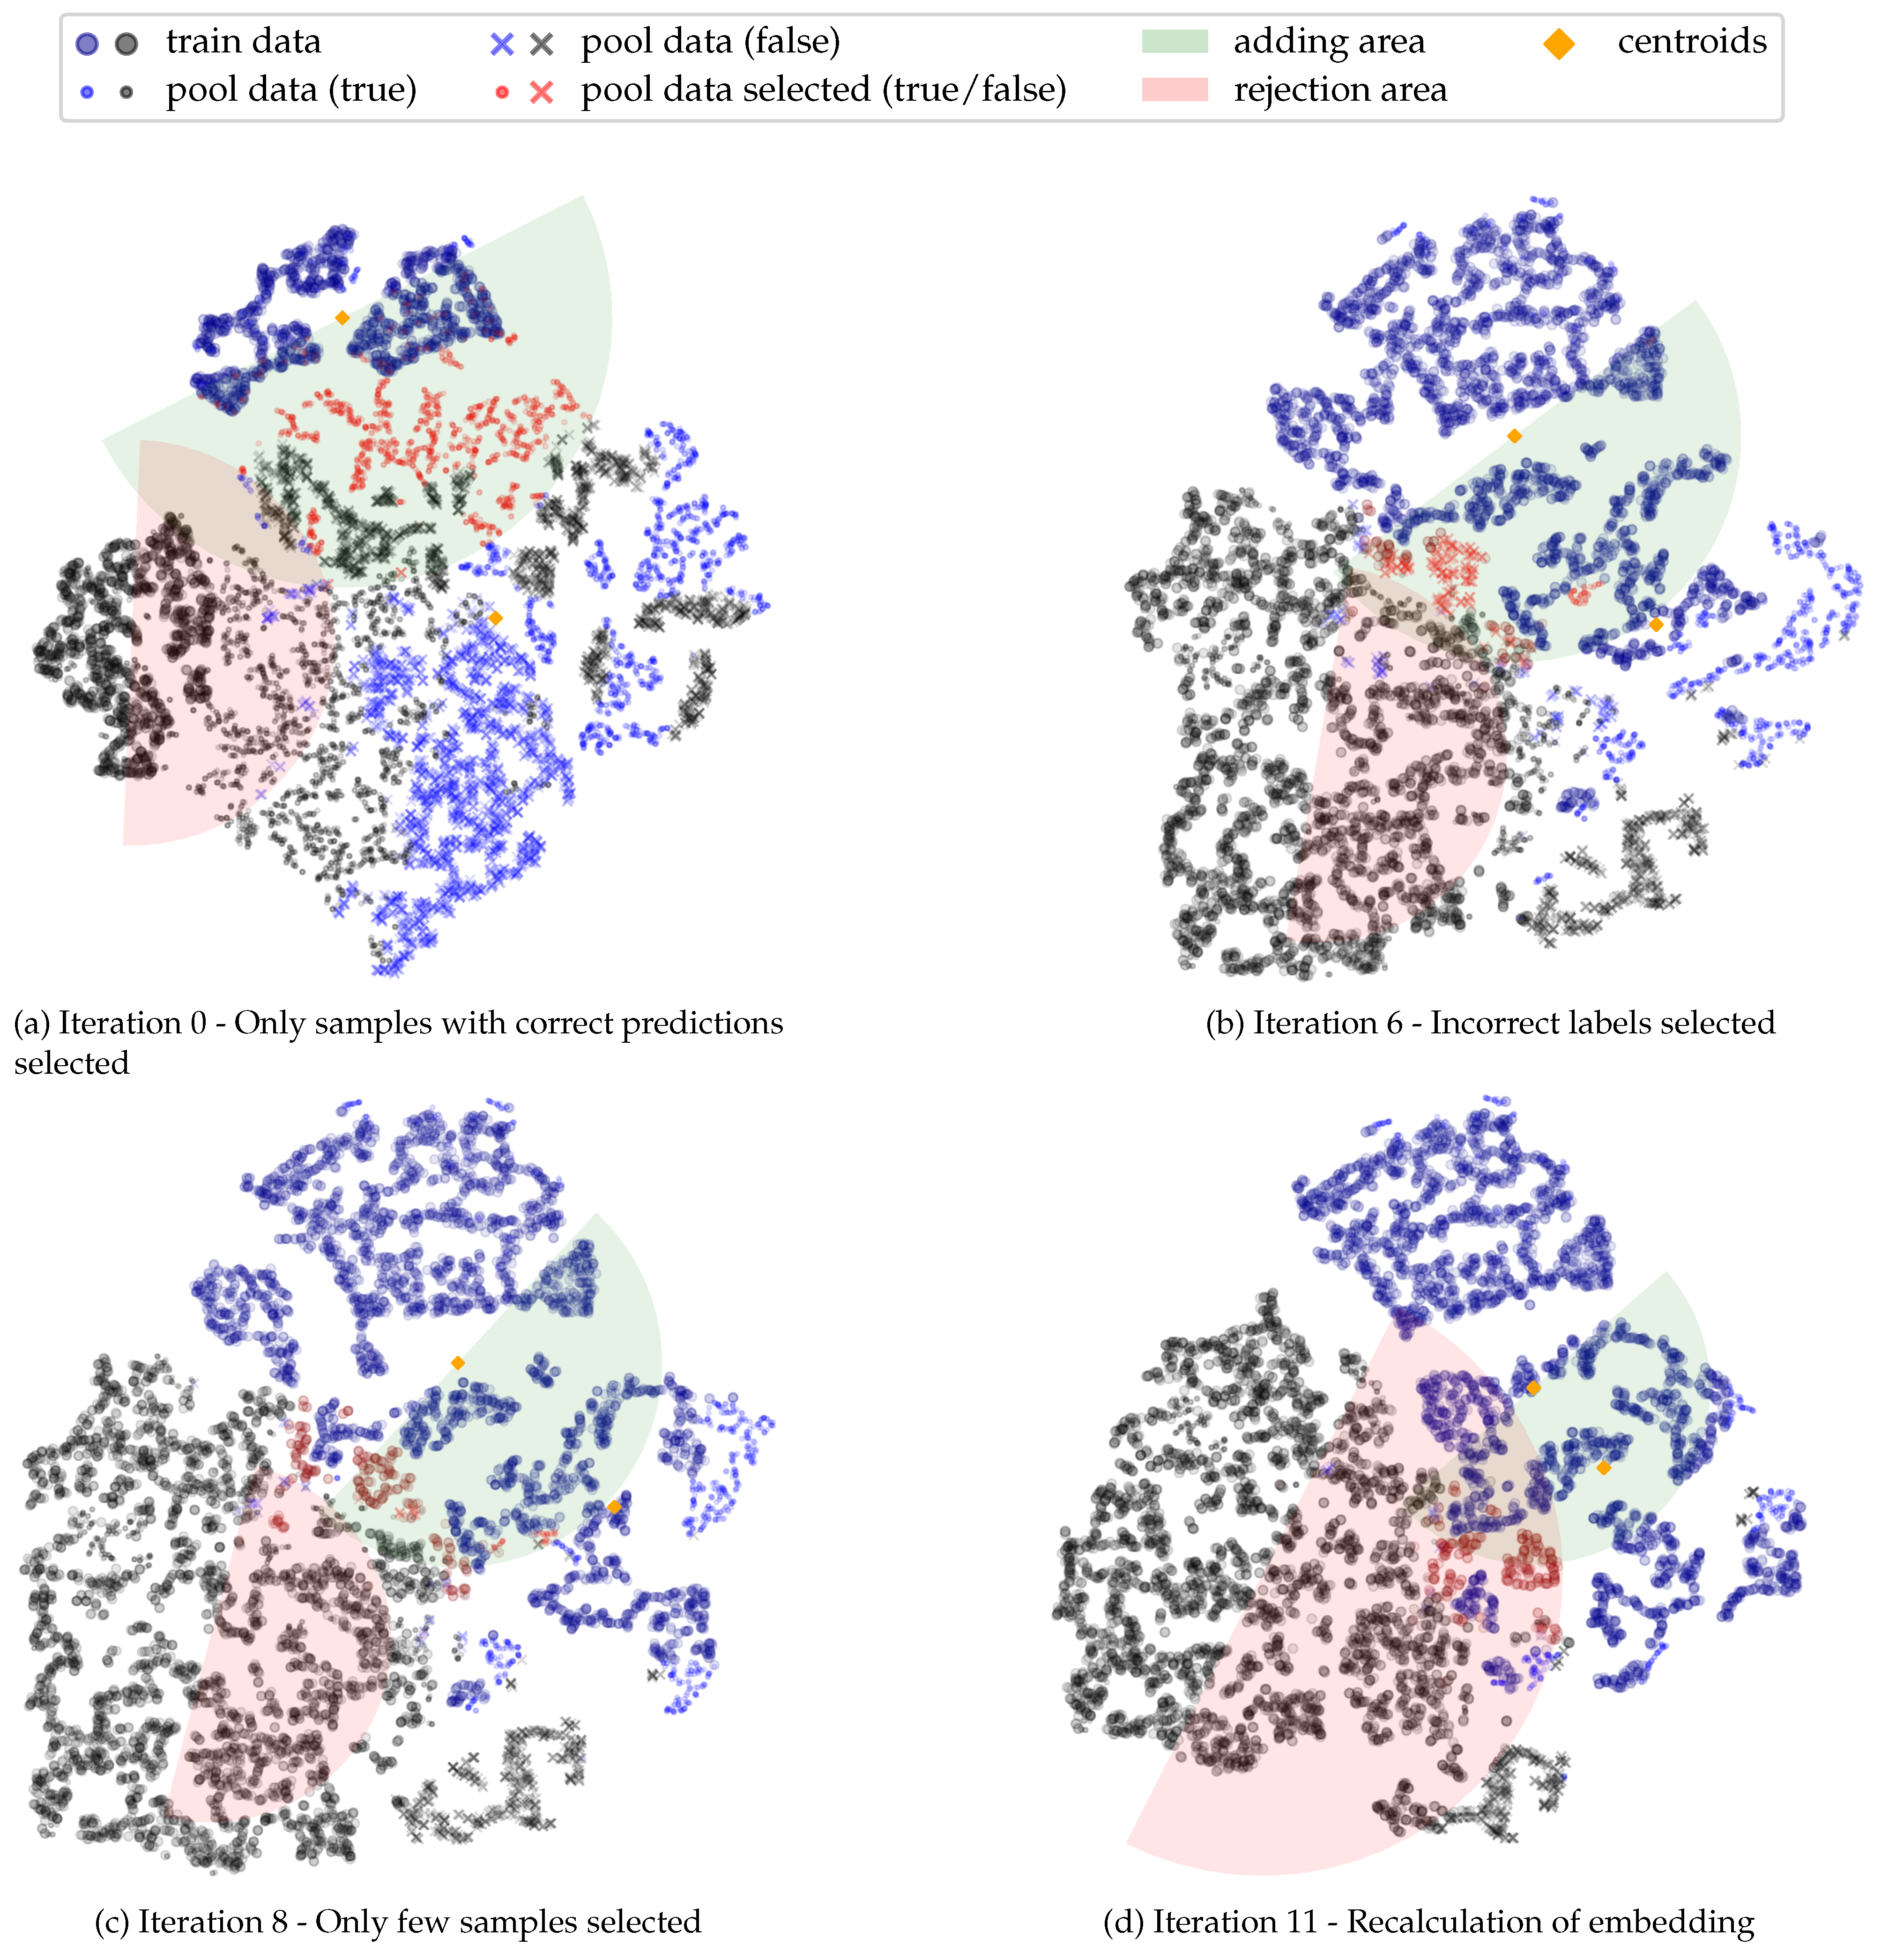
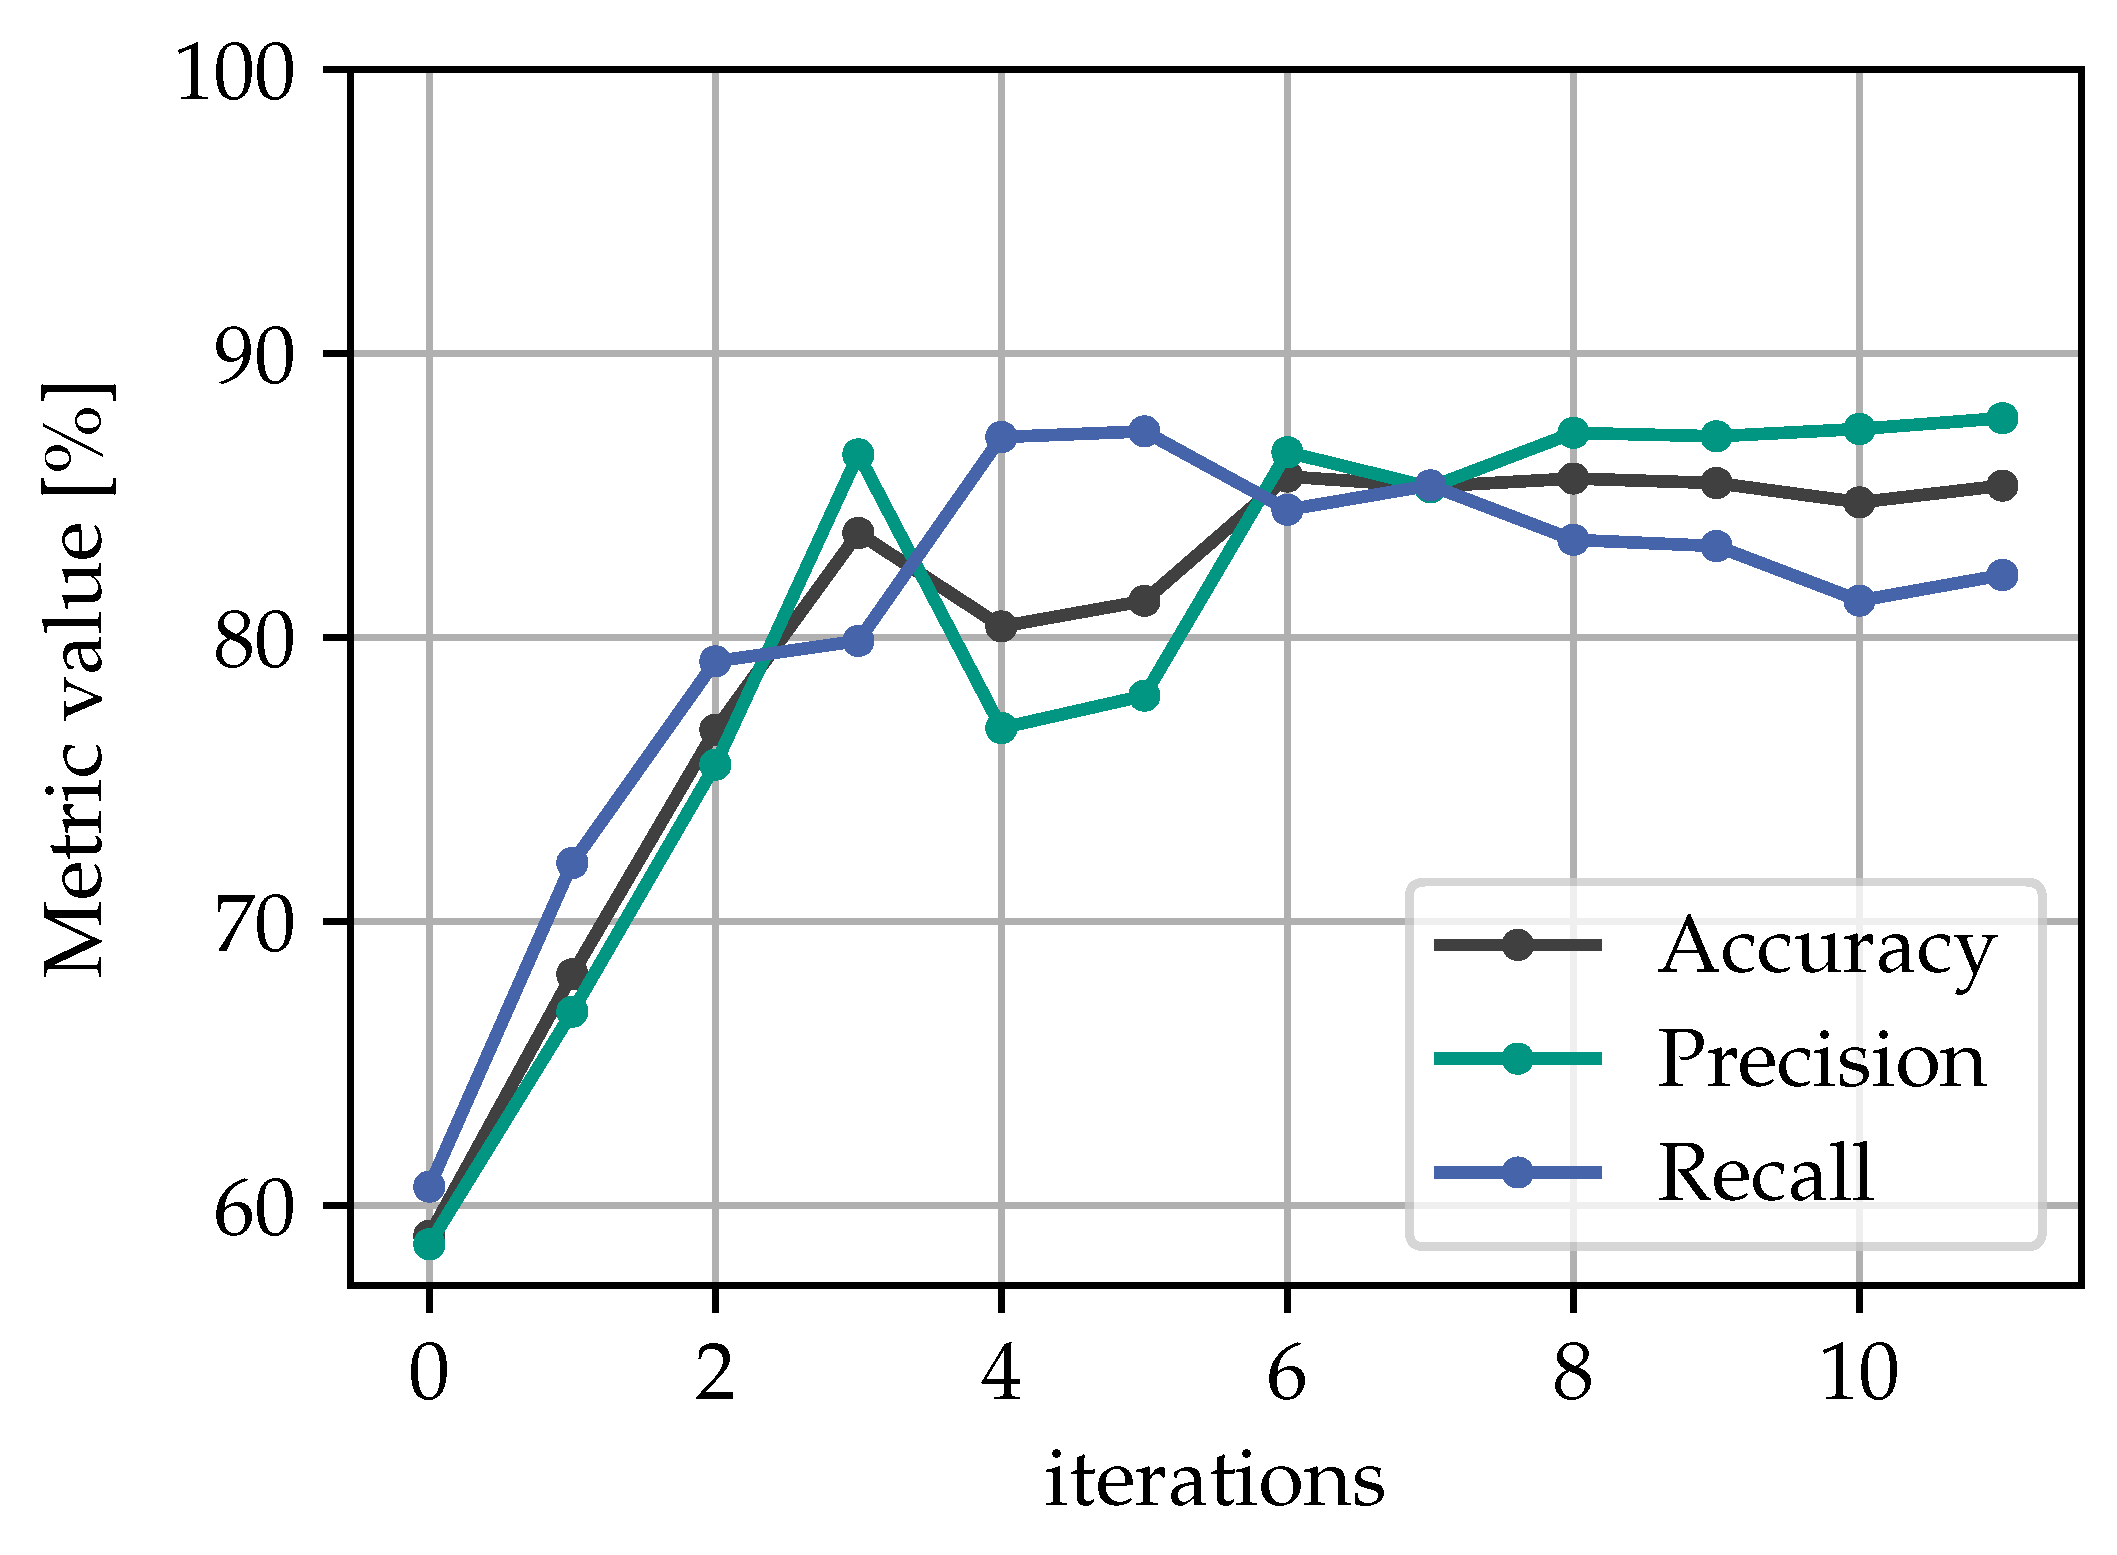
5.1. Learning Process

We first examine the learning process by looking at the quantity and quality of the selected pool data samples, as well as the embedding space during the learning process using t-SNE in combination with the simple radius selection method ( r 1 ). Figure 3 reports the details of the learning process via demonstrating (i) the percentage of the accepted pseudo-labels with respect to the initial pool data and (ii) the calculated accuracy of the binary classification task at each iteration. It should be reminded that these samples are subsequently added to the training data in the next iteration and therefore play a crucial role in the overall success of the method.
Focusing on t-SNE using r 1 in Figure 3a, it is evident that for the first five iterations, almost no pool data samples with incorrect predictions were selected, indicating that the model’s accuracy on the test dataset is likely to improve. However, it is worth noting that in the subsequent iterations, it becomes increasingly difficult to avoid adding samples with incorrect labels to the training data. The accuracy of the selected pool samples reaches a minimum of 45% during these later iterations, though in most cases it is above 90%. Additionally, the overall proportion of pool data added to the training dataset per iteration remains relatively low, at a maximum of 27%. The overall number of samples selected per iteration serves as a form of learning rate, as increasing the number of samples per iteration could lead to faster potential improvement in the model’s accuracy but at the same time increases the proportion of mislabeled data in the training set. This emphasizes the importance of balancing the quantity and quality of samples selected per iteration to achieve optimal model performance. To underscore the significance of the embedding filtering step, Figure 4 demonstrates the results obtained from a purely self-supervised approach, i.e., using only the confidence filter of the classifier. The findings reveal a rather poor accuracy of about 60% on the test dataset when relying solely on the model’s confidence scores to select samples. Additionally, nearly all samples pass the filter in the first iteration, evidenced by the fact that the model’s confidence scores exceed 95% for more than 90% of the samples. The results are not affected by adjustments to the confidence threshold to higher values either. In the test runs with the reviewer approach, on the other hand, the confidence filter becomes important in later iterations. The model yields a wider range of confidence distribution, as more samples from the target domain are added into the training dataset.
In order to further investigate the reviewing process, in Figure 5 we present the corresponding embedding plots for iterations 0, 6, 8, and 11, with a focus on the selection process for class B. As shown in Figure 3a, in the first iteration, almost all accepted pool samples had been correctly classified by the model. However, in iteration 6, the rejection semicircle of class A is not large enough to reject the misclassified samples, which will consequently be added to the training dataset in the next iteration. It is worth noting that the majority of misclassified pool samples by the model are either in the boundary zone between the two classes or have a significant distance from the training data centroid (Figure 5). This supports our assumption that the accuracy of predictions for similar images is higher, and the position of the training data centroids should be included in the selection process. After eight iterations, most of the pool data had already been included in the training set, and only a few additional samples can be selected. Recalculating the embeddings in addition to increasing the semicircle radius did not lead to an increase in the number of selected samples at this point. Because this was the case for the last five iterations, the algorithm stopped after iteration 11. The remaining samples were added based on the most recent classifier.

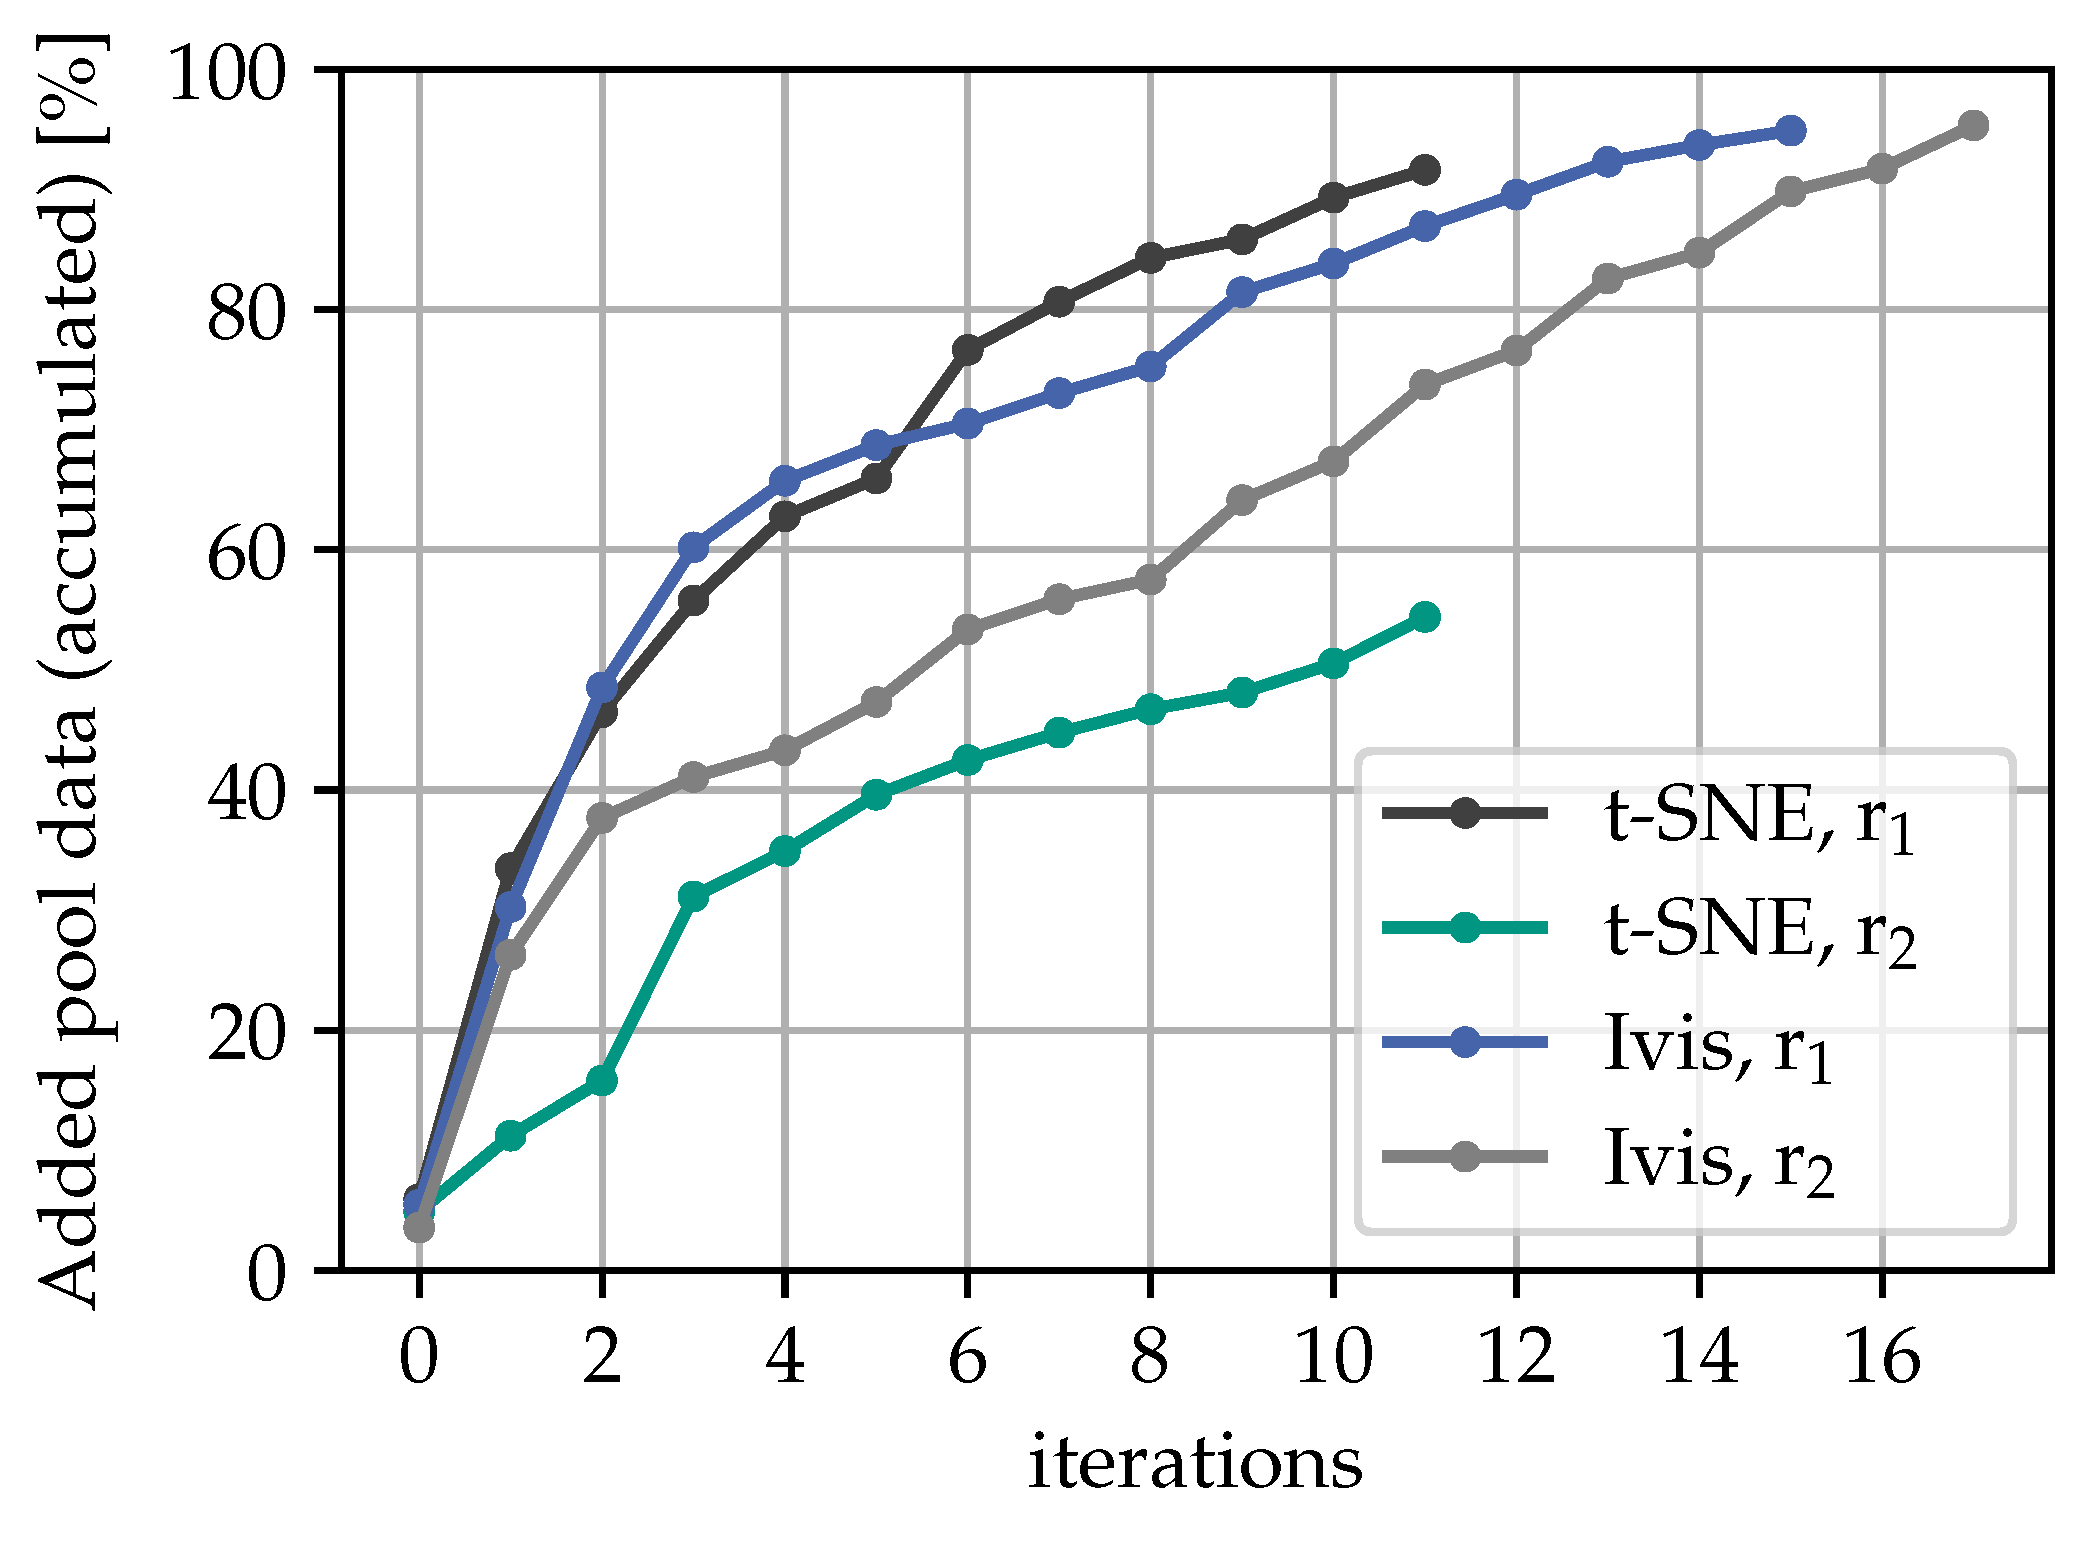
5.2. Evaluation of Alternative Review Procedures

Next, we turn to an analysis of the quantity and quality of the selected data samples per iteration for the different combinations of t-SNE/Ivis and r 1 / r 2 . In Figure 6, the accumulated amount of pool data that was added to the training dataset of the next iteration until the training process stopped is shown for all cases. Typically, a larger number of samples are selected in the first iteration compared to later iterations. Almost 95% of the whole pool data was added iteratively before the loop was terminated, except the t-SNE projection with r 2 policy regularization, which added up to 56%. When comparing the results obtained using r 1 and r 2 as the radius for the filtering shape, it is evident that using r 1 leads to the selection of more samples in the first iterations. Specifically, after two iterations almost 50% of the pool data have already been selected using r 1 , whereas it takes six iterations to reach the same level using r 2 . The comparison shows that regularization technique functions as expected, yet without much noticeable improvement in the accuracy rates. Results further suggest that alternative and/or adaptive domain regularization methods should be investigated. One suggestion here is to deploy a transition between r 1 to r 2 based on the percentage of the remaining pool data, which may be more effective at identifying and selecting relevant samples early on in the training process. It is also seen that t-SNE leads to a higher accuracy rate most of the time compared to the Ivis method, as shown in Figure 3. During some iterations, especially when using Ivis in combination with r 2 , the accuracy falls below 50%.

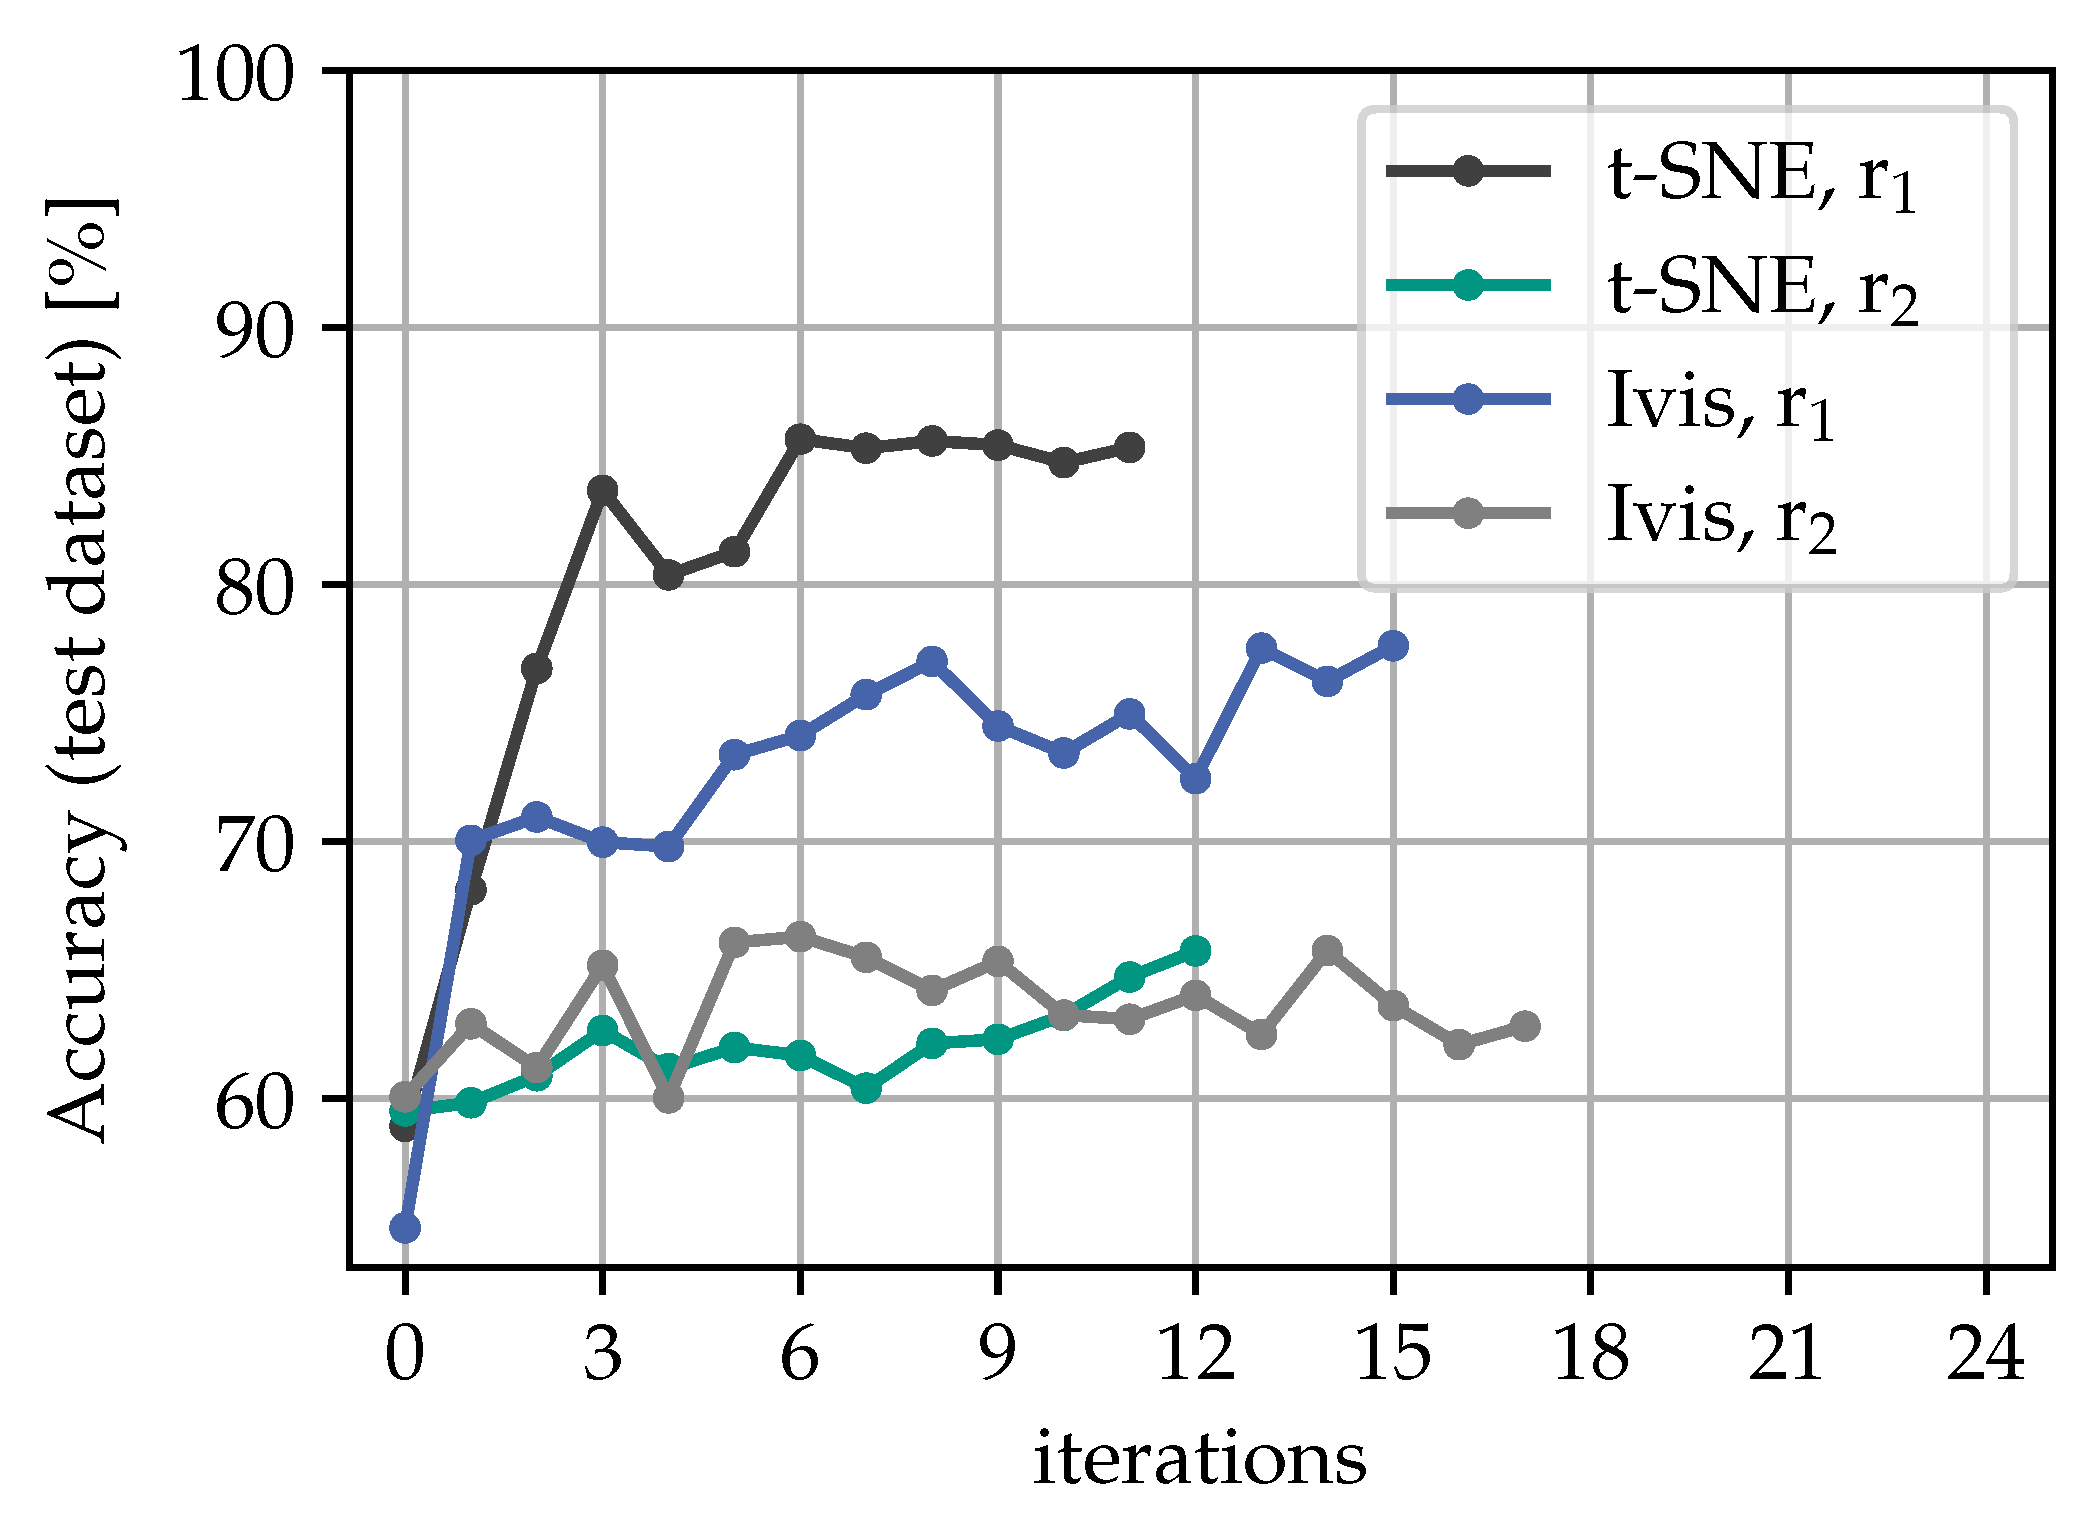
5.3. Accuracy Assessment on Test Dataset

Figure 7 depicts the accuracy, precision, and recall score at every iteration on the test dataset using t-SNE and r 1 . The precision and recall curve is only shown for class B, as they look very similar to that of class A. When the classifier is tested on the data with the domain shift, the initial accuracy is found be around 55%, whereas it is at about 99% in the test data without the domain shift. With the peer reviewing policy, the model’s accuracy increases to 85% after six iterations. The course of the precision and recall scores follow a similar pattern, except those of iterations 4–6 where the precision temporarily drops to 77%, and the recall score increases to 88%. This can be explained by the model being biased towards class B during these iterations. In order to test the repeatability of our method, we performed four different runs with t-SNE embedding and r 1 as the radius of the acceptance/rejection semicircles. The results of that investigation are shown in Figure 8. It is clear that the resulting accuracy plots cannot be identical due to the stochastic nature of the t-SNE. Nonetheless, the overall learning history looks similar with different projections and converge to a similar accuracy score at around 87% with a maximum difference of approximately 5%.
In an attempt to better see whether the peer reviewing approach outperforms a baseline model, we conducted a simple self-supervised learning policy, where the classifier confidence was used as the only filter for adding pseudo-labeled instances to the training set. In this case, however, the accuracy of the basic approach did not change significantly once all the pool data were added (58%), which illustrates the added value of using the direction vectors to explore the unknown feature space for fully automating the self-learning schemes.
Figure 9 compares the predictive accuracy of all four approaches on the test dataset. It can be seen that after the first learning loop, methods with no regularization ( r 1 ) outperform those with regularization ( r 2 ) by a margin. In the course of the iterations, the accuracy curves converge to different maximum scores. Using r 2 results in a maximum accuracy of only around 65% for both embedding methods, whereas using r 1 results in an increase in accuracy to around 89% for t-SNE and 78% for Ivis. With t-SNE projection, a total accuracy increase of 29% is achieved. It should be emphasized that this increase in accuracy was not due to any external input, but rather achieved as a result of the selection process based on relative metric learning in the embedding space. This highlights the effectiveness of the proposed reviewing policy, particularly for scenarios with noticeable domain shifts.

5.4. Assessment of the Proposed Method with Alternative Classifiers

In an attempt to quantify the robustness of the proposed approach, we performed a comparative analysis with classifiers of different complexities in terms of their pattern recognition capabilities, namely support vector machines [39], ResNet 34 [36], DenseNet 121 [40], and InceptionV3 [41]. For that purpose, we first assess the predictive accuracy of all classifiers trained in source domain and tested in the source and target domains (Figure 10). Comparisons reveal a distinct accuracy gap across all classifiers, attributable to the presence of a domain shift. In other words, employing a more complex pattern recognition approach alone is not sufficient to rectify the distribution misalignment between the two domains. On the other hand, once the classifiers are deployed in the proposed UDA scheme, all models expand their knowledge base by incorporating similar examples from the pool data iteratively. In particular, when the pseudo-labels of the pool data accepted by the reviewing process are updated after each iteration, allowing the classifier to correct its previous mistakes, the predictive accuracy of all models increases drastically. The results of this comparison are depicted in Figure 11, revealing a consistent improvement in accuracy for all classifiers, with a minimum gain of 37%. This observation underscores the capabilities of the proposed algorithm to explore the target domain gradually and in a directed way while highlighting its robustness and its ability to operate effectively with classifier of different complexity.

6. Discussions

Our method proposes to use all information extracted from the potential shift in class centroids in terms of directed vectors and regularized, gradual feature space exploration, which is considered to be particularly useful when the unlabeled data include concept drifts in the physical feature space. In an attempt to test this idea, we created a dataset related to gas–solid flow characterization experiments in which the human-generated labels typically cover a fraction of the operating parameters.
As in self-supervised approaches, we only rely on model predictions to minimize the human supervision needed, particularly for a new case study. In addition to model confidence as a filter for learning, we apply the principles of metric learning to assess the shifts in class centroid (in lower dimensional projections) based on the relative information provided by the classifier. Herein, we utilize all the positive and negative feedbacks extracted from the proposed pseudo-labels in the form of direction vectors connecting the current and the proposed class centroids. The reviewer algorithm accepts the current labeled data as the state of the art and checks how much the new proposal (pseudo-labels) is consistent with the known ground truth (most recent training data) by considering the potential re-partitioning of the projected feature space. This is performed in a single step by considering the domain shift vectors of all classes, which are directed from the training sample centroids to the pseudo-labeled pool centroids. If the position of the pseudo-labels in the latent space do not agree with the potential domain shifts in all classes, the algorithm rejects the proposed labels for those instances at the given iteration. All pseudo-labeled pool samples that pass both filters are added to the training dataset, helping to improve the model performance in the next iteration. With this approach, we were able to improve the accuracy of predicting the class from initially 55 % to 85 %. Finally, we relaxed the constraint on pseudo-labels and allowed the algorithm to update them for the additional pool samples after each iteration. In other words, the classifier is given the opportunity to refine the pseudo-labels at iteration i during a subsequent iteration i+j, with the benefit of additional evidence (more pseudo-labeled data). This modification further enhanced the model’s accuracy on the target domain, increasing it from approximately 60% to 100%. Ultimately, we deployed the proposed UDA algorithm with various classifiers, demonstrating the robustness of our methodology, which proved effective regardless of the complexity of the pattern recognition method used.
From those findings we can conclude that the labeling process performed by a human can be at least partially replaced. We called our approach peer reviewing, because the learning metric deployed as the reviewer also has access the same labeled training set, but examines the proposed pseudo-labels from a different perspective. Herein, the quality of the reviewing process can be improved by utilizing multiple reviewers (projections and distance descriptions) with different initialization or partial knowledge of the training set (similar to masking policies). The approach can be further strengthened with other augmentation techniques. An important point here is that the feature space exploration was found to be increasing the model’s accuracy drastically if it is both gradual and directed, indicating a vector field in the embedding space. In our implementation, we used the direction vector of the centroid shift as a supporting information to expand class domains asymmetrically and in the direction of the available information, unlike the clustering-based approaches that grow in every direction. We also showed that it is both intuitive and easy to implement either more strict or relaxed regularization schemes for directed domain exploration, which can be guided through the rate of pseudo-label addition, analogous to the momentum approach in gradient descent. We are currently working on testing our approach on different benchmark datasets from the domain adaptation community such as VisDA2017 and Office-Home and extend it to be applicable to multiclass classification problems.

7. Conclusions

In conclusion, our method presents a novel approach for leveraging unlabeled data with concept drifts in the physical feature space. By utilizing directed vectors and gradual feature space exploration, we aim to minimize human supervision and improve the model performance. Through experiments on a custom particle dataset originating from the multiphase flow community, we successfully addressed the challenge of domain shift between slightly rotated and randomly rotated particles. By leveraging our method, the accuracy of the model on the test data significantly increased from 60% to around 90% without requiring any external input. This improvement demonstrates the effectiveness of our approach in adapting a pre-trained model from a source domain to achieve high accuracy in a target domain.

Author Contributions

Conceptualization, J.A. and C.A.; methodology, J.A. and C.A.; software, J.A.; validation, J.A. and C.A; formal analysis, J.A., C.A. and J.C.; writing—original draft preparation, J.A. and C.A.; writing—review and editing, C.A., J.C. and R.K.; visualization, J.A.; supervision, C.A., R.K. and H.-J.B.; project administration, C.A and H.-J.B.; funding acquisition, C.A. and H.-J.B. All authors have read and agreed to the published version of the manuscript.

Funding

This research was funded by Baden-Württemberg Stiftung, grant number “Elite Program for Postdocs”.

Data Availability Statement

The data presented in this study are available on request from the corresponding author.

Acknowledgments

This study is partially financially supported by the Baden-Württemberg Foundation, through the Elite Program for Postdocs. We acknowledge support by the KIT-Publication Fund of the Karlsruhe Institute of Technology.

Conflicts of Interest

The authors declare no conflict of interest. The funders had no role in the design of the study; in the collection, analyses, or interpretation of data; in the writing of the manuscript; or in the decision to publish the results.

Abbreviations

The following abbreviations are used in this manuscript:
ARAspect Ratio
DANDeep Adaptation Networks
DANNDomain Adversarial Training for Neural Networks
D-CORALDeep-Correlation Alignment
JANJoint Adaptation Networks
MSTNMoving Semantic Transfer Network
t-SNEt-Distributed Stochastic Neighbor Embedding
VDAVisual Domain Adaptation

Appendix A. Algorithm Flowchart

Figure A1. Algorithm flowchart.
Make 05 00074 g0a1

References

  1. Ke, Z.; Qiu, D.; Li, K.; Yan, Q.; Lau, R.W.H. Guided Collaborative Training for Pixel-Wise Semi-Supervised Learning. In Proceedings of the Computer Vision—ECCV 2020, Glasgow, UK, 23–28 August 2020; pp. 429–445. [Google Scholar]
  2. Chum, L.; Subramanian, A.; Balasubramanian, V.N.; Jawahar, C.V. Beyond Supervised Learning: A Computer Vision Perspective. J. Indian Inst. Sci. 2019, 99, 177–199. [Google Scholar] [CrossRef]
  3. Schmarje, L.; Santarossa, M.; Schroder, S.M.; Koch, R. A Survey on Semi-, Self- and Unsupervised Learning for Image Classification. IEEE Access 2021, 9, 82146–82168. [Google Scholar] [CrossRef]
  4. Jeong, J.; Lee, S.; Kim, J.; Kwak, N. Consistency-based Semi-supervised Learning for Object detection. In Proceedings of the Advances in Neural Information Processing Systems; Wallach, H., Larochelle, H., Beygelzimer, A., d’Alché-Buc, F., Fox, E., Garnett, R., Eds.; Curran Associates, Inc.: Red Hook, NY, USA, 2019; Volume 32. [Google Scholar]
  5. Zhai, X.; Oliver, A.; Kolesnikov, A.; Beyer, L. S4L: Self-Supervised Semi-Supervised Learning. In Proceedings of the 2019 IEEE/CVF International Conference on Computer Vision (ICCV), Seoul, Republic of Korea, 27 October–2 November 2019; pp. 1476–1485. [Google Scholar] [CrossRef]
  6. Zhang, R.; Liu, S.; Yu, Y.; Li, G. Self-supervised Correction Learning for Semi-supervised Biomedical Image Segmentation. In Proceedings of the Medical Image Computing and Computer Assisted Intervention—MICCAI 2021, Strasbourg, France, 27 September–1 October 2021; pp. 134–144. [Google Scholar]
  7. Xu, H.M.; Liu, L.; Gong, D. Semi-supervised Learning via Conditional Rotation Angle Estimation. In Proceedings of the 2021 Digital Image Computing: Techniques and Applications (DICTA), Gold Coast, Australia, 29 November–1 December 2021; pp. 1–8. [Google Scholar]
  8. Fan, Y.; Kukleva, A.; Dai, D.; Schiele, B. Revisiting Consistency Regularization for Semi-Supervised Learning. Int. J. Comput. Vis. 2022, 131, 626–643. [Google Scholar] [CrossRef]
  9. Yang, X.; Song, Z.; King, I.; Xu, Z. A Survey on Deep Semi-Supervised Learning. IEEE Trans. Knowl. Data Eng. 2023, 35, 8934–8954. [Google Scholar] [CrossRef]
  10. Su, J.C.; Cheng, Z.; Maji, S. A Realistic Evaluation of Semi-Supervised Learning for Fine-Grained Classification. In Proceedings of the 2021 IEEE/CVF Conference on Computer Vision and Pattern Recognition (CVPR), Nashville, TN, USA, 20–25 June 2021. [Google Scholar] [CrossRef]
  11. Antonelli, S.; Avola, D.; Cinque, L.; Crisostomi, D.; Foresti, G.L.; Galasso, F.; Marini, M.R.; Mecca, A.; Pannone, D. Few-Shot Object Detection: A Survey. ACM Comput. Surv. 2022, 54, 1–37. [Google Scholar] [CrossRef]
  12. Köhler, M.; Eisenbach, M.; Gross, H.M. Few-Shot Object Detection: A Comprehensive Survey. arXiv 2021, arXiv:2112.11699v2. [Google Scholar] [CrossRef]
  13. Calderon-Ramirez, S.; Yang, S.; Elizondo, D. Semisupervised Deep Learning for Image Classification with Distribution Mismatch: A Survey. IEEE Trans. Artif. Intell. 2022, 3, 1015–1029. [Google Scholar] [CrossRef]
  14. Pan, S.; Yang, Q. A survey on transfer learning. IEEE Trans. Knowl. Data Eng. 2010, 22, 1345–1359. [Google Scholar] [CrossRef]
  15. Fan, M.; Cai, Z.; Zhang, T.; Wang, B. A survey of deep domain adaptation based on label set classification. Multimed. Tools Appl. 2022, 81, 39545–39576. [Google Scholar] [CrossRef]
  16. Gong, B.; Grauman, K.; Sha, F. Connecting the Dots with Landmarks: Discriminatively Learning Domain-Invariant Features for Unsupervised Domain Adaptation. PMLR 2013, 28, 222–230. [Google Scholar]
  17. Bruzzone, L.; Marconcini, M. Domain Adaptation Problems: A DASVM Classification Technique and a Circular Validation Strategy. IEEE Trans. Pattern Anal. Mach. Intell. 2010, 32, 770–787. [Google Scholar] [CrossRef]
  18. Noori Saray, S.; Tahmoresnezhad, J. Joint distinct subspace learning and unsupervised transfer classification for visual domain adaptation. Signal Image Video Process. 2021, 15, 279–287. [Google Scholar] [CrossRef]
  19. Dudley, A.; Nagabandi, B.; Venkateswara, H.; Panchanathan, S. Domain Adaptive Fusion for Adaptive Image Classification. In Proceedings of the Smart Multimedia, San Diego, CA, USA, 16–18 December 2019; pp. 357–371. [Google Scholar] [CrossRef]
  20. Zhou, X.; Xu, X.; Venkatesan, R.; Swaminathan, G.; Majumder, O. d-SNE: Domain Adaptation Using Stochastic Neighborhood Embedding; Springer International Publishing: Berlin/Heidelberg, Germany, 2020; pp. 43–56. [Google Scholar] [CrossRef]
  21. Deng, W.; Zhao, L.; Kuang, G.; Hu, D.; Pietikainen, M.; Liu, L. Deep Ladder-Suppression Network for Unsupervised Domain Adaptation. IEEE Trans. Cybern. 2022, 52, 10735–10749. [Google Scholar] [CrossRef]
  22. Sun, B.; Saenko, K. Deep CORAL: Correlation Alignment for Deep Domain Adaptation. Technical report. arXiv 2016, arXiv:1607.01719. [Google Scholar] [CrossRef]
  23. Long, M.; Cao, Y.; Wang, J.; Jordan, M. Learning Transferable Features with Deep Adaptation Networks. PMLR 2015, 37, 97–105. [Google Scholar]
  24. Long, M.; Zhu, H.; Wang, J.; Jordan, M.I. Deep Transfer Learning with Joint Adaptation Networks. Technical report. arXiv 2017, arXiv:1605.06636. [Google Scholar] [CrossRef]
  25. Lin, S.; Zhang, Z.; Huang, Z.; Lu, Y.; Lan, C.; Chu, P.; You, Q.; Wang, J.; Liu, Z.; Parulkar, A.; et al. Deep Frequency Filtering for Domain Generalization. Technical report. arXiv 2023, arXiv:2203.12198. [Google Scholar] [CrossRef]
  26. Gu, X.; Sun, J.; Xu, Z. Spherical Space Domain Adaptation with Robust Pseudo-Label Loss. In Proceedings of the 2020 IEEE/CVF Conference on Computer Vision and Pattern Recognition (CVPR), Seattle, WA, USA, 13–19 June 2020; pp. 9098–9107. [Google Scholar] [CrossRef]
  27. Ganin, Y.; Ustinova, E.; Ajakan, H.; Germain, P.; Larochelle, H.; Laviolette, F.; March, M.; Lempitsky, V. Domain-Adversarial Training of Neural Networks. J. Mach. Learn. Res. 2016, 17, 1–35. [Google Scholar]
  28. Xie, S.; Zheng, Z.; Chen, L.; Chen, C. Learning Semantic Representations for Unsupervised Domain Adaptation. PMLR 2018, 80, 5423–5432. [Google Scholar]
  29. Karim, N.; Mithun, N.C.; Rajvanshi, A.; Chiu, H.P.; Samarasekera, S.; Rahnavard, N. C-SFDA: A Curriculum Learning Aided Self-Training Framework for Efficient Source Free Domain Adaptation. Technical report. arXiv 2023, arXiv:2303.17132. [Google Scholar] [CrossRef]
  30. Litrico, M.; Del Bue, A.; Morerio, P. Guiding Pseudo-labels with Uncertainty Estimation for Source-free Unsupervised Domain Adaptation. Technical report. arXiv 2023, arXiv:2303.03770. [Google Scholar] [CrossRef]
  31. Tahmoresnezhad, J.; Hashemi, S. Visual domain adaptation via transfer feature learning. Knowl. Inf. Syst. 2017, 50, 585–605. [Google Scholar] [CrossRef]
  32. Liu, Y.; Zhou, Z.; Sun, B. COT: Unsupervised Domain Adaptation with Clustering and Optimal Transport. In Proceedings of the 2023 IEEE/CVF Conference on Computer Vision and Pattern Recognition (CVPR), Vancouver, BC, Canada, 18–22 June 2023; pp. 19998–20007. [Google Scholar]
  33. Krueger, B.; Wirtz, S.; Scherer, V. Measurement of drag coefficients of non-spherical particles with a camera-based method. Powder Technol. 2015, 278, 157–170. [Google Scholar] [CrossRef]
  34. Ates, C.; Arweiler, J.; Hadad, H.; Koch, R.; Bauer, H.J. Secondary Motion of Non-Spherical Particles in Gas Solid Flows. Processes 2023, 11, 1369. [Google Scholar] [CrossRef]
  35. Cai, J.; Peng, Z.; Wu, C.; Zhao, X.; Yuan, Z.; Moghtaderi, B.; Doroodchi, E. Numerical Study of the Orientation of Cylindrical Particles in a Circulating Fluidized Bed. Ind. Eng. Chem. Res. 2016, 55, 12806–12817. [Google Scholar] [CrossRef]
  36. He, K.; Zhang, X.; Ren, S.; Sun, J. Deep Residual Learning for Image Recognition. In Proceedings of the 2016 IEEE Conference on Computer Vision and Pattern Recognition (CVPR), Las Vegas, NV, USA, 27–30 June 2016; pp. 770–778. [Google Scholar] [CrossRef]
  37. van der Maaten, L.; Hinton, G. Visualizing Data using t-SNE. J. Mach. Learn. Res. 2008, 9, 2579–2605. [Google Scholar]
  38. Szubert, B.; Drozdov, I. ivis: Dimensionality reduction in very large datasets using Siamese Networks. J. Open Source Softw. 2019, 4, 1596. [Google Scholar] [CrossRef]
  39. Cortes, C.; Vapnik, V. Support-vector networks. Mach. Learn. 1995, 20, 273–297. [Google Scholar] [CrossRef]
  40. Huang, G.; Liu, Z.; van der Maaten, L.; Weinberger, K.Q. Densely Connected Convolutional Networks. In Proceedings of the IEEE Conference on Computer Vision and Pattern Recognition (CVPR), Honolulu, HI, USA, 21–26 July 2017. [Google Scholar]
  41. Szegedy, C.; Vanhoucke, V.; Ioffe, S.; Shlens, J.; Wojna, Z. Rethinking the Inception Architecture for Computer Vision. In Proceedings of the 2016 IEEE Conference on Computer Vision and Pattern Recognition (CVPR), Las Vegas, NV, USA, 27–30 June 2016; pp. 2818–2826. [Google Scholar] [CrossRef]
Figure 1. Sample images of the synthetic cubes and cylinders from both the training/validation dataset (source domain) and the pool/test dataset (target domain).
Make 05 00074 g001
Figure 2. Example embedding space for selecting pool samples for class A and class B.
Make 05 00074 g002
Figure 3. Added pool data per iteration for t-SNE/Ivis and r 1 / r 2 divided into correctly classified (green) and misclassified (black) fractions; the numbers above the bars represent the prediction accuracy in each iteration.
Make 05 00074 g003
Figure 4. Added pool data per iteration for a run without the embedding filter divided into correctly classified (green) and misclassified (black) fractions; the numbers above the bars represent the prediction accuracy in each iteration.
Make 05 00074 g004
Figure 5. Embedding based on t-SNE.
Make 05 00074 g005
Figure 6. Accumulated filtered pool data.
Make 05 00074 g006
Figure 7. Test data metrics for evaluating model over iterations using t-SNE and r 1 .
Make 05 00074 g007
Figure 8. Comparison of different runs using t-SNE and r 1 .
Make 05 00074 g008
Figure 9. Accuracy improvement on test dataset.
Make 05 00074 g009
Figure 10. Loss in accuracy in presence of domain shift for different classifiers.
Make 05 00074 g010
Figure 11. Impact of the proposed UDA algorithm on accuracy for different classifiers.
Make 05 00074 g011
Table 1. Overview of the different datasets used.
DatasetTrainingValidationPoolTest
Samples320080010,00010,000
Rotation 0 ° 15 ° 0 ° 15 ° 0 ° 360 ° 0 ° 360 °
Disclaimer/Publisher’s Note: The statements, opinions and data contained in all publications are solely those of the individual author(s) and contributor(s) and not of MDPI and/or the editor(s). MDPI and/or the editor(s) disclaim responsibility for any injury to people or property resulting from any ideas, methods, instructions or products referred to in the content.

