Introduction to Survival Analysis in Practice


1
Predictive Society and Data Analytics Lab, Faculty of Information Technolgy and Communication Sciences, Tampere University, FI-33101 Tampere, Finland
2
Institute of Biosciences and Medical Technology, FI-33101 Tampere, Finland
3
Steyr School of Management, University of Applied Sciences Upper Austria, 4400 Steyr Campus, Austria
4
Department of Biomedical Computer Science and Mechatronics, UMIT-The Health and Life Science University, 6060 Hall in Tyrol, Austria
5
College of Artificial Intelligence, Nankai University, Tianjin 300350, China
*
Author to whom correspondence should be addressed.
Mach. Learn. Knowl. Extr. 2019, 1(3), 1013-1038; https://doi.org/10.3390/make1030058
Submission received: 31 July 2019
/
Revised: 9 August 2019
/
Accepted: 2 September 2019
/
Published: 8 September 2019
(This article belongs to the Section Learning)
Abstract
:The modeling of time to event data is an important topic with many applications in diverse areas. The collective of methods to analyze such data are called survival analysis, event history analysis or duration analysis. Survival analysis is widely applicable because the definition of an ’event’ can be manifold and examples include death, graduation, purchase or bankruptcy. Hence, application areas range from medicine and sociology to marketing and economics. In this paper, we review the theoretical basics of survival analysis including estimators for survival and hazard functions. We discuss the Cox Proportional Hazard Model in detail and also approaches for testing the proportional hazard (PH) assumption. Furthermore, we discuss stratified Cox models for cases when the PH assumption does not hold. Our discussion is complemented with a worked example using the statistical programming language R to enable the practical application of the methodology.
1. Introduction
In general, survival analysis is defined as a collection of longitudinal analysis methods for interrogating data having time as an outcome variable. Here, time corresponds to the time until the occurrence of a particular event. For instance, an event can be death, heart attack, wear out of a product, divorce or violation of parole. From these diverse examples, it becomes clear that survival analysis can be applied to many problems in different fields. Specifically, survival analysis is utilized in biology, medicine, engineering, marketing, social sciences or behavioral sciences [1,2,3,4,5,6,7,8,9]. Due to the widespread usage of this method across different fields, there are several synonyms used. Alternative names are event history analysis (social sciences), reliability theory (engineering) or duration analysis (economics).
There are two methods that contributed crucially to the development of the field. The first is by Kaplan and Meier who introduced an estimator for survival probabilities [10]. The second is from Cox who introduced what is nowadays called the Cox Proportional Hazard Model (CPHM), which is a regression model [11]. Interestingly, both models are heavily used to date and belong to the toolbox of every data scientist [12].
Over the years, many publications have been written surveying survival analysis, e.g., [13,14,15,16]. However, due to the complexity of the methods, especially for multivariate data, discussions lead easily to confusions. In addition, on the introductory level are reviews available, e.g., [17,18,19,20]; however, these are either purely theoretical or use programming languages (like stata [17] or SAS [21]) that are predominatingly used in epidemiology or biostatistics. In contrast, our review combines a theoretical presentation with a practical realization using the statistical programming language R [22]. R is a language widely used for general problems in data science because it combines features from different programming paradigms. We aim at a comprehensive yet eclectic presentation that is wide enough to comprise all topics needed for a multivariate survival analysis but is, at the same time, comprehensible. In order to accomplish all this, we complement the presentation of the methods with sufficient background information. For instance, we explain in detail the censoring of time events because essentially all methods utilize censoring in order to derive efficient estimators. Furthermore, we derive and discuss important relations, e.g., between a survival function and a hazard function, to demonstrate the interconnectedness of concepts. Finally, we add a worked example that shows how to perform a practical survival analysis with R.
This paper is organized as follows. In the next section, we provide a motivation for survival analysis. Thereafter, we discuss the censoring of time events. Then, we describe general characteristics of survival functions, non-parametric estimator for survival functions and the comparison of two survival curves. After this, we introduce a hazard function needed for the Cox Proportional Hazard Model. If the proportional hazard assumption does not hold, one needs to use a stratified Cox model. Thereafter, we present a section about the practical survival analysis using R. The paper finishes with a brief summary and conclusions.
2. Motivation
Before we define and discuss survival analysis more formally in the following sections, we want to introduce the basic notions on which such an analysis is based on in this section to create an intuitive understanding.
The first point to note is that when we speak about survival we mean probabilities. This means that survival can be ’measured’ as a probability. Second, survival relates to the membership in a group. This means the group consists of a number of subjects and the survival probability is associated with each subject of this group. Importantly, the membership in the group is not constant but can change. Such a change of a membership is initiated by an event. Particular examples for events are:
The event ’death’ is certainly the most severe example that can be given which also gives an intuitive understanding for the name survival analysis. The first five examples from the above list are from a medical context where the members in a group correspond to patients.
Importantly, survival analysis is not limited to medical problems but can also be applied to problems in the social sciences, engineering or marketing, as one can see from the further examples in the above list.
2.1. Effect of Chemotherapy: Breast Cancer Patients
In [34], the effect of neoadjuvant chemotherapy on triple-negative breast cancer patients was studied. Triple-negative breast cancer (TNBC) is characterized by the lack of expression of the three genes: estrogen receptor (ER), progesterone receptor (PR), and human epidermal growth factor receptor 2 (HER-2). In order to compare the survival time of TNBC patients with non-TNBC, the time was measured from surgery (mastectomy) to death. As a result, the authors found that patients with TNBC have a decreased survival compared to non-TNBC patients.
2.2. Effect of Medications: Agitation
In [27], the effect of medications on individuals with schizophrenia has been studied. Due to the complexity of this neuronal disorder, it is rather difficult or even impossible to judge from observing such individuals how long the effect of a medication lasts or the onset of an attack. Hence, measuring ’time to an attack’ is in this case non-trivial because it is not directly observable. In order accomplish this task, the authors used the following experimental design of the study. At a certain time, the patients are using medication administered by an inhaler. Then, the patients are not allowed to re-use the inhaler for two hours. After the two hours, everyone could use the inhaler as required. This allowed the easy measurement of the time between the first and second usage of the inhaler to use as ’time to event’ which could be used to perform a survival analysis to assess about differences in the medications.
In contrast to the breast cancer example above, the agitation example shows that the time to event is not for all problems easy to obtain, but requires sometimes a clever experimental design that enables its measurement.
Taken together, survival analysis examines and models the time for events to occur and the survival probability changes over time. Practically, one needs to estimate this from data of subjects providing information about the time of events. A factor that further complicates this is due to incomplete information caused by censoring. Due to the central role of censoring for essentially all statistical estimators that will be discussed in the following, we discuss the problem with censoring in the next section.
3. Censoring
In order to perform a survival analysis, one needs to record the time to event for the subjects of a group. However, this is not always possible and we have only partial information about time to event. In such a case, one speaks of censoring. Specifically, a patient has a censored survival time if the event has not yet occurred for this patient. This could happen when:
- a patient drop-out of the study, e.g., stops attending the clinic for follow-up examination,
- the study has a fixed time-line and the event occurs after the cut-off time,
- a patient withdraws from a study.
The above examples are called right-censoring [35]. In Figure 1, we visualize the meaning of censoring. For instance, the subjects with the labels ID and ID experience the event within the duration of the study, indicated by a full blue circle. In contrast, the subject ID experiences the event after the end of the study, indicated by an open blue circle. However, this is not observed by the study. The only useable (observable) information we have is that, at the end of the study, subject ID did not yet experience the event. Hence, the survival time of subject ID is censored, as indicated by the red X. This means, until the censoring event occurred (indicated by the red X), subject ID did not experience the event. In addition, for subject ID, we have a censored survival time, however, for a different reason because, in this case, the study did not end yet. A possible explanation for this censoring is that the subject did not attend follow-up visits after the censoring event occurred (indicated by the red X). Formally, one calls the censoring for subject ID fixed, right-censoring and the censoring for subject ID random, right-censoring.
There are further censoring cases one can distinguish. For instance, one speaks of left-censoring if the event is observed but not the beginning of the process. An example for this is given by an infection because usually the infection is diagnosed at some time, but the infection itself happened before that at an unknown starting point. In the following, we will limit our focus to right-censored subjects. A summary for the different types of censoring is given by [36]:
- Type I censoring: All subjects begin and end the study at the same time (fixed length of study). Examples are laboratory experiments.
- Type II censoring: All subjects begin the study at the same time but the study ends when a predetermined fixed number of subjects have experienced the event (flexible length of study). Examples are laboratory experiments.
- Type III censoring: The subjects enter the study at different times, but the length of the study is fixed. Examples are clinical trials.
4. General Characteristics of a Survival Function
A survival curve shows the survival as a function of time (t). Here, is called the survival function also known as the survivor function or just survival curve. Formally, is the probability that the random variable T is larger than a specified time t, i.e.,
Since is defined for a group of subjects, can be interpreted as the proportion of subjects having survived until t. From this follows a naive estimator for given by
whereas N is the total number of subjects. Equation (1) is the population estimate of a survival function. Below, we will discuss various sample estimates for this which can be numerically evaluated from data. Put simply, the survival function gives the probability that a subject (represented by T) will survive past time t.
The survival function has the following properties:
- The definition range of time is .
- is non-increasing, i.e.,
- At time , , i.e., the probability of surviving past time 0 is 1.
Due to the fact that is a probability, there exists a probability density f with the property
this means, by differentiation of we obtain
Furthermore, the expectation value of T is given by
This is the mean life expectation of patients as represented by f.
Using Equation (4) and integrating by parts, one can show that the survival function can be used to obtain the mean life expectation,
5. Non-Parametric Estimator for Survival Function
5.1. Kaplan–Meier Estimator for the Survival Function
The Kaplan–Meier (KM) estimator [10] of a survival function is given by
This estimator holds for all and it depends only on two variables, and which are:
- : number in risk at time ,
- : number of events at time .
Here, corresponds to the number of subjects present at time . In contract, subjects that experienced the event or censoring are no longer present. The difficult part of this estimator is the argument of the product, which considers only events i that occur before time t, i.e., . Hence, the survival curve for time t considers all events that happened before t.
It is important to realize that, for evaluating the Kaplan–Meier estimator only, the events occurring at are important. That means, between two events, e.g., and , the survival curve is constant. This allows a simple reformulation of Equation (7) to write the Kaplan–Meier estimator by a recursive formulation given by
5.2. Nelson–Aalen Estimator: The Survival Function
In contrast to the Kaplan–Meier estimator, which is a direct estimator for , the Nelson–Aalen estimator [37,38] is an indirect estimator for . Instead, the Nelson–Aalen estimator makes a direct estimate for the cumulative hazard function given by
From this, we obtain an estimate for via
using the relation in Equation (28). In general, one can show that
holds.
6. Comparison of Two Survival Curves
When one has more than one survival curve, one is frequently interested in comparing these. In the following, we assume we have two survival curves that correspond to two different groups of subjects, e.g., one group received a medication, whereas the other received a placebo.
Statistically, a comparison can be accomplished by a hypothesis test and the null and alternative hypothesis can be formulated as follows:
Hypothesis 1.
There is no difference in survival between (group 1) and (group 2).
Hypothesis 2.
There is a difference in survival between (group 1) and (group 2).
The most popular tests for comparing survival curves are:
- Log-rank test,
- Wilcoxon (Gehan) test (a special case of a weighted Log-rank test).
The difference between both tests is that a Log-rank test has more power than a Wilcoxon test for detecting late differences in the survival curves, whereas a Wilcoxon test has more power than a Log-rank test for detecting early differences.
Log-Rank Test
The log-rank test, sometimes called the Mantel–Haenszel log-rank test, is a nonparametric hypothesis test [39]. It makes the following assumptions.
- Censored and uncensored subjects have the same probability of the event (censoring is noninformative).
- Kaplan–Meier curves of the two groups must not intersect (proportional hazards assumption must hold).
- No particular distribution for the survival curve is assumed (distribution free).
Formally, the test is defined as follows. For each time t, estimate the expected number of events for (group 1) and (group 2):
Here, the numbers ’1’ and ’2’ indicate groups one and two. The first term in the above equations has the interpretation of a probability to select a subject of the corresponding group, i.e.,
By using the auxiliary terms,
one can define the test statistic s by
Here, s follows a chi-square distribution with one degree of freedom.
7. Hazard Function
Next, we define the hazard function and its connection to a survival function. The definition of the hazard function is given by
The hazard function , also called hazard rate, has the meaning of an ’instant probability’ because only individuals are considered with and for . Put simply, if you survive to time t, you will succumb to the event in the next instant because .
The hazard function has the following properties:
- for all t,
- has no upper bound,
- can assume any shape.
The meaning of is that no event happened in .
The cumulative hazard function describes the accumulated risk up to time t given by
This can also be seen as the total amount of risk that has been accumulated up to time t. The integration/summarization over makes the interpretation simpler, but one also loses details.
There is an important relation between , and given by
This means the hazard, density and survival are not independent from each other. In the following, we derive this relation.
We start from the definition of the hazard.
The first step followed from the property of a conditional probability and the second from the definition of a survival function (in red). The last step shows the desired relation.
In addition to the above relation, there is another important connection between (or ) and given by
From this follows, the inverse relation from to ,
which is easier to derive. Starting from
we can rewrite this as
Differentiation with respect to t gives
The difference between a hazard function and a survival function can be summarized as follows:
- The hazard function focuses on failing,
- The survival function focuses on surviving.
By making assumptions about , one can obtain a parametric model. Due to the relation in Equation (28) between and , this also makes the survival distribution a parametric model. Specific models that find frequent applications are:
- Weibull model,
- Exponential model,
- Log-logistic model,
- Log-normal model,
- Gamma model.
In comparison with a non-parametric model, making a parametric assumption allows for modeling a survival function in more detail and elegance. However, a danger is to make assumptions that are not justified by the data.
In the following, we discuss four parametric models in detail.
7.1. Weibull Model
For the Weibull model, the hazard function, survival function and density are given by
Here, is a rate parameter and a shape parameter allowing for controlling the behavior of the hazard function. Specifically, one can observe the following:
- is monotonously decreasing when
- is constant when
- is monotonously increasing when
The expected life time and its variance are given by
Here, is the Gamma function defined by
7.2. Exponential Model
For the Exponential model, the hazard function, survival function and density are given by
The Exponential model depends only on the rate parameter .
The expected life time and its variance are given by
7.3. Log-Logistic Model
For the Log-logistic model, the hazard function, survival function and density are given by
In addition, the Log-logistic model depends on two parameters, the rate parameter and the shape parameter . Depending on , one can distinguish between the following different behaviors of the hazard function:
- is monotonously decreasing from ∞ when
- is monotonously decreasing from when
- is first increasing and then decreasing whenIn this case:
- -
- -
- the maximum of is at
The expected life time and its variance are given by
7.4. Log-Normal Model
For the Log-normal model, the hazard function, survival function and density are given by
Since a normal distribution has two parameters also the Log-normal model has two parameters, the mean and the standard deviation . These parameters are obtained from the transformations and . The behavior of the hazard function is similar to the Log-logistic model for .
The expected life time and its variance are given by
7.5. Interpretation of Hazard Functions
In Figure 3, we show examples for the four parametric models discussed above. From this figure, one can see that the hazard function can assume a variety of different behaviors. The specific behavior of decides which parametric model can be used for a particular problem. In the following Table 1, we summarize some examples for characteristic hazard curves and diseases to which these are connected.
8. Cox Proportional Hazard Model
Thus far, we considered only models that did not include any covariates of the subjects. Now, we include such covariates and the resulting model is called the Cox Proportional Hazard Model (CPHM). The CPHM is a semiparametric regression model that defines the hazard function by
Here, is called the baseline hazard. The baseline hazard can assume any functional form. An example for a covariate is gender, smoking habit or medication intake.
Equation (54) may look like a special case because no constant is included. However, the following calculation shows that it is actually included in because
We can generalize the above formulation to p covariates by
For , we obtain
which is the hazard function defined in Equation (21) without an influence of covariates.
The CPHM for n covariates does not make assumption about the baseline hazard . However, the model assumes:
- time independence of the covariates ,
- linearity in the covariates ,
- additivity,
- proportional hazard.
The Cox proportional hazards regression model is a semi-parametric model because it does not make assumption about ; however, it assumes a parametric form for the effect of the predictors on the hazard.
In many situations, one is interested in the numerical estimates of the regression coefficients rather than in the shape of because this allows a summary of the overall results.
In order to see this, we take the logarithm of the hazard ratio,
which is linear in and . From this form, the connection to a linear regression model is apparent. In depictive terms, this can be summarized as
Here, the group hazard corresponds to all effects of the covariates , whereas the baseline hazard excludes all such effects. Hence, the sum over all covariates is the log .
Let’s consider just one covariate, i.e., , for gender, which can assume the values (female) and (male). Then, we obtain
By taking the difference, we obtain
Hence, is the log hazard ratio of the hazard for females and males. This gives a direct interpretation for the regression coefficient . Transforming both sides, we obtain
as the hazard ratio.
For the above evaluation, we used the binary covariate gender as an example. However, not all covariates are binary. In case of non-binary covariates, one can use a difference of one unit, i.e., and , to obtain a similar interpretation for the regression coefficients.
A main advantage of the framework of the CPHM is that we can estimate the parameters without having to estimate the baseline hazard function . This implies that we also do not need to make parametric assumptions about making the CPHM semi-parametric.
8.1. Why Is the Model Called the Proportional Hazard Model?
In order to see why the model is called proportional hazard model, we consider two individuals m and n for the same model. Specifically, for individual m and n, we have hazards given by:
Here, the covariates in blue are from individual m and the covariates in green are from individual n. By forming the ratio of both hazards, we obtain the hazard ratio
which is independent of baseline hazard because it cancels out. Here, it is important to note that the right-hand-side is constant over time due to the time independence of the coefficients and covariates. We call
the hazard ratio (HR). A simple reformulating of Equation (67) leads to
From this equation, one can nicely see that the hazard for individual m is proportional to the hazard for individual n and the proportion is the time independent HR.
8.2. Interpretation of General Hazard Ratios
The validity of the PH assumption allows a simple summarization for comparing time dependent hazards. Specifically, instead of forming a hazard ratio between the hazards for two individuals, as in Equations (65) and (66), one can form a hazard ratio for arbitrary hazards for conditions we want to compare. Let’s call these conditions ’treatment’ and ’control’ because these have an intuitive meaning in a medical context, and let’s denote their corresponding hazards by
Regardless of the potential complexity of the individual hazards, assuming the PH holds, their hazard ratio is constant over time,
Hence, the effect of treatment and control over time is given by one real valued number. Here, it is important to emphasize that the ratio of the two hazards is for any time point t given by HR (T vs. C) and, hence, it is not the integrated ratio over time. Specifically, it gives the instantaneous relative risk (in contrast RR (relative risk) quantifies the cumulative risk integrated over time).
In contrast to the comparison of survival curves for treatment and control, e.g., by a log-rank test, which gives us only a binary distinction, an HR tells us something about the magnitude and the direction of this difference. Put simply, the HR has the following interpretation:
- HR(T vs. C) : The treatment group experiences a higher hazard over the control group ⇒ control group is favoured,
- HR(T vs. C) : No difference between the treatment and the control group,
- HR(T vs. C) : The control group experiences a higher hazard over the treatment group ⇒ treatment group is favoured.
For instance, for HR(T vs. C) , the hazard of the treatment group is increased by compared to the control group and for HR (T vs. C) the hazard of the treatment group is by decreased compared to the control group [40].
8.3. Adjusted Survival Curves
We can use a Cox Proportional Hazard Model to modify estimates for a survival curve. Using Equation (28), it follows
In general, one can show that
holds because the survival probability is always smaller than 1 and the exponent is always positive.
8.4. Testing the Proportional Hazard Assumption
In the above discussion, we assumed that the proportional hazard (PH) assumption holds. In the following, we discuss three ways (two graphical and one analytical) one can use to evaluate it.
8.4.1. Graphical Evaluation
The two graphical methods we discuss to assess the PH assumption perform a comparison for each variable one at a time [13]. This means that each covariate is assessed for itself. The underlying idea of both methods is:
- comparison of estimated survival curves,
- comparison of observed with predicted survival curves.
Graphical method I.: In order to understand the first methods, one needs to take the of Equation (76). This leads to
Utilizing this expression evaluating two individuals characterized by the specific covariates
gives
From this equation, one can see that the difference between survival curves for two individuals having different covariate values is a constant given by the right-hand-side.
For assessing the PH assumption, one performs such a comparison for each covariate at a time. In case of categorical covariates, all values will be assessed. For continuous covariates, one categorizes them for the comparison. The reason for using Equation (81) for each covariate at a time and not for all at once is that performing such a comparison covariate-by-covariate is more stringent.
From Equation (81), it follows that survival curves cannot cross each other if hazards are proportional. Observation of such crosses leads to a clear violation of the PH assumption.
Graphical method II.: The underlying idea of this approach to compare observed with expected survival curves to assess the PH assumption is the graphical analog of the goodness-of-fit (GOF) testing.
Here, observed survival curves are obtained from stratified estimates of KM curves. The strata are obtained by the categories of the covariates and the expected survival curves are obtained from performing a CPHM with adjusted survival curves, as given by Equation (76).
The comparison is performed as for the survival curves, i.e., for each covariate one-at a time. For this, the observed and expected survival curves for each strata are plotted in the same figure for assessment. If for each category of the covariates the observed and expected survival curves are close to each other, the PH assumption holds.
Kleinbaum [13] suggested assuming that the PH assumption holds unless there is very strong evidence against this:
- survival curves cross and don’t look parallel over time,
- log cumulative hazard curves cross and don’t look parallel over time,
- weighted Schoenfeld residuals clearly increase or decrease overtime; see Section 8.4.2 (tested by a significant regression slope).
If the PH assumption doesn’t exactly hold for a particular covariate, we are getting an average HR, averaged over the event times. In many cases, this is not necessarily a bad estimate.
8.4.2. Goodness-of-Fit Test
For testing the validity of the PH assumption, several statistical tests have been suggested. However, the most popular one is from [41], which is a variation of a test originally proposed by [42] based on so-called Schoenfeld residuals.
The following steps are performed for each covariate one at a time:
- Estimate a CPHM and obtain Schoenfeld residuals for each predictor.
- Create a reference vector containing the ranks of events. Specifically, the subject with the first (earliest) event receives a value of 1, the next subject receives a value of 2, and so on.
- Perform a correlation test between the variables obtained in the first and second steps. The null hypothesis tested is that the correlation coefficient between the Schoenfeld residuals and the ranked event times is zero.
Here, is the individual value for subject i and the weighted average of the covariate values for the subjects at risk at , indicted by , and given by
The weight function for all subjects at risk, given by , is
The Schoenfeld residual in Equation (82) is evaluated for a from a fitted CPHM.
Overall, for each covariate k, this gives a vector
which is used to compare with the vector of rank values by a correlation test.
8.5. Parameter Estimation of the CPHM via Maximum Likelihood
Thus far, we formulated the CPHM and utilized it in a number of different settings. Now, we are dealing with the problem of estimating the regression coefficients of the model.
Conceptually, the values of the regression coefficients are obtained via maximum likelihood (ML) estimates, i.e., by finding the parameters of our CPHM that maximize . Importantly, the CPHM does not specify the base hazard. This implies that, without explicitly specifying it, the full likelihood of the model can not be defined. For this reason, Cox proposed a partial likelihood.
The full likelihood for right-censored data assuming no ties would be composed of two contributions. One for individuals observed to fail at time , contributing density , and another for individuals censored at time , contributing survival function . The product of both defines the full likelihood,
Here, indicates censoring. By utilizing Equation (23), one can rewrite L for the hazard function,
8.5.1. Without Ties
Assuming there are no ties in the data, i.e., event times are unique, formally, the Cox partial likelihood function [11,43] is given by
whereas is again the set containing the subjects at risk at . In addition, here the baseline hazard is not needed because it cancels out.
The solution of Equation (88) is given by the coefficients that maximize the function , i.e.,
In order to obtain the coefficients, one forms the partial derivative of the maximum likelihood for each coefficient,
Usually, this needs to be carried out numerically with computational optimization methods. Practically, the log likelihood can be used to simplify the numerical analysis because this converts the product term of the partial likelihood function into a sum.
8.5.2. With Ties
As mentioned, the above given Cox partial likelihood is only valid for data without ties. However, in practice, ties of events can occur. For this reason, extensions are needed to deal with this problem. Three of the most widely used extensions are exact methods [11,44,45], the Breslow approximation [46] and the Efron approximation [47].
There are two types of exact methods. One type assumes that time is discrete while the other type assumes time is continuous. Due to the discrete nature of the time, the former model is called an exact discrete method [11]. This method assumes that occurring ties are true ties and there exists no underlying ordering, considering a continuous time that would resolve the ties. Formally, it has been shown that this can be described by a conditional logit model that considers all possible combinations that can be formed with tied subjects drawn from all subjects at risk at . In contrast, Kalbfleisch and Prentice suggested an exact method assuming continuous times. In this model, ties arise as a result of imprecise measurement, i.e., due to scheduled doctor visits. Hence, this model assumes that there exists an underlying true ordering for all events and the partial likelihood needs to a consider all possible orderings for resolving ties. This involves considering all possible permutations (combinations) of tied events leading to an average likelihood [44,48].
A major drawback of both exact methods is that they are very computationally demanding due to the combinations that need to be considered when there are many ties. This means that the methods can even become computationally infeasible. For this reason, the following two methods provide approximations of the exact partial likelihood that are computationally much faster.
The Breslow approximation [46] is given by
This approximation utilizes , the set of all subjects experiencing their event at the same time , whereas is the number of these subjects corresponding to and
This means the set provides information about the tied subjects at time . It is interesting to note that, using the simple identify,
leads to an alternative formulation of the Breslow approximation
Overall, the Breslow approximation looks similar to the Cox partial likelihood with minor adjustments. One issue with the Breslow method is that it considers each of the events at a given time as distinct from each other and allows all failed subjects to contribute with the same weight to the risk set.
The Efron approximation [47] is given by
In contrast to the Breslow approximation, the Efron approximation allows each of the members that fail at time to contribute partially (in a weighted way) to the risk set.
Overall, when there are no ties in the data, all approximations give the same results. In addition, for a small number of ties, the differences are usually small. The Breslow approximation works well when there are few ties but is problematic for a large number. In general, the Efron approximation almost always works better and is the preferred method. It is also much faster than the exact methods. For this reason, it is the default in the R function coxph(). Both the Breslow and Efron approximation give coefficients that are biased toward zero.
9. Stratified Cox Model
In Section 8.4, we discussed approaches for testing the PH assumption. In this section, we show that a stratification of the Cox model is a way to deal with covariates for which the PH assumption does not hold.
Let’s assume we have p covariates for which the PH assumption holds but one covariate violates it. Furthermore, we assume that the violating covariate assumes values in S different categories. If this variable is continuous, one needs to define S discrete categories to discretize it.
For this one, can specify a hazard function for each strata s given by
Here, are the covariates for which the PH assumption holds, and are the different strata. We wrote the covariate as a function of strata s to indicate that only subjects are used having values within this strata. Put simply, the categories s are used to stratify the subjects into S groups for which a Cox model is fitted.
For each of these strata-specific hazard function, one can define a partial likelihood function in the same way as for the ordinary CPHM. The overall partial likelihood function for all strata is then given by the product of the individual likelihoods,
We want to emphasize that the parameters are constant across the different strata, i.e., one is fitting S different models, but the covariate dependent part is identical for all of these models; only the time dependent baseline hazard function is different. This feature of the stratified Cox model is called the no-interaction property. This implies that the hazard ratios are the same for each stratum.
9.1. Testing No-Interaction Assumption
A question that arises is if it is justified to assume a no-interaction model for a given data set? This question can be answered with a likelihood ratio (LR) test. In order to obtain do this, we need to specify the interaction model given by
Practically, this can be done by introducing dummy variables. For strata, one needs one dummy variable leading to the interaction model
This gives for
and for
showing that the coefficients differ for the two strata.
For strata, one need to introduce dummy variables with with . This gives
In this way, one obtained from the no-interaction model (NIM) and the interaction model (IM) the likelihoods to specify the test statistic . This LR follows a chi-square distribution with degrees of freedom.
9.2. Many Covariates Violating the PH Assumption
In the case when there is more than one covariate violating the PH assumption, there is no elegant extension. Instead, the approach is usually situation-specific requiring the combination of all these covariates in one combined covariate having S strata. An additional problem is imposed by the presence of continuous covariates because again discrete categories are required. Both issues (large number of covariates violating the PH assumption and continuous covariates) lead to a complicated situation making such an analysis very laborious. This is especially true for the testing of the no-interaction assumption.
10. Practical Survival Analysis Using R
In this section, we show how to perform a survival analysis practically by using R. We provide short scripts that allow for obtaining numerical results for different problems. To demonstrate such an analysis, we use data from lung cancer patients provided by the survival package [49].
10.1. Comparison of Survival Curves
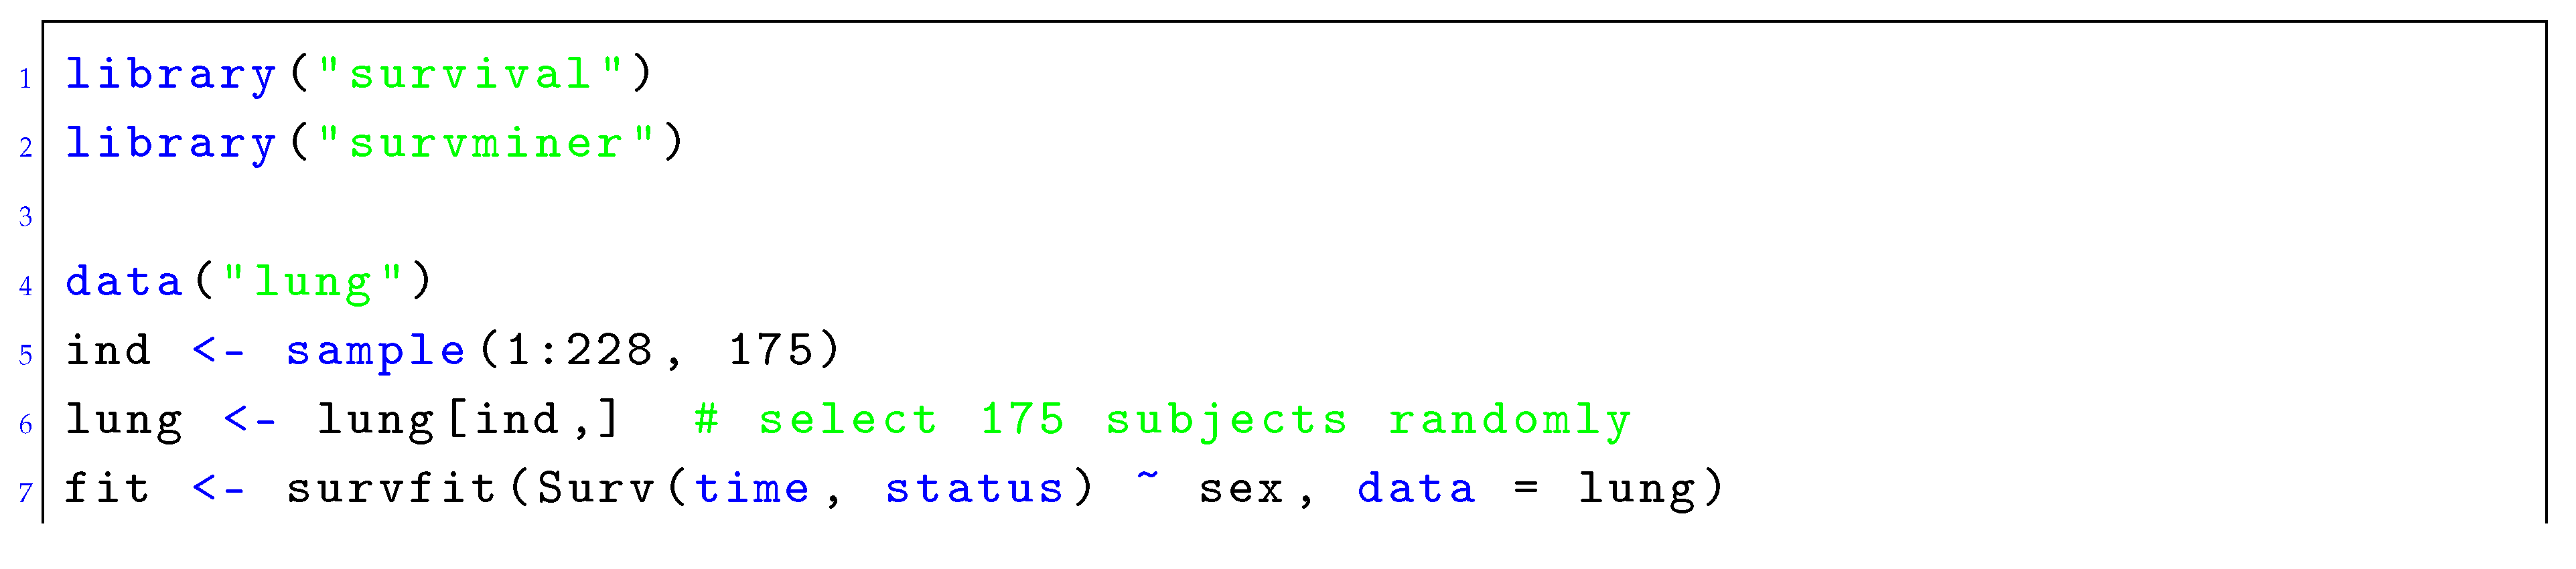
In Listing 1, we show an example for lung cancer using R for comparing the survival curves of female and male by utilizing the packages survival and survminer [49,50]. The result of this is shown in Figure 4. From the total number of available patients (228), we select 175 randomly. For these, we estimate the Kaplan–Meier survival curves and compare these with a log-rank test. The p-value from this comparison is which means, e.g., based on a significance level of , we need to reject the null hypothesis that there is no difference in the survival curves for male and female.
Listing 1.
An example for lung cancer using R for comparing the survival curves of female and male patients by utilizing the packages survival and survminer.
Listing 1.
An example for lung cancer using R for comparing the survival curves of female and male patients by utilizing the packages survival and survminer.
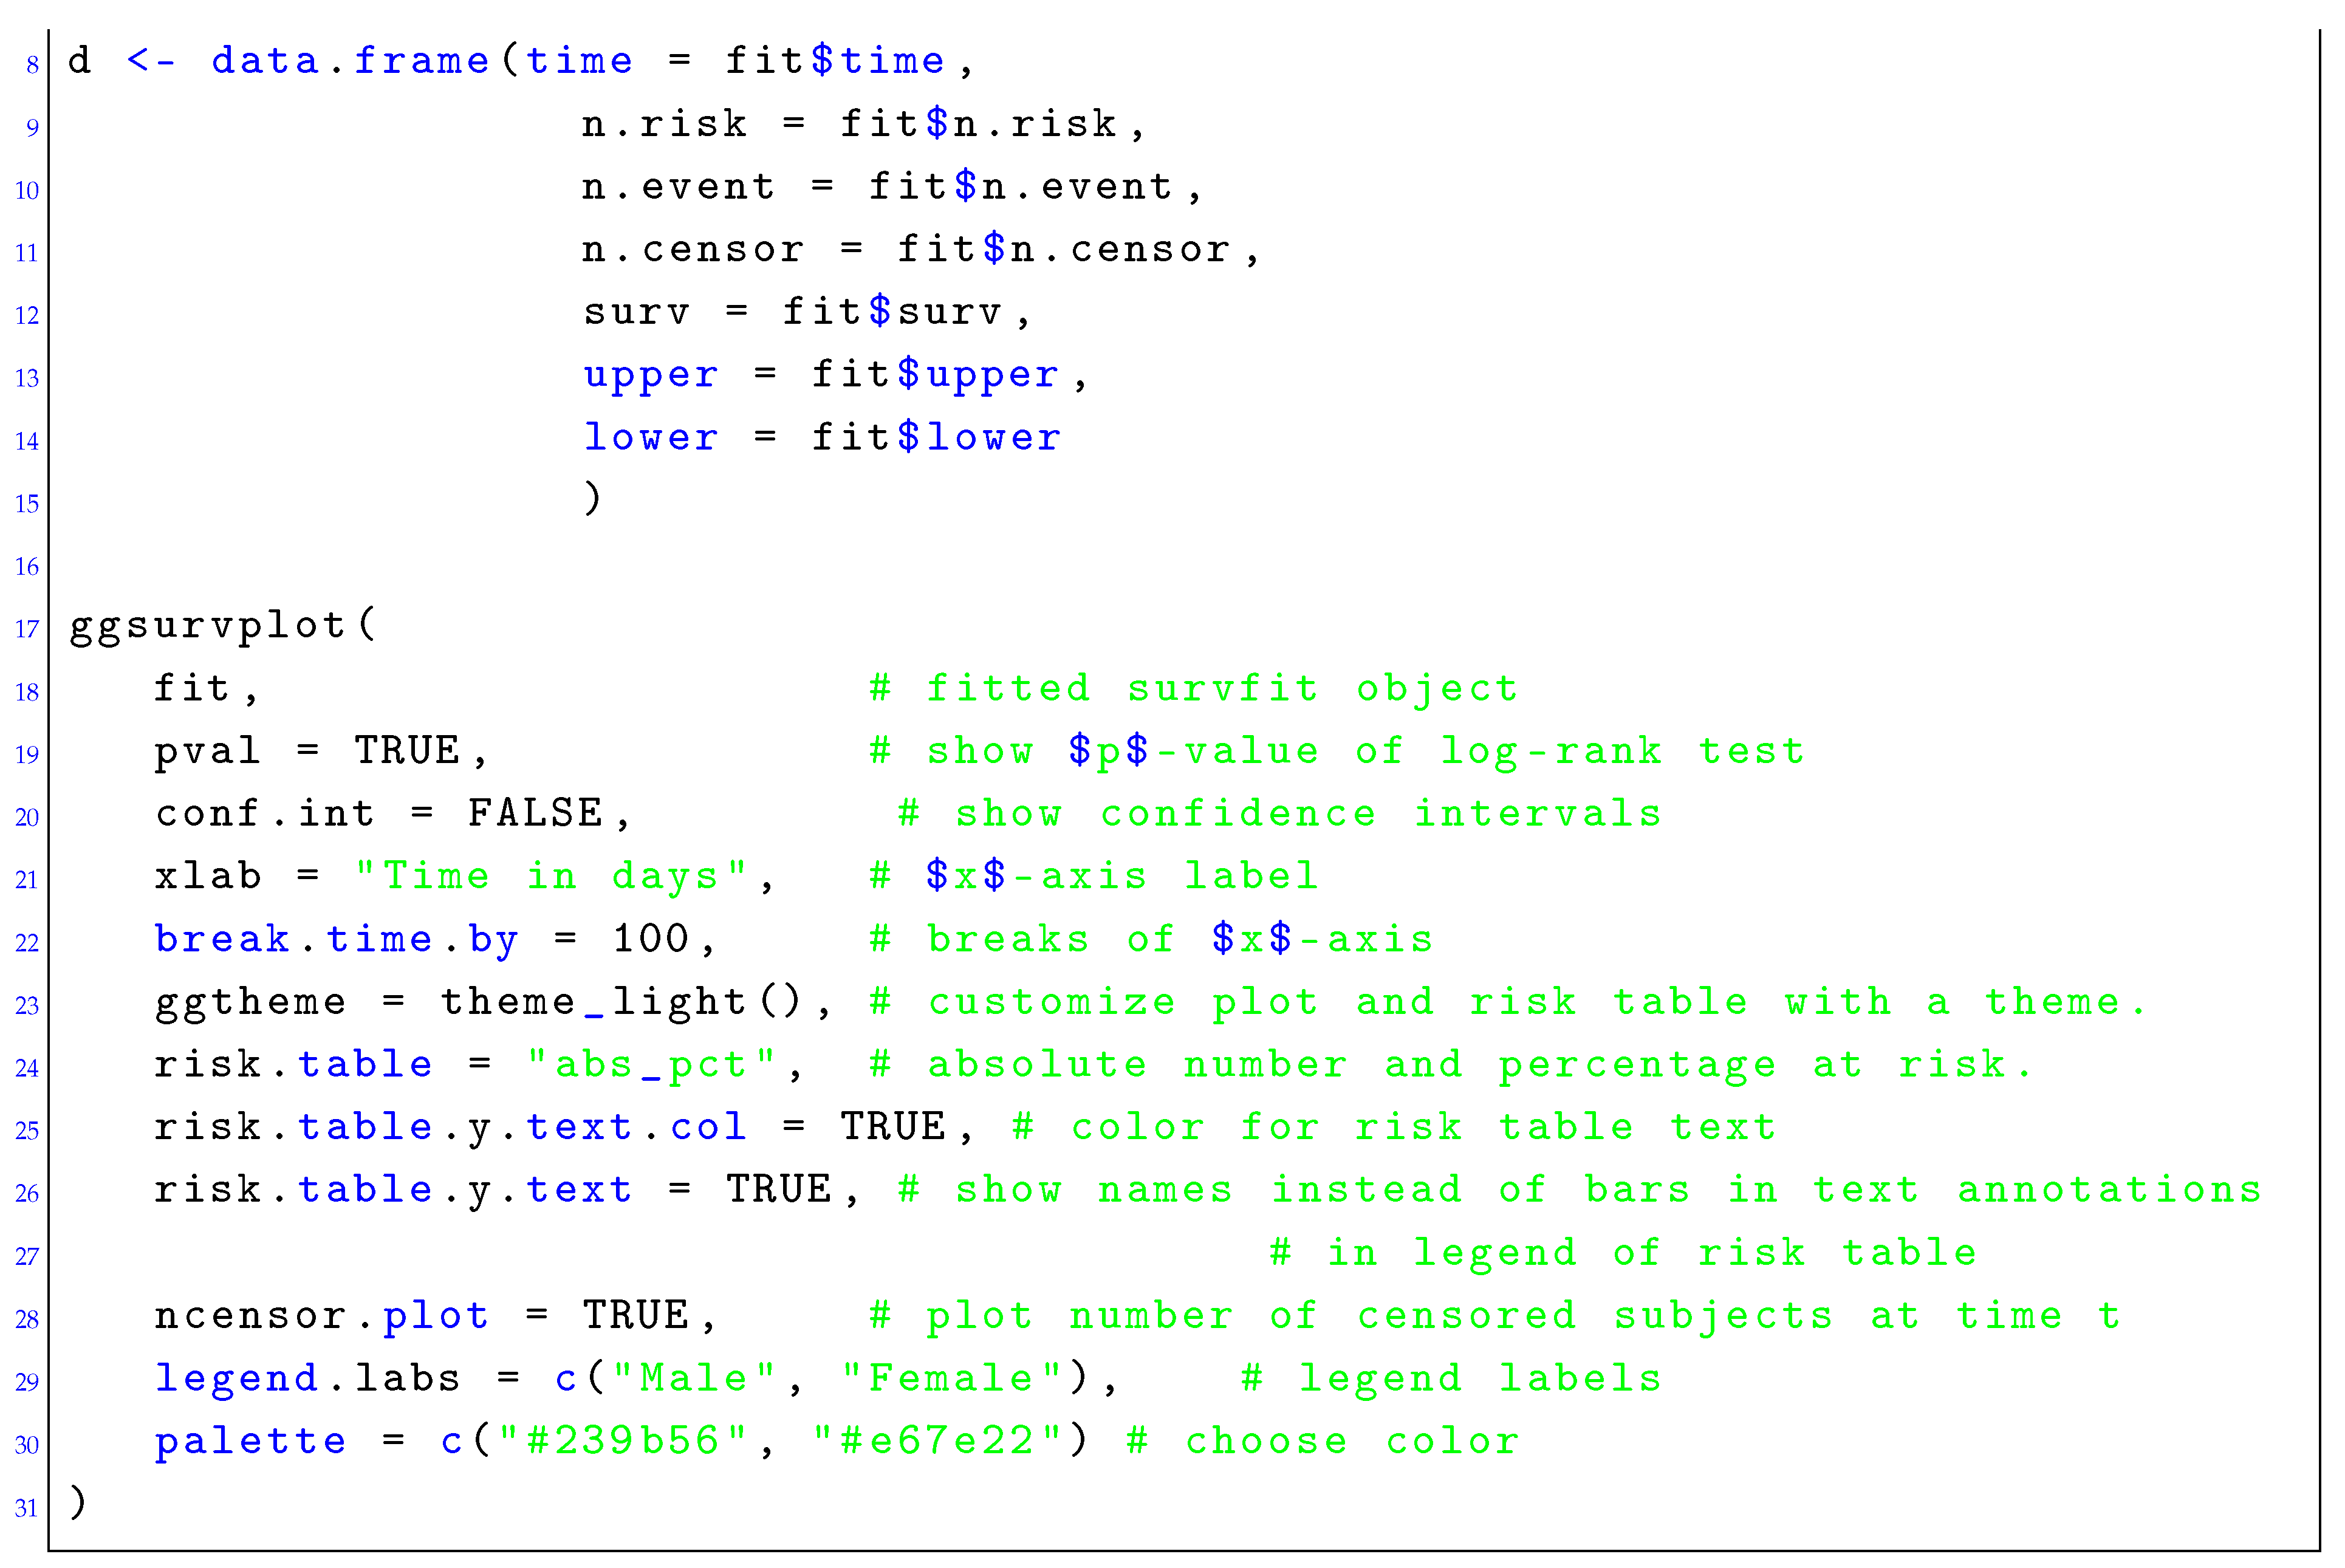
By setting options in the function ggsurvplot, we added to Figure 4 information about the number at risk in interval steps of 100 days (middle figure) and the number of censoring events (bottom figure). This information is optional, but one should always complement survival curves by adding these tables because it gives additional information about the data upon which the estimates are based on.
Usually, it would be also informative to add confidence intervals to the survival curves. This can be accomplished by setting the option conf.int to TRUE (not used to avoid an overloading of the presented information).
10.2. Analyzing a Cox Proportional Hazard Model
Next, we show how to conduct the analysis of a CPHM. We use again the lung cancer data and, as a covariate, we use sex. Listing 2 shows how to perform this analysis and includes also the output. In this model, the p-value of the regression coefficient is indicating a statistical significance of this coefficient. Hence, the covariate sex has a significant contribution on the hazard.
Listing 2.
An example for a CPHM with one covariate for the lung cancer data.
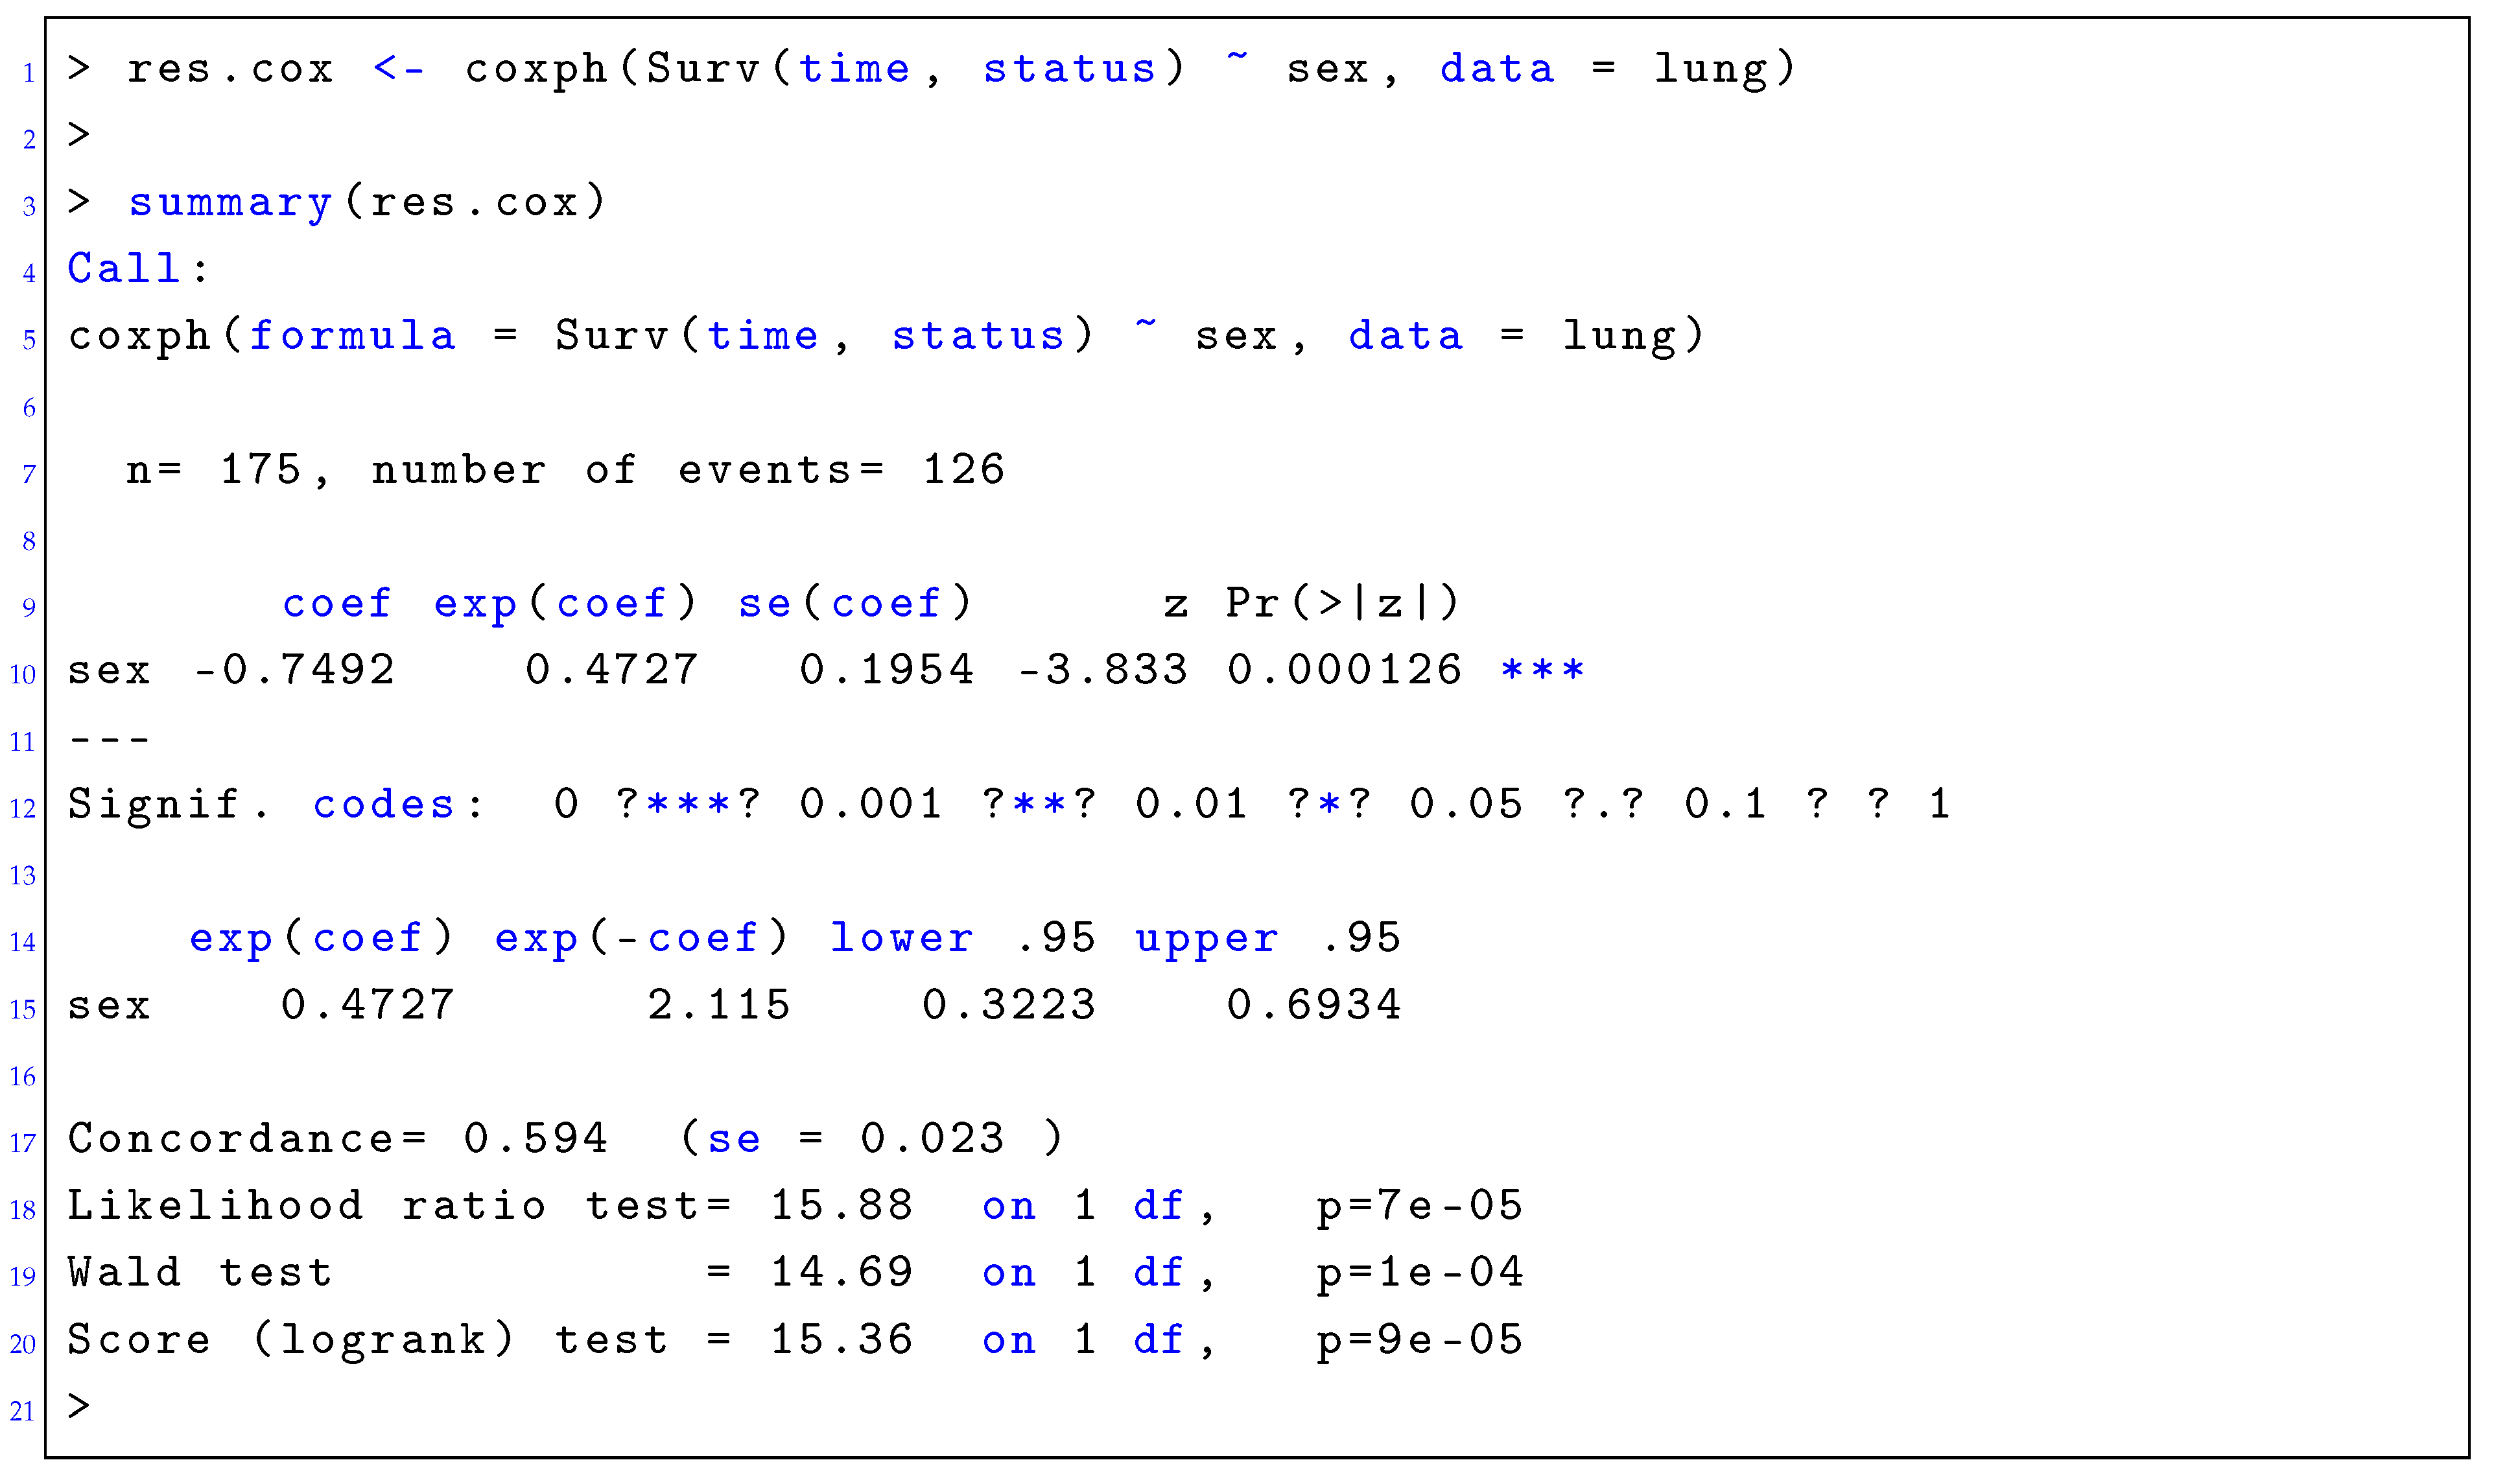
The hazard ratio of female/male is . This means the hazard for group female is by a factor reduced compared to group male, or it is reduced by .
Finally, the global test statistics at the end of the output provide information about the overall significance of the model. As a null hypothesis, they test if all regression coefficients are zero and, symptotically, all of the three tests are equivalent. As one can see, these tests are also significant indicating that the null hypothesis needs to be rejected.
10.3. Testing the PH Assumption
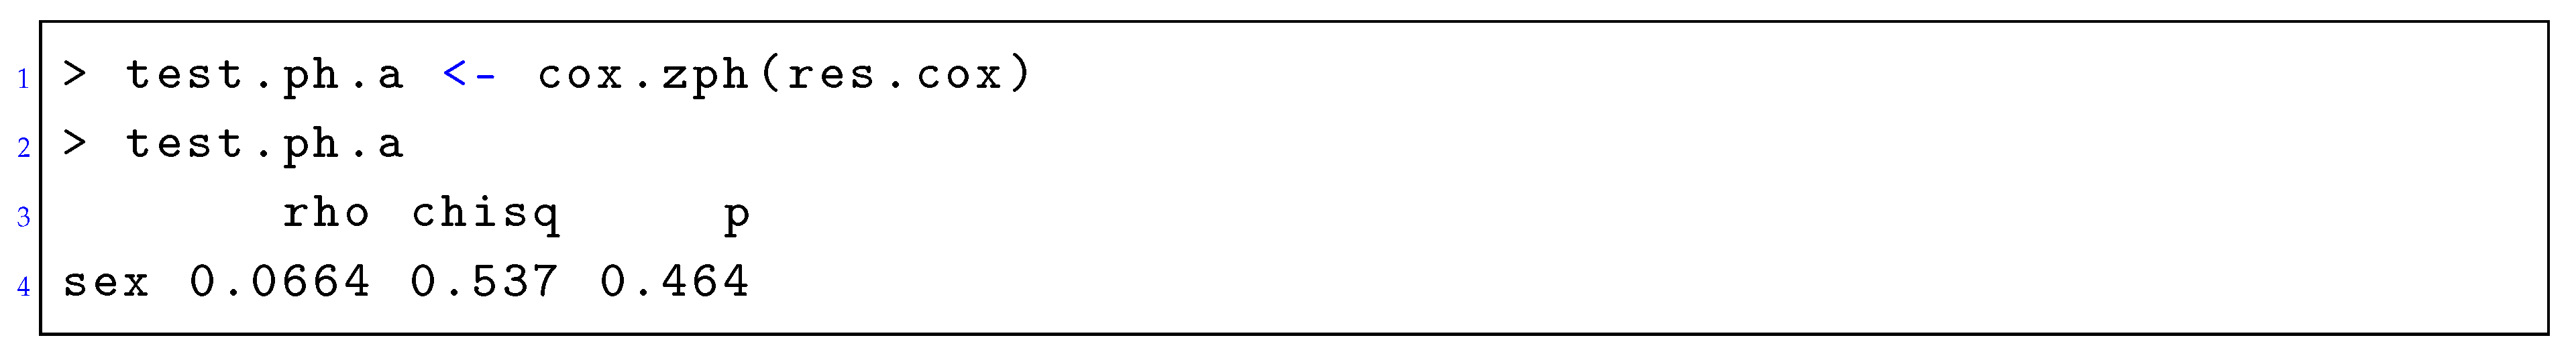
Using the fitted model above, we test now the PH assumption for sex. Listing 3 shows the corresponding script and the output. Here, the null hypothesis is tested if the correlation between the Schoenfeld residuals and the ranked failure time is zero. As one can see, the test is not statistically significant for the covariate sex. Hence, we can assume the proportional hazards assumption holds.
Listing 3.
Testing the PH assumption for a CPHM with one covariate for the lung cancer data.
In Listing 4, we show how to obtain the Schoenfeld residuals, as discussed in Section 8.4.2. This provides a visualization of the resulting residuals.
Listing 4.
Schoenfeld residuals for a CPHM with one covariate for the lung cancer data.

In Figure 5, we show the result of Listing 4. In this figure, the solid line is a smoothing spline fit of the scaled Schoenfeld residuals against the transformed time and the dashed lines indicate standard errors. A systematic deviation from a straight horizontal line would indicate a violation of the PH assumption because, for a valid assumption, the coefficient(s) do not vary over time. Overall, the solid line is sufficiently straight in order to assume the PH holds. Figure 5 also shows the p-value of the result obtained in Listing 3.
10.4. Hazard Ratios
Finally, we show results for the full multivariate CPHM using all available seven covariates as input for the model. Listing 5 gives the corresponding code.
Listing 5.
An example for a CPHM with seven covariates for the lung cancer data.
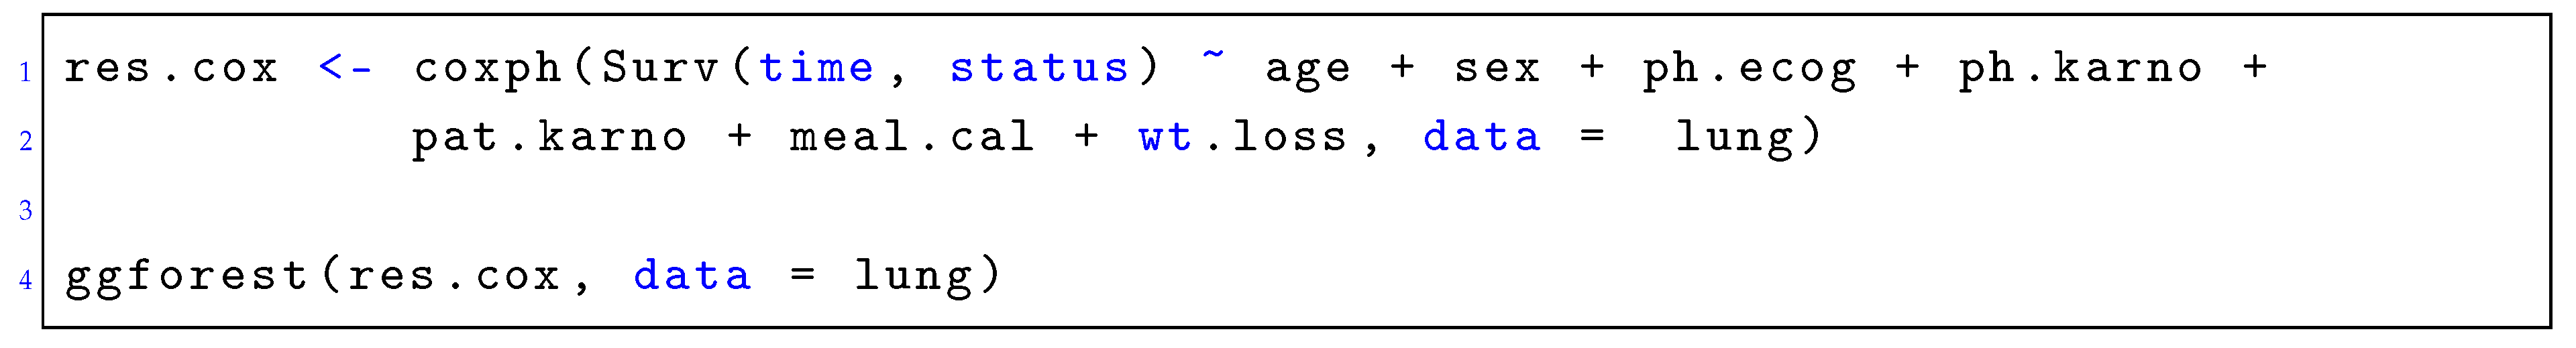
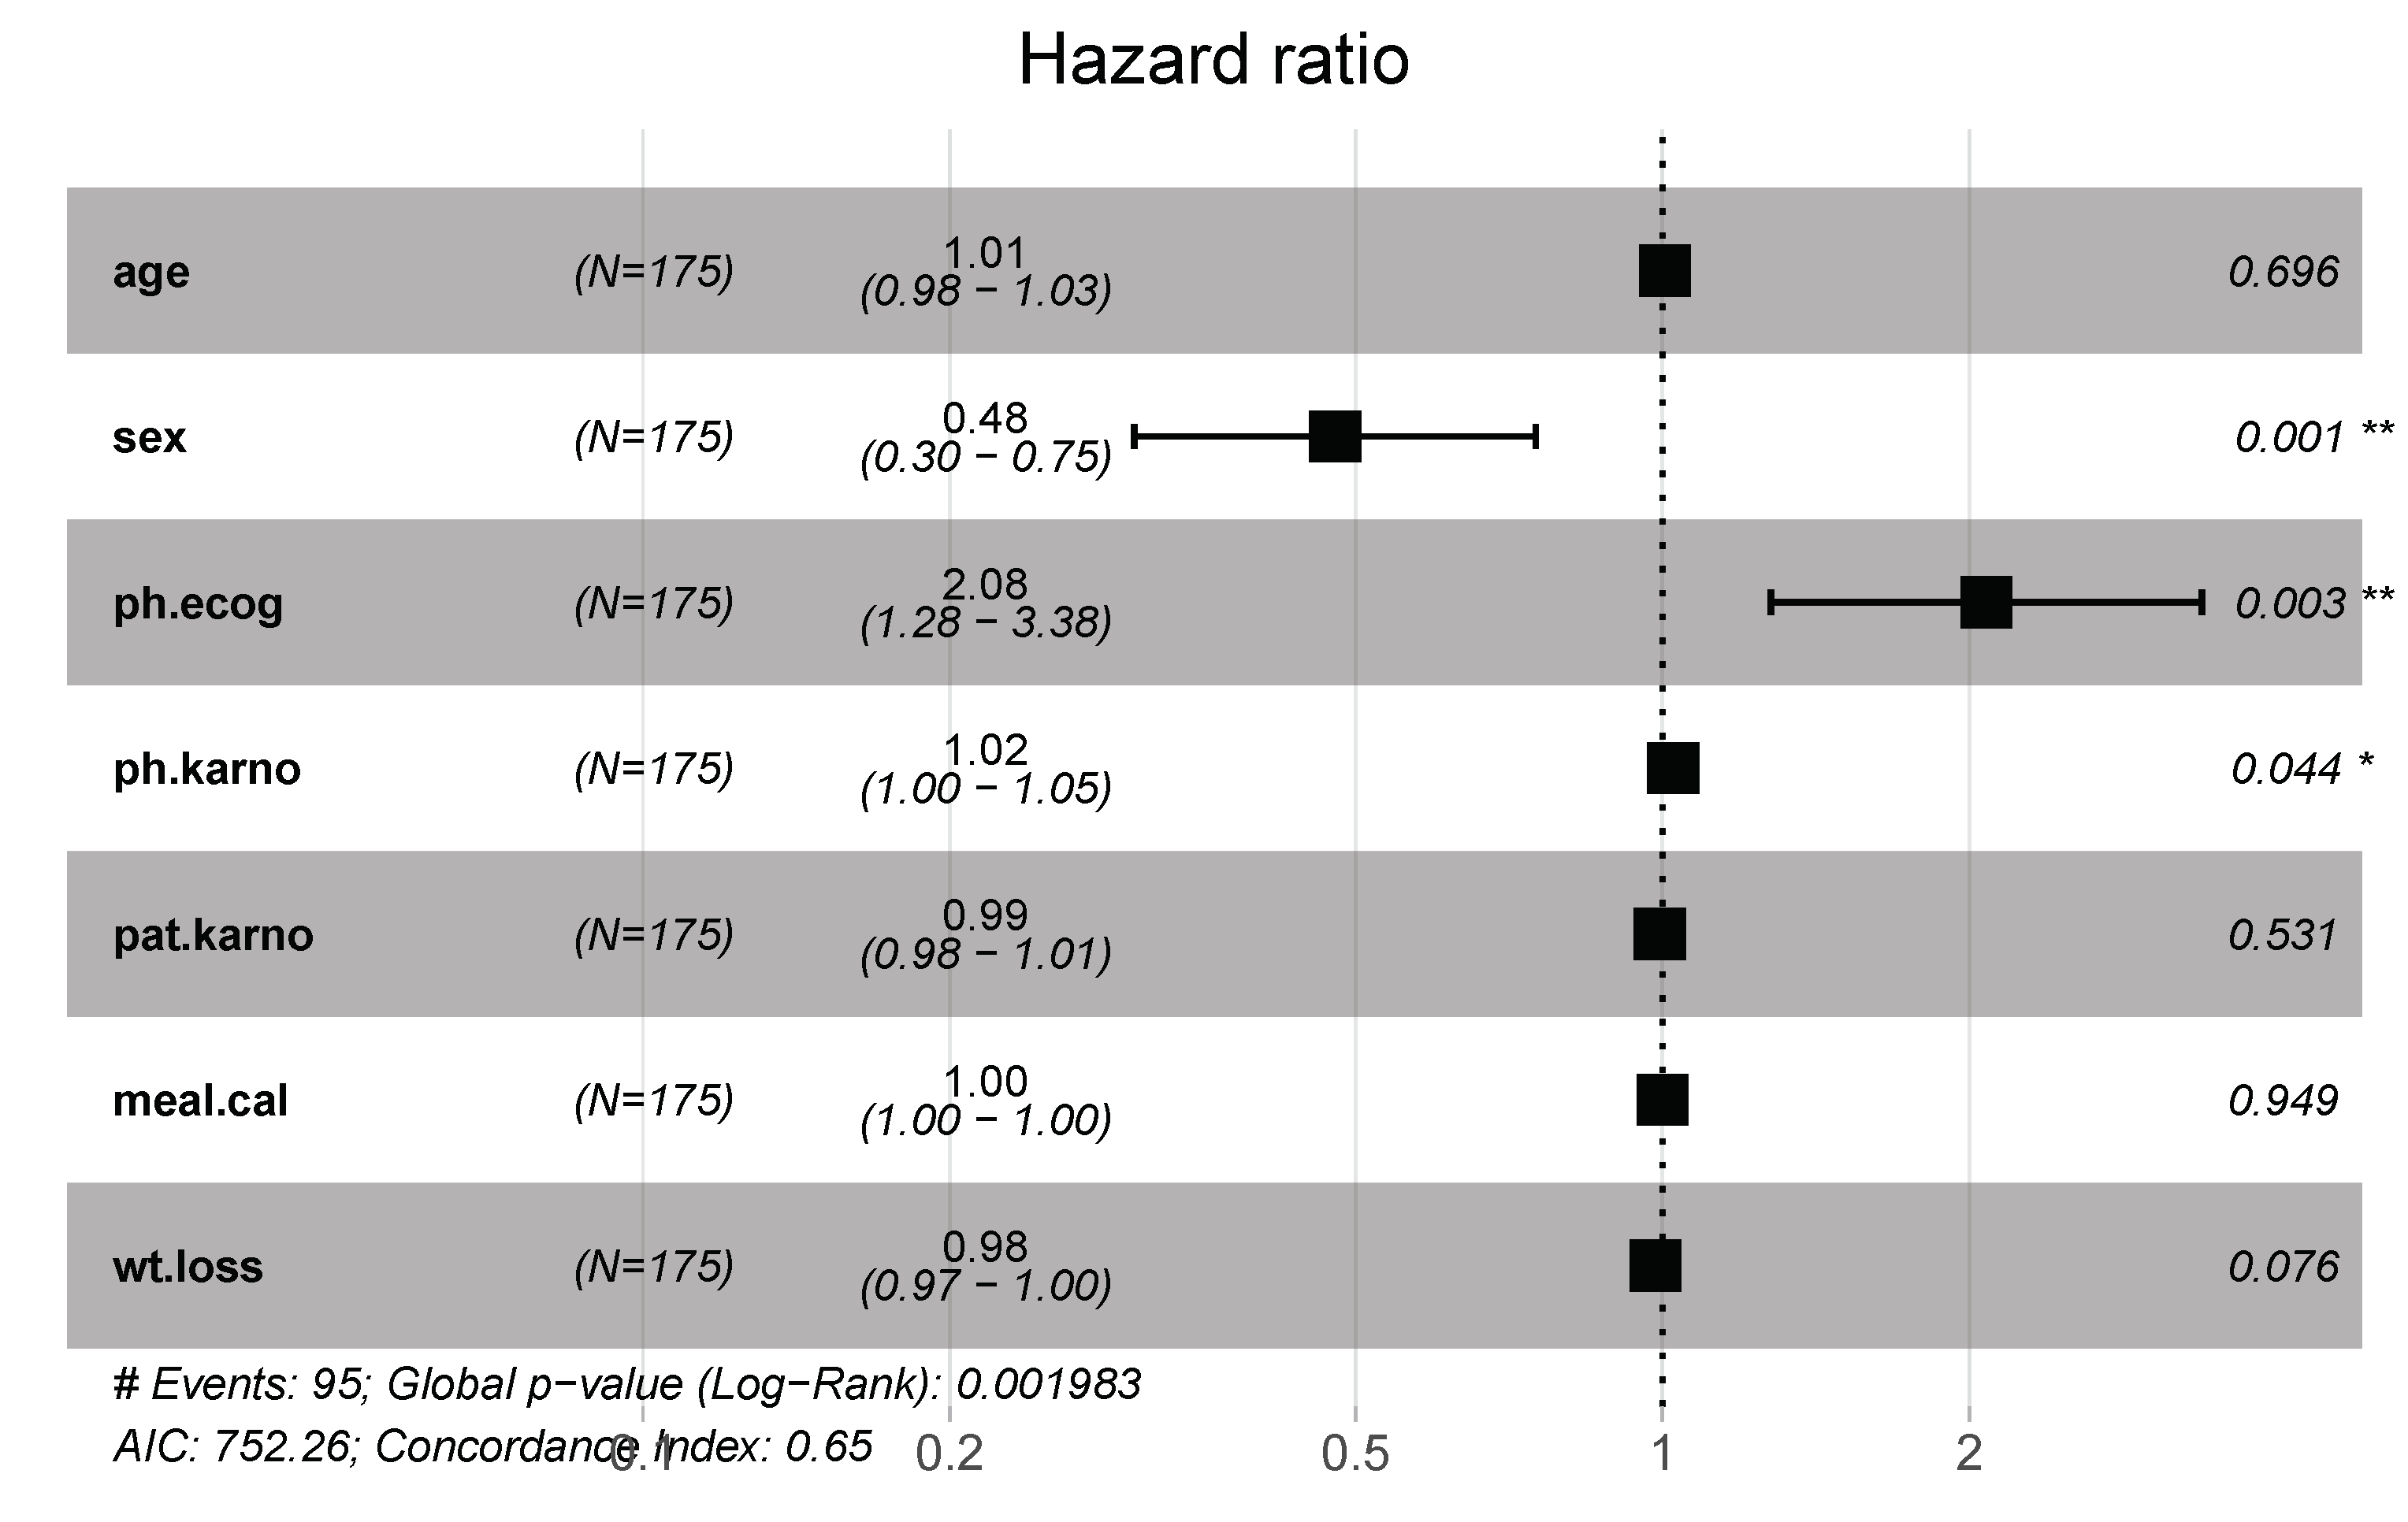
A convenient way to summarize the results is by using a forest plot, shown in Figure 6. This figures shows the hazard ratios for the seven covariates, whereas the mean is shown as a square and the confidence interval of the estimates is shown as a line. The right-hand side shows the p-values of the corresponding regression coefficients, which can also be obtained from summary(res.cox). Overall, the covariate sex reduces the hazard, whereas ph.ecog (quantifies well-being according to ECOG performance score) increases it. All of the other covariates are located around 1, i.e., their effect is marginal.
11. Conclusions
In this paper, we reviewed survival analysis, which is also known as event history analysis. For multivariate data, a survival analysis can become quickly complex and the interpretation of it non-trivial, especially with respect to hazard ratios. For this reason, we aimed at a comprehensive yet eclectic presentation that is wide enough to comprise all topics needed for a multivariate survival analysis but is at the same time comprehendible. Complemented by a worked example using R, we hope that our introduction will be of help for data scientists from many fields.
Author Contributions
F.E.-S. conceived the study. All authors contributed to the writing of the manuscript and approved the final version.
Funding
M.D. thanks the Austrian Science Funds for supporting this work (project P30031).
Conflicts of Interest
The authors declare no conflict of interest. The founding sponsors had no role in the design of the study; in the collection, analyses, or interpretation of data; in the writing of the manuscript, and in the decision to publish the results.
References
- Ancarani, A.; Di Mauro, C.; Fratocchi, L.; Orzes, G.; Sartor, M. Prior to reshoring: A duration analysis of foreign manufacturing ventures. Int. J. Prod. Econ. 2015, 169, 141–155. [Google Scholar] [CrossRef]
- Jung, E.Y.; Baek, C.; Lee, J.D. Product survival analysis for the App Store. Mark. Lett. 2012, 23, 929–941. [Google Scholar] [CrossRef]
- Buckley, N.; Haddock, P.; De Matos Simoes, R.; Parkes, E.; Irwin, G.; Emmert-Streib, F.; McQuaid, S.; Kennedy, R.; Mullan, P. A BRCA1 deficient, NFκB driven immune signal predicts good outcome in Triple Negative breast cancer. Oncotarget 2016, 7, 19884–19896. [Google Scholar] [CrossRef] [PubMed]
- Gross, S.R.; O’Brien, B.; Hu, C.; Kennedy, E.H. Rate of false conviction of criminal defendants who are sentenced to death. Proce. Natl. Acad. Sci. USA 2014, 111, 7230–7235. [Google Scholar] [CrossRef] [PubMed] [Green Version]
- Alvi, M.; McArt, D.; Kelly, P.; Fuchs, M.A.; Alderdice, M.; McCabe, C.; Bingham, V.; McGready, C.; Tripathi, S.; Emmert-Streib, F.; et al. Comprehensive molecular pathology analysis of small bowel adenocarcinoma reveals novel targets with potential clinical utility. Oncotarget 2015, 6, 20863–20874. [Google Scholar] [CrossRef] [PubMed]
- Murray, D.; Carr, A.; Bulstrode, C. Survival analysis of joint replacements. J. Bone Joint Surg. Br. Vol. 1993, 75, 697–704. [Google Scholar] [CrossRef]
- Sørlie, T.; Perou, C.M.; Tibshirani, R.; Aas, T.; Geisler, S.; Johnsen, H.; Hastie, T.; Eisen, M.B.; Van De Rijn, M.; Jeffrey, S.S.; et al. Gene expression patterns of breast carcinomas distinguish tumor subclasses with clinical implications. Proc. Natl. Acad. Sci. USA 2001, 98, 10869–10874. [Google Scholar] [CrossRef] [PubMed] [Green Version]
- Emmert-Streib, F.; Dehmer, M. (Eds.) Medical Biostatistics for Complex Diseases; Wiley-Blackwell: Weinheim, Germany, 2010. [Google Scholar]
- Zhang, W.; Ota, T.; Shridhar, V.; Chien, J.; Wu, B.; Kuang, R. Network-based survival analysis reveals subnetwork signatures for predicting outcomes of ovarian cancer treatment. PLoS Comput. Biol. 2013, 9, e1002975. [Google Scholar] [CrossRef]
- Kaplan, E.L.; Meier, P. Nonparametric estimation from incomplete observations. J. Am. Stat. Assoc. 1958, 53, 457–481. [Google Scholar] [CrossRef]
- Cox, D.R. Regression models and life-tables. J. R. Stat. Soc. Ser. B (Methodol.) 1972, 34, 187–202. [Google Scholar] [CrossRef]
- Emmert-Streib, F.; Dehmer, M. Defining data science by a data-driven quantification of the community. Mach. Learn. Knowl. Extr. 2019, 1, 235–251. [Google Scholar] [CrossRef]
- Kleinbaum, D.; Klein, M. Survival Analysis: A Self-Learning Text; Statistics for biology and health; Springer: New York, NY, USA, 2005. [Google Scholar]
- Li, J.; Ma, S. Survival Analysis in Medicine and Genetics; Chapman and Hall/CRC: Boca Raton, FL, USA, 2013. [Google Scholar]
- Mills, M. Introducing Survival and Event History Analysis; Sage: Thousand Oaks, CA, USA, 2010. [Google Scholar]
- Allison, P.D. Event History Analysis: Regression for Longitudinal Event Data; Number 46; Sage: Thousand Oaks, CA, USA, 1984. [Google Scholar]
- Cleves, M.; Gould, W.; Gould, W.W.; Gutierrez, R.; Marchenko, Y. An Introduction to Survival Analysis Using Stata; Stata Press: College Station, TX, USA, 2008. [Google Scholar]
- George, B.; Seals, S.; Aban, I. Survival analysis and regression models. J. Nucl. Cardiol. 2014, 21, 686–694. [Google Scholar] [CrossRef] [PubMed] [Green Version]
- ElHafeez, S.A.; Torino, C.; D’Arrigo, G.; Bolignano, D.; Provenzano, F.; Mattace-Raso, F.; Zoccali, C.; Tripepi, G. An overview on standard statistical methods for assessing exposure-outcome link in survival analysis (Part II): The Kaplan–Meier analysis and the Cox regression method. Aging Clin. Exp. Res. 2012, 24, 203–206. [Google Scholar] [CrossRef]
- Goel, M.K.; Khanna, P.; Kishore, J. Understanding survival analysis: Kaplan–Meier estimate. Int. J. Ayurveda Res. 2010, 1, 274. [Google Scholar] [PubMed]
- Allison, P.D. Survival Analysis Using SAS: A Practical Guide; Sas Institute: Cary, NC, USA, 2010. [Google Scholar]
- R Development Core Team. R: A Language and Environment for Statistical Computing; R Foundation for Statistical Computing: Vienna, Austria, 2008; ISBN 3-900051-07-0. [Google Scholar]
- Carson, J.L.; Kelley, M.A.; Duff, A.; Weg, J.G.; Fulkerson, W.J.; Palevsky, H.I.; Schwartz, J.S.; Thompson, B.T.; Popovich, J., Jr.; Hobbins, T.E.; et al. The clinical course of pulmonary embolism. N. Engl. J. Med. 1992, 326, 1240–1245. [Google Scholar] [CrossRef] [PubMed]
- Fields, R.C.; Busam, K.J.; Chou, J.F.; Panageas, K.S.; Pulitzer, M.P.; Kraus, D.H.; Brady, M.S.; Coit, D.G. Recurrence and survival in patients undergoing sentinel lymph node biopsy for merkel cell carcinoma: Analysis of 153 patients from a single institution. Ann. Surg. Oncol. 2011, 18, 2529. [Google Scholar] [CrossRef]
- Perri, R.T.; Hebbel, R.P.; Oken, M.M. Influence of treatment and response status on infection risk in multiple myeloma. Am. J. Med. 1981, 71, 935–940. [Google Scholar] [CrossRef]
- Kendal, W. Suicide and cancer: A gender-comparative study. Ann. Oncol. 2006, 18, 381–387. [Google Scholar] [CrossRef]
- Lesem, M.D.; Tran-Johnson, T.K.; Riesenberg, R.A.; Feifel, D.; Allen, M.H.; Fishman, R.; Spyker, D.A.; Kehne, J.H.; Cassella, J.V. Rapid acute treatment of agitation in individuals with schizophrenia: Multicentre, randomised, placebo-controlled study of inhaled loxapine. Br. J. Psychiatry 2011, 198, 51–58. [Google Scholar] [CrossRef]
- Benda, B.B. Gender differences in life-course theory of recidivism: A survival analysis. Int. J. Offender Ther. Comparat. Criminol. 2005, 49, 325–342. [Google Scholar] [CrossRef]
- Byrne, J.; Fears, T.R.; Steinhorn, S.C.; Mulvihill, J.J.; Connelly, R.R.; Austin, D.F.; Holmes, G.F.; Holmes, F.F.; Latourette, H.B.; Teta, M.J.; et al. Marriage and divorce after childhood and adolescent cancer. JAMA 1989, 262, 2693–2699. [Google Scholar] [CrossRef] [PubMed]
- Min, Y.; Zhang, G.; Long, R.A.; Anderson, T.J.; Ohland, M.W. Nonparametric survival analysis of the loss rate of undergraduate engineering students. J. Eng. Educ. 2011, 100, 349–373. [Google Scholar] [CrossRef]
- Daepp, M.I.; Hamilton, M.J.; West, G.B.; Bettencourt, L.M. The mortality of companies. J. R. Soc. Interface 2015, 12, 20150120. [Google Scholar] [CrossRef] [PubMed] [Green Version]
- Richardeau, F.; Pham, T.T.L. Reliability calculation of multilevel converters: Theory and applications. IEEE Trans. Ind. Electron. 2012, 60, 4225–4233. [Google Scholar] [CrossRef]
- Kim, J.; Suk Kim, M. Analysis of automobile repeat-purchase behaviour on CRM. Ind. Manag. Data Syst. 2014, 114, 994–1006. [Google Scholar] [CrossRef]
- Liedtke, C.; Mazouni, C.; Hess, K.R.; André, F.; Tordai, A.; Mejia, J.A.; Symmans, W.F.; Gonzalez-Angulo, A.M.; Hennessy, B.; Green, M.; et al. Response to neoadjuvant therapy and long-term survival in patients with triple-negative breast cancer. J. Clin. Oncol. 2008, 26, 1275–1281. [Google Scholar] [CrossRef] [PubMed]
- Leung, K.M.; Elashoff, R.M.; Afifi, A.A. Censoring issues in survival analysis. Ann. Rev. Public Health 1997, 18, 83–104. [Google Scholar] [CrossRef]
- Lee, E.T.; Wang, J. Statistical Methods for Survival Data Analysis; John Wiley & Sons: Hoboken, NJ, USA, 2003; Volume 476. [Google Scholar]
- Aalen, O. Nonparametric inference for a family of counting processes. Ann. Stat. 1978, 6, 701–726. [Google Scholar] [CrossRef]
- Nelson, W. Theory and applications of hazard plotting for censored failure data. Technometrics 1972, 14, 945–966. [Google Scholar] [CrossRef]
- Mantel, N. Evaluation of survival data and two new rank order statistics arising in its consideration. Cancer Chemother. Rep. 1966, 50, 163–170. [Google Scholar]
- Barraclough, H.; Simms, L.; Govindan, R. Biostatistics primer: what a clinician ought to know: Hazard ratios. J. Thorac. Oncol. 2011, 6, 978–982. [Google Scholar] [CrossRef] [PubMed]
- Harrell, F.; Lee, K. Verifying assumptions of the Cox proportional hazards model. In Proceedings of the Eleventh Annual SAS Users Group International Conference; SAS Institute Inc.: Cary, NC, USA, 1986; pp. 823–828. [Google Scholar]
- Schoenfeld, D. Partial residuals for the proportional hazards regression model. Biometrika 1982, 69, 239–241. [Google Scholar] [CrossRef]
- Cox, D.R. Partial likelihood. Biometrika 1975, 62, 269–276. [Google Scholar] [CrossRef]
- Kalbfleisch, J.D.; Prentice, R.L. The Statistical Analysis of Failure Time Data; John Wiley & Sons: Hoboken, NJ, USA, 2011; Volume 360. [Google Scholar]
- DeLong, D.M.; Guirguis, G.H.; Thus, Y.C. Efficient computation of subset selection probabilities with application to Cox regression. Biometrika 1994, 81, 607–611. [Google Scholar] [CrossRef]
- Breslow, N. Covariance analysis of censored survival data. Biometrics 1974, 30, 89–99. [Google Scholar] [CrossRef] [PubMed]
- Efron, B. The efficiency of Cox’s likelihood function for censored data. J. Am. Stat. Assoc. 1977, 72, 557–565. [Google Scholar] [CrossRef]
- Therneau, T.M.; Grambsch, P.M. Modeling Survival Data: Extending the Cox Model; Springer Science & Business Media: New York, NY, USA, 2013. [Google Scholar]
- Therneau, T.M. A package for survival analysis in S. R Package Version 1977, 2, 280. Available online: https://www.semanticscholar.org/paper/A-Package-for-Survival-Analysis-in-S-Therneau/aba73f6957bce1648f066935f7ea85a99119be5d (accessed on 1 July 2019).
- Kassambara, A.; Kosinski, M.; Biecek, P. Survminer: Drawing Survival Curves using ’ggplot2’. R Package Version 0.3 2017, 1. Available online: https://rpkgs.datanovia.com/survminer/reference/ggsurvplot.html (accessed on 1 July 2019).
Figure 1.
A visualization for the meaning of right censoring.
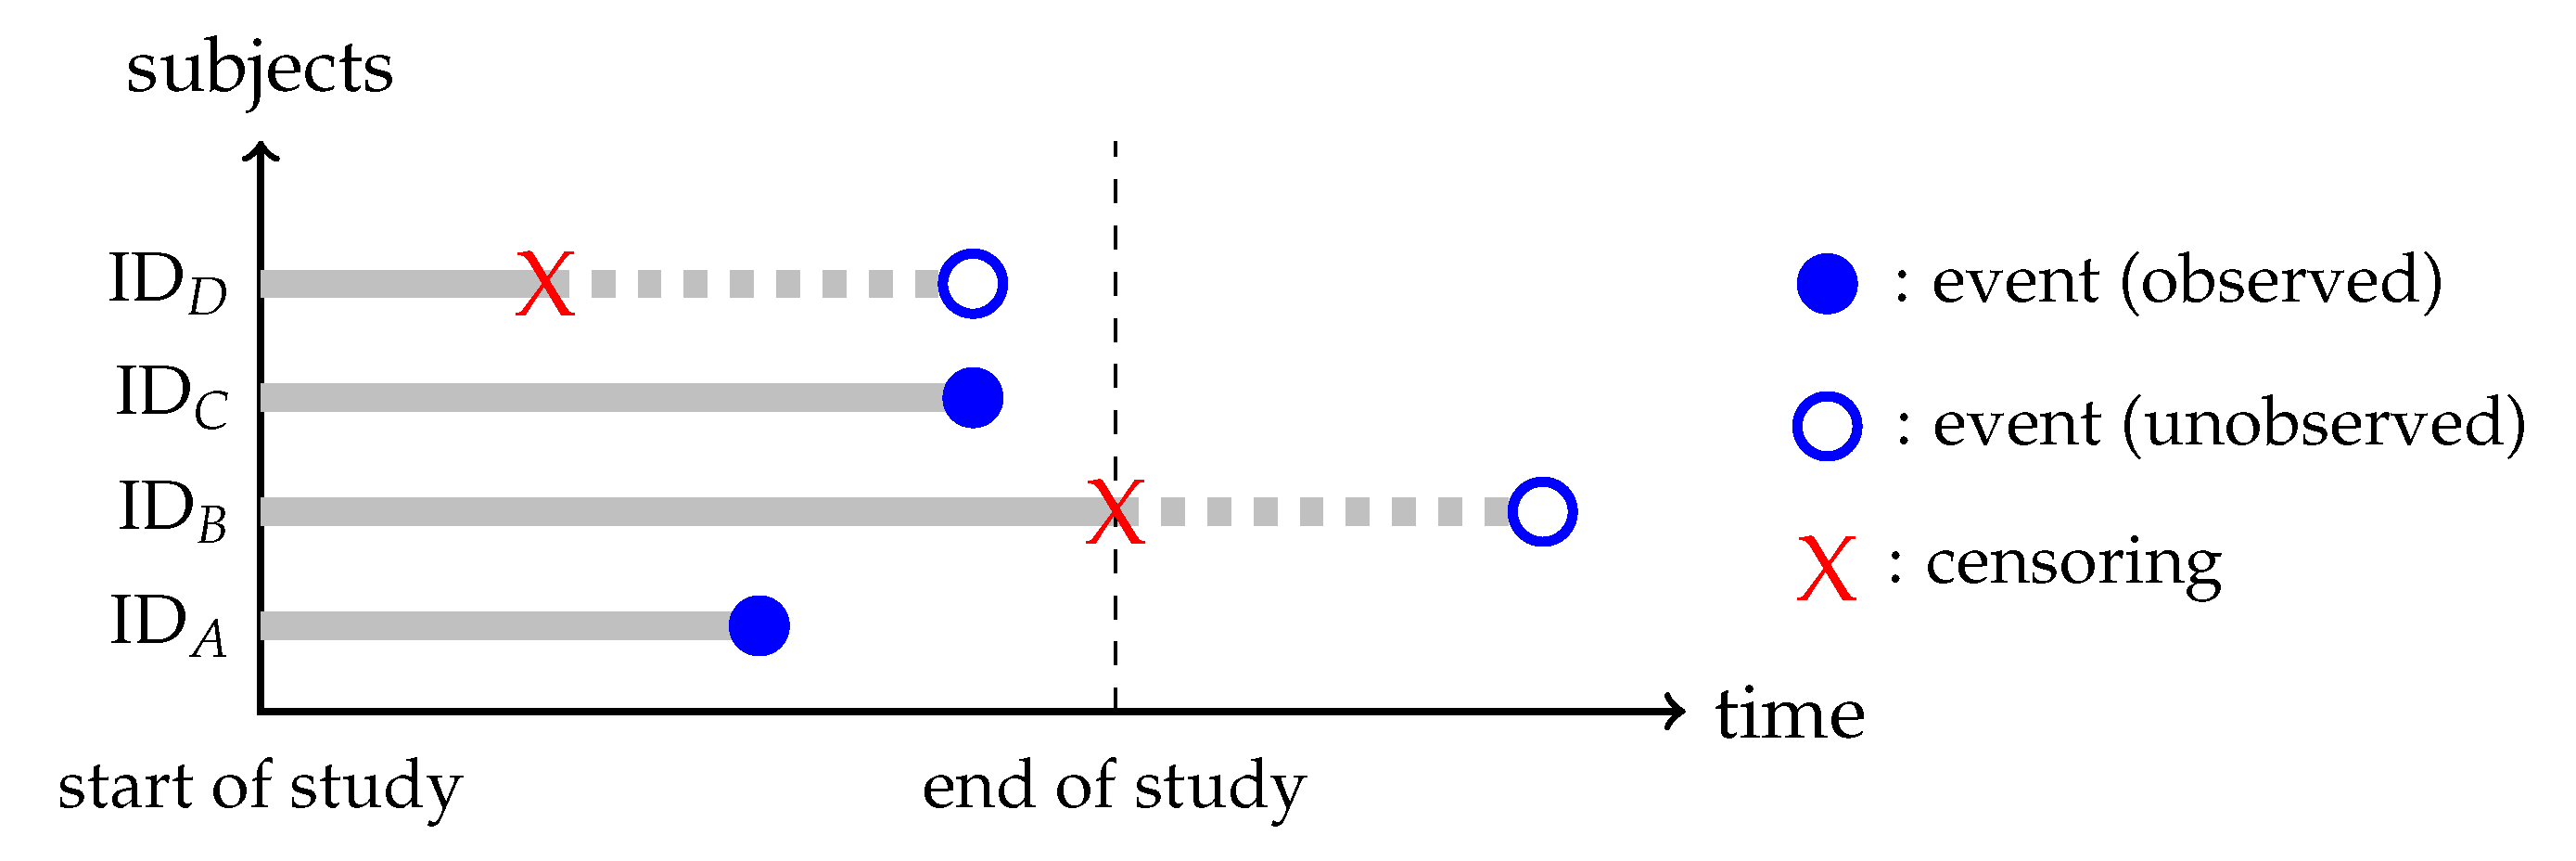
Figure 2.
Numerical example for the Kaplan–Meier estimator. For each event, is recursively evaluated.
Figure 2.
Numerical example for the Kaplan–Meier estimator. For each event, is recursively evaluated.
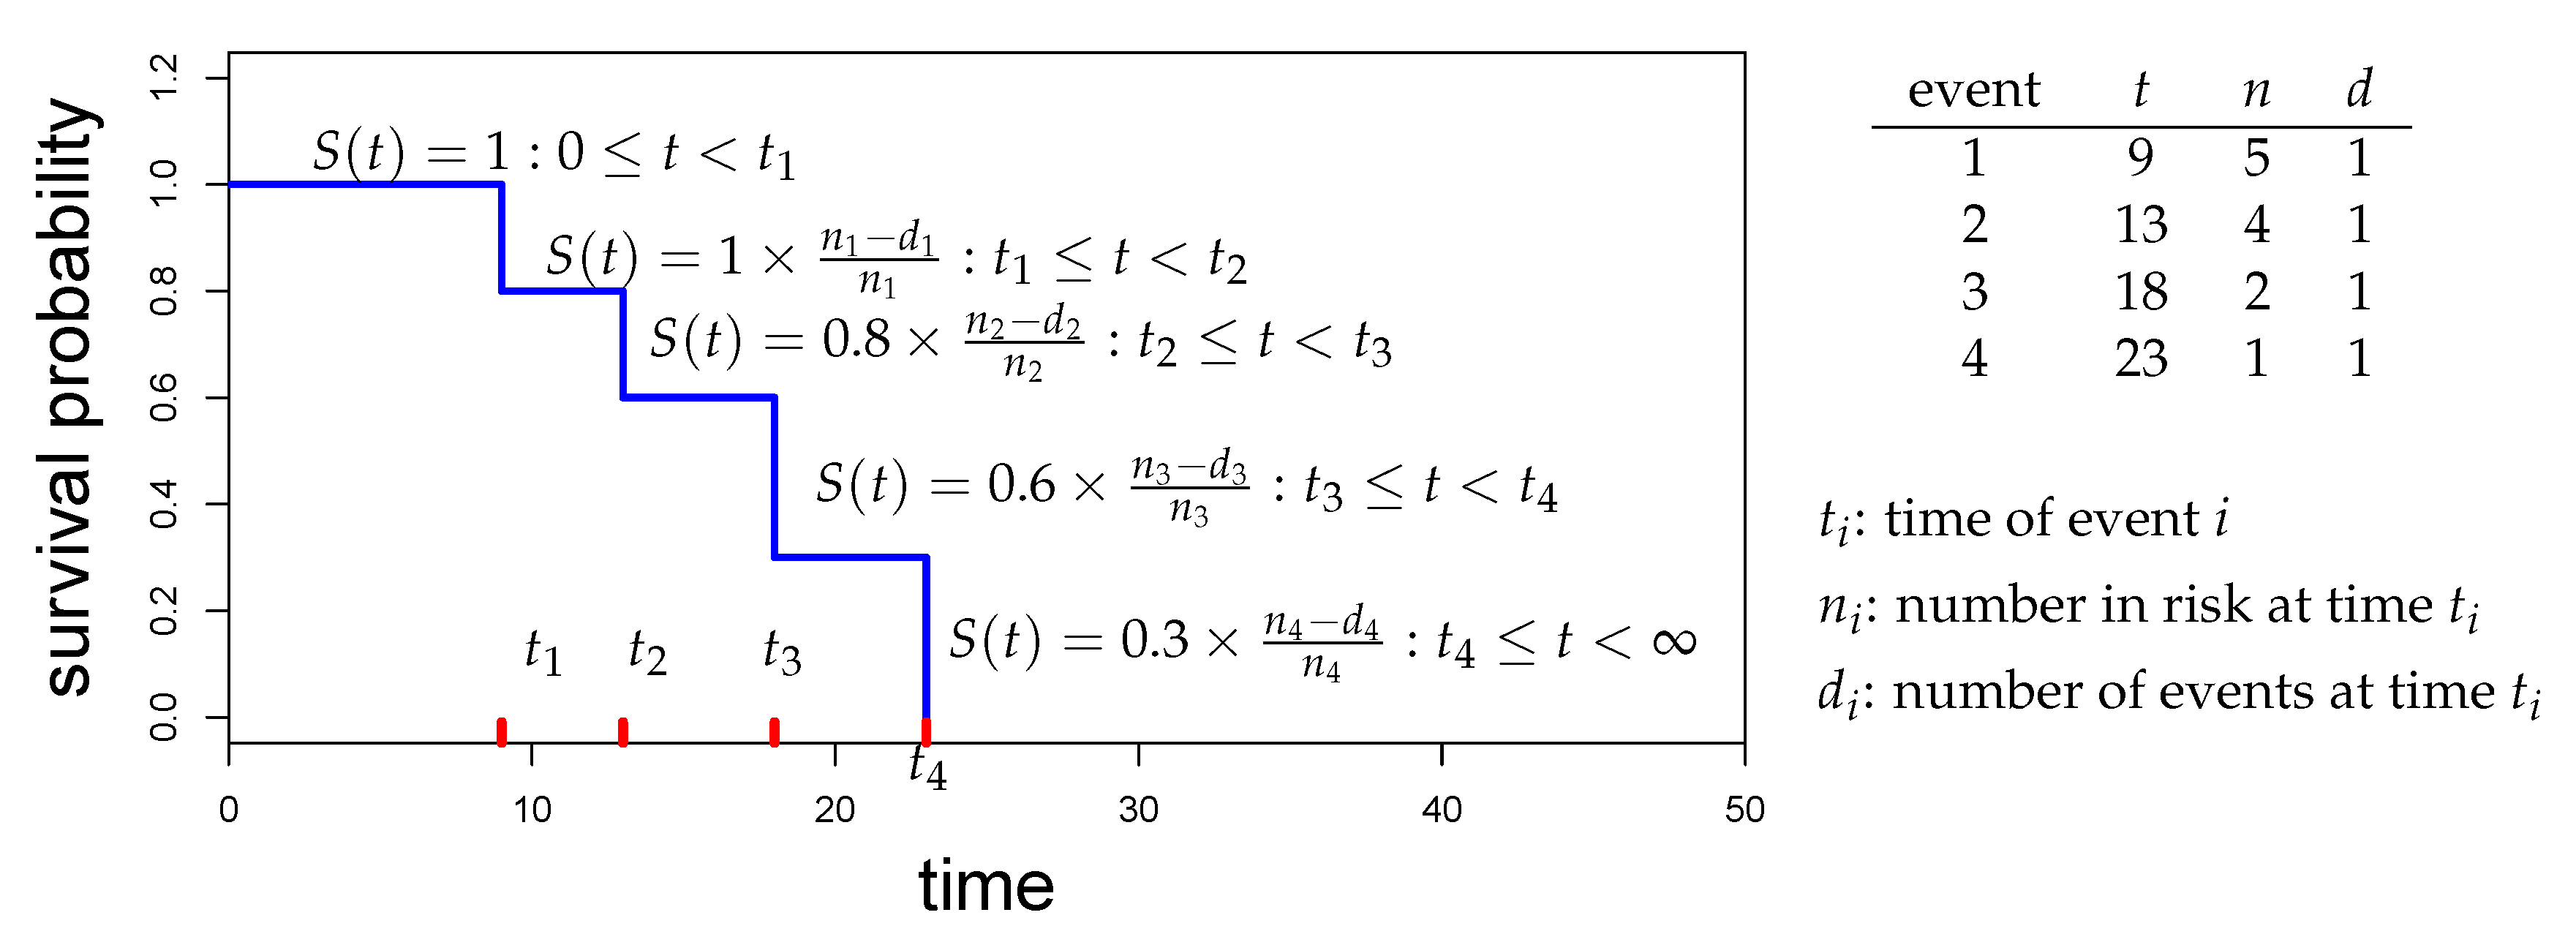
Figure 3.
Comparison of different parametric survival models.
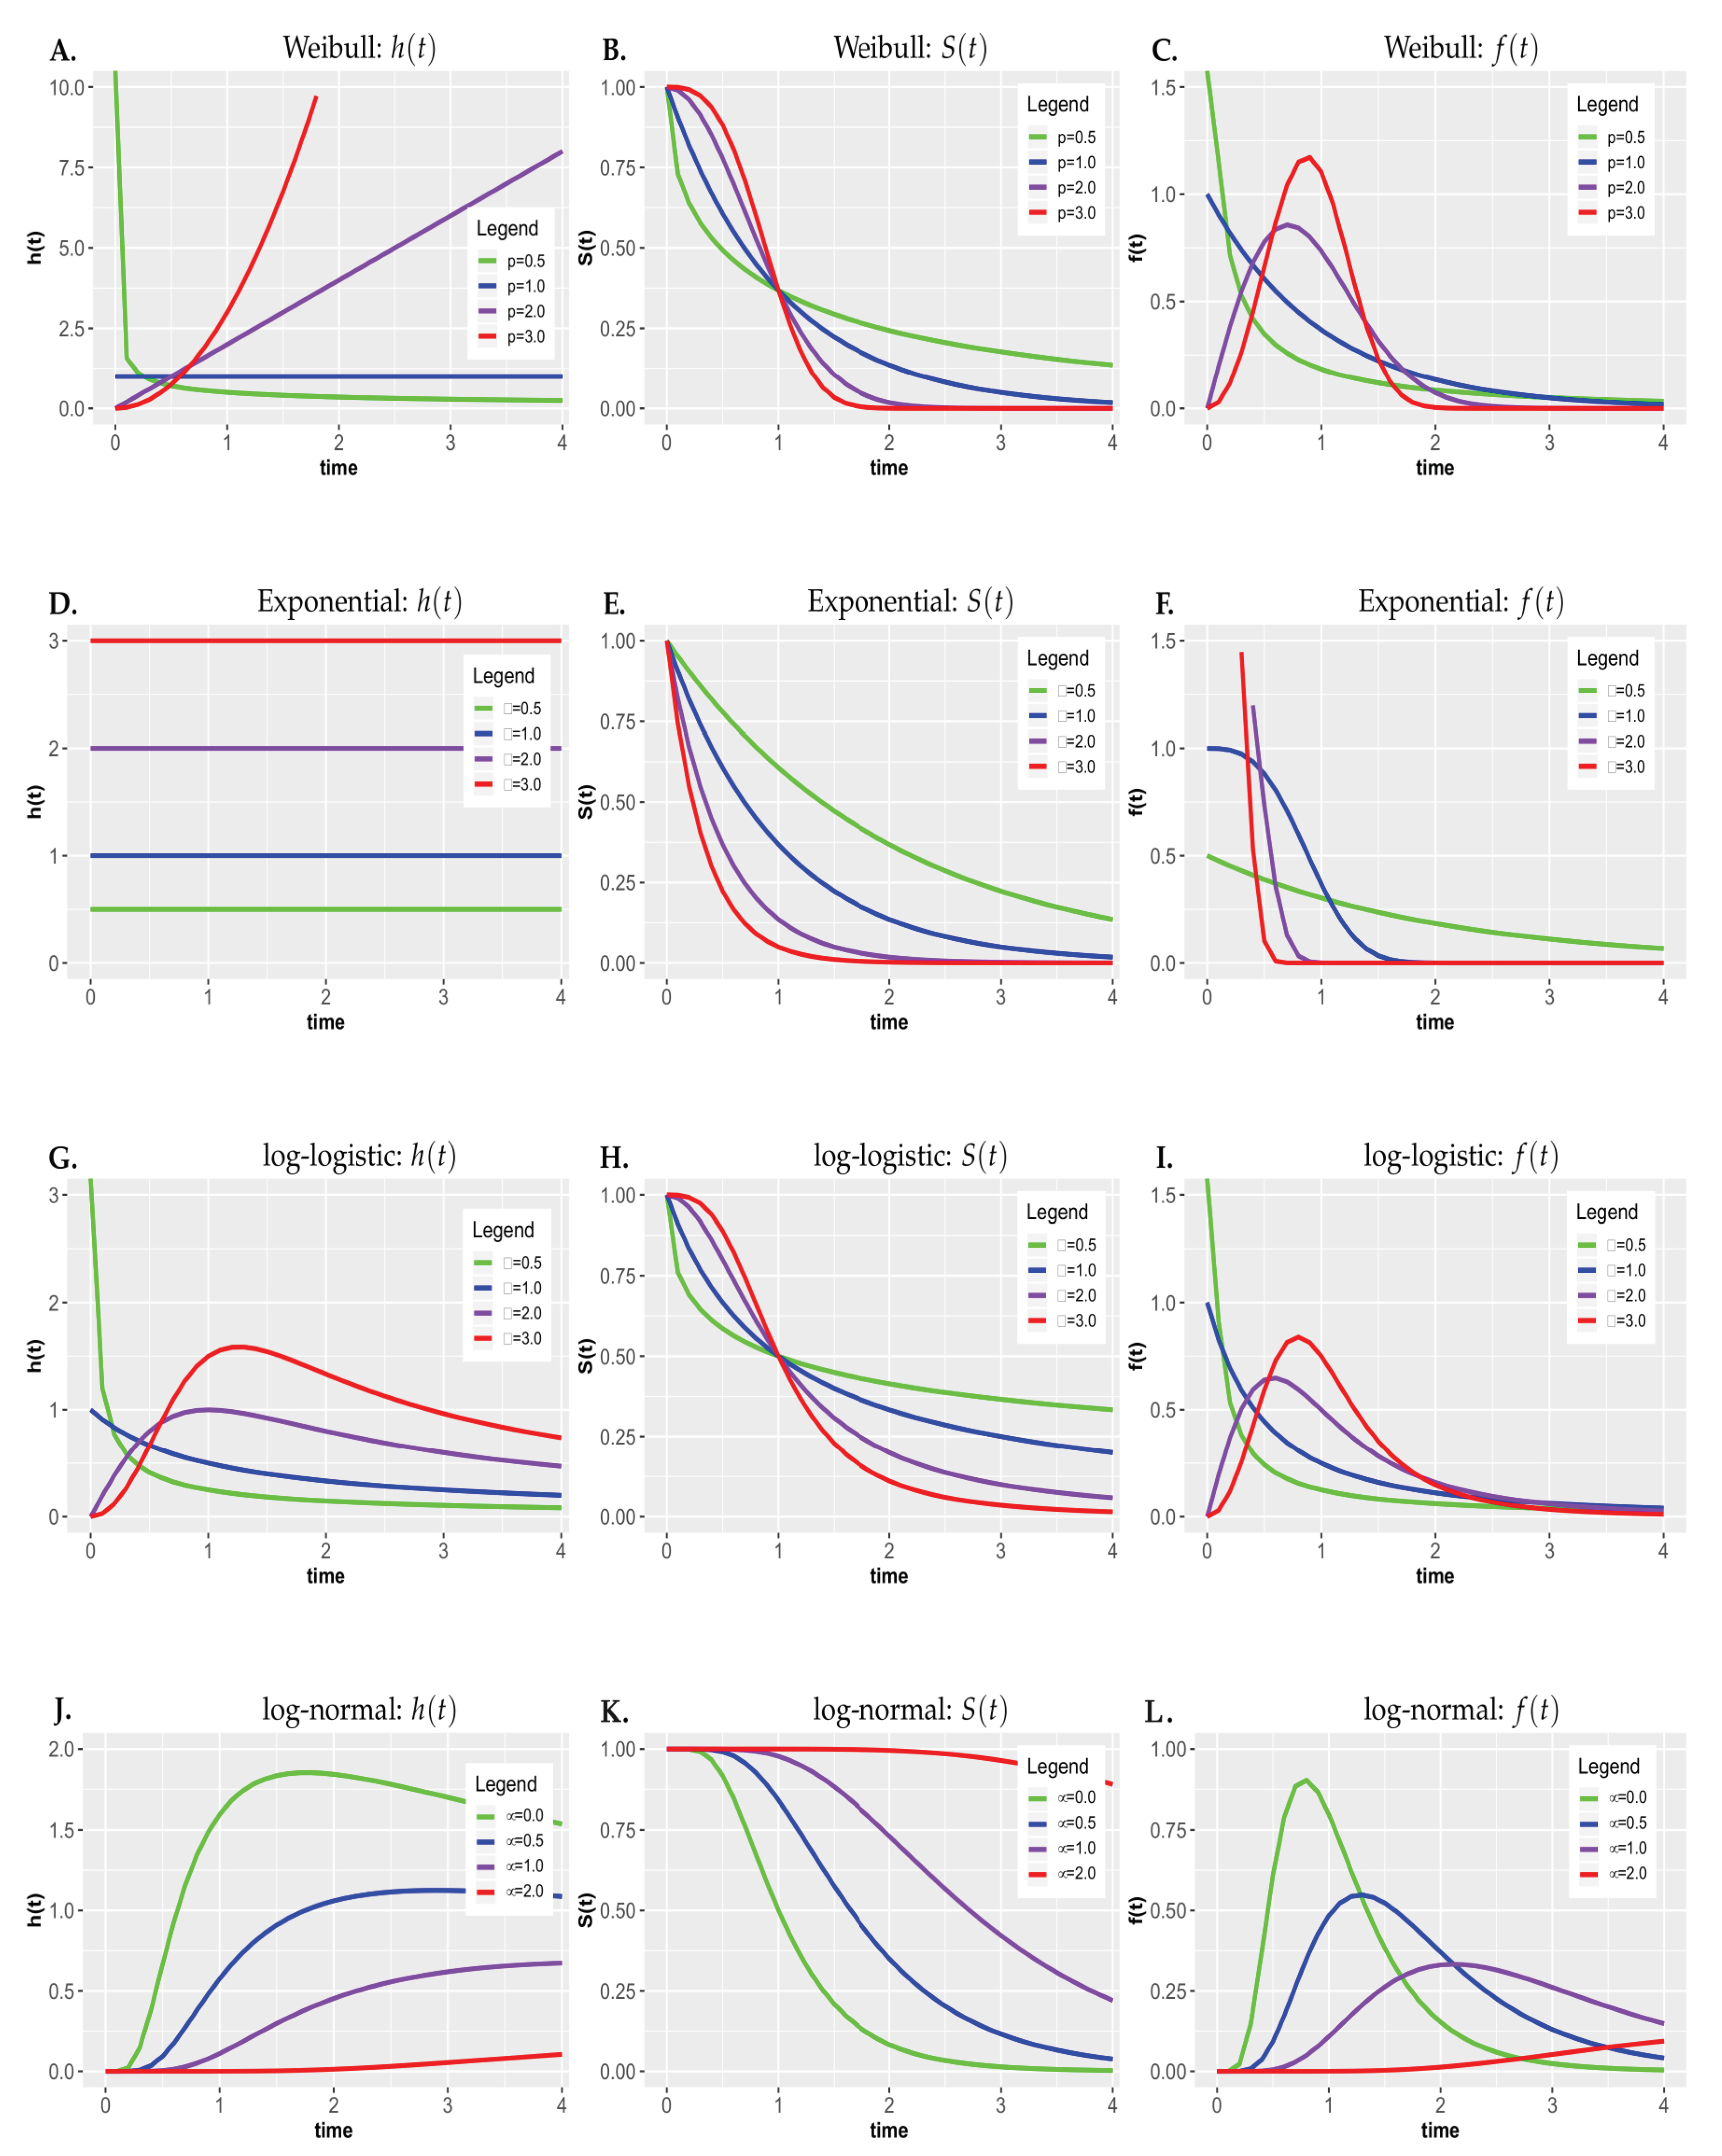
Figure 4.
The result of Listing 1. Top: The two survival curves for male (green) and female (orange) are shown for a duration of 1000 days. Middle: The number at risk is shown in interval steps of 100 days. Bottom: The number of censoring events is shown for the same interval steps.
Figure 4.
The result of Listing 1. Top: The two survival curves for male (green) and female (orange) are shown for a duration of 1000 days. Middle: The number at risk is shown in interval steps of 100 days. Bottom: The number of censoring events is shown for the same interval steps.
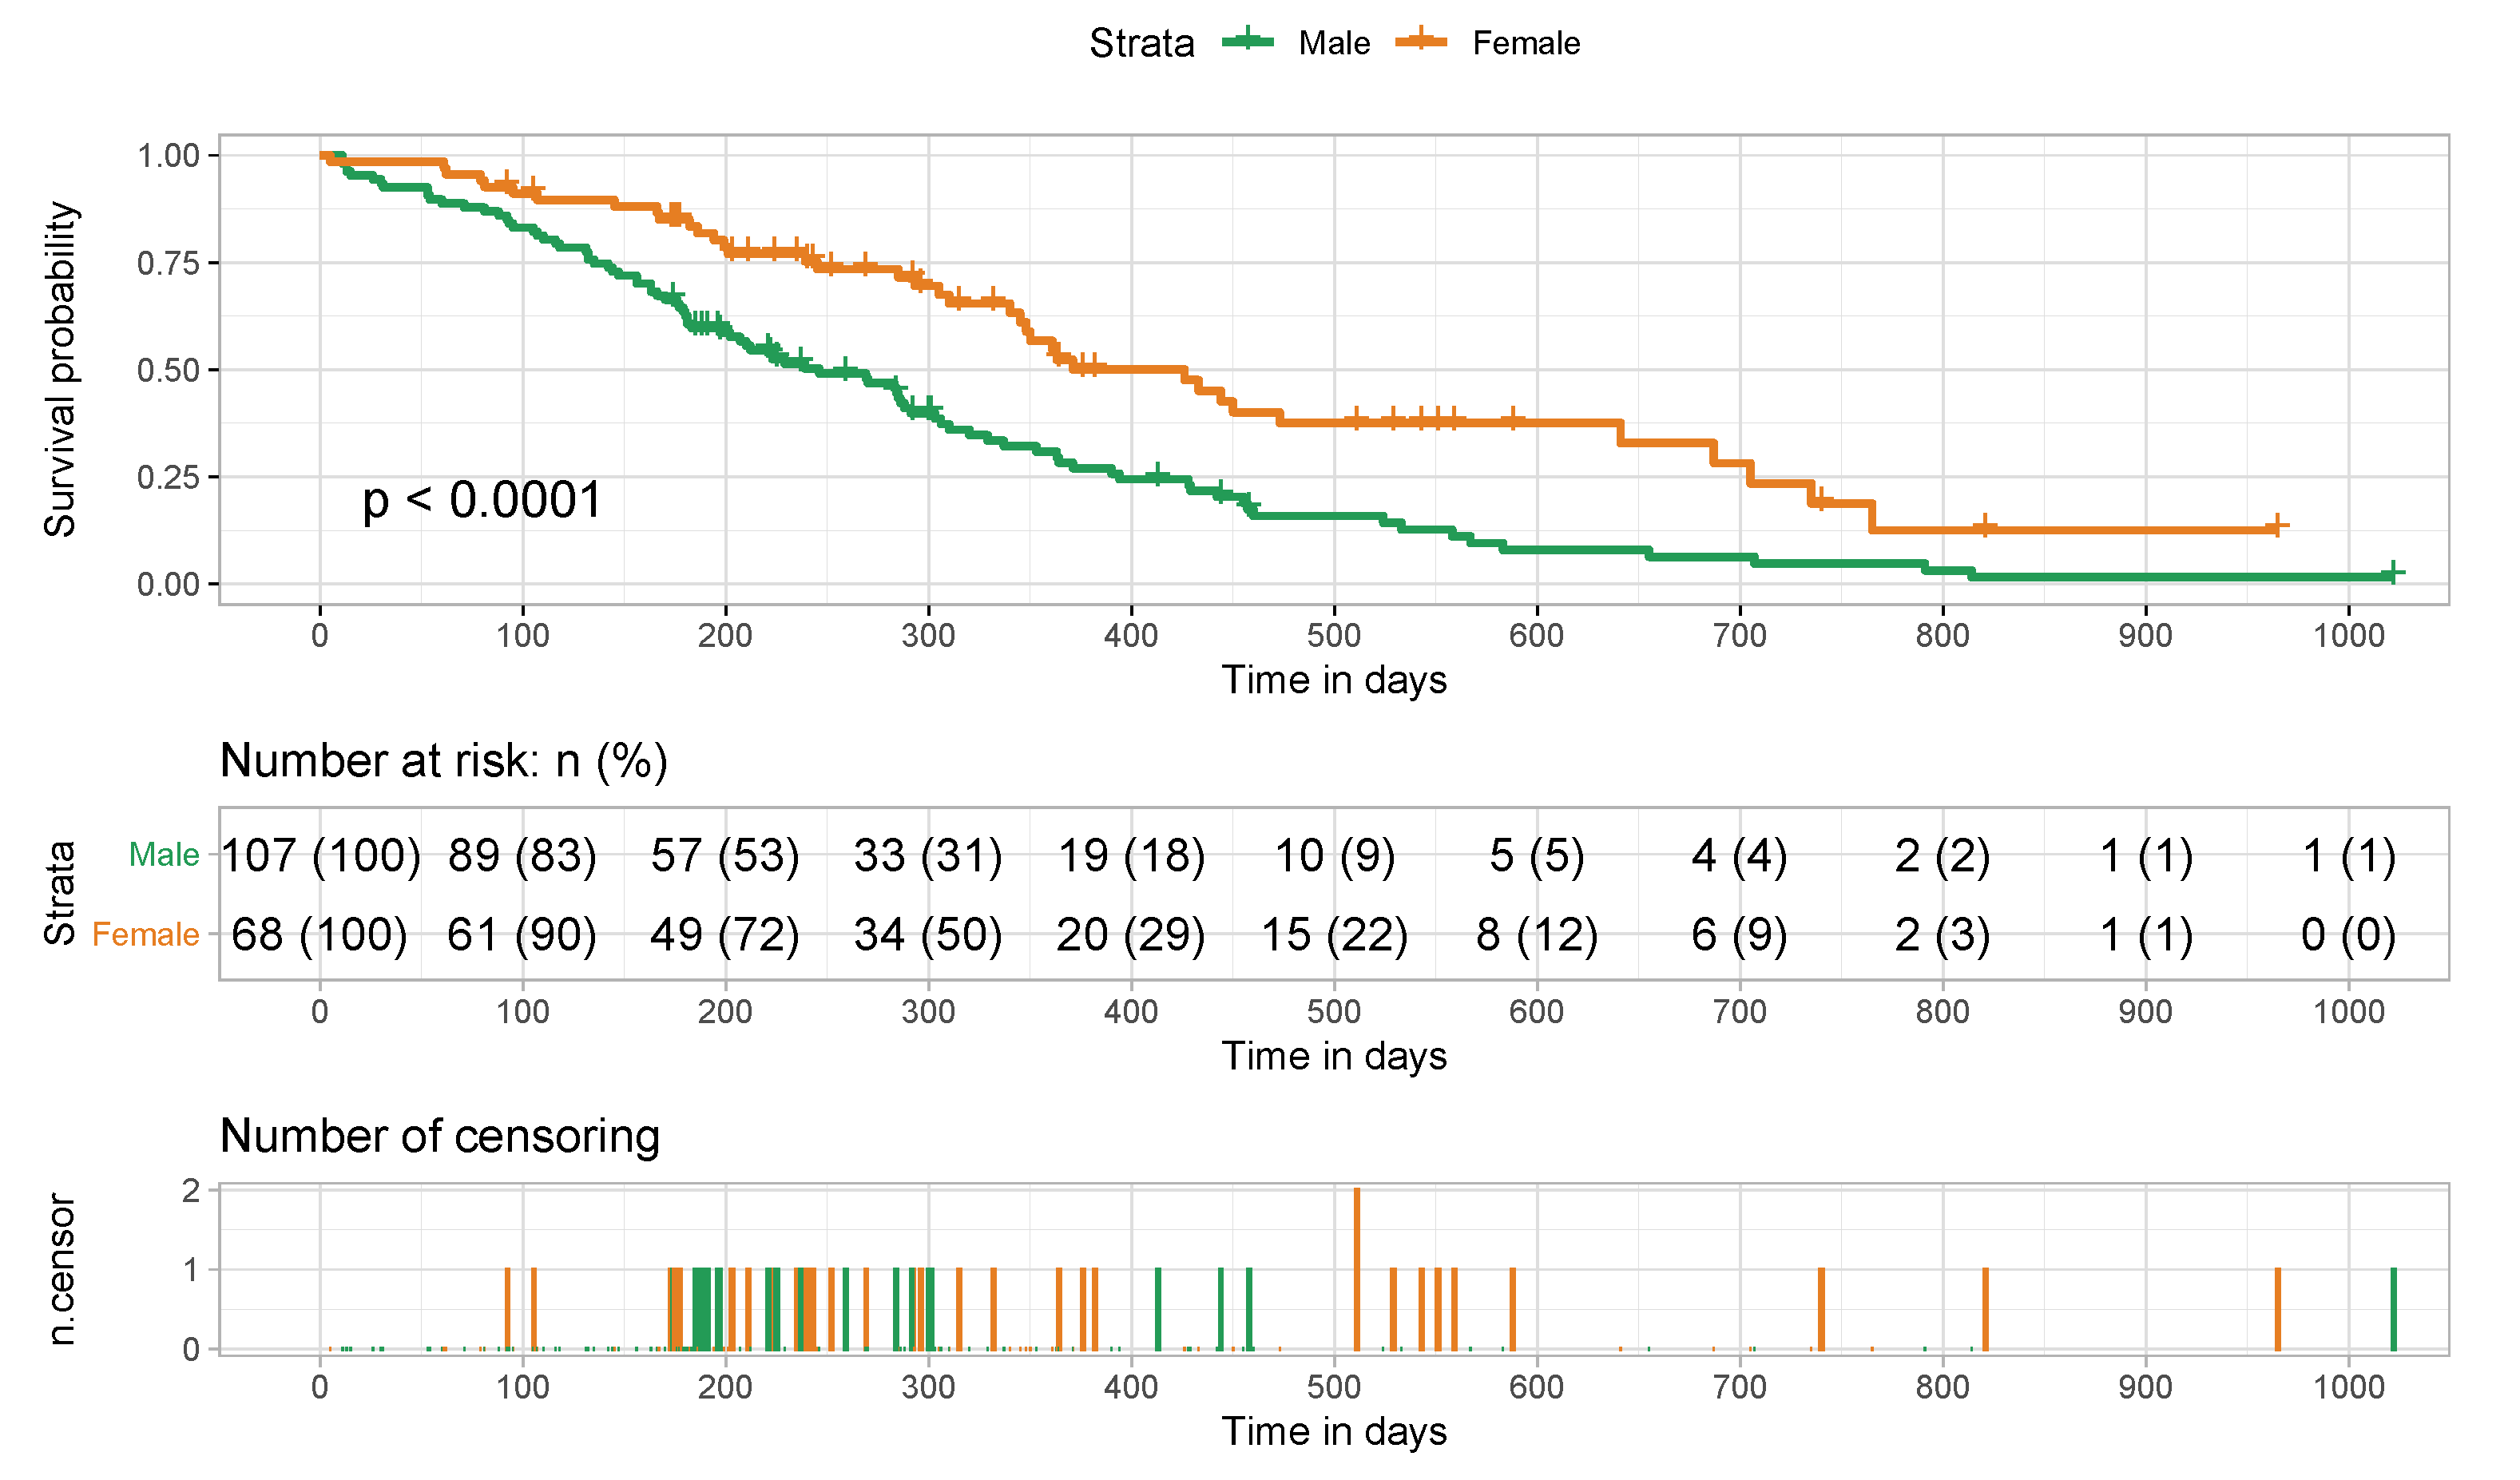
Figure 5.
Visualization of the scaled Schoenfeld residuals of sex against the transformed time.
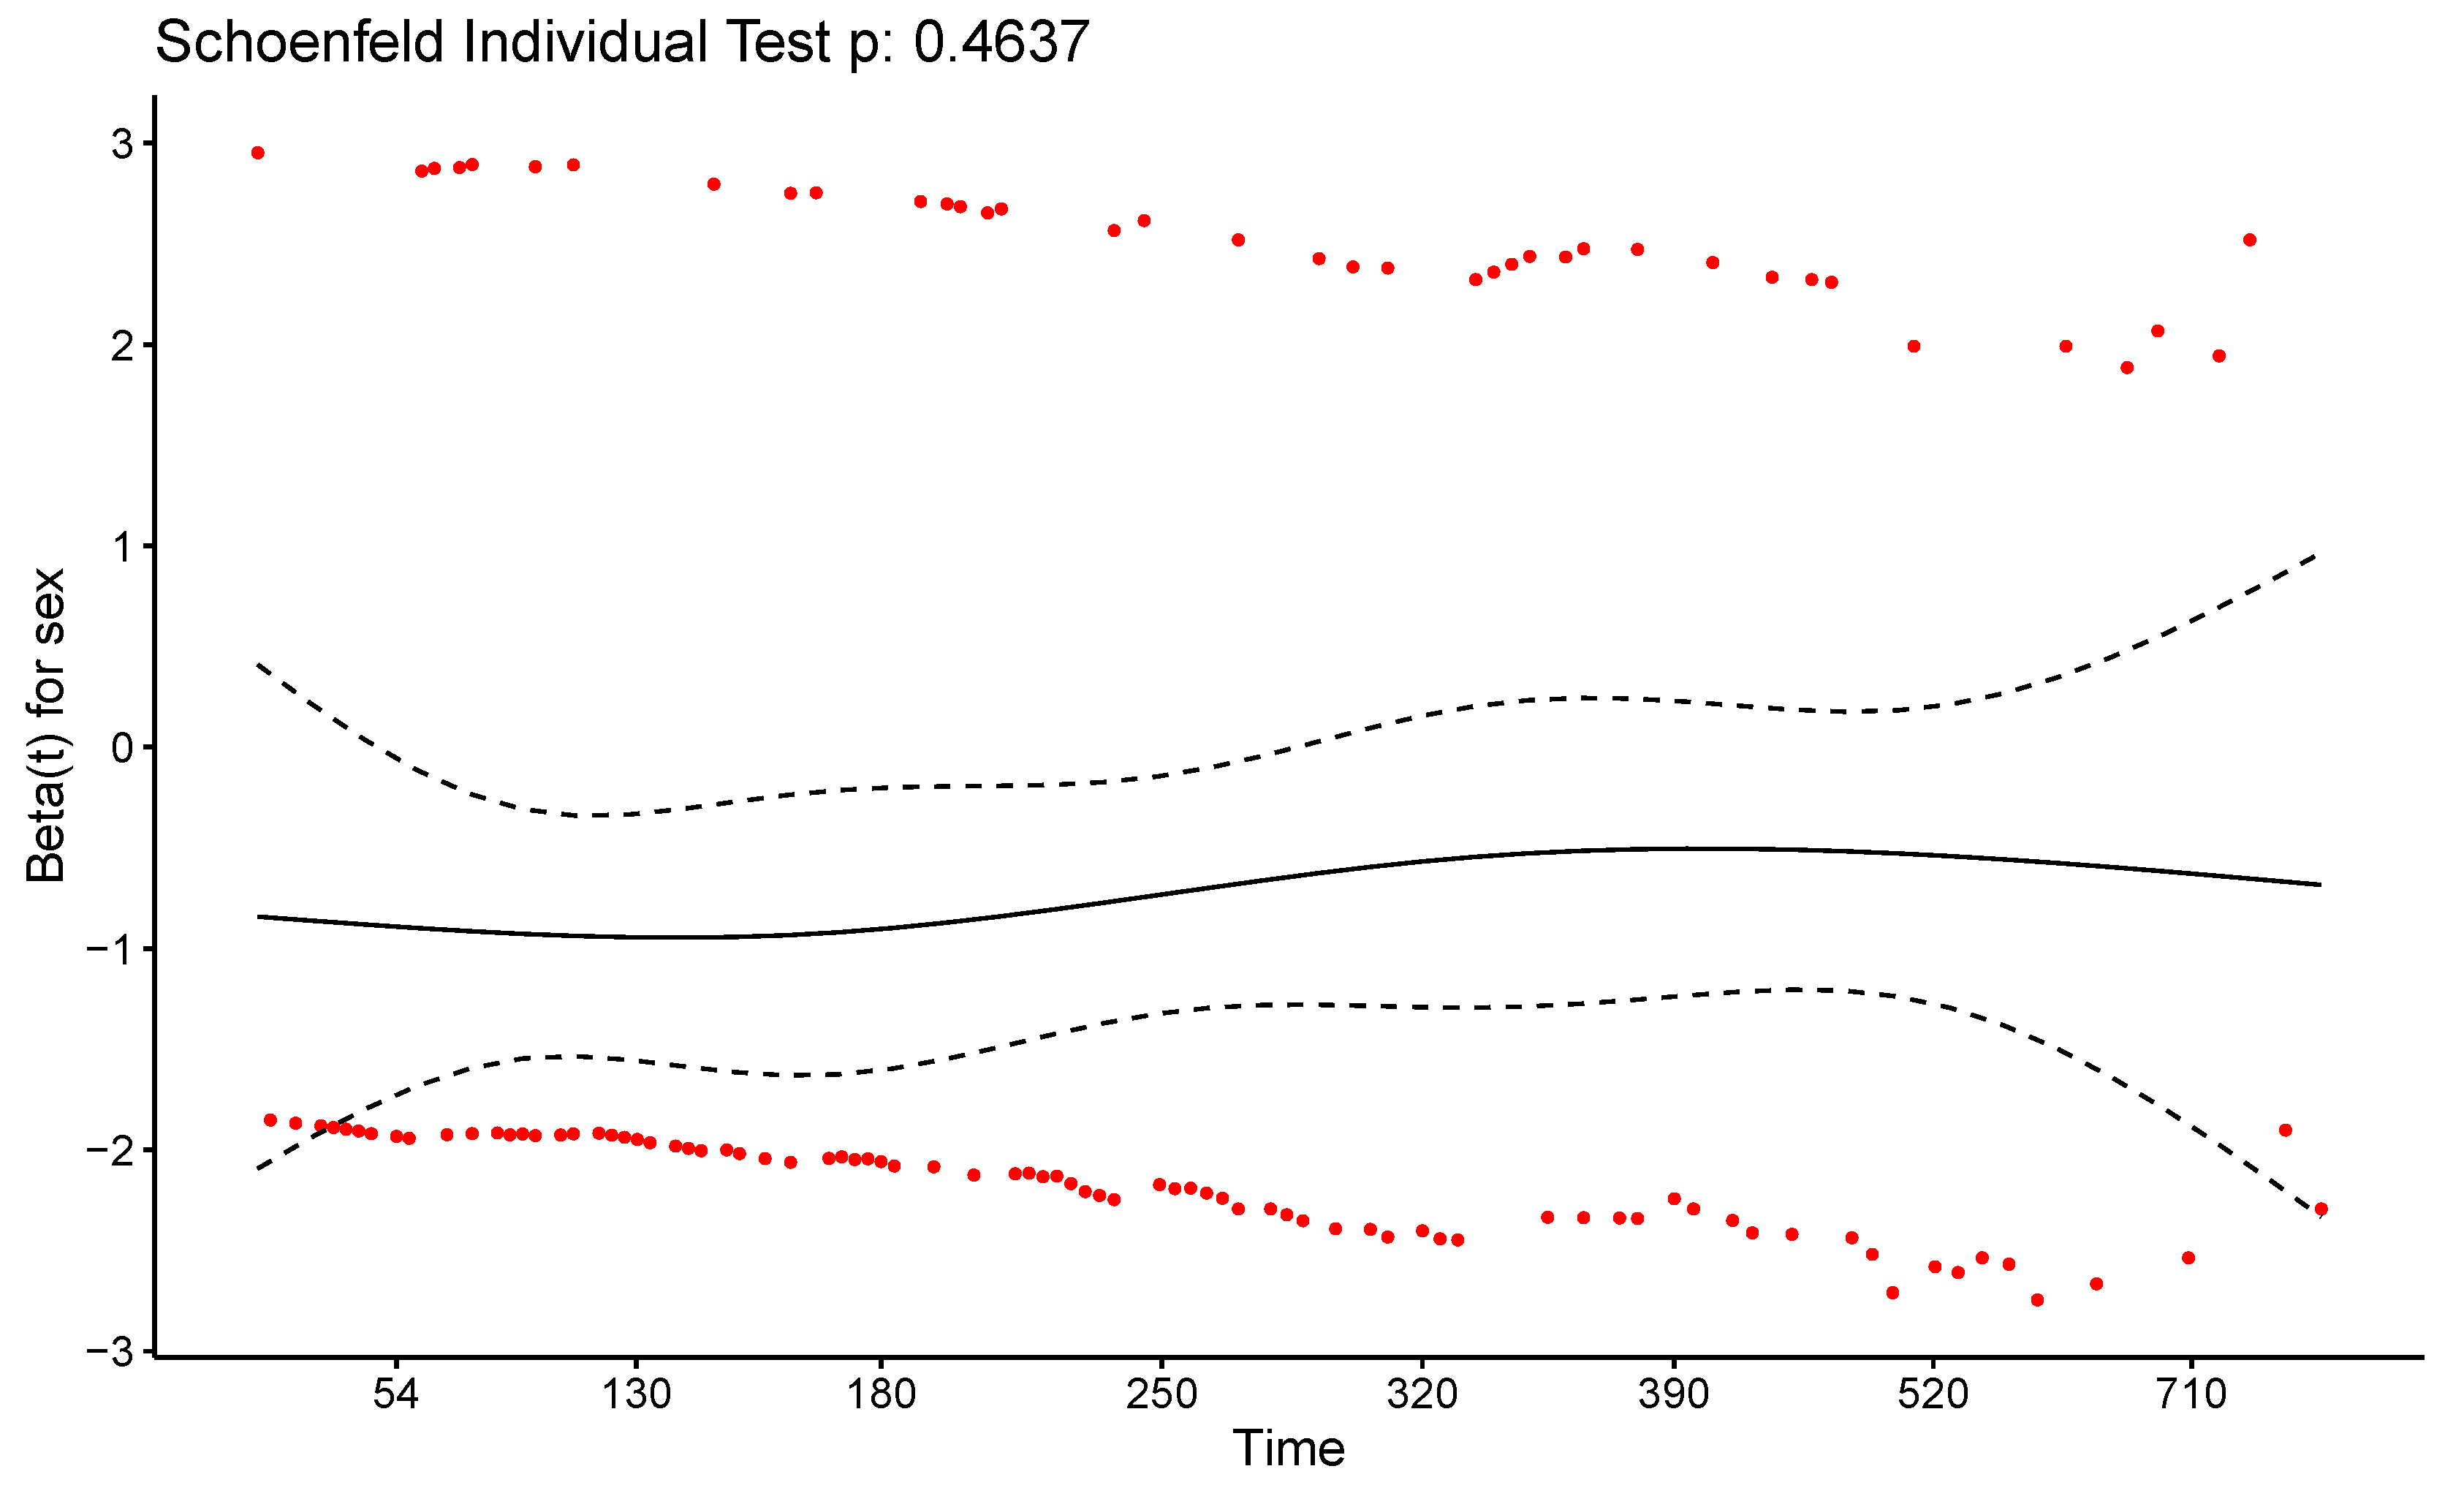
Figure 6.
Forest plot of hazard ratios for a multivariate CPHM.

Table 1.
Summary of characteristic hazard functions and their usage.
| Hazard Function Behavior | Usage | Parametric Model |
|---|---|---|
| constant | normal product | Weibull () |
| monotonous decreasing | patient after surgery or stock market after crash | Log-logistic () |
| monotonous (linear) increasing | unsuccessful surgery or unsuccessful treatment or wearout of a product | Weibull () |
| humped | infection with tuberculosis (TB) | Log-normal |
| U-shaped | heart transplant |
© 2019 by the authors. Licensee MDPI, Basel, Switzerland. This article is an open access article distributed under the terms and conditions of the Creative Commons Attribution (CC BY) license (http://creativecommons.org/licenses/by/4.0/).
Share and Cite
MDPI and ACS Style
Emmert-Streib, F.; Dehmer, M. Introduction to Survival Analysis in Practice. Mach. Learn. Knowl. Extr. 2019, 1, 1013-1038. https://doi.org/10.3390/make1030058
AMA Style
Emmert-Streib F, Dehmer M. Introduction to Survival Analysis in Practice. Machine Learning and Knowledge Extraction. 2019; 1(3):1013-1038. https://doi.org/10.3390/make1030058
Chicago/Turabian StyleEmmert-Streib, Frank, and Matthias Dehmer. 2019. "Introduction to Survival Analysis in Practice" Machine Learning and Knowledge Extraction 1, no. 3: 1013-1038. https://doi.org/10.3390/make1030058