

A Review on Wire-Laser Directed Energy Deposition: Parameter Control, Process Stability, and Future Research Paths


1
School of Mechanical, Industrial and Manufacturing Engineering, Oregon State University, Corvallis, OR 97330, USA
2
Advanced Technology and Manufacturing Institute (ATAMI), Corvallis, OR 97330, USA
*
Author to whom correspondence should be addressed.
J. Manuf. Mater. Process. 2024, 8(2), 84; https://doi.org/10.3390/jmmp8020084
Submission received: 24 March 2024
/
Revised: 16 April 2024
/
Accepted: 18 April 2024
/
Published: 20 April 2024
(This article belongs to the Special Issue High-Performance Metal Additive Manufacturing)
Abstract
:Wire-laser directed energy deposition has emerged as a transformative technology in metal additive manufacturing, offering high material deposition efficiency and promoting a cleaner process environment compared to powder processes. This technique has gained attention across diverse industries due to its ability to expedite production and facilitate the repair or replication of valuable components. This work reviews the state-of-the-art in wire-laser directed energy deposition to gain a clear understanding of key process variables and identify challenges affecting process stability. Furthermore, this paper explores modeling and monitoring methods utilized in the literature to enhance the final quality of fabricated parts, thereby minimizing the need for repeated experiments, and reducing material waste. By reviewing existing literature, this paper contributes to advancing the current understanding of wire-laser directed energy deposition technology. It highlights the gaps in the literature while underscoring research needs in wire-laser directed energy deposition.
1. Introduction
Directed energy deposition (DED), has revolutionized metallic part fabrication due to the ability to expedite production and minimize the material waste across various industries [1,2,3,4,5,6,7,8,9,10,11,12,13] including aerospace [14], automotive [15], and biomedical [16]. DED processes utilize wire or powder as the feedstock [10,17,18,19] with various heat sources, including lasers, electron beams, electrical arcs, and plasma, employed for the deposition process. Depending on the type of selected heat source, DED processes can be classified into electron beam DED (EB-DED) [20], laser DED (LDED) [21], plasma DED (P-DED) [22], and wire arc DED (WAAM) [23,24,25,26]. Each type of DED process offers advantages and disadvantages, making them more suitable for distinct applications [27,28]. Table 1 presents the abbreviation of the AM processes and systems.
Among various heat sources utilized, LDED has gained widespread application due to its flexibility, high energy density, and control over the heat input. LDED offers the advantage of forming a small heat-affected zone and allows for the ease of laser power modifications compared with the previously mentioned DED processes [21,29,30,31].
To compete with conventional manufacturing processes, it is essential to significantly enhance the deposition rate and improve the buy-to-fly ratio [32]. This can be achieved by incorporating filler metals like wire into the process. When the wire is employed as feedstock, it offers solutions to major drawbacks associated with powder-based processes. Wire feedstock allows for a greater deposition rate compared to powder-based processes [33,34,35] while reducing material costs, as the wire is typically cheaper than metal powder [36,37,38].
Utilizing metal powder feedstock increases contamination risks within the process and may pose potential safety concerns, which can be avoided when wire is employed [39]. Furthermore, for microgravity applications, the use of wire feedstock instead of powder is preferred due to its ease of handling [40,41,42]. Considering these aspects, wire-laser directed energy deposition (W-LDED) emerged as a promising method for manufacturing due to its notable advantages, including high material deposition efficiency, minimized material waste, and a cleaner process environment [43,44,45]. Table 2 summarizes the fundamental differences between wire and powder feedstock.
During the deposition process the wire is fed through a nozzle and exposed to the laser beam while the laser beam and wire deposition movements are controlled through advanced computer software. The laser beam’s energy melts the wire, fusing it to the substrate, thus creating a durable bond. The W-LDED process is affected by various processing parameters, including laser power, laser spot size, travel speed (TS), and wire feed speed (WFS) [24,46,47]. Despite these advantages, various process-related challenges can impact deposition quality and stability in manufacturing. These challenges include issues with parameter selection, exposure to multiple thermal cycles, and limitations in process control and repeatability [29,31,48,49,50,51,52,53].
Several review papers have been published covering various aspects of W-LDED within the broader discussion of DED processes. Li et al. [17] provided a comprehensive review of high deposition rate LDED technology, emphasizing its potential for rapid manufacturing of large-scale components and the need for further research on process optimization, microstructure evolution, and mechanical properties. Meanwhile, Ozel et al. [37] discussed the challenges of achieving reliable mechanical properties and desired microstructures in W-DED processes, with a particular focus on grain tailoring and modeling methods. Abuabiah et al. [46] published a review paper focused on advancements in W-LDED, specifically addressing monitoring and control aspects. While these articles touched on some aspects of W-LDED, the existence of a comprehensive review on process stability in the W-LDED process remains a gap within the literature.
This work presents a review of the state-of-the-art in W-LDED to gain an in-depth understanding of the process variables and the cause–effect relationship affecting process stability. Additionally, the modeling and monitoring methods utilized in W-LDED literature are explored to enhance the quality of fabricated parts, thereby reducing the necessity for repetitive trial-and-error experiments, and minimizing material waste. The deposition parameters investigated in this work are sorted into four categories as depicted in Figure 1, where the impact of each variable on deposition quality, stability, and efficiency has been identified.
2. Energy Characteristics
2.1. Input Energy
Sufficient energy input in W-LDED processes is crucial to achieve high-quality deposition, ensuring that the wire melts completely and fuses effectively to the substrate. Incorrect energy input can lead to defect formation, which prevents further fabrication [54,55].
In W-LDED, the laser is the main source of power; therefore, choosing the right laser power, together with the TS and WFS, is important in determining the amount of energy each point receives locally. It affects the amount of material being melted, its thermal cycle, and the quality of the final structure. As noted in the literature, the decision on the appropriate power depends on the type of material and the amount of wire that is being deposited [33,56,57,58,59].
Multiple indicators have been used in research for characterizing the energy input, i.e., linear energy density (J/mm) [17], areal energy density (J/ and volumetric energy density (J/) [47,56,60,61], all defined based on the laser spot size (Equations (1)–(3)). Specific energy (kJ/g), as shown in Equation (4), is another widely used indicator expressed based on wire mass per unit time [48,62].
While these indicators are valuable tools for comparing parameter sets, studies have noted that maintaining a constant energy input does not always ensure consistent melt pool characteristics or uniform deposition. Laser power and TS have been shown to individually influence thermal indicators such as thermal gradients, solidification rate, and the size of the heat-affected zone (HAZ). Therefore, the incorrect selection of these parameters can result in irregularities in surface quality, ultimately impacting the dimensional accuracy of the deposited part [63,64]. In Equations (1)–(4), P is the laser power (W), is the wire material density (g/, and are the diameter and cross-sectional area of the beam, respectively, and is the area of the utilized wire.
2.2. Laser Characteristics
2.2.1. Laser Types
Research findings indicate that optimizing and customizing the laser type for specific materials can significantly enhance process efficiency and stability while offering economic benefits. There are two types of lasers, continuous, and pulsed. Investigations into the application of continuous and pulsed lasers have unveiled distinct behaviors in these laser types, particularly in terms of melt pool formation [65]. It is observed that when continuous lasers are used, the melt pool is dragged along the direction of deposition as the laser moves (Figure 2a), which may lead to intolerable heat accumulation over time [66,67]. In contrast, when utilizing the pulsed laser, the melt pool freezes between the pulses (Figure 2b), as documented by Assuncao et al. [68]. This is favorable as it reduces heat accumulation by carefully considering the pulse duration [68]. Studies have shown that longer pulse durations with a fixed power density increase penetration depth, signifying higher energy utilization [69]. Another advantage of pulsed lasers over continuous lasers is that pulsed laser allows for better heat input regulation over time during the deposition, as demonstrated by Ye et al.’s work [70].
Different types of lasers have been used in the literature, with diode, Nd: YAG, C, and fiber lasers being the most predominant ones [66,71,72,73]. The findings, once again, emphasize the importance of selecting appropriate laser types based on material characteristics for effective and economical processes. For instance, Valentin et al.’s comparison in aluminum W-LDED reveals that diode lasers, operating at a wavelength aligning with aluminum absorption peaks, increase its absorptance. This alignment brings cost-effectiveness as direct diode lasers tend to be less expensive than fiber lasers and addresses material-specific considerations [74].
Liu et al. successfully deposited pure copper (Cu) using a blue laser and achieved near-full-density samples [75]. Cu exhibits a high reflectance of the near-infrared (IR) wavelengths commonly used in LDED applications, which makes the deposition challenging. The authors noted that the absorption of the blue laser in Cu is higher compared to an IR laser of a longer wavelength, making blue lasers a preferable choice for depositing Cu [76,77].
Despite the growing interest in W-LDED of various materials, it is evident that the selection of appropriate lasers and their corresponding wavelengths tailored for each material’s specifications remains a notable research gap within the literature.
2.2.2. Laser Beam Profile
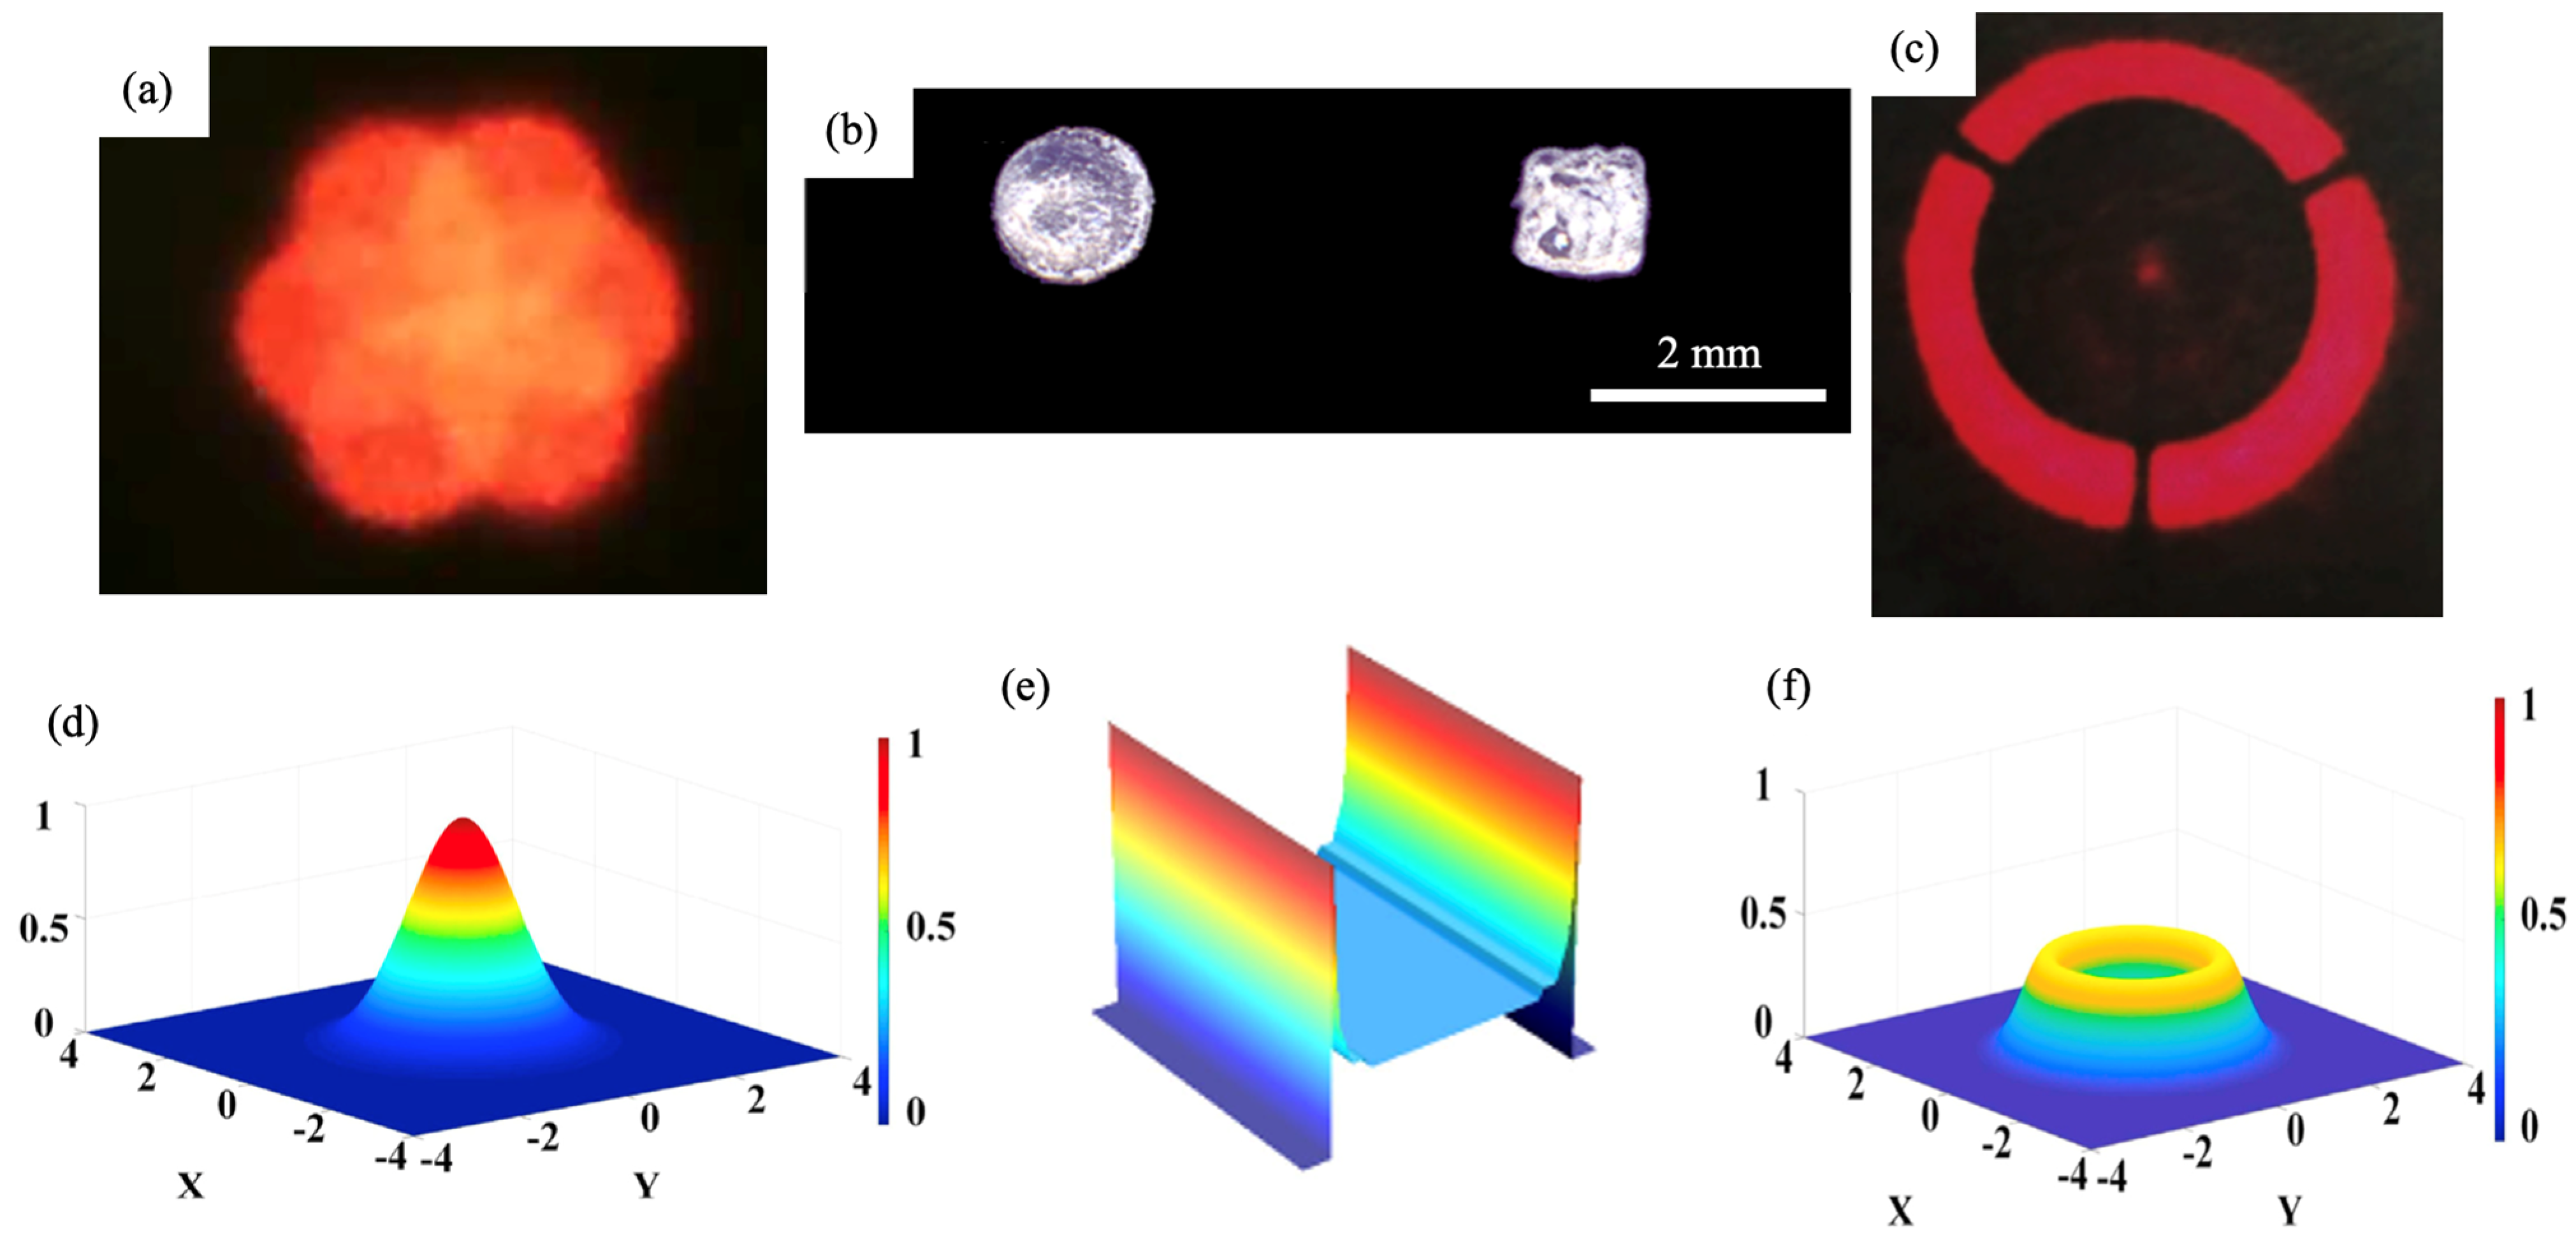
In representing the heat energy distribution, Gaussian (circular beam), annular (hallow beam), and pedestal (flat beam) profiles have been used to serve as distinct models (Figure 3a–c), each offering unique profiles suited for various applications.
The Gaussian heat source exhibits a bell-shaped intensity profile (Figure 3d), with peak intensity at the center. As shown in Figure 3f, annular heat sources present a ring-like configuration, accurately distributing heat in a circular and well-defined shape, thereby enhancing process symmetry compared to Gaussian beam, owing to the annular beam’s lower intensity [78,79,80,81,82]. Froend et al.’s thermal analysis confirmed that, in contrast to an annular beam, the Gaussian beam’s intensity distribution and high irradiance lead to the formation of higher-temperature melt pools [83]. Chen et al.’s investigation reveals that annular beams require less laser power to melt the same amount of fed wire compared to the Gaussian distribution. This is particularly beneficial due to their lower peak energy density and more uniform energy distribution, providing a lower thermal gradient in the molt pool [84,85]. Goffin et al. compared a pedestal beam with a Gaussian beam to investigate the effect each has on melt pool formation and found that a pedestal beam heats the substrate more efficiently compared to a Gaussian beam with the same width. This is because the flat beam can directly heat the substrate, bypassing the need for heat conduction through the wire. This allows the substrate to achieve high temperatures with lower laser power levels [86,87,88].
Figure 3.
(a) Donut-like laser arrangement using six diode lasers (Meltio M450); (b) laser burn prints of Gaussian and pedestal beam profile (reproduced with permission from [87]: copyright 2021, Springer); and (c) the annular laser spot (reproduced with permission from [82]: copyright 2023, MDPI). Energy distribution of (d) Gaussian (reproduced with permission from [84]: copyright 2022, Elsevier Ltd.); (e) pedestal (reproduced with permission from [87]: copyright 2021, Springer); and (f) annular arrangements (reproduced with permission from [84]: copyright 2022, Elsevier Ltd.).
2.2.3. Beam Irradiance and Focal Spot Size
The laser beam irradiance or intensity inversely correlates with the focal spot size since it is defined as the power per unit area. As the experimental research suggests, once the wire diameter is selected, the diameter of the laser beam can be set nearly the same as the wire diameter to ensure the accurate positioning of the heat source around the wire [56,89,90].
Froend et al.’s investigation into adjusting the focal spot area and its impact on laser beam irradiance reveals that high irradiance, associated with a small focal spot area, promotes the formation of rough surface quality due to heat accumulation and higher melt pool temperature [91]. In contrast, reducing the laser beam irradiance by increasing the spot size results in a more stable process and improved surface quality due to low-temperature gradients and enhanced cooling rates [83]. Applying a large focal spot area contributes to achieving a uniform temperature distribution with minimal gradients, influencing surface tension and viscosity, as noted by Goffin et al. [86,87], who observed more effective substrate heating when using a larger Gaussian beam compared to a smaller one [83,92,93]. Kotar et al.’s experiment utilizing a continuous fiber laser further supports these findings, indicating that the smallest focal spot area results in a Gaussian distribution with the highest intensity at the wire axis, while increasing the focal spot area transforms the profile to a ring-type distribution with lower energy intensity at the center [85,94].
2.2.4. Focal Distance
In the W-LDED process, it is crucial to carefully adjust the distance between the laser focal point and the melt pool in the Z direction. Maintaining a nominal focal distance while keeping other parameters constant ensures a stable process. A high offset position causes the beam to focus on the wire, while a low offset leads to insufficient melting of the wire [95,96]. Experiments on the effect of focal position on process stability reveal that at a low focal position, the laser beam is too large on the substrate, acting as a beam with low intensity. As a result, the wire collides with the substrate without receiving sufficient energy to melt uniformly. On the other hand, at a high focal position, the laser beam encounters the wire above the substrate, initiating the melting of the wire tip at an excessive height before reaching the substrate [57,97,98,99].
To further control the laser intensity and heat input, a slight defocusing of the laser is widely employed in the literature, either by moving the laser beam in the Z direction or increasing the focal spot size [100]. This is primarily done to reduce the laser’s peak energy density and to prevent the overheating of the substrate and the wire at the laser focus point. As evident in Figure 4, both positive (i.e., focusing above the substrate) and negative (i.e., focusing below the substrate) defocusing techniques have been utilized in Gaussian beams where negative defocusing is the predominant choice [51,101,102,103].
The evolution of the laser spot pattern with increasing defocusing offset is illustrated in Figure 5. It is evident that when the beams fully overlap, the energy has the highest intensity. However, increasing the defocusing distance slightly reduces the overlap and, consequently, the laser’s peak energy. If the beams do not overlap with each other and the wire (as shown in Figure 5d), the energy will not be sufficient to melt the wire.
3. Feed Wire Characteristics
3.1. Wire Size
In W-LDED the material is being deposited at high rates ranging from 1.5 to 48 /min [10,24]. The deposition rate , as defined in Equation (5), depends on the WFS, the wire diameter (r), and the density of the wire being deposited (ρ) [61,83]. This insight emphasizes that employing thicker wire and faster feeding speed leads to an increased deposition rate.
The wire diameter utilized in W-LDED processes spans over a wide range, typically varying from 0.1 to 1.2 mm [24,65,66]. Smaller wire diameters are associated with improved dimensional accuracy and the ability to attain small features on the component. However, it is crucial to consider that using smaller wire diameters extends the process time due to the lower volume of material feeding into the melt pool [56]. Literature predominantly includes the use of wire with diameters around 1 mm [104,105].
The deposition rate closely interplays with laser power and significantly affects the process efficiency. A high deposition rate substantially impacts the dynamics of the melt pool and affects the dimensions of the resultant beads [106]. Research suggests that increasing the deposition rate while maintaining a constant power level results in the partial melting of the wire [10]. Consequently, based on this understanding, upper and lower limits for the WFS based on specific laser power inputs can be established [107].
To regulate the deposition rate, speed ratio or K value have been used in literature to correlate WFS and TS (Equation (6)) [25,62,108,109,110].
This is proven to be a robust indicator for evaluating the influence of various process parameters on defect formation during the deposition process [62]. Notably, as observed by Wang et al. in depositing Al alloy, there exists an inverse relationship between porosity levels and speed ratio when energy remains constant. The authors observed that under the same speed ratio, the attainment of the lowest porosity level is associated with applying the highest energy [61].
3.2. Types of Wire Feeding
3.2.1. Lateral Wire Feeding
The lateral feeding technique is commonly used in W-LDED. However, it introduces challenges in fabricating complex components [84]. The lateral feed approach, observed in W-LDED processes, involves feeding filler material laterally at an acute angle relative to the substrate to a Gaussian laser beam, resulting in a process with directional dependency. In lateral feeding, the wire can be fed into the melt pool at different orientations relative to the deposition direction. The choice of wire feeding direction significantly impacts the quality and accuracy of the deposition. Front feeding, back feeding, and side feeding are different scenarios that have been investigated in the literature [111]. Front feeding, where the substrate is moving away from the feeding nozzle (Figure 6a), has been identified as a favorable configuration, demonstrating a high deposition rate with a smooth surface [47,112].
In the front feeding scenario, a continuous melting of the wire is observed, which is induced by laser irradiation, metallic vapor radiation, and melt pool radiation [17], creating a high-temperature melt pool (Figure 7) [113,114]. Syed et al. suggested that this leads to a favorable flow characteristic of the molten metal in the melt pool and results in a low surface roughness [115].
Side feeding, similar to front feeding, yields a smooth deposition but introduces uneven edges due to the wire reacting with the melt pool on one side, resulting in a disproportionate deposition of material on that particular side [113]. Conversely, back feeding, where the movement is towards the feeding nozzle (Figure 6b), disrupts melt pool flow, causing process fluctuations. The energy for melting during back feeding primarily comes from metallic vapor and melt pool radiation, which is insufficient for the complete melting of the wire, leading to continuous feeding of the wire into the substrate [47]. This may result in collisions with the solidified parts of the previous deposit, causing a partially melted deposition that deviates from the normal track. This eventually leads to lower dimensional accuracy and deposition rates compared to front feeding [24]. While most of the existing literature agrees upon this, Xiao et al. [116] conducted an experiment involving laser depositing aluminum and demonstrated good efficiency and stability through back feeding the wire. Therefore, it can be understood that the optimal wire feeding orientation for achieving a high-quality deposition is laser and alloy dependent. Future research endeavors should investigate this variation for different lasers and materials utilized to optimize deposition processes.
The wire’s position within the melt pool must be considered as it influences the melt pool characteristics. The wire can be positioned in the melting pool’s leading edge, center, or trailing edge (Figure 8a). In front feeding, when the wire is located at the trailing end of the melt pool, it is farther away from the laser beam. Consequently, the wire experiences less irradiation by the laser beam, which may result in insufficient melting and potential entanglement in the track [63]. Conversely, placing the wire at the front of the melt pool can help avoid this issue. Positioning the wire at the center causes reflection of the laser beam, leading to increased surface roughness compared to the leading-edge placement. As noted in several studies, front feeding with the wire at the leading edge of the melt pool demonstrates superior performance in terms of surface finish, geometry control, and overall sample quality, suggesting minimal disturbance to the melt pool in this configuration [117]. In contrast, as demonstrated by Syed et al., rear feeding achieves optimal results when the wire is at the trailing edge of the melt pool [115].
The wire feeding angle (α) is another factor impacting the quality of the deposited layer in lateral wire feeding setups, as the angle at which the wire is fed can affect the laser absorptivity. An optimal angle of approximately 45 has been identified and used in the literature as it leads to the highest deposition weight and laser absorptivity [47,113]. The influence of the wire feeding angle on surface roughness exhibits variability, with an increase observed in front feeding and a decrease in rear feeding as the angle is elevated [115].
Abioye et al. [112] supported these findings by conducting a study using stainless steel wire to investigate the impact of wire angle on the wire-laser interaction, determining 42 degrees as the optimal front feeding angle. These observations indicated that the wire exhibited rapid interaction at higher angles or failed to engage with the laser beam before reaching the substrate, resulting in partially melted wire. On the other hand, the wire tip remained in prolonged interaction with the laser beam at lower wire feed angles, causing the wire to melt before reaching the substrate [58,112]. Figure 9b demonstrates the schematics of lateral wire feeding considering various laser defocusing positions.
3.2.2. Coaxial Wire Feeding
Coaxial W-LDED represents a valuable enhancement to the existing processes, offering a directional independent method with high deposition rates and precision [72,118,119]. Unlike lateral deposition heads, the use of concentric or coaxial heads (Figure 9a) eliminates the need for table or head rotation, allowing material deposition in virtually any direction [73,89,120]. Specialized optics have been developed to shape the laser beam in a way that enables wire feeding through the center of the beam to ensure a distribution of laser radiation over the wire [121,122,123]. The coaxial approach consists of feeding the wire in the center of multiple single lasers (donut shape) or inside an annular laser beam, providing diverse options for the process [54,79,124,125].
Despite the advantages of the coaxial head, few studies have hinted at the challenges faced by using this feeding head [126]. It is stated that during the conversion of the optical path, the division and refocusing of the laser beam within the head introduce complexities by affecting the laser spot shape at varying working distances [127]. This complexity also contributes to higher sensitivity to height deviations with this head type [116,128]. Therefore, despite being directionally independent, its broader industrial adoption is hindered due to the processes’ sensitivity to disturbances [125]. In contrast with lateral wire feeding, in coaxial wire feeding, the positive defocusing of the beam cannot result in a stable process as it leads to wire melting above the substrate, which is detrimental to the process.
4. Bead Geometry
Process parameters affect bead geometry as they directly influence the thermal cycle under which the material is deposited and solidified during the process. These parameters, such as laser power, WFS, TS, and focal position, control the amount of heat input, cooling rate, and material flow dynamics [10,129]. Variations in these parameters lead to changes in the deposited bead’s shape and size (Figure 10). Therefore, careful control of process parameters is crucial to achieve a desirable bead geometry and quality, and to preserve the integrity of the deposition [130].
By increasing the laser power and the energy per unit length, there is an observed increase in bead width and a decrease in bead height. As laser power increases, the melt pool temperature increases significantly; therefore, a larger melt pool is formed due to the remelting of the substrate. Simultaneously, the solidification rate of the melt pool diminishes, causing the molten metal to flow outward before cooling [47,56,108,110].
Sheikh et al. investigated the width and height of the bead by increasing pulse duration and observed consistent results, attributed to the similar influence that increasing pulse duration has on increasing laser power [65].
With increased TS, the melt pool and the fed wire are exposed to a lower input energy density [47,131,132]. This results in a reduction in the volume of the melt pool. Therefore, an increase in TS leads to a decrease in bead height and a marginal reduction in bead width [110]. The smaller change in width than in height is attributed to the fixed laser beam size, which limits the minimum melt pool width reduction at high TS [65].
Higher WFS is linked to an elevation in bead height and a slight reduction in bead width, as Akbari et al. [56] noted when using copper-coated steel. Similarly, Huang et al. [47] confirmed the height increase with an increase in WFS in aluminum alloy. However, an increased mass of wire resulted in an augmented melt pool volume per unit length and, consequently, increased bead width [108]. Such deviations exist in the literature when utilizing various materials with increasing WFS. This might be attributed to the surface tension of the employed material. Another possibility is the variations in the assigned parameters during deposition. The difference in the deposition stability window of each material results in varying amounts of wire being fed to the process. Considering constant energy for melting the wire and the substrate, at high WFS, more energy is consumed for melting the increased fed wire, leaving less available energy for melting the substrate. Consequently, both the melt pool and the bead width decrease. On the other hand, with smaller WFS, more energy is available for melting the substrate, which enlarges the melt pool and results in wider beads [72,110,132]. Figure 11 demonstrates the schematic trends observed in the literature with increasing power, TS, and WFS.
4.1. Beads Characteristics
Several parameters have been introduced in the literature to evaluate the resulting bead shape. Bead shapes can be numerically quantified in terms of dilution, aspect ratio, and contact angle.
4.1.1. Dilution
In the W-LDED process, dilution refers to the mixing of the wire feedstock with the substrate or the previously deposited layer during the deposition process. Controlling dilution is essential for producing high-quality weld beads with the desired properties and structural integrity [125,133].
Low dilution is generally preferable as it indicates minimal mixing of the substrate with the fed wire, leading to a more stable and reliable process (Figure 12a). In contrast, high dilution can result in poor bead appearance and increased susceptibility to defects such as pores and cracks (Figure 12b) [58,89].
As demonstrated in Equation (7), dilution is calculated based on the ratio of the penetration area into the base material (i.e., ) to the total area of deposited material (i.e., + ) in the cross-section of the bead [34,54,134].
The degree of dilution is observed to have a positive correlation with laser power, melt pool temperature, and TS while having a negative correlation with WFS [39,58,109,110,126,135].
The correlation between the dilution and power was supported by Ji et al., where an increase in the focal distance decreased the dilution [100], and by Demir et al., where an increase in pulse duration resulted in higher dilution [66]. Kotar et al. observed that constant energy input during the process leads to heat accumulation and a gradual increase in dilution [85].
Research has noted that dilution can be limited to below 20–30% in W-LDED using appropriate parameter combinations [58,109].
These findings were supported by Liu et al.’s research, which indicated that high dilution resulted in a significant remelting of previously deposited layers and build rate efficiency was compromised. While low dilution is generally preferred, very low dilution leads to lack of fusion (LOF) and thus, weak bonding between the layers [136,137].
4.1.2. Aspect Ratio
Aspect ratio has been widely utilized in the context of W-LDED to characterize the geometry of the bead at the cross-section by expressing the relation between the bead width and height as expressed in Equation (8) [47,58,138].
As shown in Figure 13a, a low aspect ratio suggests that the bead is taller compared to its width, whereas a high aspect ratio indicates a flatter weld bead, meaning it is wider relative to its height [62,102,137]. In the literature, it is suggested to aim for beads with an aspect ratio higher than three to ensure the formation of defect-free beads with a favorable appearance [89,139].
Similar to the dilution degree, the aspect ratio showed a direct correlation with laser power and TS while having an inverse correlation with WFS under various conditions [39,58,125]. Demir et al. confirmed these findings using a pulsed laser and observed that increasing the pulse duration (i.e., the time during which the laser is applied) results in a very high aspect ratio [66].
4.1.3. Contact Angle
The contact angle of deposited beads is defined as the angle between the tangent line at the point of contact of the bead and the surface of the substrate and is a critical factor influencing the wetting behavior of the beads on the surface [58]. The proper control of the weld bead contact angle ensures even spreading and strong adhesion, while an improper angle can lead to defects such as LOF and porosity.
The contact angle (β) is calculated from bead height (H) and width (W) values (Equation (9)) [62,138].
Figure 14 demonstrates the schematics of beads with different contact angles. Abioye et al. recommend maintaining the contact angle below 80 degrees for favorable bead formation and good wettability. This is because beads with a contact angle higher than 80 will have a cylindrical shape on the substrate, leading to the formation of pores when adjacent beads are deposited [58].
Contact angle exhibits a negative correlation with laser power and TS while having a positive correlation with WFS [58,126]. Ding et al. studied the influence of pressure on the bead formation and observed a decrease in contact angle by decreasing the pressure to 1 Pa. This is due to the reduced vaporization temperature at lower pressure, which leads to more vapor generation and less material deposition, resulting in wider beads and lower heights. The same finding was supported by Gu et al. for SS 316 deposition in a vacuum environment [40,140].
Table 3 provides a summary of dilution, aspect ratio, and contact angle relationship with processing parameters.
In W-LDED, using parameters that result in maximum deposition rate is found to result in cylindrical bead formation on the substrate. However, having beads with a cylindrical shape leads to the formation of pores between adjacent beads in multi-bead deposition due to their high contact angle. When the deposition rate reduces, the bead shape gradually transforms into a semi-circle and further, to a parabola with an increase in the bead’s width and a decrease in its height. Semi-circle, parabola, and ellipsoidal shapes are suitable alternatives to cylindrical beads for a stable and defect-free deposition of tracks consisting of multiple beads [56,141]. This suggests that the ideal deposition geometry is identified by a process combination that maximizes the bead height while avoiding defect formations.
5. Deposition Stability Analysis
5.1. Single-Track Deposition
After establishing the optimal process parameters for depositing defect-free single beads with low dilution, low contact angle, and an appropriate aspect ratio, multiple beads should be overlapped to form a track. The way these beads overlap during single-track deposition significantly influences surface roughness and defect formation, as incorrect overlap distances can result in the appearance of gaps and cracks between adjacent beads. Four different situations emerge when choosing different overlapping distances, as can be seen in Figure 15 [65,142]. As demonstrated in Figure 15a, when the overlapping distance (d) exceeds the bead width (w), no overlap occurs, and valley areas between the beads form. When d is less than w, overlapping occurs; however, the overlap is smaller than the total valley area, and therefore, the gap between the beads is not fully filled (Figure 15b). Figure 15c demonstrates a situation in which d equals the optimal distance. This results in a flat surface, minimizing irregularities as the overlap matches the total valley area. As shown in Figure 15d, when d is less than the optimal distance, excessive overlap leads to a loss of geometric accuracy and poor surface quality with high average surface roughness. This is because the subsequent bead is partially deposited on top of the previous bead instead of beside it [143,144]. Continuous measurement enhances consistency in part quality accuracy and minimizes gap formation during deposition. The overlapping ratio has been used in the literature to achieve optimal part quality, as defined in Equation (10) [62,145,146]. Figure 16a,b demonstrates the gaps formed during multi-bead deposition due to the incorrect lateral overlap ratio.
By modifying the lateral overlap between adjacent beads, Bernauer et al. demonstrated that an optimal overlapping distance exists, at which good wettability and surface quality can be achieved [56,125]. Sheikh et al. measured the average surface roughness (Ra) [147] of layers deposited using different lateral overlap ratios and achieved an Ra lower than 8 μm for the optimum overlap ratio employing SS304 wire with a 100 diameter as depicted in Figure 17 [65]. Consistent with these findings, several studies stated that exceeding the optimal lateral overlap leads to reduced material efficiency and accuracy, whereas low lateral overlap compromises surface topography [58,148]. The range of optimum overlap ratios in different studies varies from 20% [141] to 70% [65], indicating that the selection of the appropriate overlapping distance depends on the processing parameters employed, material properties, and the diameter of the wire being used. Churruca et al. conducted experiments depositing multiple beads using an overlap ratio of 40% while varying laser power, WFS, and TS. This resulted in beads with different aspect ratios. Interestingly, despite employing the same overlap ratio, the deposition quality varied, with pores and gaps evident in the track consisting of beads with lower aspect ratios [89].
5.2. Multilayer Deposition
During single-track deposition, a limited process region is identified to achieve stable and defect-free results. Once the optimum parameter combination is determined, multiple tracks can be sequentially deposited by raising the deposition head in the Z-direction by the assigned layer thickness amount.
To better understand the height increment or layer thickness [110] in the multilayer process, the vertical overlap between successive layers should be considered due to its significant influence on the height increment suitability. The overlap ratio, as defined in Equation (11), represents the ratio of the overlap height () to the height of a single bead ), as illustrated in Figure 18a [47,62].
When assigning the overlap ratio (η) during the process, three distinct cases emerge. With an appropriate η (Figure 18a), the height and width of deposited layers remain unchanged, ensuring stable melt pool size and continuous deposition process. As shown in Figure 18b an excessively large η results in laser-induced remelting of the previous layer, causing a significantly large width with decreased height. Too small of an η (Figure 18c) leads to a gradually narrowing width of the deposited layer and an increasing height, making continuous deposition unfeasible [47,62,141].
Maintaining process stability in multilayer deposition might be challenging as more successive layers are deposited. One challenge arises from the increase in temperature within the deposition area during multilayer deposition. This can potentially result in heat accumulation in the previously deposited layers and occurs when constant laser power is employed throughout the process [57]. Another concern emerges when a poor connection forms between vertical layers [47]. This occurs when there is a mismatch between the assigned and the actual height increment, resulting in a non-consistent laser spot size [114], which leads to irregular deposition and process failure [111,125]. As observed by Akbari et al. [149], high height increment increases the risk of fusion problems and droplet generation, while low height increment will cause the wire tip to deviate from the toolpath and an un-melted wire to stick out of the deposited material. This motivates the need to correctly determine and adjust the height increment after each successive layer to ensure process stability.
Zapata et al. [110] employed a material independent calculation for height increment ( in their study, as shown in Equation (12) based on the cross-sectional area of wire ( the width of the bead and the speed ratio (i.e., the ratio of WFS to TS).
The research revealed that when the height increments were set as calculated, defect-free multilayer processes could be achieved, particularly at lower speed ratios. However, at higher speed ratios, larger deviations were observed. This was attributed to the increased volume of deposited material, which subsequently resulted in an increase in layer thickness and wider tracks over successive layers, causing more heat accumulation [33,35].
W-LDED offers the potential for depositing inclined geometries. However, the deposition of inclined walls presents significant challenges [35,127,150,151]. These challenges arise from issues such as inadequate support for overhanging structures, uneven heat distribution across inclined surfaces, and difficulties in accurately filling tight angles or curves relative to the building direction [126,127]. The gravitational forces acting on molten material during deposition can lead to the sagging or collapse of unsupported features, compromising the part’s structural integrity [152,153]. Moreover, an uneven heating of inclined surfaces can result in surface irregularities [153]. Few studies have investigated this aspect in lateral wire feeding systems. Shaikh et al. [65] successfully fabricated an inclined wall deposited at an angle of 73° with respect to the substrate, while Demir et al. conducted experiments depositing multiple inclined surfaces ranging from 46° to 69° relative to the building direction and achieved high-quality geometries (Figure 19) [66]. Akbari et al. demonstrated deposition at an angle of 55° with respect to the substrate, mentioning that fabrication at lower angles was possible; however, further experiments have not been conducted [51]. Current literature does not offer any studies regarding coaxial W-LDED deposition at inclined angles and the associated issues related to maximum possible overhangs.
6. Deposition Quality
The defects present in W-LDED can be classified into internal and external defects. Employing wire feedstock in conjunction with a laser beam results in the formation of unique defects, i.e., external defects, which are attributed to the continuous mechanical connection that the wire establishes between the deposited part and the deposition head. Understanding these defects is crucial as they can severely impact the overall process stability and prevent further deposition. Once stable deposition is achieved, the emergence and the cause effects of internal defects can be investigated. Motta et al. used the term “deposition with defects” to describe these types of deposition where no external defects were present, yet the deposition consisted of internal defects [57].
6.1. External Defects
External defects such as stubbing and dripping are visible during the process and pose significant challenges. Once they are formed, these defects are detrimental to process stability and result in a high surface roughness onto which further deposition is not possible [56,57,110]. These defects contrast with the desirable condition of “stable deposition”, where beads lack such issues. Defect-free deposition is known to be the result of successful liquid bridge transfer, i.e., a stable molten metal transfer from the wire tip to the melt pool [93,154,155,156].
Dripping occurs when excessive heat input melts the wire above the substrate before it has reached the melt pool [112]. Consequently, the link between the wire tip and the melt pool breaks, forming a droplet at the wire end due to the minimization of surface energy [57,84]. The surface tension between the droplet and the wire tip is much higher than the gravitational force on the droplet, which prevents the droplet from detaching from the wire tip [114,157,158]. This droplet grows and eventually drops down by gravitational force, causing an unstable deposition of the material, and dripping occurs. Figure 20a shows the starting moment of the dripping formation. Figure 20c indicates a rough single track deposited with wire dripping [56,97,149].
Dripping occurs with high laser power, inadequate focal offset (i.e., high offset), or a combination of insufficient WFS and TS. To address this issue, the WFS and TS can be increased to an optimal value until there is sufficient material deposited and a smooth deposition is achieved [57,84,95,128,150,159,160].
Stubbing occurs due to insufficient heat input, causing unmolten wire pieces to stick to the deposited part [51,57,149]. Relatively low laser power in correlation with high WFS, TS, and low focal offset can both lead to stubbing. Stubbing can be avoided by carefully increasing the laser power, decreasing WFS as well as adjusting the focal offset [95]. Figure 20b–d indicates the starting point of stubbing formation and its presence in layer deposition, respectively.
Abranovic et al. introduced another type of external defect, namely melt pool oscillation, which results in the fabrication of tracks characterized by ripples and rough surfaces as shown in Figure 21 [161]. Melt pool oscillation refers to a phenomenon in which the size of the melt pool fluctuates regularly, evident by a flickering appearance. This occurs due to the rapid evaporation of material from the surface of the molten metal when exposed to a high-power laser beam [162]. In line with this observation, increased ripple formation on the deposited track was noted with higher laser power, leading to an increase in surface roughness [65]. Ripple formation is less detrimental to the fabrication process compared to other external defects at small scales. However, in severe cases, consecutive layers cannot be deposited on a track with a very rough surface.
Figure 22 depicts a schematic of the process feasibility map, illustrating the possible regions for the formation of different defects and stable deposition. The diagonal lines indicate constant linear energy densities. Moving over these lines, it can be observed that the process stability changes, emphasizing the importance of selecting appropriate laser power and TS.
6.2. Internal Defects
Like in any other AM process, defects such as pores and cracks might be present in W-LDED. The three types of porosity presented in AM-produced parts are gas pores, LOF, and keyhole pores. Gas pores display a spherical morphology and have diverse origins, including solubility differences, moisture reaction, and hydrogen precipitation during solidification [70,163,164]. Factors like insufficient vapor escape time, feedstock, or substrate contamination, as well as trapped shielding gas, can also lead to gas pore formation. LOF exhibit irregular shapes and can often be found in the overlap areas between adjacent deposition tracks [165,166]. Unoptimized process parameters, such as inadequate power, high TS, and WFS, can contribute to the formation of LOF defects. On the other hand, in keyhole porosity, excessive energy input triggers keyhole mode, resulting in large, irregularly shaped pores [167]. This leads to the evaporation of the material in the middle of the melt pool; the top of the melt pool is then enclosed by recoil pressure, resulting in entrapped gas within the melt pool center [168].
Cracking, a common issue in AM processing includes solidification cracks initiated during insufficient melt and liquation cracks caused by reheating and stress on previously solidified layers [169]. The use of high energy density during laser processing results in an elevated temperature gradient, which intensifies the crack formation in the produced parts due to increased residual stress [170]. This is supported by Churruca et al.’s study on Stainless Steel 316L and Wang et al.’s research on Al alloy. The crack formation was observed due to high thermal stress when employing high laser power at high TS [61,63,89]. Figure 23b illustrates an example of crack formation in a single bead due to an improper selection of laser power.
Using wire feedstock instead of powder minimizes the formation of gas-trapped pores, and their formation is mostly observed in materials that readily oxidize (e.g., aluminum alloys) [47,61,63,171,172,173]. The most predominant type of pore observed in W-LDED is due to the gap formed between adjacent beads when employing an incorrect lateral or vertical overlap ratio attributed to the bead’s aspect ratio, as explained in Section 5.2.
Compared to other AM methods, the beams utilized for the W-LDED process have relatively large spot sizes due to the wire diameter range. Therefore, the keyhole formation is minimized. As noted by Motta et al. [57], in a stable deposition, the size of the melt pool is two/three times the wire diameter without significant change throughout the process. This results in a complete melting of the fed wire, minimizing the LOF defects once an appropriate power is selected. This is supported by Mamphekgo et al. using SS 309. As depicted in Figure 24, LOF defects were detected in their experiment between layers, and were resolved by increasing the laser power [59].
7. Deposition Characteristics
7.1. Shielding Gas
W-LDED, like most AM methods, requires an inert environment to minimize in-process oxidization, a significant challenge that can impact the properties of the produced sample. Argon, helium, and nitrogen are mainly used as shielding gas in MAM processes. Argon is predominantly used in the literature for W-LDED due to its ability to withstand external disturbances effectively, minimize atmospheric gas diffusion, and provide economic advantages.
Two types of gas shielding systems—central and local—have been employed in the literature. Conventional LDED heads typically feature central shielding gas feed mechanisms, i.e., filling the entire fabrication chamber with inert gas. However, central shielding can be costly and has disadvantages, including limitations on the possible size of fabricated parts due to the chamber size [174,175]. This method is known to cause turbulence in the gas stream, resulting in a higher and problematic intake of oxygen [54].
A further reduction of oxidation can be obtained by implementing local shielding only in the fabrication area [101]. The latter approach, as developed and evaluated by Bernuar et al. for coaxial W-LDED, offers benefits regarding gas usage, equipment complexity, and setup duration [174]. Their study examined the effects of shielding gas flow rate on bead geometry and the temperature of the melt pool. Results showed that an increased gas flow rate leads to a decrease in melt pool temperature and results in smaller beads. This is due to the cooling effect of the shielding gas. Beads produced with local shielding exhibited a brighter surface, indicative of reduced oxygen presence, as discoloration serves as an indicator of residual oxygen. Additionally, as illustrated in Figure 25, an increased flow rate was found to decrease ripples in the bead [176], which is attributed to a higher cooling rate resulting from convection in increased shielding gas flow [174,177].
7.2. Scanning Strategy
The deposition path plays a critical role in wire-based deposition, influencing the appearance of deformation and defects during the deposition. Kelbassa et al. compared two fabrication processes based on unidirectional and bidirectional scanning strategies [178]. The unidirectional strategy (Figure 26a), featuring multiple starting and end points per layer, results in excessive material buildup at the starting points and a lack of material at the ending points as observed in the experiment conducted by Ding et al. (Figure 27) [150]. In contrast, the bidirectional strategy (Figure 26b), with only one starting and one end point per layer, provides more uniform deposition and minimizes anomalies in solid structures [179]. Similar findings were observed in other research, emphasizing that bidirectional paths with a 90° rotating orientation after each layer facilitate more uniform growth and minimize defects compared to the unidirectional strategy [89,180,181,182]. Nickel et al. noted that unidirectional deposition led to distortion, while two-dimensional strategies minimized distortions due to a more uniform heat flow [183]. Singh et al. suggested depositing the initial line on the periphery of the profile and implementing a bidirectional path with 45° scanning patterns and a 90° orientation change in successive layers to prevent excessive material outflow at the edges, thereby improving dimensional accuracy [184]. Pujana et al. employed the same strategy, which successfully fabricated 3D geometries [89].
Gao et al. introduced the wiggle deposition pattern, which involves a 90° turn every few millimeters during scanning to balance deposition in scanning and transverse directions, as shown in Figure 26c. This approach ensures a transverse deposition displacement slightly shorter than the melt pool width, leading to a dynamic melt pool flow due to the oscillation of thermal gradient. This is found to result in a more stable melt pool due to a more symmetric laser absorption [118].
Cai et al. conducted novel research investigating W-LDED deposition with an oscillating laser beam and compared the results with non-oscillating laser deposition. It was observed that the energy distribution shifts from a Gaussian to a broader pattern with oscillation, resulting in decreased peak energy density and promoting molt pool spreading. This led to a significant enhancement in the surface quality and uniformity of the deposited layer [185].
7.3. Heating the Substrate
In W-LDED, irregularities in the initial layer deposition can arise from the temperature of the substrate. When the substrate is cold, the quality of the first deposition may suffer due to rapid cooling, leading to heat-sink effects that cause irregularities like cracks or porosities in the bead [186]. To address this issue, Akbari et al. emphasized the importance of preheating the substrate to slow down the cooling rate during the initial layer deposition [56]. Several studies have shown that preheating the substrate results in a more uniform heat distribution within both the substrate and the deposited bead. It reduces the possibility of defect formation while promoting dense bead formation by limiting thermal gradients and allowing sufficient time for trapped gas to release from the melt pool [187]. The literature indicates that depositions on preheated substrates consistently yield uniform bead shapes and minimize bonding defects, such as LOF. Moreover, Froend et al. observed that increasing the preheating temperature does not compromise the surface quality of the deposited layers but may slightly enlarge the bead [62,83]. The improved bead quality associated with preheated substrate temperatures is attributed to enhanced fusion, as less energy is needed for melting. However, in the absence of preheating, reducing parameters such as TS or deposition rate may be necessary to achieve a defect-free deposition, which is contrary to the primary advantage of W-LDED, which favors high deposition rates. Techniques like induction heating can be employed to attain the required substrate temperature for optimal deposition conditions [24,149,188].
7.4. Wire Feeding Temperature
The integration of the hot-wire technique for preheating the wire feedstock is a key strategy to increase the deposition rate of W-LDED, leading to increased productivity [34,151,189]. In this method, the wire is preheated to a temperature slightly below its melting point through an electrical current prior to being exposed to laser radiation. The laser power is then utilized to form a fusion layer on the substrate, facilitating the bonding of the filler material. This allows for lower energy input, thereby enabling higher TS, deposition rates and ultimately reducing the overall equipment costs [34,190]. It should be noted that the preheating voltage and current should be optimized for the process to achieve the mentioned benefits [54,190].
This is confirmed by Lui et al. as they redefined the linear energy density (Equation (1)) for heated wire as shown in the following equation. In Equation (13) represents the laser power (W) and is the power for preheating the wire (W). According to the presented equation, the laser power necessary for sufficient melting at a given TS can be reduced [191,192].
Liu et al. further investigated the impact of increasing linear energy density ( on the bead’s penetration depth into the substrate, employing both cold and hot wire techniques and an increase in penetration depth was observed for both cases. The study revealed that, at a consistent linear energy density, the hot wire exhibited greater penetration into the substrate compared to the cold wire, attributed to fusion enhancement as can be seen in Figure 28 [192].
Moreover, Bambach et al. compared the bead penetration into the substrate using both cold and hot wires, keeping the laser power constant, and noted a significant penetration reduction in the case of hot wire DED. This is because the cold wire process requires a lower TS at the available laser power, creating a deeper melt pool as can be observed in Figure 29 [54].
In an experiment by Kisielewicz et al., varying levels of preheated wires were studied. The findings revealed that increasing resistive pre-heating improved fusion, consequently enhancing penetration depth. Notably, this approach avoided the typical side effects of increased laser power, such as bead geometrical inconsistency. The research suggests that adjusting preheating levels can be an effective strategy to optimize fusion and penetration without the drawbacks associated with solely increasing laser power [34].
The wire-resistant current, a crucial factor influencing wire melting and feeding, is addressed by Zhu et al. It is observed that when the current is too low, i.e., when the wire tip temperature is below the melting temperature, the hot-wire tip sticks on the surface frequently (Figure 30a). On the other hand, when the wire current is too high, fusing and spattering occurs because the hot-wire temperature reaches its melting point before contacting the substrate (Figure 30c) [108]. Huang et al. conducted an experiment studying the melting behavior of pre-heated aluminum alloy wire using resistance heating. The authors proposed a calculation method presented in Equation (14) to derive the appropriate hot-wire current based on the WFS and wire diameter and reported good agreement between the calculated wire current from the suggested method and the experimental results [193]. In the following equation, I is the heating current, t is the heating time, R is the heating resistance, is the specific heat of solid wire, ρs is the solid wire density, D is the wire diameter, is the desired wire preheating temperature, and is the room temperature.
Liu et al. reported the same instabilities as Zhu et al. [108] in preheating with different voltages by noting that at a high voltage, arcing occurred, and large spatters were generated [191,192]. They also compared the influence of increasing laser power and preheating voltage on the process stability and geometrical appearance of the beads. It was proposed that an increase in laser power influenced the stability of the deposition, however, its effect is not as pronounced as the voltage. On the other hand, the laser power had a more significant effect on the geometry of the bead compared to the applied voltage. This finding aligns with the results suggested by Kisielewicz et al. [34] and Su et al. [194].
7.5. Building Strategy
During continuous multilayer deposition with constant processing parameters, the temperature of the deposition area rises, resulting in heat accumulation in the deposited layers. The heat accumulation becomes apparent through observable changes in color, resulting from thermal radiation at high temperatures. This leads to defect formation and reduces dimensional accuracy due to an unstable thermal load [35,57,63,125,195]. Various strategies have been studied to resolve heat accumulation and reduce defect formation, such as power decay and interlayer cooling [63,125,196]. Motta et al. tested both continuous and discontinuous strategies to identify process stability over consecutive layers and reduced heat accumulation. It was observed that the process employing a continuous strategy became unstable after some layers due to heat accumulation resulting in dripping. The power decay strategy i.e., gradually decreasing power after each layer (Figure 31b), helped avoid defect formation by maintaining a stable thermal load [57]. This result was confirmed by Abioye et al. and Silva et al., who observed flattened layers with constant laser power due to excessive heating, which is detrimental to process stability [64,112].
Wang et al. investigated two types of discontinuous building strategies by applying both power decay and interlayer cooling (Figure 31c) during the multilayer deposition of Al alloy [61]. In the former, laser power was decreased with increasing layer number. In the latter strategy, the last deposited layer was cooled before the deposition of the next layer and the laser power was kept constant. The power decay experiment eventually led to heat accumulation after consecutive layers and gas pores increased with no detected cracks or LOF. However, the authors applied a small power reduction of 50 W per layer which could have been attributed to the emergence of heat accumulation.
Compared to the power decay strategy, Wang et al. achieved lower porosity by reducing temperature and heat accumulation using the interlayer cooling strategy through consistent melting and solidification conditions. However, the amount of gas pores increased as the deposition of consecutive layers continued, and cracks were observed along the building direction, which indicates the change in heat transfer behavior when layers are being deposited on cooled layers [61,63].
Table 4 summarizes various W-LDED experiments, including the wire material and size utilized, substrate material, employed laser type, laser characteristic (continuous or pulsed), type of machine used, and the shielding gas employed.
8. Monitoring and Control
The W-LDED deposition process presents significant challenges due to its tendency to deviate from stable deposition (i.e., no dripping or stubbing) when encountering disturbances. Identifying the main cause of process failures can be challenging with numerous variables involved, particularly when failures result from multiple factors. Therefore, it is essential to implement real-time monitoring and control to maintain a stable process with a high deposition rate. Monitoring and controlling ensure deposition quality and efficiency in W-LDED by detecting sources of disturbance. Therefore, the processing parameters can be optimized in order to achieve stable deposition while preventing material waste [35,107,127,201,202].
The deposition is monitored to collect data on aspects such as bead geometry, bead height, melt pool temperature, and geometry to achieve process stability. Based on the analysis of this data, decisions are made to compensate for any deviations from the target set point. The controller thereafter adjusts the recognized problem accordingly by modifying related parameters to enhance the part’s final quality [34,46,203,204].
Different types of monitoring systems have been introduced in research, such as high-speed and infrared cameras, pyrometers, and thermocouples. Depending on their operating principles, these systems can be positioned in direct or indirect contact with the deposition area. Some of these monitoring systems, such as cameras and pyrometers, can be mounted off-axis or coaxially relative to the deposition head. By positioning the monitoring system coaxially, measurements can be acquired independent of the deposition direction. This setup allows for the monitoring of various parameters such as the temperature, size, and shape of the melt pool, as well as the width of the bead. On the other hand, an off-axis camera placement enables the capture of geometrical data on bead height, total height of the part, temperature, or the position of the head relative to the part. Implementing multiple monitoring modules at different angles helps mitigate the dependency of measurements on deposition direction [127,144,157,205,206,207,208,209,210,211,212]. Moreover, Iravani et al. [205] highlighted the complexity introduced by the requirement for camera calibration, which may vary with different deposition parameters or materials. To address this complexity, alternative temperature and height monitoring sensors have been suggested.
Figure 32a illustrates the schematics of a monitoring system. Figure 32b,c show the height and the width of the deposited bead captured by integrated cameras.
Thermocouples, pyrometers, and infrared (IR) cameras are used to monitor the melt pool’s temperature during the processes. Thermocouples are often in direct contact with the build plate, enabling temperature measurements [122,214]. Alternatively, both pyrometers and IR cameras can be integrated into the processing head, allowing for unrestricted movement and directional independent data acquisition [85]. However, using these sensors for applications with high emissivity poses challenges to data collection [83,135,206].
Various monitoring systems employ methods such as structured light projection or laser triangulation to measure the deposition’s height. However, real-time measurement using these techniques poses challenges due to its dependency on the deposition direction. Consequently, measurements are typically conducted after the deposition of each layer is complete [127,215]. Various types of cameras, such as CCD (charge-coupled device), IR cameras, and CMOS (complementary metal oxide semiconductor), have been employed in research. Utilizing these monitoring systems allows for in-process monitoring; however, the brightness of the deposition area makes it difficult for the camera to accurately monitor the process [208,215,216]. A novel and promising approach is using optical coherence tomography (OCT) for real-time height measurements [217,218,219]. The OCT system, which consists of a bright laser spot for illumination, a spectrometer, and an interferometer to detect interference, measures the deposition height by calculating the offset between the reference height and the melt pool distance [35]. OCT does not suffer from the limitation of the formerly introduced method and therefore it is preferred over in-process cameras.
Open-loop and closed-loop controllers can be implemented in the system. In open-loop control, the control system does not receive feedback from the process output to adjust the control inputs; instead, it relies solely on predefined control signals based on the desired setpoints. Therefore, it is typically used in well-understood and relatively stable processes [220]. Gibson et al. noted the capability of open-loop controllers to modify process parameters in preprogrammed W-LDED operations [221]. The research suggests that certain operations require specific in-process adjustments at targeted setpoints, making open-loop control less suitable for such applications.
On the other hand, in closed-loop control, the controller continuously receives feedback from sensors monitoring the process. This feedback is compared to the desired setpoints, and corrective actions are taken to minimize the error between the actual and desired outputs. Closed-loop control is more robust and adaptable than open-loop control, as it can dynamically adjust control inputs in response to disturbances in the process. Therefore, it is commonly used in W-LDED to maintain process stability. Various controllers such as PI (Proportional-Integral), PLC (Programmable Logic Controller), MPC (Model Predictive Control), and ILC (Iterative Learning Control) have been utilized in research to implement closed-loop control strategies in W-LDED processes [128,135,174,213,222,223].
The simultaneous adjustment of various process parameters is necessary to address all disturbances present in a complex process like W-LDED. It is important to recognize that due to the interdependence of the parameters, implementing multiple controllers to address individual issues may not yield effective control [224]. An investigation of the literature reveals that research on in-process multivariable control in W-LDED still requires further development.
The pioneering research by Heralic et al. introduces various control systems to the W-LDED process. The authors characterize the process as repetitive, leading them to employ an ILC system to improve deposition accuracy. A 3D scanning system is utilized to monitor the process disturbances. The effectiveness of the ILC controller is demonstrated, resulting in defect-free surfaces through adjustments of the WFS or focal position of the laser head to correct inaccurate layer heights [97,111]. Previous research by the same authors investigated the effects of varying laser power and WFS. The geometry of the layers was observed using cameras for melt pool imaging and width calculation, while a laser line scanner tracked the height of the previous layers. It was found that the melt pool width can be controlled by a PI controller and by adjusting the WFS. Meanwhile, the layer height can be adjusted using a feed-forward compensator and changing the laser power [107,213].
To monitor and control the height of the deposited layer, Garmendia et al. utilized a laser scanner capable of distance calculation through laser triangulation. Employing this system in a closed-loop process, they corrected the layer height by adjusting the WFS [144]. Additionally, Hagqvist et al. investigated implementing the same setup for height measurement, where defects in layer height were compensated by adjusting the focal position of the beam. Both techniques effectively prevented defect formation (Figure 33) [97,144]. Similarly, Takushima et al. employed a laser line scanner to measure the height of the bead in real time, where the control system could adjust the WFS to maintain a desirable bead height [98].
Becker et al. employed an OCT sensor in the deposition head and tracked the bead height using a closed-loop controller. A PI controller adjusted the WFS in response; therefore, the resulting part was closer to the desired geometry with a more uniform layer structure. The authors also emphasized the limited need for post processing due to the enhanced surface quality of the part [35].
Mbodj et al. designed a control system using an MPC controller capable of considering various material properties and process parameters. Using this system, the layer height was continuously monitored, and a constant height was maintained by controlling the temperature input [222].
Gibson et al. investigated three distinct control modes utilizing thermal cameras to monitor melt pool size by adjusting laser power and deposition rate. The first mode employed closed-loop control for melt pool size by modifying laser power, focusing on the real-time control of the geometry of the bead (Figure 34). The second mode introduced a controller that modified the deposition rate and TS per layer to independently control average laser power and therefore the melt pool size. Lastly, a third controller integrated the previous modes by regulating power for the real-time control of the melt pool size while adjusting deposition rate and TS per layer to control average laser power. Results indicated that the first mode facilitated both intralayer and interlayer control, the second mode enhanced geometric accuracy, and the third mode reduced printing time while maintaining print quality comparable to the first mode [203,221].
Beranuer et al. utilized an in-axis pyrometer paired with a PI controller to ensure the melt pool temperature remains within a desired range. This coaxial monitoring system facilitated temperature measurement without accessibility constraints, allowing the controller to address observed deviations by adjusting the power. The implemented system led to a decreased probability of defect formation and minimized the need for multiple trial-and-error-based adjustments in the deposition process, consequently reducing both fabrication time and cost [125].
Consistent with this approach, the authors applied the same concept replacing the controlling module with a PLC controller. Using this system, they established an initial temperature range under various process conditions to achieve stable deposition. The relationships between melt pool temperature, resulting geometry, and material properties were analyzed for beads. It was observed that melt pool temperature directly correlates with the bead’s width and dilution. Consequently, melt pool temperature was monitored as an input parameter to a pyrometry-based closed-loop control system, and it was controlled through laser power modification [128,135].
Additionally, the authors introduced a concept for a multivariable process control system, utilizing an IR camera for measuring melt pool temperature and OCT for bead height tracking while controlling parameters such as WFS and laser power. However, an experimental validation of this proposed framework is still pending [135,225].
Kotar et al. investigated the influence of laser power and WFS on the melt pool temperature using a coaxially mounted pyrometer in a machine equipped with an annular laser beam. The temperature of the melt pool was controlled by adjusting these parameters based on their observed correlations [85].
Similar to this study, Motta et al. employed an off-axis camera as well as a laser scanner to observe the laser power distribution on the working plane and the resulting melt pool. The distance between the laser head and the deposition plane was adjusted accordingly to avoid process failures such as stubbing and dripping [57].
Baghdadchi et al. and Kisielewicz et al. utilized wire resistive pre-heating to increase the deposition rate. By employing cameras alongside voltage/current measurement circuits the authors monitored the deposition process. Real-time monitoring of the current/voltage and the resultant link between the melt pool and the wire tip was conducted. A PLC controller was used to adjust the preheating current/voltage accordingly to ensure consistent liquid bridge transfer (Figure 35a). This method yielded a stable molten metal transfer resulting in a high-quality deposition [34,190,226].
Table 5 presents a compilation of W-LDED research involving monitoring and control systems. Each entry in the table includes details such as the type and location of specific monitoring systems, the controller used, the manipulated variable, and the aspects controlled with the system’s assistance.
9. Modeling and Predicting W-LDED Process
Process prediction models have been widely investigated in the literature to advance the complex multi-physics W-LDED process by enabling operators to simulate parameter adjustment and predict the resultant outputs. Prediction models expedite the development of W-LDED processes, promote a deeper understanding of the physics, and enhance process stability and productivity in applications. These models are typically validated against experimental data to demonstrate their accuracy and ultimately reduce time, costs, and waste associated with experimentation.
The literature discusses various techniques, including numerical, analytical, empirical, and machine learning (ML) approaches, to develop physics-based models of W-LDED. Numerical methods, including finite element analysis (FEA) and computational fluid dynamics (CFD), have been extensively employed to investigate the underlying physics of the process. By minimizing assumptions, numerical methods generate more realistic models, offering insight into the temperature distribution, bead and melt pool geometry as a function of time. However, the complexity of highly dynamic processes such as W-LDED poses challenges in modeling due to the substantial computational resources and time required [40,50,93,146,227,228,229].
Analytical models have also attracted attention for predicting the W-LDED process, aiming to lower the overall expenses. These models rely heavily on assumptions rather than numerical methods [125,193,230,231,232].
As a relatively new approach, ML is gaining popularity in W-LDED. This method optimizes the deposition process by predicting the influence of various processing parameters on deposition geometry and quality [173,180]. By adapting accurate databases, ML enhances process stability and accuracy, resulting in defect-free and efficient deposition. Empirical models, which rely on experimental data rather than theoretical principles, often serve as databases for training ML models to identify and learn patterns and relationships within the data. However, the limited availability of training data and its lack of connection to the physics of the process can make adapting ML with reasonable accuracy challenging. To date, research exploring this method in W-LDED is limited, potentially due to the complexity mentioned earlier [233,234,235,236,237,238]. The available research on the mentioned modeling methods (i.e., numerical, analytical, and ML approaches) is described in the following sections.
9.1. Numerical Modeling
Nie et al. established an FEA-based thermal model for W-LDED to model the deposition process when preheated wire is employed. The model accurately predicted the temperature profile of the deposition area and melt pool temperature as illustrated in Figure 36. The model indicated periodic temperature changes during multilayer deposition and mapped the process stability window. The model was validated against data obtained from four thermocouples integrated into the build plate [214].
In a recent study, Ai et al. conducted an analysis of molten metal behavior and layer formation processes in W-LDED using 316L stainless steel wire. The investigation focused on the temperature and flow fields within the melt pool. The findings revealed a periodic transport of molten metal into the pool, forming droplets along the 316L stainless steel wire. Subsequently, gradual solidification occurred, resulting in layers with rippled surfaces. The results were validated and demonstrated good agreement with experimental findings [239].
Hu et al. proposed a numerical simulation to analyze the melt pool dynamics at different regions during the liquid bridge transfer mode. Utilizing the model’s quantitative characterization, it was observed that the conduction mode is the main form of heat transfer in the front and trailing part of the melt pool, whereas convection is dominant in the center of the melt pool. The model accurately predicted the bead and the melt pool geometry and confirmed that the most favorable deposition quality could be achieved with a uniform liquid bridge transfer mode, as opposed to a non-uniform or breaking bridge [93].
Wei et al. conducted a simulation in ANSYS to explore the complex multi-phase dynamics of W-LDED utilizing a hot wire. Surface tension and capillary forces were considered to analyze temperature distribution across gas–liquid–solid interfaces during deposition. The simulation accurately represented the geometries of both the melt pool and the deposited layer, exhibiting good agreement with experimental data, as shown in Figure 37 [154].
Zapata et al. applied an FEA model to simulate an annular laser beam implemented within a coaxial head. The model predicted the resultant temperature field and the melt pool shape for single and multilayer processes. The model’s accuracy was confirmed through validation against thermocouples employed during deposition [122].
Lee et al. explored the impact of interlayer cooling time and tool path strategy on part distortion in Ti-6Al-4V components fabricated by W-LDED. Utilizing an FEA model, they conducted simulations validated against experimental data, including temperature and distortion measurements. Their findings indicated that minimizing interlayer cooling time and employing a bidirectional tool path with 180° rotation reduced part distortion and achieved a symmetric stress distribution [196].
Using an FEA model, Chua et al. investigated the effect of unidirectional and bidirectional scanning strategies on the temperature distribution of multilayer deposition. The model suggested that in layers deposited using a bidirectional pattern, the temperature at the middle of the layer is slightly lower than those deposited using a unidirectional pattern. This is explained by the fact that the bidirectional pattern allows one side of the layer to cool for a longer duration before the laser beam returns to irradiate the same area for subsequent layer deposition [240].
Similar to this study, Gao et al. utilized Flow 3D to examine and compare the thermal conditions associated with bidirectional and wiggle deposition patterns. The simulation revealed that in the case of wiggle deposition, the laser absorption is more symmetrical compared to the former strategy, resulting in a more dynamic flow within the melt pool [73,118].
Recognizing the significance of the laser focal point size and its position relative to the deposition track, Ji et al. employed an FEA model to compute the bead and melt pool geometry. Additionally, the temperature profile during deposition was predicted to determine the optimal focal distance. The model accurately depicted melt pool temperature variations with varying focal positions. The predicted temperature was validated against the experimental results obtained from the IR pyrometer [100].
Elaborating on the effect of the laser beam on the deposition process, Goffin et al. explored the influence of laser beam shape on the efficiency of the W-LDED process using a simulation model implemented in the COMSOL Multiphysics model. The results unveiled the significant impact of beam geometry and spot size on the substrate temperature by utilizing Gaussian and pedestal beams. The simulations illustrated that larger beam sizes were more effective in achieving desirable heat distributions compared to smaller sizes. Furthermore, the pedestal beam was observed to heat the substrate more efficiently than a Gaussian beam with similar width [87].
Gu et al. employed a CFD model to study the effect of a vacuum atmosphere on bead formation. The simulation results indicated that reducing pressure decreased the deposition rate and led to beads with high aspect ratios and low contact angles. To compensate for this effect, the model suggested using lower laser power or higher TS [40].
A simulation for the continuous wire feeding process was developed by Guo et al. to model the heat transfer and geometric morphology of multilayer deposition under various overlap ratios, determining the optimal overlap ratio as evident in Figure 38. This model enhanced the geometric shape of the deposited layers and prevented defects in multilayer deposition [146].
9.2. Analytical Modeling
Huang et al. used an analytical model to predict the geometrical properties of deposited Al alloy based on process parameters such as laser power, TS, and WFS. It is claimed that the model can predict the geometry by knowing the processing parameters and vice-versa. Using the established model, the authors found that the highest deposition rate could be achieved with a lateral wire feeding angle of 45 degrees [47]. The authors established another analytical model to calculate the required temperature for preheating the wire based on the wire tip temperature to avoid the occurrence of dripping. The model revealed that maintaining a stable melting depends on regulating the wire tip temperature through the WFS and preheating current at specific laser power levels [193].
Zapata et al. developed an analytical model to investigate the effect of processing parameters on assigning the layer height in a multilayer deposition. It was observed that with the help of the model, layers without dripping and stubbing could be achieved [110].
Li et al. utilized analytical modeling to predict the geometry of the bead, melt pool, and its penetration into the substrate. The model demonstrated high accuracy, particularly when high laser power, high TS, and low WFS were employed [117]. The authors also developed a model capable of predicting the shape of deposited tracks on inclined surfaces, which can be a valuable tool for repair applications [129].
9.3. ML Modeling
An ML prediction method was introduced by Mbodj et al. to improve the deposition quality of single-layer geometry. The authors used a neural network model to study the impact of processing parameters on bead geometry. The model was validated with experimental data and indicated an acceptable error, suggesting the potential for high-quality deposition [180].
Yang et al. employed the random forest ML algorithm on a limited dataset to predict melt pool geometry based on assigned processing parameters, aiming for defect-free deposition. The results indicate the random forest model performs reasonably well in predicting melt pool dimensions, albeit within a constrained region of the stability window due to the limited availability of experimental data [228].
Liu et al. introduced an ML model for predicting and visualizing bead geometry. This tool facilitated the authors in filtering out process parameters leading to defective deposition, while also aiding in understanding the relationships between the resulting geometry and different process combinations to improve process quality [137,241].
Table 6 presents a summary of the W-LDED literature that utilized modeling and predictive approaches. The table showcases the modeling approach employed (i.e., numerical, analytical, or ML) and the software used (if applicable). Additionally, the table provides details on the process inputs and predicted outputs and the materials employed in the studies.
10. Conclusions
In conclusion, the study of W-LDED is critical in AM for providing powder-free deposition and high deposition rates. The comprehensive review of the state-of-the-art in W-LDED has outlined critical factors influencing process stability, ranging from energy input, laser characteristics, wire feeding techniques, bead, and deposition characteristics, to monitoring, control, and modeling techniques. Therefore, understanding the influence of these variables is necessary for achieving an efficient and high-quality deposition.
Various monitoring and control systems have been identified as integral components for ensuring stable and defect-free depositions. These systems enable real-time data analysis to detect emerging anomalies during the deposition process and apply necessary adjustments, thereby contributing to the continuous improvement of the process. Additionally, the implementation of prediction models, including numerical, analytical, empirical, and ML methods, offers promising paths for enhancing the predictive capabilities of the W-LDED process, leading to process optimization.
Despite recent advancements, significant gaps remain in the literature, particularly in optimizing laser selection for different materials considering their unique properties. Moreover, limited studies are available addressing the specific geometrical challenges associated with fabricating complex geometries such as parts with inclined surfaces. Additionally, there has not been much research on multi-material deposition, highlighting a notable gap in the literature. Addressing the challenges inherent in the multi-material deposition process using W-LDED, such as ensuring proper material compatibility and deposition quality across different materials, represents a critical area for future research efforts.
While modeling techniques have advanced, there remains a gap in comprehensive models that account for complex phenomena such as material flow dynamics and phase transformations. Future efforts should focus on developing more accurate and predictive models to better simulate W-LDED processes and processing parameter optimization. Furthermore, there is a significant gap in integrating ML algorithms to enhance process control. Future research should explore the development of ML-based approaches for predicting optimal process parameters and adjusting process variables in real-time to improve deposition quality and efficiency. Integrating multiple control modules to address interconnected process disturbances could enhance deposition quality and efficiency, particularly in complex geometries and multi-material deposition scenarios. Therefore, there is a compelling need for comprehensive studies on multivariable control strategies tailored to the unique requirements of W-LDED processes.
Addressing these challenges presents an opportunity to uncover new paths for innovation and advancement in the field, thereby enhancing the capabilities and applications of W-LDED in AM.
Author Contributions
N.G.: original draft preparation, formal analysis and data curation; S.P.: conceptualization, supervision, funding acquisition, writing review and editing. All authors have read and agreed to the published version of the manuscript.
Funding
This research was funded by the US National Science Foundation (NSF), grant number 2338253 (NSF CAREER).
Conflicts of Interest
The authors declare no conflicts of interest.
References
- Taminger, K.M.; Domack, C.S. Challenges in Metal Additive Manufacturing for Large-Scale Aerospace Applications; Springer: Cham, Switzerland, 2020; pp. 105–124. [Google Scholar] [CrossRef]
- Kawalkar, R.; Dubey, H.K.; Lokhande, S.P. A Review for Advancements in Standardization for Additive Manufacturing. Mater. Today Proc. 2022, 50, 1983–1990. [Google Scholar] [CrossRef]
- Kladovasilakis, N.; Charalampous, P.; Kostavelis, I.; Tzetzis, D.; Tzovaras, D. Impact of Metal Additive Manufacturing Parameters on the Powder Bed Fusion and Direct Energy Deposition Processes: A Comprehensive Review. Prog. Addit. Manuf. 2021, 6, 349–365. [Google Scholar] [CrossRef]
- Wang, D.; Liu, L.; Deng, G.; Deng, C.; Bai, Y.; Yang, Y.; Wu, W.; Chen, J.; Liu, Y.; Wang, Y.; et al. Recent Progress on Additive Manufacturing of Multi-Material Structures with Laser Powder Bed Fusion. Virtual Phys. Prototyp. 2022, 17, 329–365. [Google Scholar] [CrossRef]
- Kotadia, H.R.; Gibbons, G.; Das, A.; Howes, P.D. A Review of Laser Powder Bed Fusion Additive Manufacturing of Aluminium Alloys: Microstructure and Properties. Addit. Manuf. 2021, 46, 102155. [Google Scholar] [CrossRef]
- Nandy, J.; Sarangi, H.; Sahoo, S. A Review on Direct Metal Laser Sintering: Process Features and Microstructure Modeling. Lasers Manuf. Mater. Process. 2019, 6, 280–316. [Google Scholar] [CrossRef]
- Galati, M.; Iuliano, L. A Literature Review of Powder-Based Electron Beam Melting Focusing on Numerical Simulations. Addit. Manuf. 2018, 19, 1–20. [Google Scholar] [CrossRef]
- Zhang, J.; Song, B.; Wei, Q.; Bourell, D.; Shi, Y. A Review of Selective Laser Melting of Aluminum Alloys: Processing, Microstructure, Property and Developing Trends. J. Mater. Sci. Technol. 2019, 35, 270–284. [Google Scholar] [CrossRef]
- Jia, H.; Sun, H.; Wang, H.; Wu, Y.; Wang, H. Scanning Strategy in Selective Laser Melting (SLM): A Review. Int. J. Adv. Manuf. Technol. 2021, 113, 2413–2435. [Google Scholar] [CrossRef]
- Ahn, D.G. Directed Energy Deposition (DED) Process: State of the Art. Int. J. Precis. Eng. Manuf. Green Technol. 2021, 8, 703–742. [Google Scholar] [CrossRef]
- Yakout, M.; Elbestawi, M.A.; Veldhuis, S.C. A Review of Metal Additive Manufacturing Technologies. Solid. State Phenom. 2018, 278, 1–14. [Google Scholar] [CrossRef]
- Fu, R.; Tang, S.; Lu, J.; Cui, Y.; Li, Z.; Zhang, H.; Xu, T.; Chen, Z.; Liu, C. Hot-Wire Arc Additive Manufacturing of Aluminum Alloy with Reduced Porosity and High Deposition Rate. Mater. Des. 2021, 199, 109370. [Google Scholar] [CrossRef]
- Herzog, D.; Seyda, V.; Wycisk, E.; Emmelmann, C. Additive Manufacturing of Metals. Acta Mater. 2016, 117, 371–392. [Google Scholar] [CrossRef]
- Blakey-Milner, B.; Gradl, P.; Snedden, G.; Brooks, M.; Pitot, J.; Lopez, E.; Leary, M.; Berto, F.; du Plessis, A. Metal Additive Manufacturing in Aerospace: A Review. Mater. Des. 2021, 209, 110008. [Google Scholar] [CrossRef]
- Mehdiyev, Z.; Felho, C. Metal Additive Manufacturing in Automotive Industry: A Review of Applications, Advantages, and Limitations. Mater. Sci. Forum 2023, 1103, 49–62. [Google Scholar] [CrossRef]
- Tom, T.; Sreenilayam, S.P.; Brabazon, D.; Jose, J.P.; Joseph, B.; Madanan, K.; Thomas, S. Additive Manufacturing in the Biomedical Field-Recent Research Developments. Results Eng. 2022, 16, 100661. [Google Scholar] [CrossRef]
- Li, Z.; Sui, S.; Ma, X.; Tan, H.; Zhong, C.; Bi, G.; Clare, A.T.; Gasser, A.; Chen, J. High Deposition Rate Powder- and Wire-Based Laser Directed Energy Deposition of Metallic Materials: A Review. Int. J. Mach. Tools Manuf. 2022, 181, 103942. [Google Scholar] [CrossRef]
- Yang, S.; Xu, D.; Yan, D.; Albert, M.; Pasebani, S. Additive Manufacturing of ODS Steels Using Powder Feedstock Atomized with Elemental Yttrium. In Proceedings of the 34th Annual International Solid Freeform Fabrication Symposium—An Additive Manufacturing Conference, Austin, TX, USA, 14–16 August 2023; pp. 1478–1488. [Google Scholar]
- Yang, S.; Pasebani, S. Additive Manufacturing of Austenitic Oxide Dispersion Strengthened Alloy Using Powder Feedstock Gas-Atomized with Elemental Yttrium via Laser Directed Energy Deposition; Oregon State University: Corvallis, OR, USA, 2023. [Google Scholar]
- Liang, Z.; Liao, Z.; Zhang, H.; Li, Z.; Wang, L.; Chang, B.; Du, D. Improving Process Stability of Electron Beam Directed Energy Deposition by Closed-Loop Control of Molten Pool. Addit. Manuf. 2023, 72, 103638. [Google Scholar] [CrossRef]
- Svetlizky, D.; Zheng, B.; Vyatskikh, A.; Das, M.; Bose, S.; Bandyopadhyay, A.; Schoenung, J.M.; Lavernia, E.J.; Eliaz, N. Laser-Based Directed Energy Deposition (DED-LB) of Advanced Materials. Mater. Sci. Eng. A 2022, 840, 142967. [Google Scholar] [CrossRef]
- Rodríguez-González, P.; Neubauer, E.; Ariza, E.; Bolzoni, L.; Gordo, E.; Ruiz-Navas, E.M. Assessment of Plasma Deposition Parameters for DED Additive Manufacturing of AA2319. J. Manuf. Mater. Process. 2023, 7, 113. [Google Scholar] [CrossRef]
- Xia, C.; Pan, Z.; Polden, J.; Li, H.; Xu, Y.; Chen, S.; Zhang, Y. A Review on Wire Arc Additive Manufacturing: Monitoring, Control and a Framework of Automated System. J. Manuf. Syst. 2020, 57, 31–45. [Google Scholar] [CrossRef]
- Ding, D.; Pan, Z.; Cuiuri, D.; Li, H. Wire-Feed Additive Manufacturing of Metal Components: Technologies, Developments and Future Interests. Int. J. Adv. Manuf. Technol. 2015, 81, 465–481. [Google Scholar] [CrossRef]
- Williams, S.W.; Martina, F.; Addison, A.C.; Ding, J.; Pardal, G.; Colegrove, P. Wire + Arc Additive Manufacturing. Mater. Sci. Technol. 2016, 32, 641–647. [Google Scholar] [CrossRef]
- Sames, W.J.; List, F.A.; Pannala, S.; Dehoff, R.R.; Babu, S.S. The Metallurgy and Processing Science of Metal Additive Manufacturing. Int. Mater. Rev. 2016, 61, 315–360. [Google Scholar] [CrossRef]
- Lalegani Dezaki, M.; Serjouei, A.; Zolfagharian, A.; Fotouhi, M.; Moradi, M.; Ariffin, M.K.A.; Bodaghi, M. A Review on Additive/Subtractive Hybrid Manufacturing of Directed Energy Deposition (DED) Process. Adv. Powder Mater. 2022, 1, 100054. [Google Scholar] [CrossRef]
- Urhal, P.; Weightman, A.; Diver, C.; Bartolo, P. Robot Assisted Additive Manufacturing: A Review. Robot. Comput. Integr. Manuf. 2019, 59, 335–345. [Google Scholar] [CrossRef]
- Sibisi, P.N.; Popoola, A.P.I.; Arthur, N.K.K.; Pityana, S.L. Review on Direct Metal Laser Deposition Manufacturing Technology for the Ti-6Al-4V Alloy. Int. J. Adv. Manuf. Technol. 2020, 107, 1163–1178. [Google Scholar] [CrossRef]
- Brückner, F.; Nowotny, S.; Leyens, C. Innovations in Laser Cladding and Direct Metal Deposition; Beyer, E., Morris, T., Eds.; SPIE LASE: San Francisco, CA, USA, 2012; p. 823904. [Google Scholar] [CrossRef]
- He, W.; Shi, W.; Li, J.; Xie, H. In-Situ Monitoring and Deformation Characterization by Optical Techniques; Part I: Laser-Aided Direct Metal Deposition for Additive Manufacturing. Opt. Lasers Eng. 2019, 122, 74–88. [Google Scholar] [CrossRef]
- Brooks, H.; Molony, S. Design and Evaluation of Additively Manufactured Parts with Three Dimensional Continuous Fibre Reinforcement. Mater. Des. 2016, 90, 276–283. [Google Scholar] [CrossRef]
- Xu, X.; Mi, G.; Luo, Y.; Jiang, P.; Shao, X.; Wang, C. Morphologies, Microstructures, and Mechanical Properties of Samples Produced Using Laser Metal Deposition with 316 L Stainless Steel Wire. Opt. Lasers Eng. 2017, 94, 1–11. [Google Scholar] [CrossRef]
- Kisielewicz, A.; Thalavai Pandian, K.; Sthen, D.; Hagqvist, P.; Valiente Bermejo, M.A.; Sikström, F.; Ancona, A. Hot-Wire Laser-Directed Energy Deposition: Process Characteristics and Benefits of Resistive Pre-Heating of the Feedstock Wire. Metal 2021, 11, 634. [Google Scholar] [CrossRef]
- Becker, D.; Boley, S.; Eisseler, R.; Stehle, T.; Möhring, H.C.; Onuseit, V.; Hoßfeld, M.; Graf, T. Influence of a Closed-Loop Controlled Laser Metal Wire Deposition Process of S Al 5356 on the Quality of Manufactured Parts before and after Subsequent Machining. Prod. Eng. 2021, 15, 489–507. [Google Scholar] [CrossRef]
- Piscopo, G.; Iuliano, L. Current Research and Industrial Application of Laser Powder Directed Energy Deposition. Int. J. Adv. Manuf. Technol. 2022, 119, 6893–6917. [Google Scholar] [CrossRef]
- Özel, T.; Shokri, H.; Loizeau, R. A Review on Wire-Fed Directed Energy Deposition Based Metal Additive Manufacturing. J. Manuf. Mater. Process. 2023, 7, 45. [Google Scholar] [CrossRef]
- Wasmer, K.; Wüst, M.; Cui, D.; Masinelli, G.; Shevchik, S. Monitoring of Functionally Graded Material during Laser Directed Energy Deposition by Acoustic Emission and Optical Emission Spectroscopy Using Artificial Intelligence. Virtual Phys. Prototyp. 2023, 18, e2189599. [Google Scholar] [CrossRef]
- Nowotny, S.; Scharek, S.; Beyer, E.; Richter, K.-H. Laser Beam Build-Up Welding: Precision in Repair, Surface Cladding, and Direct 3D Metal Deposition. J. Therm. Spray. Technol. 2007, 16, 344–348. [Google Scholar] [CrossRef]
- Gu, H.; Li, L. Computational Fluid Dynamic Simulation of Gravity and Pressure Effects in Laser Metal Deposition for Potential Additive Manufacturing in Space. Int. J. Heat. Mass. Transf. 2019, 140, 51–65. [Google Scholar] [CrossRef]
- Navarro, M.; Matar, A.; Diltemiz, S.F.; Eshraghi, M. Development of a Low-Cost Wire Arc Additive Manufacturing System. J. Manuf. Mater. Process. 2021, 6, 3. [Google Scholar] [CrossRef]
- Xue, P.; Zhu, L.; Xu, P.; Lu, H.; Wang, S.; Yang, Z.; Ning, J.; Sing, S.L.; Ren, Y. Microstructure Evolution and Enhanced Mechanical Properties of Additively Manufactured CrCoNi Medium-Entropy Alloy Composites. J. Alloys Compd. 2022, 928, 167169. [Google Scholar] [CrossRef]
- Abdulrahman, K.O.; Akinlabi, E.T.; Mahamood, R.M.; Pityana, S.; Tlotleng, M. Laser Metal Deposition of Titanium Aluminide Composites: A Review. Mater. Today Proc. 2018, 5, 19738–19746. [Google Scholar] [CrossRef]
- Zhong, C.; Liu, J.; Zhao, T.; Schopphoven, T.; Fu, J.; Gasser, A.; Schleifenbaum, J.H. Laser Metal Deposition of Ti6Al4V—A Brief Review. Appl. Sci. 2020, 10, 764. [Google Scholar] [CrossRef]
- Savinov, R.; Wang, Y.; Shi, J. An Exploratory Study on Biocompatible Ti-6Mn-4Mo Alloy Manufactured by Directed Energy Deposition. Mater. Sci. Addit. Manuf. 2023, 2, 2180. [Google Scholar] [CrossRef]
- Abuabiah, M.; Mbodj, N.G.; Shaqour, B.; Herzallah, L.; Juaidi, A.; Abdallah, R.; Plapper, P. Advancements in Laser Wire-Feed Metal Additive Manufacturing: A Brief Review. Materials 2023, 16, 2030. [Google Scholar] [CrossRef] [PubMed]
- Huang, W.; Chen, S.; Xiao, J.; Jiang, X.; Jia, Y. Laser Wire-Feed Metal Additive Manufacturing of the Al Alloy. Opt. Laser Technol. 2021, 134, 106627. [Google Scholar] [CrossRef]
- Suresh Kumar, K. Parameter Determination and Experimental Validation of a Wire Parameter Determination and Experimental Validation of a Wire Feed. Additive Manufacturing Model. Feed. Additive Manufacturing Model. 2015. Available online: https://scholarsmine.mst.edu/masters_theseshttps://scholarsmine.mst.edu/masters_theses/7989 (accessed on 20 March 2024).
- Sreekanth, S.; Ghassemali, E.; Hurtig, K.; Joshi, S.; Andersson, J. Effect of Direct Energy Deposition Process Parameters on Single-Track Deposits of Alloy 718. Metal 2020, 10, 96. [Google Scholar] [CrossRef]
- Pinkerton, A.J. Advances in the Modeling of Laser Direct Metal Deposition. J. Laser Appl. 2015, 27, S15001. [Google Scholar] [CrossRef]
- Akbari, M.; Kovacevic, R. Joining of Elements Fabricated by a Robotized Laser/Wire Directed Energy Deposition Process by Using an Autogenous Laser Welding. Int. J. Adv. Manuf. Technol. 2019, 100, 2971–2980. [Google Scholar] [CrossRef]
- Liu, M.; Kumar, A.; Bukkapatnam, S.; Kuttolamadom, M. A Review of the Anomalies in Directed Energy Deposition (DED) Processes & Potential Solutions—Part Quality & Defects. In Procedia Manufacturing; Elsevier B.V.: Amsterdam, The Netherlands, 2021; Volume 53, pp. 507–518. [Google Scholar] [CrossRef]
- Ishfaq, K.; Abdullah, M.; Mahmood, M.A. A State-of-the-Art Direct Metal Laser Sintering of Ti6Al4V and AlSi10Mg Alloys: Surface Roughness, Tensile Strength, Fatigue Strength and Microstructure. In Optics and Laser Technology; Elsevier Ltd.: Amsterdam, The Netherlands, 2021. [Google Scholar] [CrossRef]
- Bambach, M.; Sizova, I.; Kies, F.; Haase, C. Directed Energy Deposition of Inconel 718 Powder, Cold and Hot Wire Using a Six-Beam Direct Diode Laser Set-Up. Addit. Manuf. 2021, 47, 102269. [Google Scholar] [CrossRef]
- Yusuf, S.M.; Gao, N. Influence of Energy Density on Metallurgy and Properties in Metal Additive Manufacturing. Mater. Sci. Technol. 2017, 33, 1269–1289. [Google Scholar] [CrossRef]
- Akbari, M.; Ding, Y.; Kovacevic, R. Process Development for A Robotized Laser Wire Additive Manufacturing. 2017. Available online: http://asmedigitalcollection.asme.org/MSEC/proceedings-pdf/MSEC2017/50732/V002T01A015/2519393/v002t01a015-msec2017-2951.pdf (accessed on 15 March 2024).
- Motta, M.; Demir, A.G.; Previtali, B. High-Speed Imaging and Process Characterization of Coaxial Laser Metal Wire Deposition. Addit. Manuf. 2018, 22, 497–507. [Google Scholar] [CrossRef]
- Abioye, T.E.; Folkes, J.; Clare, A.T. A Parametric Study of Inconel 625 Wire Laser Deposition. J. Mater. Process Technol. 2013, 213, 2145–2151. [Google Scholar] [CrossRef]
- Mamphekgo, T.C.; Maledi, N.; Tshabalala, L.C.; Hagedorn-Hansen, D. The Effects of Laser Wire Directed Energy Deposition Processing Parameters on the Properties of 309L Stainless Steel. MATEC Web Conf. 2023, 388, 05007. [Google Scholar] [CrossRef]
- Mazumder, J.; Schifferer, A.; Choi, J. Direct Materials Deposition: Designed Macro and Microstructure. Mater. Res. Innov. 1999, 3, 118–131. [Google Scholar] [CrossRef]
- Wang, M.; Ventzke, V.; Kashaev, N. Wire-Based Laser Directed Energy Deposition of AA7075: Effect of Process Parameters on Microstructure and Mechanical Properties. J. Mater. Res. Technol. 2022, 21, 388–403. [Google Scholar] [CrossRef]
- Froend, M.; Riekehr, S.; Kashaev, N.; Klusemann, B.; Enz, J. Process Development for Wire-Based Laser Metal Deposition of 5087 Aluminium Alloy by Using Fibre Laser. J. Manuf. Process 2018, 34, 721–732. [Google Scholar] [CrossRef]
- Wang, M.; Kashaev, N. Investigation of Process Window for AA7075 Considering Effects of Different Wire Feed Directions in Lateral Laser Metal Deposition. In Procedia CIRP; Elsevier B.V.: Amsterdam, The Netherlands, 2022; Volume 111, pp. 218–223. [Google Scholar] [CrossRef]
- da Silva, A.; Wang, S.; Volpp, J.; Kaplan, A.F.H. Vertical Laser Metal Wire Deposition of Al-Si Alloys. In Procedia CIRP; Elsevier B.V.: Amsterdam, The Netherlands, 2020; Volume 94, pp. 341–345. [Google Scholar] [CrossRef]
- Shaikh, M.O.; Chen, C.C.; Chiang, H.C.; Chen, J.R.; Chou, Y.C.; Kuo, T.Y.; Ameyama, K.; Chuang, C.H. Additive Manufacturing Using Fine Wire-Based Laser Metal Deposition. Rapid Prototyp. J. 2020, 26, 473–483. [Google Scholar] [CrossRef]
- Demir, A.G. Micro Laser Metal Wire Deposition for Additive Manufacturing of Thin-Walled Structures. Opt. Lasers Eng. 2018, 100, 9–17. [Google Scholar] [CrossRef]
- Demir, A.G.; Biffi, C.A. Micro Laser Metal Wire Deposition of Thin-Walled Al Alloy Components: Process and Material Characterization. J. Manuf. Process 2019, 37, 362–369. [Google Scholar] [CrossRef]
- Assuncao, E.; Williams, S. Comparison of Continuous Wave and Pulsed Wave Laser Welding Effects. Opt. Lasers Eng. 2013, 51, 674–680. [Google Scholar] [CrossRef]
- Fuerschbach, P.W.; Eisler, G.R. Effect of Laser Spot Weld Energy and Duration on Melting and Absorption. Sci. Technol. Weld. Join. 2002, 7, 241–246. [Google Scholar] [CrossRef]
- Ye, Z.P.; Zhang, Z.J.; Jin, X.; Xiao, M.Z.; Su, J.Z. Study of Hybrid Additive Manufacturing Based on Pulse Laser Wire Depositing and Milling. Int. J. Adv. Manuf. Technol. 2017, 88, 2237–2248. [Google Scholar] [CrossRef]
- Medrano, A.; Folkes, J.; Segal, J.; Pashby, I. Fibre Laser Metal Deposition with Wire: Parameters Study and Temperature Monitoring System; SPIE: Washington, DC, USA, 2008; p. 713122. [Google Scholar] [CrossRef]
- Shi, J.; Zhu, P.; Fu, G.; Shi, S. Geometry Characteristics Modeling and Process Optimization in Coaxial Laser inside Wire Cladding. Opt. Laser Technol. 2018, 101, 341–348. [Google Scholar] [CrossRef]
- Gao, L.; Chuang, A.C.; Kenesei, P.; Ren, Z.; Balderson, L.; Sun, T. An Operando Synchrotron Study on the Effect of Wire Melting State on Solidification Microstructures of Inconel 718 in Wire-Laser Directed Energy Deposition. Int. J. Mach. Tools Manuf. 2024, 194, 104089. [Google Scholar] [CrossRef]
- Valentin, M.; Arnaud, C.; Kling, R. Additive Manufacturing by Wire Based Laser Metal Deposition; SPIE LASE: San Francisco, CA, USA, 2019. [Google Scholar]
- Liu, X.; Wang, H.; Kaufmann, K.; Vecchio, K. Directed Energy Deposition of Pure Copper Using Blue Laser. J. Manuf. Process 2023, 85, 314–322. [Google Scholar] [CrossRef]
- Wang, A.; Wei, Q.; Tang, Z.; Ren, P.; Zhang, X.; Wu, Y.; Wang, H.; Du Plessis, A.; Huang, J.; Hu, K.; et al. Effects of Processing Parameters on Pore Defects in Blue Laser Directed Energy Deposition of Aluminum by in and Ex Situ Observation. J. Mater. Process Technol. 2023, 319, 118068. [Google Scholar] [CrossRef]
- Tang, Z.; Wei, Q.; Gao, Z.; Yang, H.; Wang, A.; Wan, L.; Luo, C.; Wu, Y.; Wang, H.; Wang, H. 2000W Blue Laser Directed Energy Deposition of AlSi7Mg: Process Parameters, Molten Pool Characteristics, and Appearance Defects. Virtual Phys. Prototyp. 2023, 18, e2120405. [Google Scholar] [CrossRef]
- Govekar, E.; Jeromen, A.; Kuznetsov, A.; Levy, G.; Fujishima, M. Study of an Annular Laser Beam Based Axially-Fed Powder Cladding Process. CIRP Ann. 2018, 67, 241–244. [Google Scholar] [CrossRef]
- Govekar, E.; Kuznetsov, A.; Jerič, A. Drop on Demand Generation from a Metal Wire by Means of an Annular Laser Beam. J. Mater. Process Technol. 2016, 227, 59–70. [Google Scholar] [CrossRef]
- Kotar, M.; Govekar, E. The Influence of the Workpiece Illumination Proportion in Annular Laser Beam Wire Deposition Process. In Procedia CIRP; Elsevier B.V.: Amsterdam, The Netherlands, 2018; Volume 74, pp. 228–232. [Google Scholar] [CrossRef]
- Kotar, M.; Fujishima, M.; Levy, G.; Govekar, E. Initial Transient Phase and Stability of Annular Laser Beam Direct Wire Deposition. CIRP Ann. 2019, 68, 233–236. [Google Scholar] [CrossRef]
- Zhang, J.; Cao, Y.; Wang, H.; Shi, T.; Su, B.; Zhang, L. Effect of Annular Laser Metal Deposition (ALMD) Process Parameters on Track Geometry and Thermal History on Ti6Al4V Alloy Clad. Materials 2023, 16, 4062. [Google Scholar] [CrossRef] [PubMed]
- Froend, M.; Ventzke, V.; Kashaev, N.; Klusemann, B.; Enz, J. Thermal Analysis of Wire-Based Direct Energy Deposition of Al-Mg Using Different Laser Irradiances. Addit. Manuf. 2019, 29, 100800. [Google Scholar] [CrossRef]
- Chen, Y.; Chen, X.; Jiang, M.; Lei, Z.; Wang, Z.; Liang, J.; Wu, S.; Ma, S.; Jiang, N.; Chen, Y. Coaxial Laser Metal Wire Deposition of Ti6Al4V Alloy: Process, Microstructure and Mechanical Properties. J. Mater. Res. Technol. 2022, 20, 2578–2590. [Google Scholar] [CrossRef]
- Kotar, M.; Fujishima, M.; Levy, G.N.; Govekar, E. Advances in the Understanding of the Annular Laser Beam Wire Cladding Process. J. Mater. Process Technol. 2021, 294, 117105. [Google Scholar] [CrossRef]
- Goffin, N.J.; Higginson, R.L.; Tyrer, J.R. The Use of Holographic Optical Elements (HOE’s) to Investigate the Use of a Flat Irradiance Profile in the Control of Heat Absorption in Wire-Fed Laser Cladding. J. Mater. Process. Technol. 2015, 220, 191–201. [Google Scholar] [CrossRef]
- Goffin, N.; Tyrer, J.R.; Jones, L.C.R.; Higginson, R.L. Simulated and Experimental Analysis of Laser Beam Energy Profiles to Improve Efficiency in Wire-Fed Laser Deposition. Int. J. Adv. Manuf. Technol. 2021, 114, 3021–3036. [Google Scholar] [CrossRef]
- Kell, J.; Tyrer, J.R.; Higginson, R.L.; Jones, J.C.; Noden, S. Laser Weld Pool Management through Diffractive Holographic Optics. Mater. Sci. Technol. 2012, 28, 354–363. [Google Scholar] [CrossRef]
- Madarieta-Churruca, M.; Pujana-Astarloa, J.; Garmendia-Saez-De-Heredia, I.; Leunda-Arrizabalaga, J. Additive Manufacturing of Metal Components Using Concentric-Wire Laser Metal Deposition. Dyna 2018, 93, 675–680. [Google Scholar] [CrossRef]
- Capello, E.; Previtali, B. The Influence of Operator Skills, Process Parameters and Materials on Clad Shape in Repair Using Laser Cladding by Wire. J. Mater. Process Technol. 2006, 174, 223–232. [Google Scholar] [CrossRef]
- Froend, M.; Ventzke, V.; Riekehr, S.; Kashaev, N.; Klusemann, B.; Enz, J. Microstructure and Microhardness of Wire-Based Laser Metal Deposited AA5087 Using an Ytterbium Fibre Laser. Mater. Charact. 2018, 143, 59–67. [Google Scholar] [CrossRef]
- Thompson, S.M.; Bian, L.; Shamsaei, N.; Yadollahi, A. An Overview of Direct Laser Deposition for Additive Manufacturing; Part I: Transport Phenomena, Modeling and Diagnostics. Addit. Manuf. 2015, 8, 36–62. [Google Scholar] [CrossRef]
- Hu, R.; Luo, M.; Liu, T.; Liang, L.; Huang, A.; Trushnikov, D.; Karunakaran, K.P.; Pang, S. Thermal Fluid Dynamics of Liquid Bridge Transfer in Laser Wire Deposition 3D Printing. Sci. Technol. Weld. Join. 2019, 24, 401–411. [Google Scholar] [CrossRef]
- Gonnabattula, A.; Thanumoorthy, R.S.; Bontha, S.; Balan, A.S.S.; Kumar, V.A.; Kanjarla, A.K. Process Parameter Optimization for Laser Directed Energy Deposition (LDED) of Ti6Al4V Using Single-Track Experiments with Small Laser Spot Size. Opt. Laser Technol. 2024, 175, 110861. [Google Scholar] [CrossRef]
- Odermatt, A.E.; Dorn, F.; Ventzke, V.; Kashaev, N. Coaxial Laser Directed Energy Deposition with Wire of Thin-Walled Duplex Stainless Steel Parts: Process Discontinuities and Their Impact on the Mechanical Properties. CIRP J. Manuf. Sci. Technol. 2022, 37, 443–453. [Google Scholar] [CrossRef]
- Fu, Y.; Demir, A.G.; Guo, N. Additive Manufacturing of Ti-6Al-4V Alloy by Micro-Laser Metal Wire Deposition with Pulsed Wave Emission: Processability and Microstructure Formation. Int. J. Adv. Manuf. Technol. 2023, 126, 2693–2711. [Google Scholar] [CrossRef]
- Hagqvist, P.; Heralić, A.; Christiansson, A.K.; Lennartson, B. Resistance Measurements for Control of Laser Metal Wire Deposition. Opt. Lasers Eng. 2014, 54, 62–67. [Google Scholar] [CrossRef]
- Takushima, S.; Morita, D.; Shinohara, N.; Kawano, H.; Mizutani, Y.; Takaya, Y. Optical In-Process Height Measurement System for Process Control of Laser Metal-Wire Deposition. Precis. Eng. 2020, 62, 23–29. [Google Scholar] [CrossRef]
- Liu, W.; Ma, J.; Liu, S.; Kovacevic, R. Experimental and Numerical Investigation of Laser Hot Wire Welding. Int. J. Adv. Manuf. Technol. 2015, 78, 1485–1499. [Google Scholar] [CrossRef]
- Ji, S.; Liu, F.; Shi, T.; Fu, G.; Shi, S. Effects of Defocus Distance on Three-Beam Laser Internal Coaxial Wire Cladding. Chin. J. Mech. Eng. 2021, 34, 45. [Google Scholar] [CrossRef]
- Valiente Bermejo, M.A.; Thalavai Pandian, K.; Axelsson, B.; Harati, E.; Kisielewicz, A.; Karlsson, L. Microstructure of Laser Metal Deposited Duplex Stainless Steel: Influence of Shielding Gas and Heat Treatment. Weld. World 2021, 65, 525–541. [Google Scholar] [CrossRef]
- Zhang, Y.N.; Cao, X.; Wanjara, P. Microstructure and Hardness of Fiber Laser Deposited Inconel 718 Using Filler Wire. Int. J. Adv. Manuf. Technol. 2013, 69, 2569–2581. [Google Scholar] [CrossRef]
- Mathenia, R.; Flood, A.; McLain, B.; Sparks, T.; Liou, F. Effects of Laser Defocusing on Bead Geometry in Coaxial Titanium Wire-Based Laser Metal Deposition. Materials 2024, 17, 889. [Google Scholar] [CrossRef]
- Kim, J.-D.; Peng, Y. Melt Pool Shape and Dilution of Laser Cladding with Wire Feeding. J. Mater. Process. Technol. 2000, 104, 284–293. [Google Scholar] [CrossRef]
- Hussein, N.I.S.; Segal, J.; McCartney, D.G.; Pashby, I.R. Microstructure Formation in Waspaloy Multilayer Builds Following Direct Metal Deposition with Laser and Wire. Mater. Sci. Eng. A 2008, 497, 260–269. [Google Scholar] [CrossRef]
- Hu, Y.; Hua, Z.; Mi, G.; Zhang, M.; Liu, Z.; Zhang, X.; Yan, X.; Wang, C. Investigation on the Evolution of Deposition Layer Grain Structure and Its Effect on Mechanical Properties in Aluminum Alloy Fabricated by Laser Directed Energy Deposition. Mater. Sci. Eng. A 2024, 892, 145866. [Google Scholar] [CrossRef]
- Heralic, A.; Christiansson, A.K.; Hurtig, K.; Ottosson, M.; Lennartson, B. Control Design for Automation of Robotized Laser Metal-Wire Deposition. IFAC Proc. Vol. 2008, 41, 14785–14791. [Google Scholar] [CrossRef]
- Zhu, S.; Nakahara, Y.; Yamamoto, M. Optimization of Process Conditions for Additive Manufacturing Technology Combining High-Power Diode Laser and Hot Wire. Metal 2021, 11, 1583. [Google Scholar] [CrossRef]
- Caiazzo, F.; Alfieri, V. Directed Energy Deposition of Stainless Steel Wire with Laser Beam: Evaluation of Geometry and Affection Depth. In Procedia CIRP; Elsevier B.V.: Amsterdam, The Netherlands, 2021; Volume 99, pp. 348–351. [Google Scholar] [CrossRef]
- Zapata, A.; Bernauer, C.; Stadter, C.; Kolb, C.G.; Zaeh, M.F. Investigation on the Cause-Effect Relationships between the Process Parameters and the Resulting Geometric Properties for Wire-Based Coaxial Laser Metal Deposition. Metal 2022, 12, 455. [Google Scholar] [CrossRef]
- Heralić, A.; Christiansson, A.K.; Lennartson, B. Height Control of Laser Metal-Wire Deposition Based on Iterative Learning Control and 3D Scanning. Opt. Lasers Eng. 2012, 50, 1230–1241. [Google Scholar] [CrossRef]
- Abioye, T.E.; Medrano-Tellez, A.; Farayibi, P.K.; Oke, P.K. Laser Metal Deposition of Multi-Track Walls of 308LSi Stainless Steel. Mater. Manuf. Process. 2017, 32, 1660–1666. [Google Scholar] [CrossRef]
- Mok, S.H.; Bi, G.; Folkes, J.; Pashby, I. Deposition of Ti-6Al-4V Using a High Power Diode Laser and Wire, Part I: Investigation on the Process Characteristics. Surf. Coat. Technol. 2008, 202, 3933–3939. [Google Scholar] [CrossRef]
- Brandl, E.; Schoberth, A.; Leyens, C. Morphology, Microstructure, and Hardness of Titanium (Ti-6Al-4V) Blocks Deposited by Wire-Feed Additive Layer Manufacturing (ALM). Mater. Sci. Eng. A 2012, 532, 295–307. [Google Scholar] [CrossRef]
- Syed, W.U.H.; Li, L. Effects of Wire Feeding Direction and Location in Multiple Layer Diode Laser Direct Metal Deposition. In Applied Surface Science; Elsevier: Amsterdam, The Netherlands, 2005; Volume 248, pp. 518–524. [Google Scholar] [CrossRef]
- Xiao, R.; Chen, K.; Zuo, T.; Ambrosy, G.; Huegel, H. Influence of Wire Addition Direction in CO2 Laser Welding of Aluminum; Deng, S., Okada, T., Behler, K., Wang, X., Eds.; Photonics Asia: Shanghai, China, 2002; p. 128. [Google Scholar] [CrossRef]
- Li, J.; Li, H.N.; Liao, Z.; Axinte, D. Analytical Modelling of Full Single-Track Profile in Wire-Fed Laser Cladding. J. Mater. Process Technol. 2021, 290, 116978. [Google Scholar] [CrossRef]
- Gao, L.; Bhattacharyya, J.; Lin, W.; Ren, Z.; Chuang, A.C.; Shevchenko, P.D.; Nikitin, V.; Ma, J.; Agnew, S.R.; Sun, T. Tailoring Material Microstructure and Property in Wire-Laser Directed Energy Deposition through a Wiggle Deposition Strategy. Addit. Manuf. 2023, 77, 103801. [Google Scholar] [CrossRef]
- Zhou, Y.; Ning, F. Directed Energy Deposition With Coaxial Wire-Powder Feeding: Melt Pool Temperature and Microstructure. J. Manuf. Sci. Eng. 2023, 145, 081004. [Google Scholar] [CrossRef]
- Yuan, D.; Sun, X.; Sun, L.; Zhang, Z.; Guo, C.; Wang, J.; Jiang, F. Improvement of the Grain Structure and Mechanical Properties of Austenitic Stainless Steel Fabricated by Laser and Wire Additive Manufacturing Assisted with Ultrasonic Vibration. Mater. Sci. Eng. A 2021, 813, 141177. [Google Scholar] [CrossRef]
- Pütsch, O.; Gasser, A.; Biber, A.; Kelbassa, J.; Wissenbach, K.; Loosten, P.; Schleifenbaum, J.H. Influence of Focal Length on the Laser Metal Deposition Process with Coaxial Wire Feeding. In High-Power Laser Materials Processing: Applications, Diagnostics, and Systems VIII; Kaierle, S., Heinemann, S.W., Eds.; SPIE: Washington, DC, USA, 2019; p. 11. [Google Scholar] [CrossRef]
- Zapata, A.; Zhao, X.F.; Li, S.; Bernauer, C.; Zaeh, M.F. Three-Dimensional Annular Heat Source for the Thermal Simulation of Coaxial Laser Metal Deposition with Wire. J. Laser Appl. 2023, 35, 012020. [Google Scholar] [CrossRef]
- Bernauer, C.; Sigl, M.E.; Grabmann, S.; Merk, T.; Zapata, A.; Zaeh, M.F. Effects of the Thermal History on the Microstructural and the Mechanical Properties of Stainless Steel 316L Parts Produced by Wire-Based Laser Metal Deposition. Mater. Sci. Eng. A 2024, 889, 145862. [Google Scholar] [CrossRef]
- Steiner, M.F.; Speier, M.; Kelbassa, J.; Schopphoven, T.; Häfner, C.L. Influence of Tool Path Planning on Process Stability and Deposition Accuracy in Laser Material Deposition with Coaxial Wire Feed. J. Laser Appl. 2022, 34, 012026. [Google Scholar] [CrossRef]
- Bernauer, C.; Zapata, A.; Zaeh, M.F. Toward Defect-Free Components in Laser Metal Deposition with Coaxial Wire Feeding through Closed-Loop Control of the Melt Pool Temperature. J. Laser Appl. 2022, 34, 042044. [Google Scholar] [CrossRef]
- Bernauer, C.; Merk, T.; Zapata, A.; Zaeh, M.F. Laser Metal Deposition with Coaxial Wire Feeding for the Automated and Reliable Build-Up of Solid Metal Parts. In Key Engineering Materials; Trans Tech Publications Ltd.: Stafa-Zurich, Switzerland, 2022; Volume 926, pp. 65–79. [Google Scholar] [CrossRef]
- Garmendia, I.; Pujana, J.; Lamikiz, A.; Madarieta, M.; Leunda, J. Structured Light-Based Height Control for Laser Metal Deposition. J. Manuf. Process 2019, 42, 20–27. [Google Scholar] [CrossRef]
- Zapata, A.; Bernauer, C.; Hell, M.; Kriz, H.; Zaeh, M.F. Direction-Independent Temperature Monitoring for Laser Metal Deposition with Coaxial Wire Feeding. In Procedia CIRP; Elsevier B.V.: Amsterdam, The Netherlands, 2022; Volume 111, pp. 302–307. [Google Scholar] [CrossRef]
- Li, J.; Li, H.N.; Liao, Z.; Axinte, D. Overlapped Wire-Fed Laser Cladding on Inclined Surfaces: An Analytical Model Considering Gravity and a Model Application. J. Mater. Process Technol. 2022, 304, 117559. [Google Scholar] [CrossRef]
- Arrizubieta, J.I.; Klocke, F.; Klingbeil, N.; Arntz, K.; Lamikiz, A.; Martinez, S. Evaluation of Efficiency and Mechanical Properties of Inconel 718 Components Built by Wire and Powder Laser Material Deposition. Rapid Prototyp. J. 2017, 23, 965–972. [Google Scholar] [CrossRef]
- Caiazzo, F. Additive Manufacturing by Means of Laser-Aided Directed Metal Deposition of Titanium Wire. Int. J. Adv. Manuf. Technol. 2018, 96, 2699–2707. [Google Scholar] [CrossRef]
- Brandl, E.; Michailov, V.; Viehweger, B.; Leyens, C. Deposition of Ti-6Al-4V Using Laser and Wire, Part II: Hardness and Dimensions of Single Beads. Surf. Coat. Technol. 2011, 206, 1130–1141. [Google Scholar] [CrossRef]
- Preis, J.; Xu, D.; Paul, B.K.; Eschbach, P.A.; Pasebani, S. Effect of Liquid Miscibility Gap on Defects in Inconel 625–GRCop42 Joints through Analysis of Gradient Composition Microstructure. J. Manuf. Mater. Process. 2024, 8, 42. [Google Scholar] [CrossRef]
- Su, L.; Xu, T.; Ma, X.; Mi, G.; Wang, L. Study on the Effect of ZrC and CNTs Particles on Inconel 625 Coatings Fabricated by Coaxial-Wire-Feed Laser Cladding. J. Mater. Res. Technol. 2024, 29, 3934–3945. [Google Scholar] [CrossRef]
- Bernauer, C.J.; Zapata, A.; Kick, L.; Weiss, T.; Sigl, M.E.; Zaeh, M.F. Pyrometry-Based Closed-Loop Control of the Melt Pool Temperature in Laser Metal Deposition with Coaxial Wire Feeding. In Procedia CIRP; Elsevier B.V.: Amsterdam, The Netherlands, 2022; Volume 111, pp. 296–301. [Google Scholar] [CrossRef]
- Liu, F.; Ji, S.S.; Shi, T.; Wan, L.; Shi, S.H.; Fu, G.Y. Parametric Study of the Three-Beam Laser inside Coaxial Wire Feeding Additive Manufacturing. Int. J. Adv. Manuf. Technol. 2022, 123, 313–330. [Google Scholar] [CrossRef]
- Liu, S.; Brice, C.; Zhang, X. Interrelated Process-Geometry-Microstructure Relationships for Wire-Feed Laser Additive Manufacturing. Mater. Today Commun. 2022, 31, 103794. [Google Scholar] [CrossRef]
- Toyserkani, E.; Khajepour, A.; Corbin, S.F. Laser Cladding; CRC Press: Boca Raton, FL, USA, 2004. [Google Scholar] [CrossRef]
- Benoit, M.J.; Sun, S.D.; Brandt, M.; Easton, M.A. Processing Window for Laser Metal Deposition of Al 7075 Powder with Minimized Defects. J. Manuf. Process 2021, 64, 1484–1492. [Google Scholar] [CrossRef]
- Ding, X.; Li, D.; Zhang, Q.; Ma, H.; Yang, J.; Fan, S. Effect of Ambient Pressure on Bead Shape, Microstructure and Corrosion Behavior of 4043 Al Alloy Fabricated by Laser Coaxial Wire Feeding Additive Manufacturing in Vacuum Environment. Opt. Laser Technol. 2022, 153, 108242. [Google Scholar] [CrossRef]
- Oliari, S.H.; Monteiro D’Oliveira, A.S.C.; Schulz, M. Manufatura Aditiva Do Aço Ferramenta H11 Por Deposição Metálica de Arame a Laser. Soldag. E Insp. 2017, 22, 466–479. [Google Scholar] [CrossRef]
- Xiong, J.; Zhang, G.; Gao, H.; Wu, L. Modeling of Bead Section Profile and Overlapping Beads with Experimental Validation for Robotic GMAW-Based Rapid Manufacturing. Robot. Comput. Integr. Manuf. 2013, 29, 417–423. [Google Scholar] [CrossRef]
- Cao, X.; Jahazi, M.; Fournier, J.; Alain, M. Optimization of Bead Spacing during Laser Cladding of ZE41A-T5 Magnesium Alloy Castings. J. Mater. Process Technol. 2008, 205, 322–331. [Google Scholar] [CrossRef]
- Garmendia, I.; Pujana, J.; Lamikiz, A.; Flores, J.; Madarieta, M. Development of an Intra-Layer Adaptive Toolpath Generation Control Procedure in the Laser Metal Wire Deposition Process. Materials 2019, 12, 352. [Google Scholar] [CrossRef] [PubMed]
- Zhang, K.; Wang, S.; Liu, W.; Shang, X. Characterization of Stainless Steel Parts by Laser Metal Deposition Shaping. Mater. Des. 2014, 55, 104–119. [Google Scholar] [CrossRef]
- Guo, C.; Long, J. Simulation on Geometric Morphology of Multi-Channel Deposition in Laser Wire Additive Manufacturing. J. Phys. Conf. Ser. 2022, 2252, 12049. [Google Scholar] [CrossRef]
- Boschetto, A.; Bottini, L.; Ghanadi, N. Areal Analysis Investigation of Selective Laser Melting Parts. J. Manuf. Mater. Process. 2022, 6, 83. [Google Scholar] [CrossRef]
- Yan, F.; Luo, Y.; Wang, C. A Study of Multi-Layer Multi-Pass Laser Depositing with 316L Stainless Steel Wire. J. Mech. Sci. Technol. 2021, 35, 1681–1687. [Google Scholar] [CrossRef]
- Akbari, M. Development of a Robotized Laser Directed Energy Deposition Development of a Robotized Laser Directed Energy Deposition System and Process Challenges System and Process Challenges. Available online: http://digitalrepository.smu.edu (accessed on 20 March 2024).
- Ding, Y.; Akbari, M.; Kovacevic, R. Process Planning for Laser Wire-Feed Metal Additive Manufacturing System. Int. J. Adv. Manuf. Technol. 2018, 95, 355–365. [Google Scholar] [CrossRef]
- Baghdadchi, A.; Hosseini, V.A.; Bermejo, M.A.V.; Axelsson, B.; Harati, E.; Högström, M.; Karlsson, L. Wire Laser Metal Deposition Additive Manufacturing of Duplex Stainless Steel Components—Development of a Systematic Methodology. Materials 2021, 14, 7170. [Google Scholar] [CrossRef] [PubMed]
- Murr, L.E.; Gaytan, S.M.; Ramirez, D.A.; Martinez, E.; Hernandez, J.; Amato, K.N.; Shindo, P.W.; Medina, F.R.; Wicker, R.B. Metal Fabrication by Additive Manufacturing Using Laser and Electron Beam Melting Technologies. J. Mater. Sci. Technol. 2012, 28, 1–14. [Google Scholar] [CrossRef]
- Wong, K.V.; Hernandez, A. A Review of Additive Manufacturing. ISRN Mech. Eng. 2012, 2012, 208760. [Google Scholar] [CrossRef]
- Wei, S.; Wang, G.; Shin, Y.C.; Rong, Y. Comprehensive Modeling of Transport Phenomena in Laser Hot-Wire Deposition Process. Int. J. Heat. Mass. Transf. 2018, 125, 1356–1368. [Google Scholar] [CrossRef]
- Noori Rahim Abadi, S.M.A.; Mi, Y.; Kisielewicz, A.; Sikström, F.; Choquet, I. Influence of Laser-Wire Interaction on Heat and Metal Transfer in Directed Energy Deposition. Int. J. Heat. Mass. Transf. 2023, 205, 123894. [Google Scholar] [CrossRef]
- Wang, L.; Huang, Y.; Jia, C.; Yang, L.; Yan, S. Laser-Directed Energy Deposition of In-Situ Titanium-Matrix Coatings with a Ti-B4C Cored Wire. Addit. Manuf. 2023, 73, 103682. [Google Scholar] [CrossRef]
- Ocylok, S.; Alexeev, E.; Mann, S.; Weisheit, A.; Wissenbach, K.; Kelbassa, I. Correlations of Melt Pool Geometry and Process Parameters during Laser Metal Deposition by Coaxial Process Monitoring. In Physics Procedia; Elsevier B.V.: Amsterdam, The Netherlands, 2014; Volume 56, pp. 228–238. [Google Scholar] [CrossRef]
- Da Silva, A.; Frostevarg, J.; Volpp, J.; Kaplan, A.F.H. Additive Manufacturing by Laser-Assisted Drop Deposition from a Metal Wire. Mater. Des. 2021, 209, 109987. [Google Scholar] [CrossRef]
- Bozeman, S.C.; Isgor, O.B.; Tucker, J.D. Effects of Processing Conditions on the Solidification and Heat-Affected Zone of 309L Stainless Steel Claddings on Carbon Steel Using Wire-Directed Energy Deposition. Surf. Coat. Technol. 2022, 444, 128698. [Google Scholar] [CrossRef]
- Wang, L.; Yuan, J.; Zhang, H.; Huang, Y.; Yang, L. Effect of the Laser-Wire Relative Position on the Wire-Based Laser-Directed Energy Deposition of In-Situ Synthesis Ti/TiB/TiC Composite Coatings. Mater. Charact. 2023, 206, 113408. [Google Scholar] [CrossRef]
- Abranovic, B.; Sarkar, S.; Chang-Davidson, E.; Beuth, J. Melt Pool Level Flaw Detection in Laser Hot Wire Directed Energy Deposition Using a Convolutional Long Short-Term Memory Autoencoder. Addit. Manuf. 2024, 79, 103843. [Google Scholar] [CrossRef]
- Semak, V.V.; Hopkins, J.A.; McCay, M.H.; McCay, T.D. Melt Pool Dynamics during Laser Welding. J. Phys. D Appl. Phys. 1995, 28, 2443–2450. [Google Scholar] [CrossRef]
- Ng, G.K.L.; Jarfors, A.E.W.; Bi, G.; Zheng, H.Y. Porosity Formation and Gas Bubble Retention in Laser Metal Deposition. Appl. Phys. A 2009, 97, 641–649. [Google Scholar] [CrossRef]
- Harvey, J.-P.; Chartrand, P. Modeling the Hydrogen Solubility in Liquid Aluminum Alloys. Metall. Mater. Trans. B 2010, 41, 908–924. [Google Scholar] [CrossRef]
- Aboulkhair, N.T.; Everitt, N.M.; Ashcroft, I.; Tuck, C. Reducing Porosity in AlSi10Mg Parts Processed by Selective Laser Melting. Addit. Manuf. 2014, 1–4, 77–86. [Google Scholar] [CrossRef]
- du Plessis, A.; Macdonald, E. Hot Isostatic Pressing in Metal Additive Manufacturing: X-ray Tomography Reveals Details of Pore Closure. Addit. Manuf. 2020, 34, 101191. [Google Scholar] [CrossRef]
- King, W.E.; Barth, H.D.; Castillo, V.M.; Gallegos, G.F.; Gibbs, J.W.; Hahn, D.E.; Kamath, C.; Rubenchik, A.M. Observation of Keyhole-Mode Laser Melting in Laser Powder-Bed Fusion Additive Manufacturing. J. Mater. Process Technol. 2014, 214, 2915–2925. [Google Scholar] [CrossRef]
- Tweer, J.; Day, R.; Derra, T.; Dorow-Gerspach, D.; Loewenhoff, T.; Wirtz, M.; Linsmeier, C.; Bergs, T.; Natour, G. Initial Experiments to Regenerate the Surface of Plasma-Facing Components by Wire-Based Laser Metal Deposition. Nucl. Mater. Energy 2024, 38, 101577. [Google Scholar] [CrossRef]
- Cross, C.E. On the Origin of Weld Solidification Cracking. In Hot Cracking Phenomena in Welds; Springer: Berlin/Heidelberg, Germany; pp. 3–18. [CrossRef]
- Stopyra, W.; Gruber, K.; Smolina, I.; Kurzynowski, T.; Kuźnicka, B. Laser Powder Bed Fusion of AA7075 Alloy: Influence of Process Parameters on Porosity and Hot Cracking. Addit. Manuf. 2020, 35, 101270. [Google Scholar] [CrossRef]
- Liu, T.-S.; Chen, P.; Qiu, F.; Yang, H.-Y.; Jin, N.T.Y.; Chew, Y.; Wang, D.; Li, R.; Jiang, Q.-C.; Tan, C. Review on Laser Directed Energy Deposited Aluminum Alloys. Int. J. Extrem. Manuf. 2024, 6, 22004. [Google Scholar] [CrossRef]
- Yang, K.; Chen, M.; Zhao, K.; Jia, Z.; Wang, Z.; Qi, H.; Sun, G. Research on Gas Pore Formation and Inhibition Mechanism of High Nitrogen Steel during Laser Direct Metal Deposition. Opt. Laser Technol. 2024, 175, 110788. [Google Scholar] [CrossRef]
- Gomez-Omella, M.; Flores, J.; Sierra, B.; Ferreiro, S.; Hascoët, N.; Chinesta, F. Optimizing Porosity Detection in Wire Laser Metal Deposition Processes through Data-Driven AI Classification Techniques. Eng. Fail. Anal. 2023, 152, 107464. [Google Scholar] [CrossRef]
- Bernauer, C.; Meinzinger, L.; Zapata, A.; Zhao, X.F.; Baehr, S.; Zaeh, M.F. Design and Investigation of a Novel Local Shielding Gas Concept for Laser Metal Deposition with Coaxial Wire Feeding. Appl. Sci. 2023, 13, 5121. [Google Scholar] [CrossRef]
- Li, G.; Zhang, J.; Shi, T.; Shi, J.; Cheng, D.; Lu, L.; Shi, S. Experimental Investigation on Laser Metal Deposition of Ti-6Al-4V Alloy with Coaxial Local Shielding Gas Nozzle. J. Mater. Eng. Perform. 2020, 29, 7821–7829. [Google Scholar] [CrossRef]
- Arbo, S.M.; Tomovic-Petrovic, S.; Aunemo, J.; Dahle, N.; Jensrud, O. On Weldability of Aerospace Grade Al-Cu-Li Alloy AA2065 by Wire-Feed Laser Metal Deposition. J. Adv. Join. Process. 2022, 5, 100096. [Google Scholar] [CrossRef]
- Barroi, A.; Schwarz, N.; Herm, J.; Bielefeld, T.; Kaierle, S. A Small Volume, Local Shielding Gas Chamber with Low Gas Consumption for Laser Wire Additive Manufacturing of Bigger Titanium Parts; University of Texas at Austin: Austin, TX, USA, 2023. [Google Scholar]
- Kelbassa, J.; Gasser, A.; Bremer, J.; Pütsch, O.; Poprawe, R.; Henrich Schleifenbaum, J. Equipment and Process Windows for Laser Metal Deposition with Coaxial Wire Feeding. J. Laser Appl. 2019, 31, 022320. [Google Scholar] [CrossRef]
- Teichmann, E.W.; Kelbassa, J.; Gasser, A.; Tarner, S.; Schleifenbaum, J.H. Effect of Wire Feeder Force Control on Laser Metal Deposition Process Using Coaxial Laser Head. J. Laser Appl. 2021, 33, 012041. [Google Scholar] [CrossRef]
- Mbodj, N.G.; Abuabiah, M.; Plapper, P.; El Kandaoui, M.; Yaacoubi, S. Bead Geometry Prediction in Laser-Wire Additive Manufacturing Process Using Machine Learning: Case of Study. Appl. Sci. 2021, 11, 11949. [Google Scholar] [CrossRef]
- Misra, D.; Sundararajan, V.; Wright, P.K. Zig-Zag Tool Path Generation for Sculptured Surface Finishing. In Geometric and Algorithmic Aspects of Computer-Aided Design and Manufacturing; GE Global Research Center: Bangalore, India; Department of Mechanical Engineering, University of California: Berkeley, CA, USA, 2003. [Google Scholar]
- Bock, F.E.; Herrnring, J.; Froend, M.; Enz, J.; Kashaev, N.; Klusemann, B. Experimental and Numerical Thermo-Mechanical Analysis of Wire-Based Laser Metal Deposition of Al-Mg Alloys. J. Manuf. Process 2021, 64, 982–995. [Google Scholar] [CrossRef]
- Nickel, A.H.; Barnett, D.M.; Prinz, F.B. Thermal Stresses and Deposition Patterns in Layered Manufacturing. Mater. Sci. Eng. A 2001, 317, 59–64. [Google Scholar] [CrossRef]
- Singh, S.N.; Deoghare, A.B. Microstructure, Micro-Hardness and Tensile Properties of Ti6Al4V Manufactured by High Layer-Thickness Wire-Feed Multi-Laser Directed Energy Deposition. Mater. Lett. 2023, 340, 134207. [Google Scholar] [CrossRef]
- Cai, Y.; Wang, Y.; Chen, H.; Xiong, J. Molten Pool Behaviors and Forming Characteristics in Wire-Laser Directed Energy Deposition with Beam Oscillation. J. Mater. Process Technol. 2024, 326, 118326. [Google Scholar] [CrossRef]
- Gräfe, S.; Dadgar, M.; Day, R.; Bergs, T. Laser Metal Deposition with Wire of Inconel 718 on Pre-Heated Substrates. In Proceedings of the Lasers in Manufacturing Conference, Munich, Germany, 26–29 June 2023. [Google Scholar]
- Maliutina, I.N.; Si-Mohand, H.; Piolet, R.; Missemer, F.; Popelyukh, A.I.; Belousova, N.S.; Bertrand, P. Laser Cladding of γ-TiAl Intermetallic Alloy on Titanium Alloy Substrates. Metall. Mater. Trans. A 2016, 47, 378–387. [Google Scholar] [CrossRef]
- Ding, J.; Colegrove, P.; Mehnen, J.; Williams, S.; Wang, F.; Almeida, P.S. A Computationally Efficient Finite Element Model of Wire and Arc Additive Manufacture. Int. J. Adv. Manuf. Technol. 2014, 70, 227–236. [Google Scholar] [CrossRef]
- Su, G.; Shi, Y.; Li, G.; Zhang, G.; Xu, Y. Improving the Deposition Efficiency and Mechanical Properties of Additive Manufactured Inconel 625 through Hot Wire Laser Metal Deposition. J. Mater. Process Technol. 2023, 322, 118175. [Google Scholar] [CrossRef]
- Baghdadchi, A.; Hosseini, V.A.; Valiente Bermejo, M.A.; Axelsson, B.; Harati, E.; Högström, M.; Karlsson, L. Wire Laser Metal Deposition of 22% Cr Duplex Stainless Steel: As-Deposited and Heat-Treated Microstructure and Mechanical Properties. J. Mater. Sci. 2022, 57, 9556–9575. [Google Scholar] [CrossRef]
- Liu, W.; Liu, S.; Ma, J.; Kovacevic, R. Real-Time Monitoring of the Laser Hot-Wire Welding Process. Opt. Laser Technol. 2014, 57, 66–76. [Google Scholar] [CrossRef]
- Liu, S.; Liu, W.; Harooni, M.; Ma, J.; Kovacevic, R. Real-Time Monitoring of Laser Hot-Wire Cladding of Inconel 625. Opt. Laser Technol. 2014, 62, 124–134. [Google Scholar] [CrossRef]
- Huang, W.; Xiao, J.; Chen, S.; Jiang, X. Control of Wire Melting Behavior during Laser Hot Wire Deposition of Aluminum Alloy. Opt. Laser Technol. 2022, 150, 107978. [Google Scholar] [CrossRef]
- Su, G.; Shi, Y.; Li, G.; Zhang, G.; Xu, Y. Highly-Efficient Additive Manufacturing of Inconel 625 Thin Wall Using Hot-Wire Laser Metal Deposition: Process Optimization, Microstructure, and Mechanical Properties. Opt. Laser Technol. 2024, 175, 110763. [Google Scholar] [CrossRef]
- Spencer, J.D.; Dickens, P.M.; Wykes, C. Rapid Prototyping of Metal Parts by Three-Dimensional Welding. Proc. Inst. Mech. Eng. B J. Eng. Manuf. 1998, 212, 175–182. [Google Scholar] [CrossRef]
- Lee, Y.; Bandari, Y.; Nandwana, P.; Gibson Brian, T.; Richardson, B.; Simunovic, S. Effect of Interlayer Cooling Time, Constraint and Tool Path Strategy on Deformation of Large Components Made by Laser Metal Deposition with Wire. Appl. Sci. 2019, 9, 5115. [Google Scholar] [CrossRef]
- Hua, Z.; Xiong, L.; Zhang, M.; Wang, C.; Mi, G.; Jiang, P. Microstructure Evolution and Tribological Properties of (TiB+TiC)/Ti–6Al–4V Composites Fabricated via In Situ Laser-Directed Energy Deposition of Wire and Powders in an Underwater Environment. Compos. B Eng. 2023, 263, 110817. [Google Scholar] [CrossRef]
- Nakano, Y.; Morita, D.; Shinohara, N.; Ukai, Y.; Sumi, N.; Hashimoto, T. Fatigue Performance of Titanium–Aluminum–Vanadium Alloy Fabricated by Laser-Wire-Based Directed Energy Deposition Forming Dot-Shaped Beads. Mater. Trans. 2023, 64, 296–302. [Google Scholar] [CrossRef]
- Hatala, G.W.; Wang, Q.; Reutzel, E.W.; Fisher, C.R.; Semple, J.K. A Thermo-Mechanical Analysis of Laser Hot Wire Additive Manufacturing of Nab. Metal 2021, 11, 1023. [Google Scholar] [CrossRef]
- Menon, N.; Sawyer, B.A.; Jamieson, C.D.; Reutzel, E.W.; Basak, A. A Comparison of Microstructure and Microhardness Properties of IN718 Fabricated via Powder- and Wire-Fed Laser-Directed Energy Deposition. Materials 2023, 16, 1129. [Google Scholar] [CrossRef] [PubMed]
- Mani, M.; Lane, B.; Donmez, A.; Feng, S.; Moylan, S.; Fesperman, R. Measurement Science Needs for Real-Time Control of Additive Manufacturing Powder Bed Fusion Processes; NIST Interagency/Internal Report (NISTIR), National Institute of Standards and Technology: Gaithersburg, Maryland, 2015. [CrossRef]
- Schulz, M.; Klocke, F.; Riepe, J.; Klingbeil, N.; Arntz, K. Process Optimization of Wire-Based Laser Metal Deposition of Titanium. J. Eng. Gas. Turbine Power 2019, 141, 052102. [Google Scholar] [CrossRef]
- Gibson, B.T.; Bandari, Y.K.; Richardson, B.S.; Henry, W.C.; Vetland, E.J.; Sundermann, T.W.; Love, L.J. Melt Pool Size Control through Multiple Closed-Loop Modalities in Laser-Wire Directed Energy Deposition of Ti-6Al-4V. Addit. Manuf. 2020, 32, 100993. [Google Scholar] [CrossRef]
- Stehmar, C.; Gipperich, M.; Kogel-Hollacher, M.; Velazquez Iturbide, A.; Schmitt, R.H. Inline Optical Coherence Tomography for Multidirectional Process Monitoring in a Coaxial LMD-w Process. Appl. Sci. 2022, 12, 2701. [Google Scholar] [CrossRef]
- Iravani-Tabrizipour, M.; Toyserkani, E. An Image-Based Feature Tracking Algorithm for Real-Time Measurement of Clad Height. Mach. Vis. Appl. 2007, 18, 343–354. [Google Scholar] [CrossRef]
- Song, L.; Bagavath-Singh, V.; Dutta, B.; Mazumder, J. Control of Melt Pool Temperature and Deposition Height during Direct Metal Deposition Process. Int. J. Adv. Manuf. Technol. 2012, 58, 247–256. [Google Scholar] [CrossRef]
- Davis, T.A.; Shin, Y.C. Vision-Based Clad Height Measurement. Mach. Vis. Appl. 2011, 22, 129–136. [Google Scholar] [CrossRef]
- Fathi, A.; Khajepour, A.; Toyserkani, E.; Durali, M. Clad Height Control in Laser Solid Freeform Fabrication Using a Feedforward PID Controller. Int. J. Adv. Manuf. Technol. 2007, 35, 280–292. [Google Scholar] [CrossRef]
- Bi, G.; Gasser, A.; Wissenbach, K.; Drenker, A.; Poprawe, R. Identification and Qualification of Temperature Signal for Monitoring and Control in Laser Cladding. Opt. Lasers Eng. 2006, 44, 1348–1359. [Google Scholar] [CrossRef]
- Hofman, J.T.; Pathiraj, B.; van Dijk, J.; de Lange, D.F.; Meijer, J. A Camera Based Feedback Control Strategy for the Laser Cladding Process. J. Mater. Process Technol. 2012, 212, 2455–2462. [Google Scholar] [CrossRef]
- Hu, D.; Kovacevic, R. Sensing, Modeling and Control for Laser-Based Additive Manufacturing. Int. J. Mach. Tools Manuf. 2003, 43, 51–60. [Google Scholar] [CrossRef]
- Guerra, M.G.; Mazzarisi, M.; Latte, M.; Lavecchia, F.; Campanelli, S.; Galantucci, L.M. Off-Axis Monitoring of the Melt Pool Spatial Information in Laser Metal Deposition Process. Procedia CIRP 2024, 121, 144–149. [Google Scholar] [CrossRef]
- Heralić, A.; Christiansson, A.K.; Ottosson, M.; Lennartson, B. Increased Stability in Laser Metal Wire Deposition through Feedback from Optical Measurements. Opt. Lasers Eng. 2010, 48, 478–485. [Google Scholar] [CrossRef]
- Nie, Z.; Wang, G.; McGuffin-Cawley, J.D.; Narayanan, B.; Zhang, S.; Schwam, D.; Kottman, M.; Rong, Y. Experimental Study and Modeling of H13 Steel Deposition Using Laser Hot-Wire Additive Manufacturing. J. Mater. Process Technol. 2016, 235, 171–186. [Google Scholar] [CrossRef]
- Buhr, M.; Weber, J.; Wenzl, J.P.; Möller, M.; Emmelmann, C. Influences of Process Conditions on Stability of Sensor Controlled Robot-Based Laser Metal Deposition. In Procedia CIRP; Elsevier B.V.: Amsterdam, The Netherlands, 2018; Volume 74, pp. 149–153. [Google Scholar] [CrossRef]
- Flores-Prado, J.; Saéz-de-Heredia, I.G.; Cabanes-Axpe, E.I. Thermal Monitoring and Control by Infrared Camera in the Manufacture of Parts with Laser Metal Deposition. Dyna 2020, 95, 360–363. [Google Scholar] [CrossRef] [PubMed]
- Schmoeller, M.; Stadter, C.; Liebl, S.; Zaeh, M.F. Inline Weld Depth Measurement for High Brilliance Laser Beam Sources Using Optical Coherence Tomography. J. Laser Appl. 2019, 31, 022409. [Google Scholar] [CrossRef]
- Stadter, C.; Schmoeller, M.; Zeitler, M.; Tueretkan, V.; Munzert, U.; Zaeh, M.F. Process Control and Quality Assurance in Remote Laser Beam Welding by Optical Coherence Tomography. J. Laser Appl. 2019, 31, 022408. [Google Scholar] [CrossRef]
- Kogel-Hollacher, M.; Strebel, M.; Staudenmaier, C.; Schneider, H.-I.; Regulin, D. OCT Sensor for Layer Height Control in DED Using SINUMERIK® Controller. In Laser 3D Manufacturing VII; Helvajian, H., Gu, B., Chen, H., Eds.; SPIE: Washington, DC, USA, 2020; p. 23. [Google Scholar] [CrossRef]
- Tapia, G.; Elwany, A. A Review on Process Monitoring and Control in Metal-Based Additive Manufacturing. J. Manuf. Sci. Eng. 2014, 136, 060801. [Google Scholar] [CrossRef]
- Gibson, B.T.; Richardson, B.S.; Sundermann, T.W.; Love, L.J. Beyond the Toolpath: Site-Specific Melt Pool Size Control Enables Printing of Extra-Toolpath Geometry in Laser Wire-Based Directed Energy Deposition. Appl. Sci. 2019, 9, 4355. [Google Scholar] [CrossRef]
- Mbodj, N.G.; Abuabiah, M.; Plapper, P.; El Kandaoui, M.; Yaacoubi, S. Modeling and Control of Layer Height in Laser Wire Additive Manufacturing. Materials 2022, 15, 4479. [Google Scholar] [CrossRef] [PubMed]
- Chen, L.; Yao, X.; Chew, Y.; Weng, F.; Moon, S.K.; Bi, G. Data-Driven Adaptive Control for Laser-Based Additive Manufacturing with Automatic Controller Tuning. Appl. Sci. 2020, 10, 7967. [Google Scholar] [CrossRef]
- Wang, Q.; Li, J.; Gouge, M.; Nassar, A.R.; (Pan) Michaleris, P.; Reutzel, E.W. Physics-Based Multivariable Modeling and Feedback Linearization Control of Melt-Pool Geometry and Temperature in Directed Energy Deposition. J. Manuf. Sci. Eng. 2017, 139, 021013. [Google Scholar] [CrossRef]
- Bernauer, C.; Leitner, P.; Zapata, A.; Garkusha, P.; Grabmann, S.; Schmoeller, M.; Zaeh, M.F. Segmentation-Based Closed-Loop Layer Height Control for Enhancing Stability and Dimensional Accuracy in Wire-Based Laser Metal Deposition. Robot. Comput. Integr. Manuf. 2024, 86, 102683. [Google Scholar] [CrossRef]
- Baghdadchi, A. Directed Energy Deposition Additive Manufacturing and Welding of Duplex Stainless Steel Using Laser Beam; University West, Division of Welding Technology: Trollhättan, Sweden, 2024. [Google Scholar]
- Pinkerton, A.J. Laser Direct Metal Deposition: Theory and Applications in Manufacturing and Maintenance. In Advances in Laser Materials Processing; Elsevier: Amsterdam, The Netherlands, 2010; pp. 461–491. [Google Scholar] [CrossRef]
- Yang, Z.; Verma, A.K.; Smith, L.; Guzel, A.; Chen, H.; Pistorius, P.C.; Rollett, A.D. Predicting Melt Pool Dimensions for Wire-Feed Directed Energy Deposition Process. Integr. Mater. Manuf. Innov. 2022, 11, 532–544. [Google Scholar] [CrossRef]
- Bayat, M.; Dong, W.; Thorborg, J.; To, A.C.; Hattel, J.H. A Review of Multi-Scale and Multi-Physics Simulations of Metal Additive Manufacturing Processes with Focus on Modeling Strategies. Addit. Manuf. 2021, 47, 102278. [Google Scholar] [CrossRef]
- Lalas, C.; Tsirbas, K.; Salonitis, K.; Chryssolouris, G. An Analytical Model of the Laser Clad Geometry. Int. J. Adv. Manuf. Technol. 2007, 32, 34–41. [Google Scholar] [CrossRef]
- Liu, J.; Li, L. Study on Cross-Section Clad Profile in Coaxial Single-Pass Cladding with a Low-Power Laser. Opt. Laser Technol. 2005, 37, 478–482. [Google Scholar] [CrossRef]
- Liu, Y.; Wang, L.; Brandt, M. Model Predictive Control of Laser Metal Deposition. Int. J. Adv. Manuf. Technol. 2019, 105, 1055–1067. [Google Scholar] [CrossRef]
- Corbin, D.J.; Nassar, A.R.; Reutzel, E.W.; Beese, A.M.; Kistler, N.A. Effect of Directed Energy Deposition Processing Parameters on Laser Deposited Inconel® 718: External Morphology. J. Laser Appl. 2017, 29, 022001. [Google Scholar] [CrossRef]
- Guo, S.; Agarwal, M.; Cooper, C.; Tian, Q.; Gao, R.X.; Guo, W.G.; Guo, Y.B. Machine Learning for Metal Additive Manufacturing: Towards a Physics-Informed Data-Driven Paradigm. Journal of Manufacturing Systems; Elsevier B.V.: Amsterdam, The Netherlands, 2022; pp. 145–163. [Google Scholar] [CrossRef]
- Bonnín Roca, J.; Vaishnav, P.; Fuchs, E.R.H.; Morgan, M.G. Policy Needed for Additive Manufacturing. Nat. Mater. 2016, 15, 815–818. [Google Scholar] [CrossRef] [PubMed]
- Teng, C.; Gong, H.; Szabo, A.; Dilip, J.J.S.; Ashby, K.; Zhang, S.; Patil, N.; Pal, D.; Stucker, B. Simulating Melt Pool Shape and Lack of Fusion Porosity for Selective Laser Melting of Cobalt Chromium Components. J. Manuf. Sci. Eng. 2017, 139, 011009. [Google Scholar] [CrossRef]
- Lee, S.; Peng, J.; Shin, D.; Choi, Y.S. Data Analytics Approach for Melt-Pool Geometries in Metal Additive Manufacturing. Sci. Technol. Adv. Mater. 2019, 20, 972–978. [Google Scholar] [CrossRef] [PubMed]
- Xiong, J.; Zhang, G.; Hu, J.; Wu, L. Bead Geometry Prediction for Robotic GMAW-Based Rapid Manufacturing through a Neural Network and a Second-Order Regression Analysis. J. Intell. Manuf. 2014, 25, 157–163. [Google Scholar] [CrossRef]
- Ai, Y.; Yan, Y.; Yuan, P.; Wang, Y. The Numerical Investigation of Cladding Layer Forming Process in Laser Additive Manufacturing with Wire Feeding. Int. J. Therm. Sci. 2024, 196, 108669. [Google Scholar] [CrossRef]
- Chua, B.L.; Ahn, D.G.; Kim, J.G. Influences of Deposition Strategies on Thermo-Mechanical Characteristics of a Multilayer Part Deposited by a Wire Feeding Type DED Process. J. Mech. Sci. Technol. 2019, 33, 5615–5622. [Google Scholar] [CrossRef]
- Liu, S.; Brice, C.; Zhang, X. Hierarchical Bead Materials Multi-Property Design for Wire-Feed Laser Additive Manufacturing. J. Manuf. Process 2022, 80, 546–557. [Google Scholar] [CrossRef]
Figure 1.
W-LDED process variables.
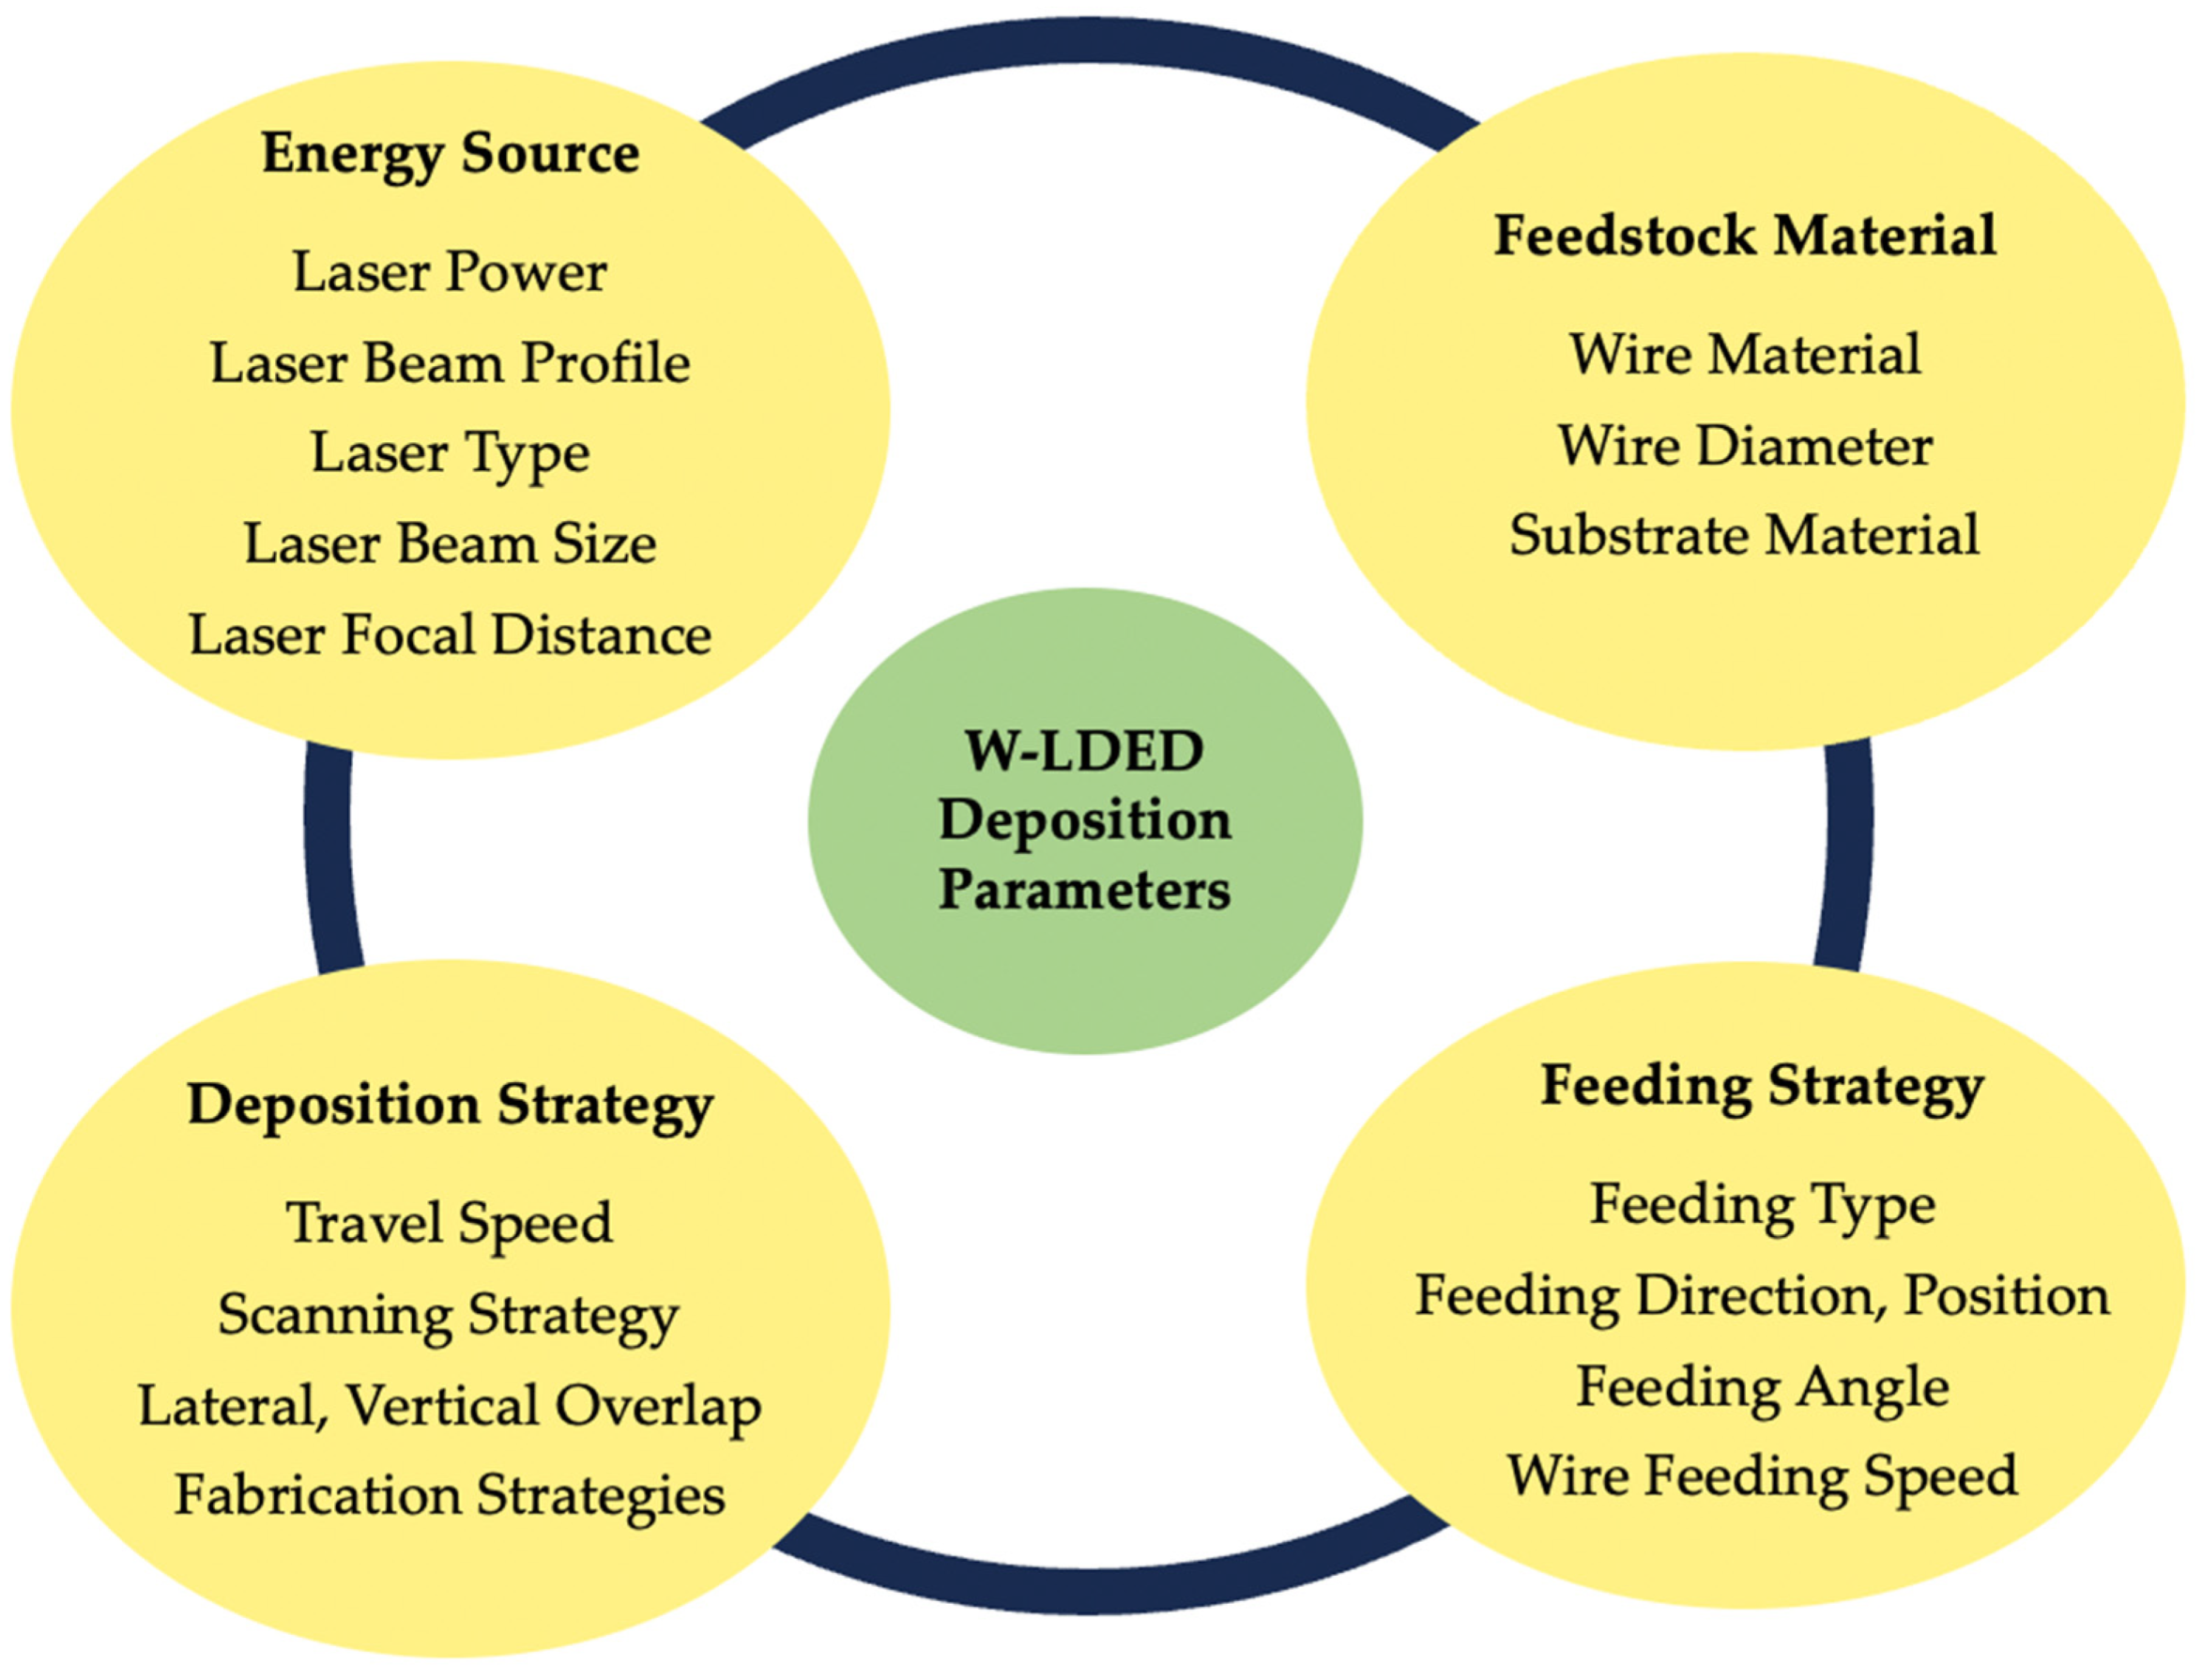
Figure 2.
Schematics of the melt pool with (a) continuous and (b) pulsed lasers.

Figure 4.
Schematic of a three-beam laser: (a) beams at the focal plane, (b) beams at positive defocus, and (c) beams at negative defocus (reproduced or adapted with permission from [100]: copyright 2021, Springer).
Figure 4.
Schematic of a three-beam laser: (a) beams at the focal plane, (b) beams at positive defocus, and (c) beams at negative defocus (reproduced or adapted with permission from [100]: copyright 2021, Springer).

Figure 5.
Schematic of a three-beam laser spot pattern at the (a) focus point and (b,c) increasing defocus distance. (d) Beams completely out of focus are incapable of fully melting the wire.
Figure 5.
Schematic of a three-beam laser spot pattern at the (a) focus point and (b,c) increasing defocus distance. (d) Beams completely out of focus are incapable of fully melting the wire.
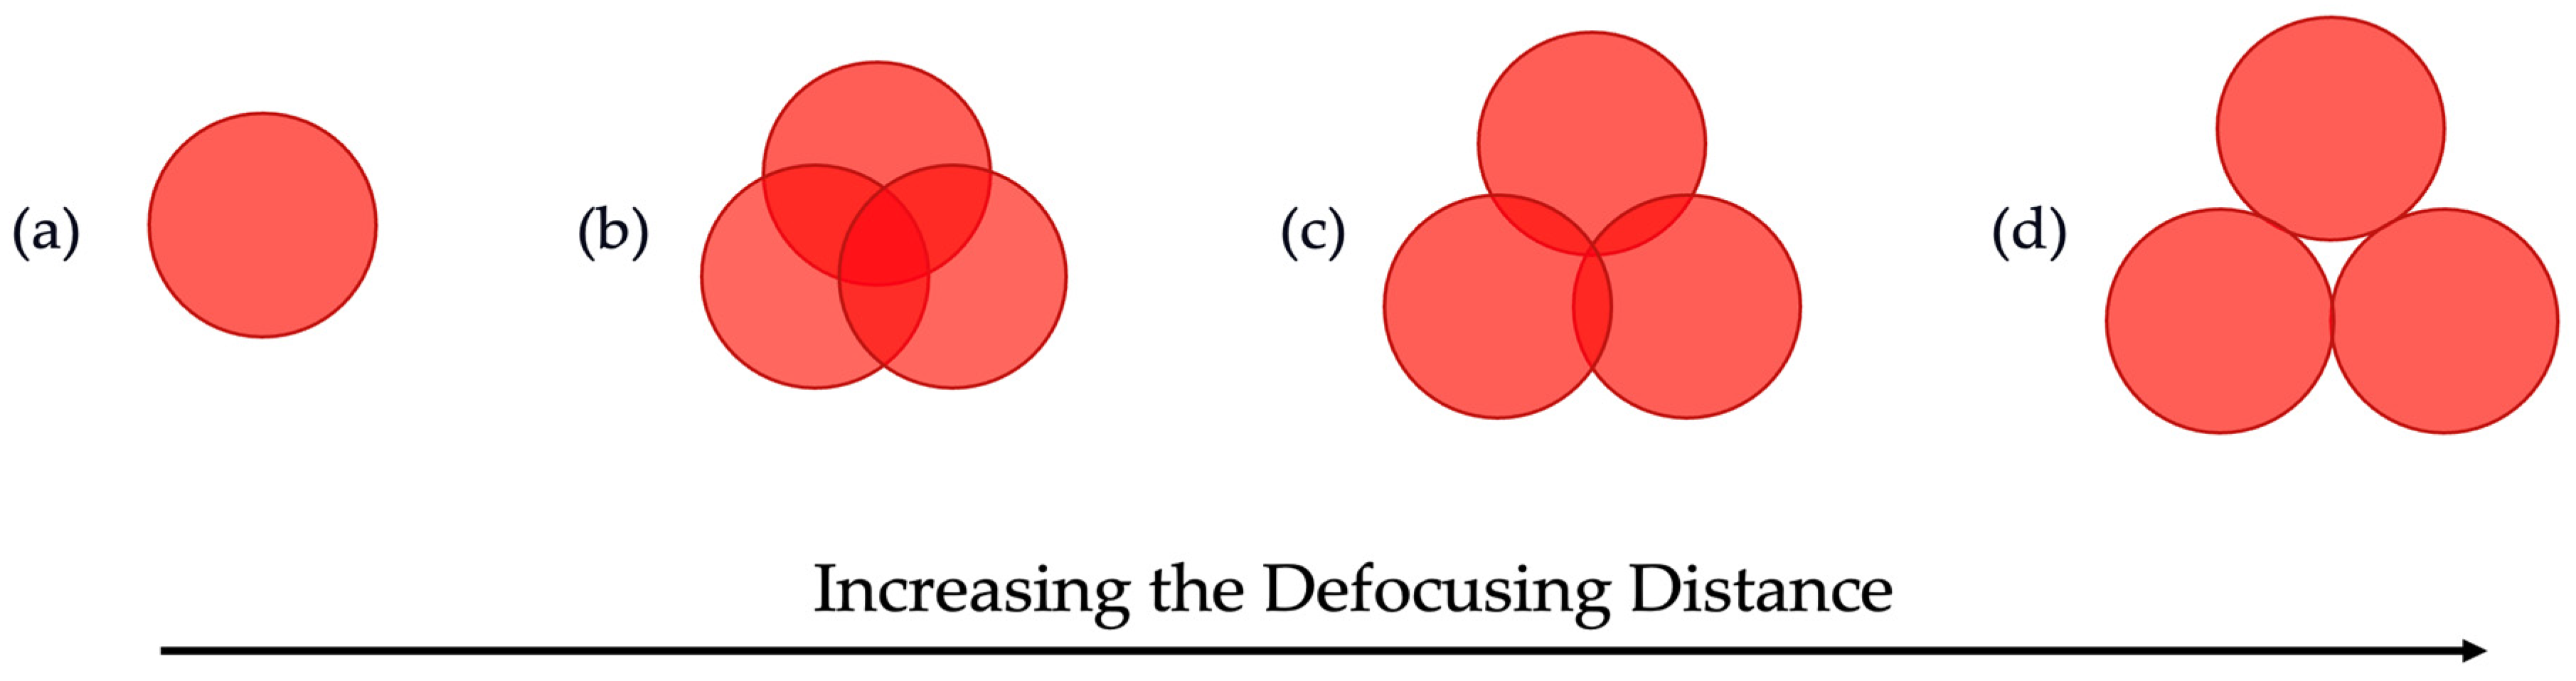
Figure 6.
Deposition using (a) front feeding and (b) back feeding (reproduced with permission from [43]: copyright 2021, Elsevier Ltd.).
Figure 6.
Deposition using (a) front feeding and (b) back feeding (reproduced with permission from [43]: copyright 2021, Elsevier Ltd.).

Figure 7.
Schematics of melt pool generation in laser deposition process.
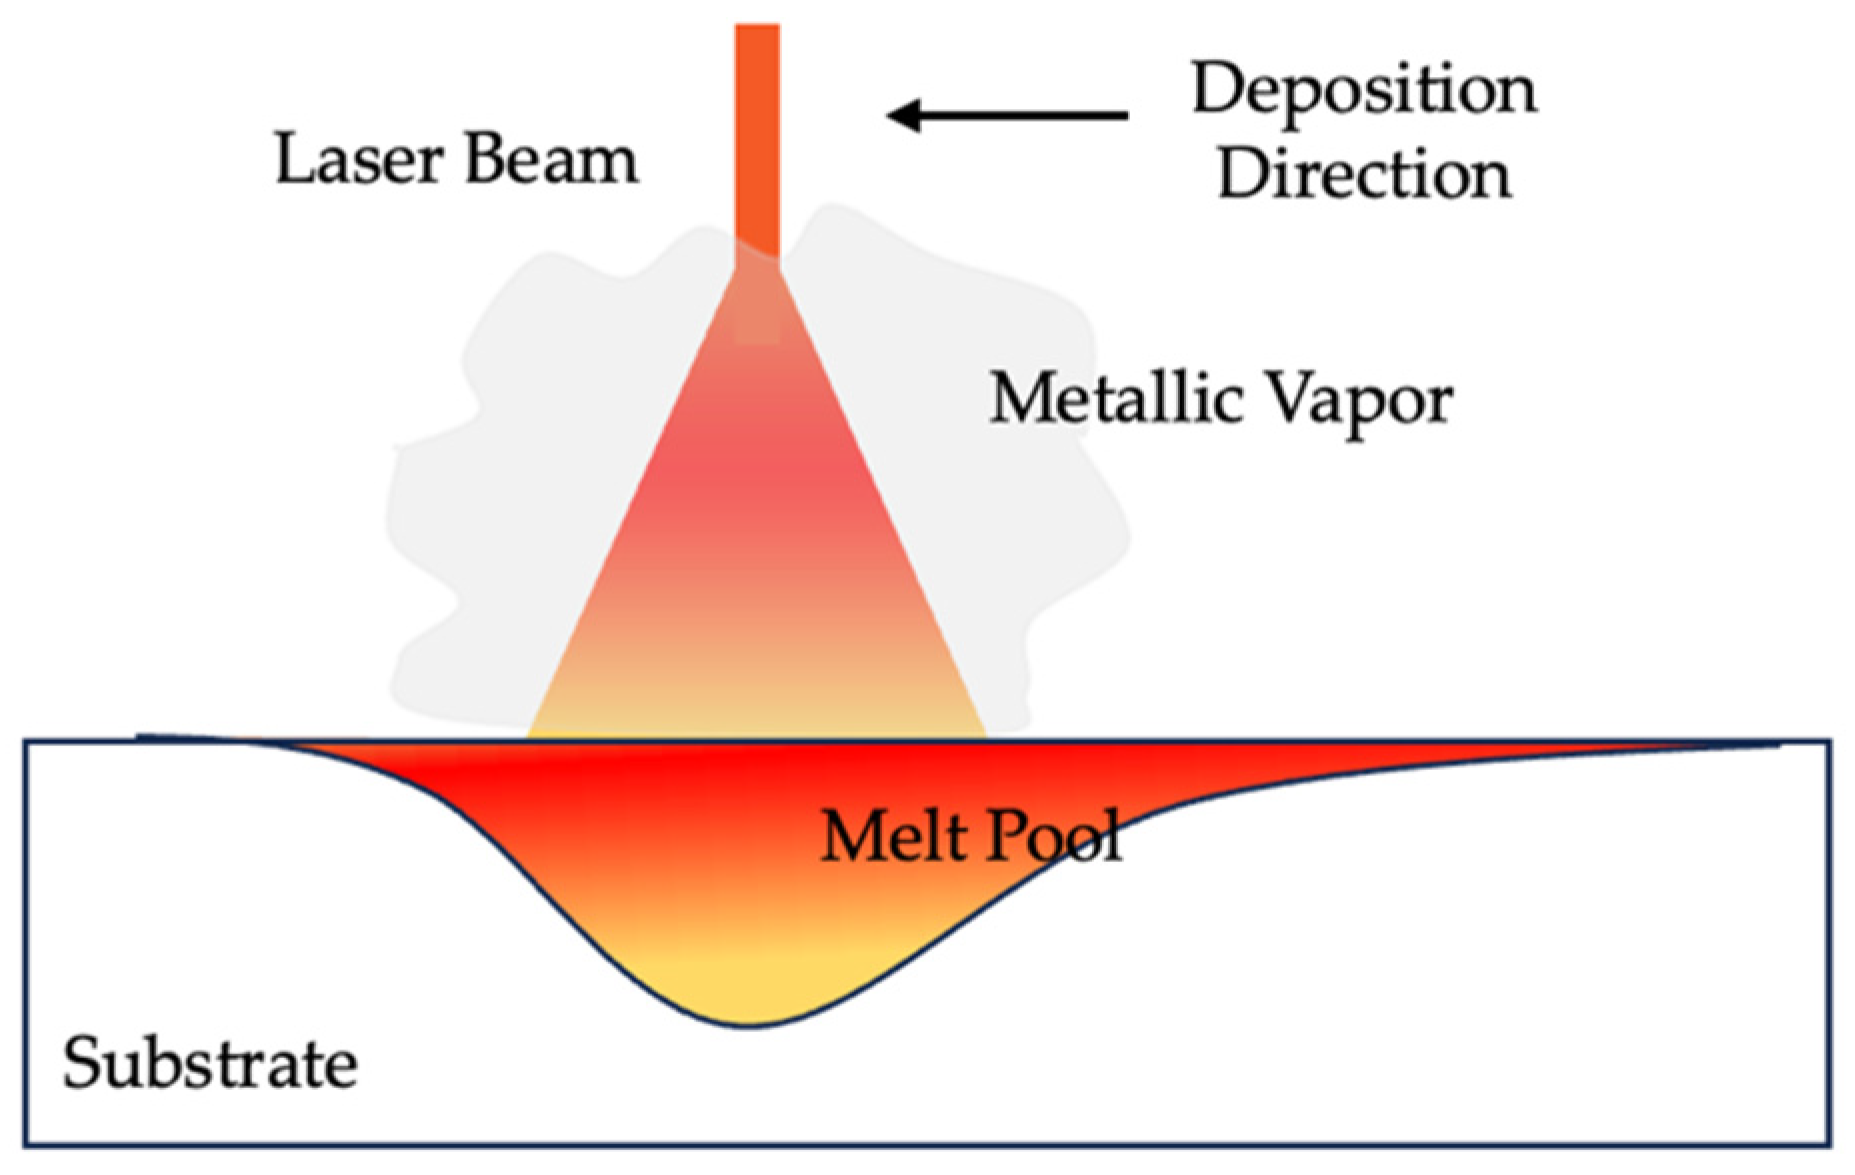
Figure 8.
(a) Leading, center, and trailing edge of melt pool, (b) front feeding, (c) side feeding, and (d) back feeding.
Figure 8.
(a) Leading, center, and trailing edge of melt pool, (b) front feeding, (c) side feeding, and (d) back feeding.

Figure 9.
(a) Coaxial wire feeding and (b) lateral wire feeding at different defocusing distances.
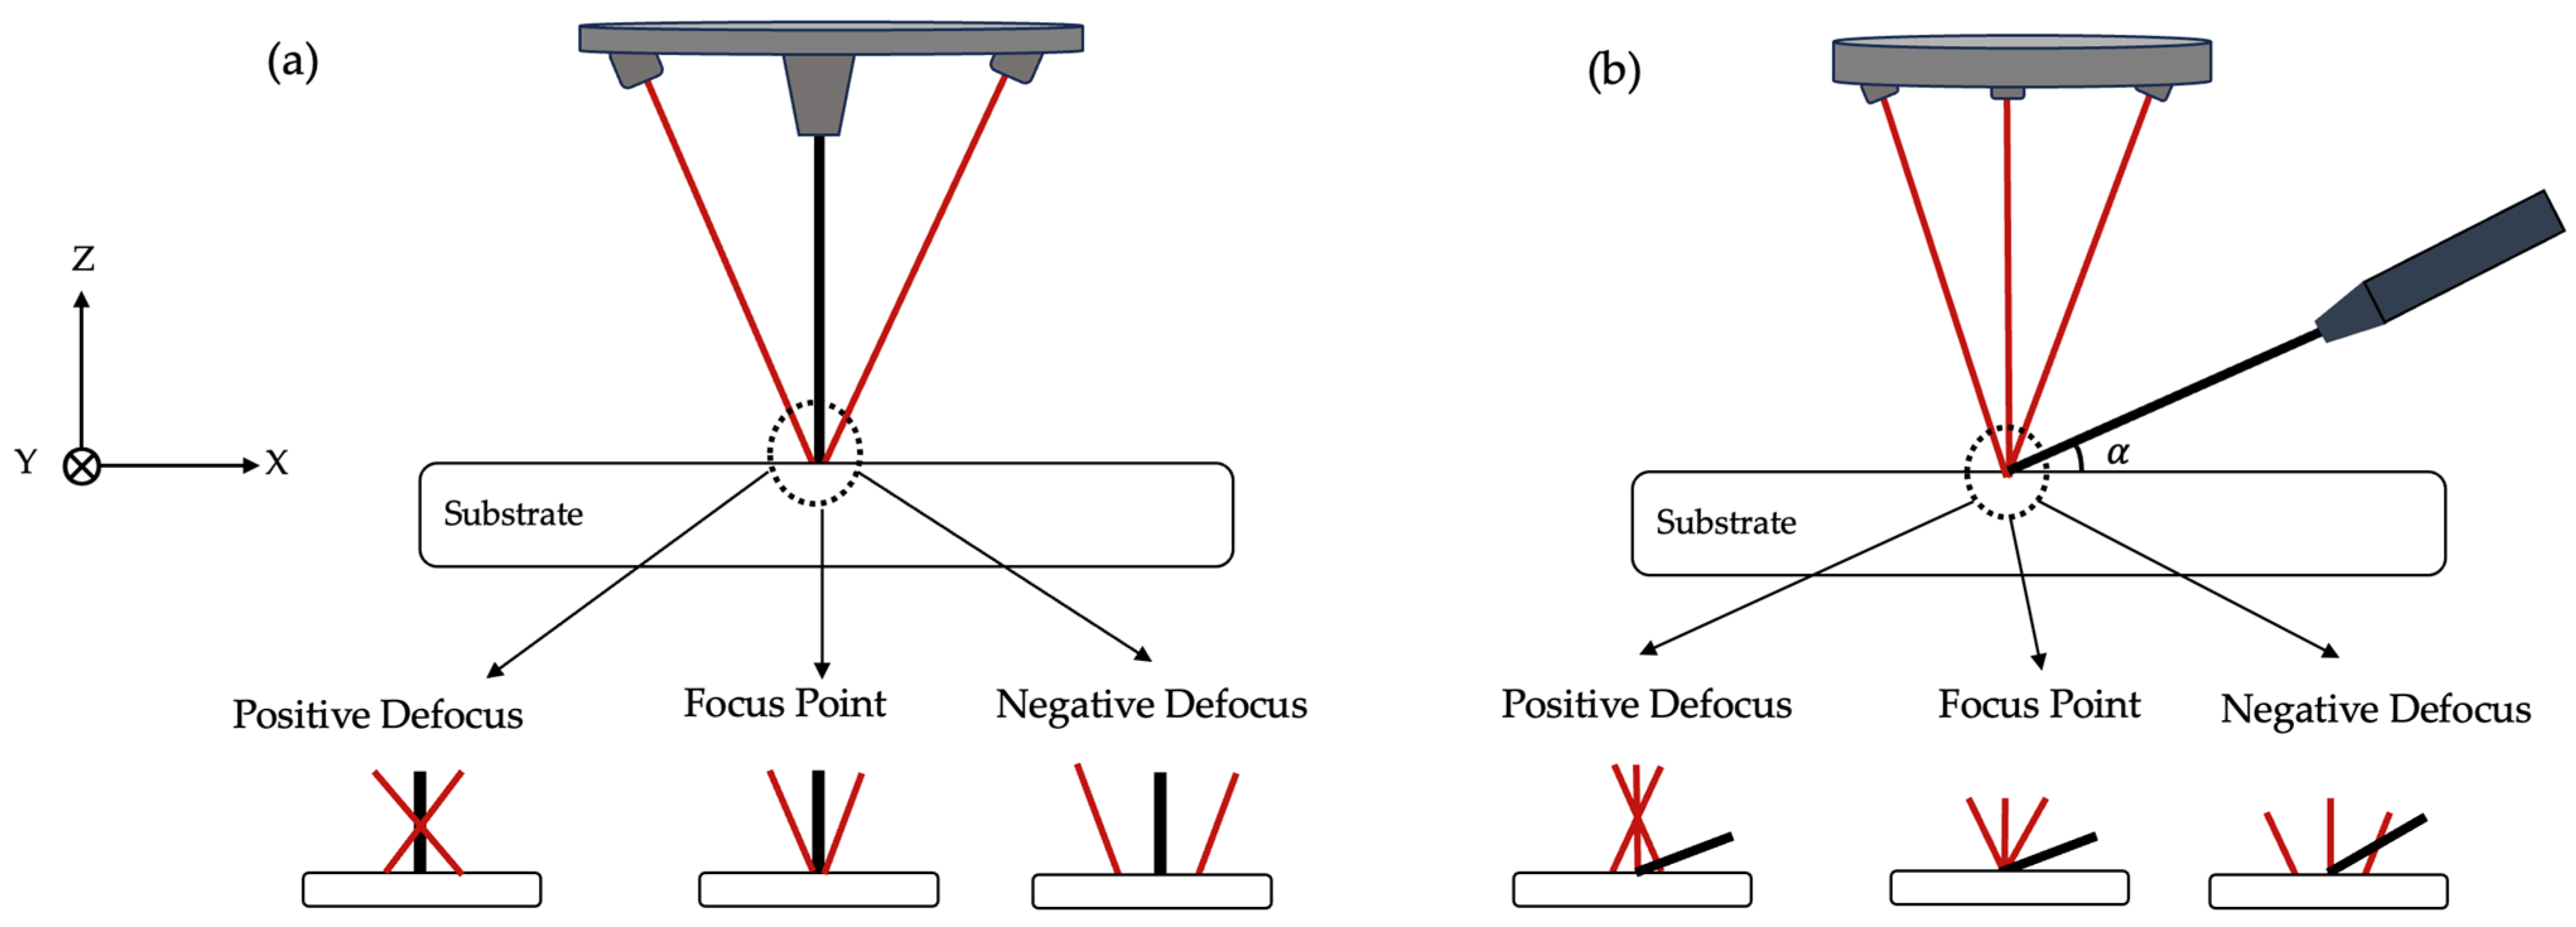
Figure 10.
Schematic representation of the geometry of the bead.
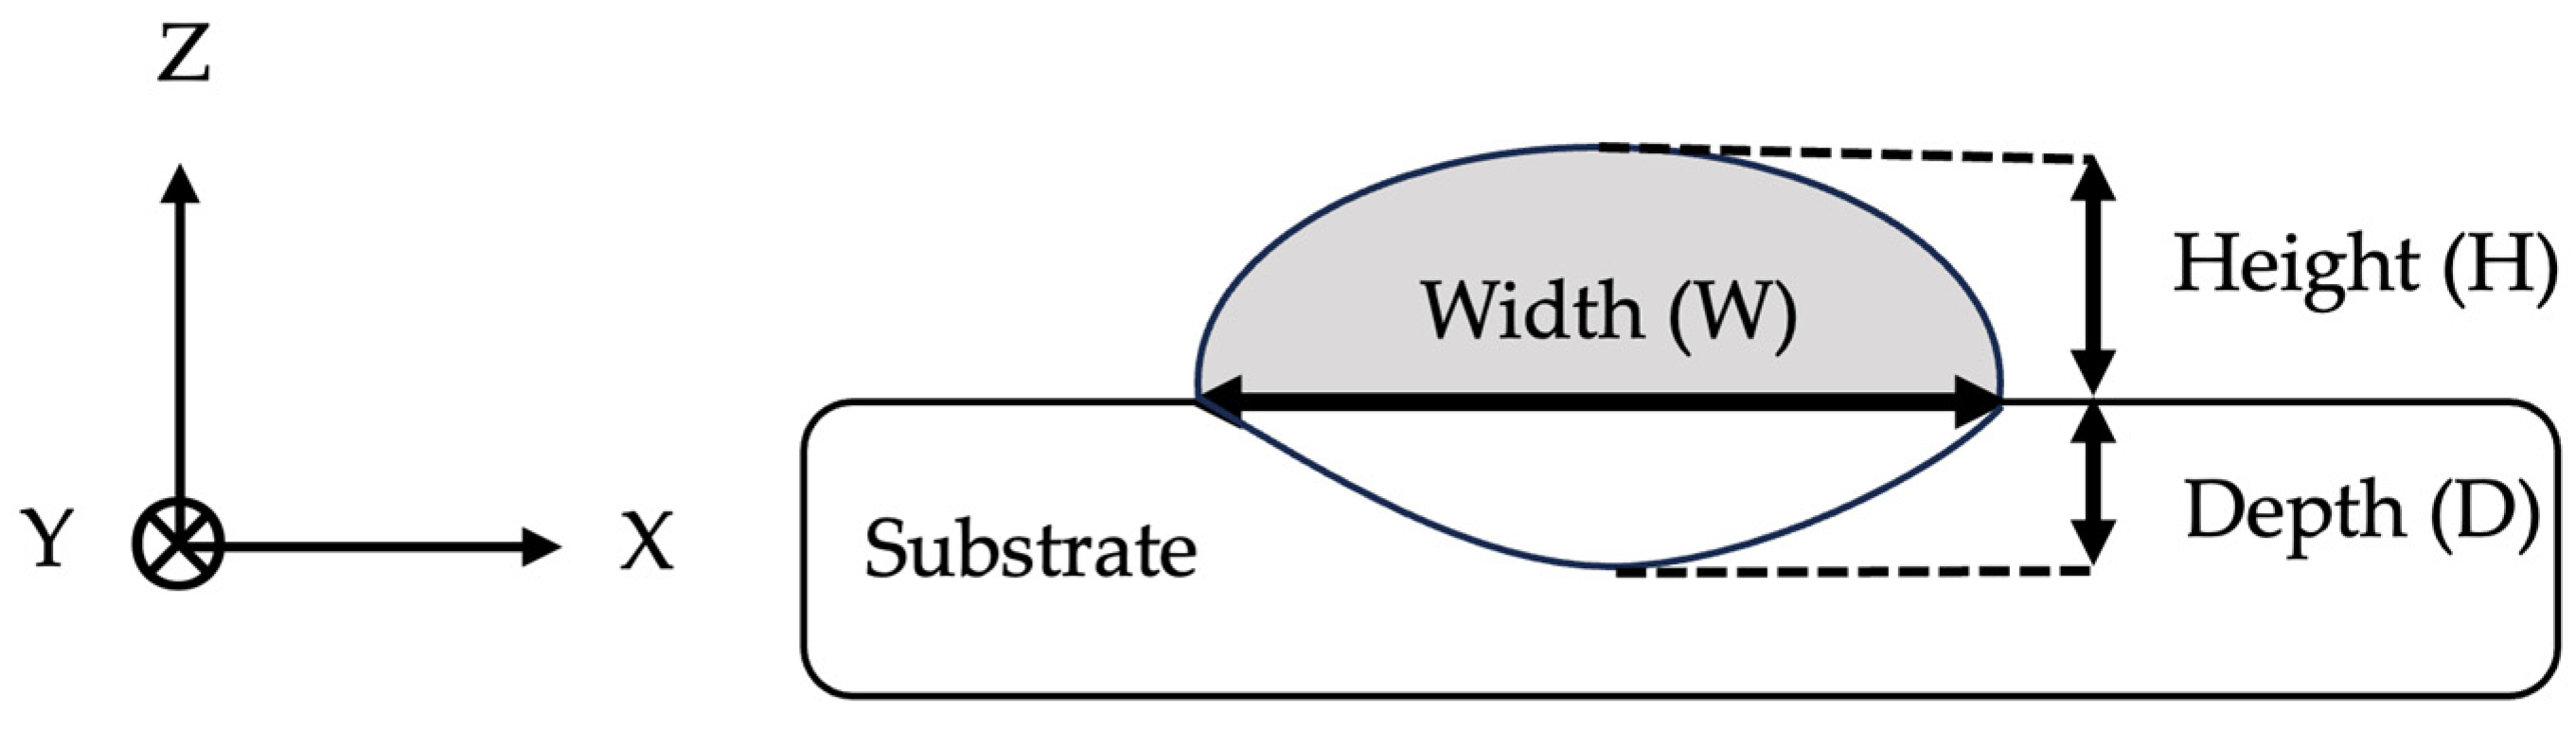
Figure 11.
Schematic trend of bead width and height with increasing (a) laser power, (b) TS, and (c) WFS. The dotted line provided for (c) indicates the deviation observed in the literature.
Figure 11.
Schematic trend of bead width and height with increasing (a) laser power, (b) TS, and (c) WFS. The dotted line provided for (c) indicates the deviation observed in the literature.
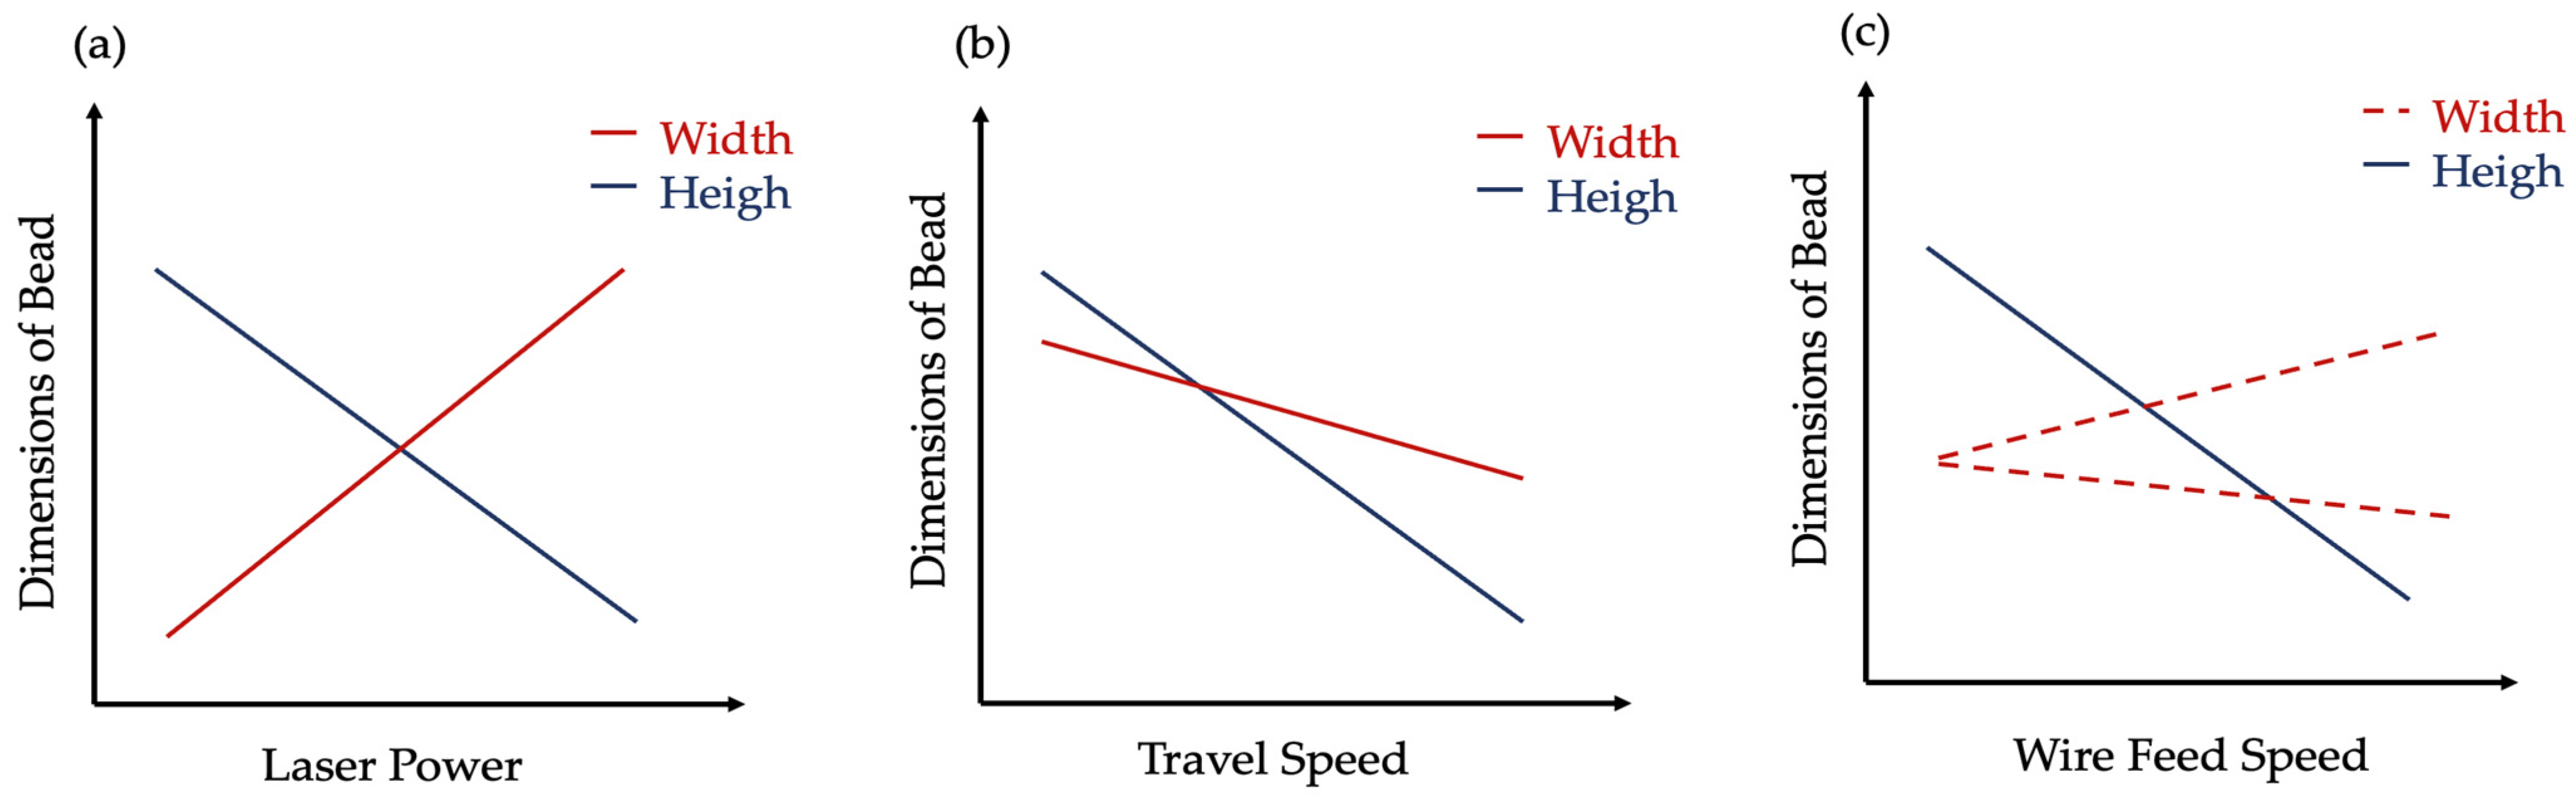
Figure 12.
Schematic representation of bead with (a) low degree of dilution and (b) high degree of dilution.
Figure 12.
Schematic representation of bead with (a) low degree of dilution and (b) high degree of dilution.
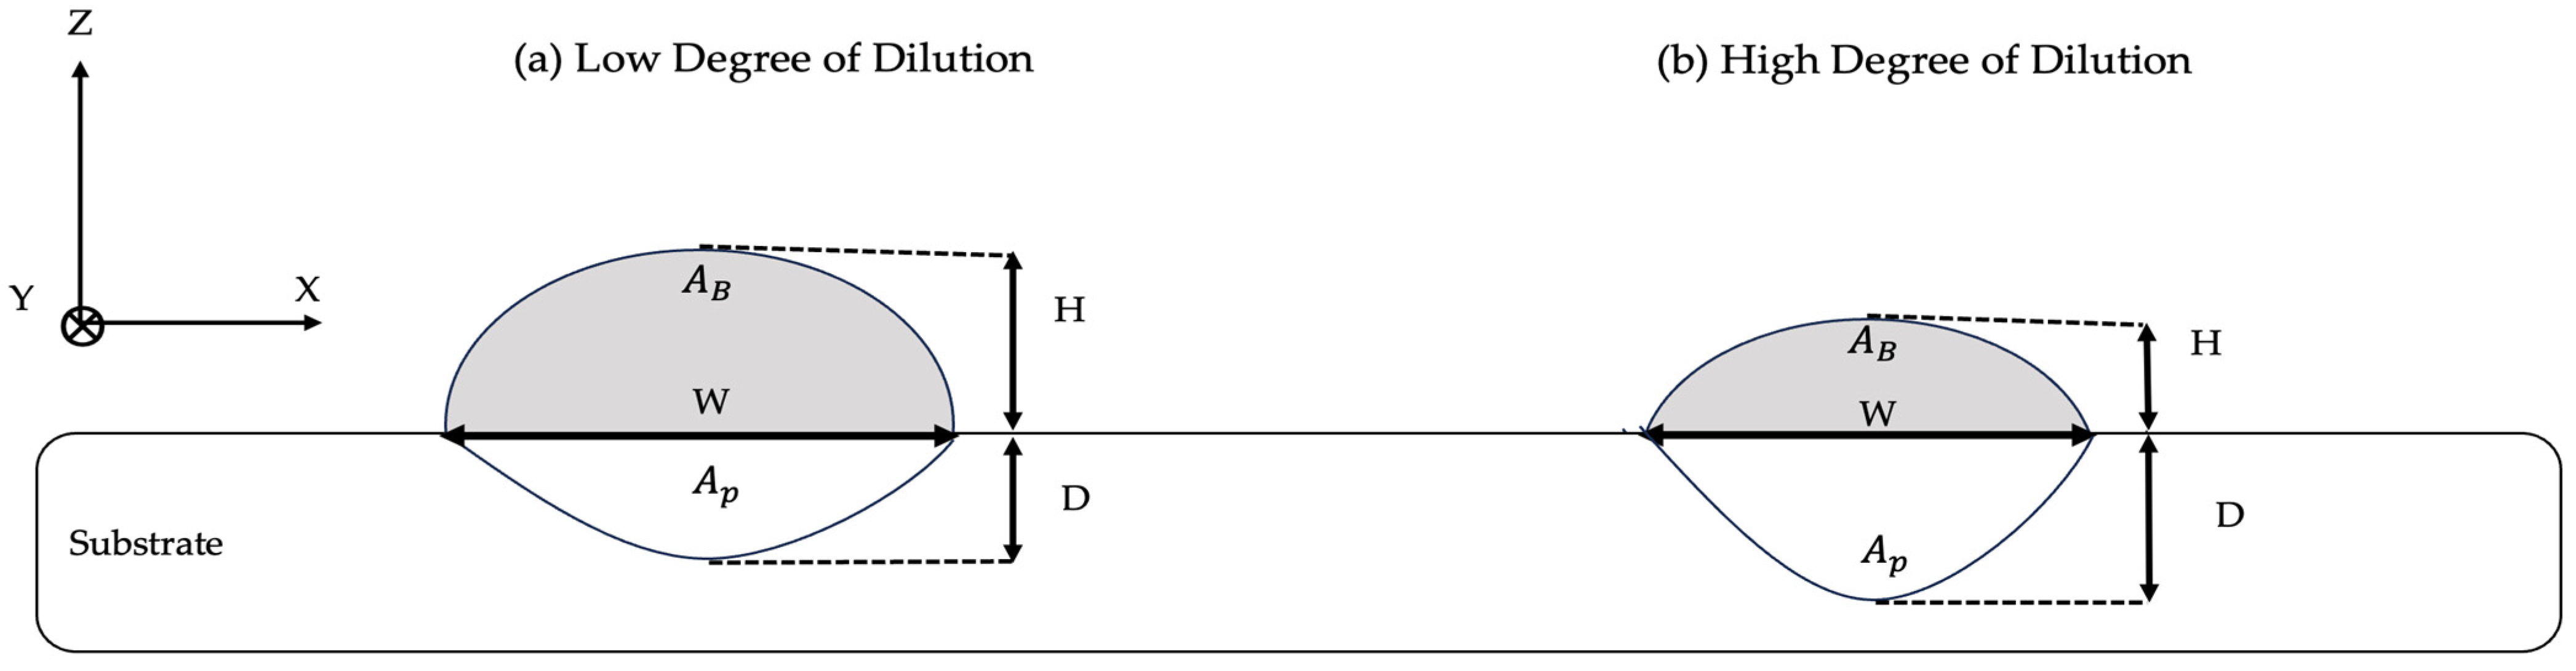
Figure 13.
Schematic representation of bead with (a) high aspect ratio and (b) bead with low aspect ratio.
Figure 13.
Schematic representation of bead with (a) high aspect ratio and (b) bead with low aspect ratio.
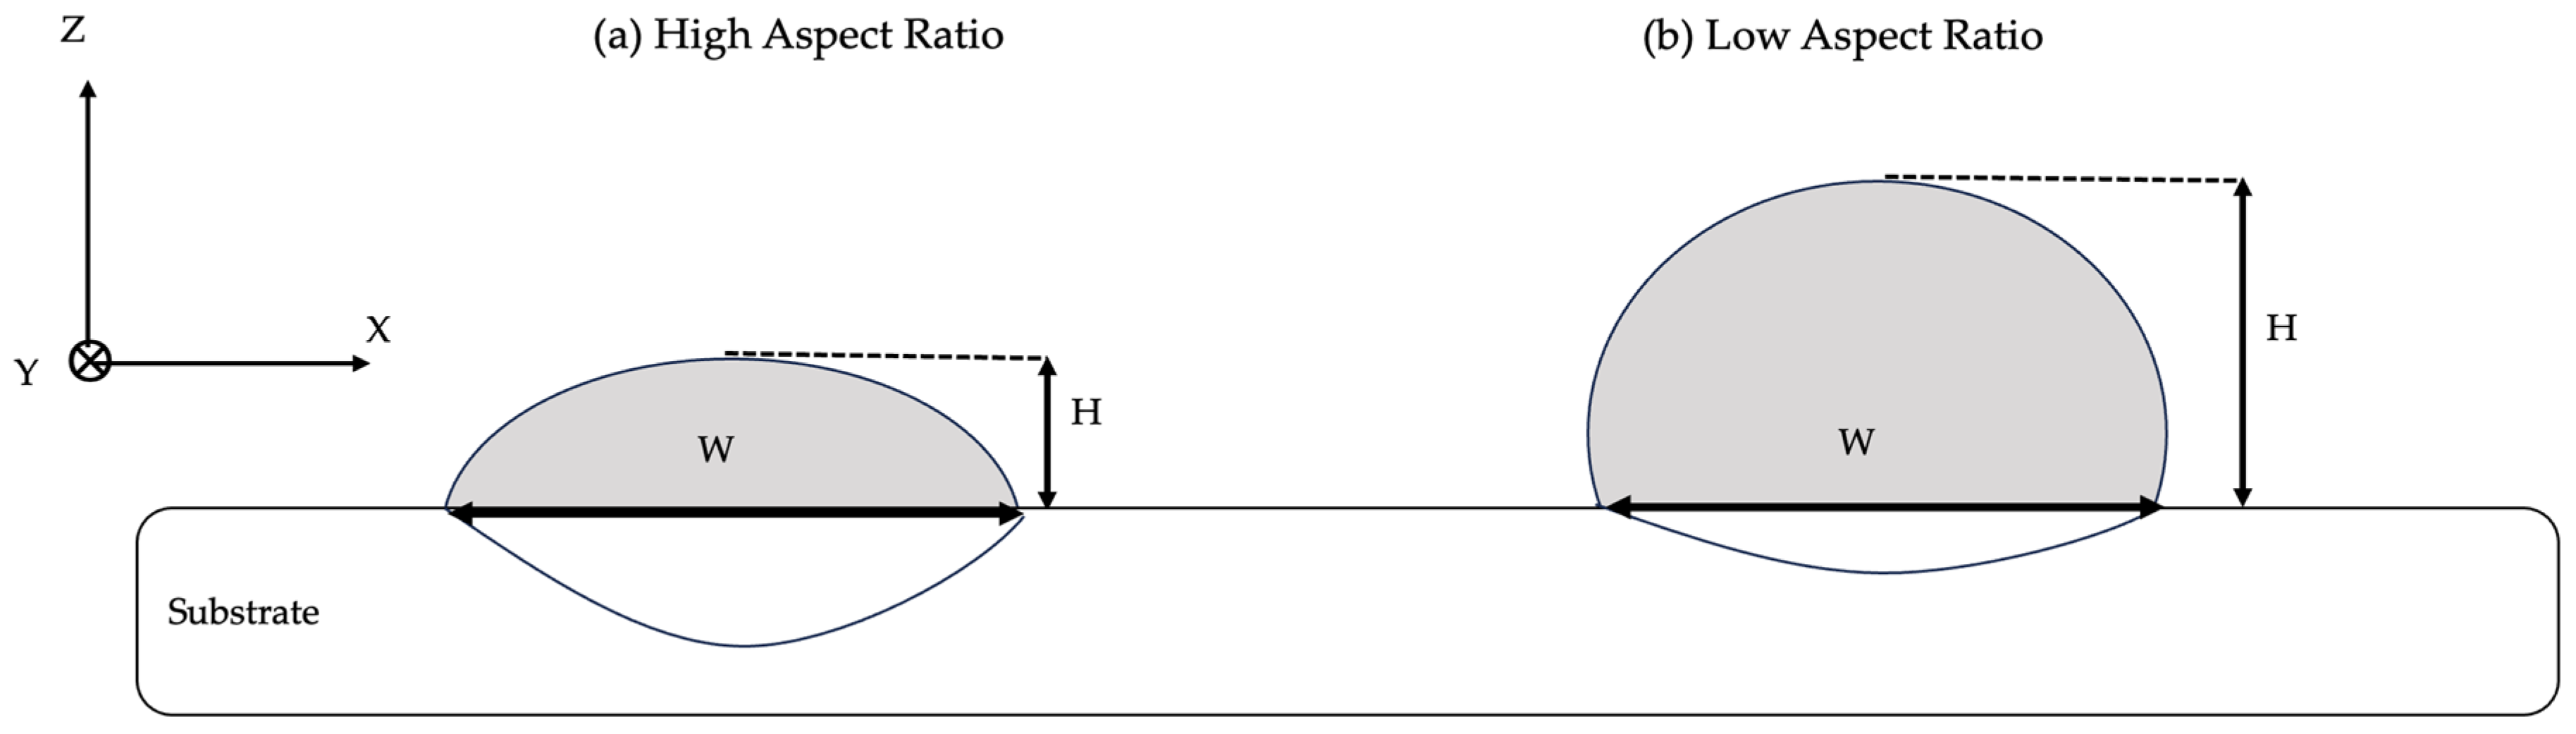
Figure 14.
Schematic representation of bead with (a) acceptable contact angle and (b) high contact angle.
Figure 14.
Schematic representation of bead with (a) acceptable contact angle and (b) high contact angle.
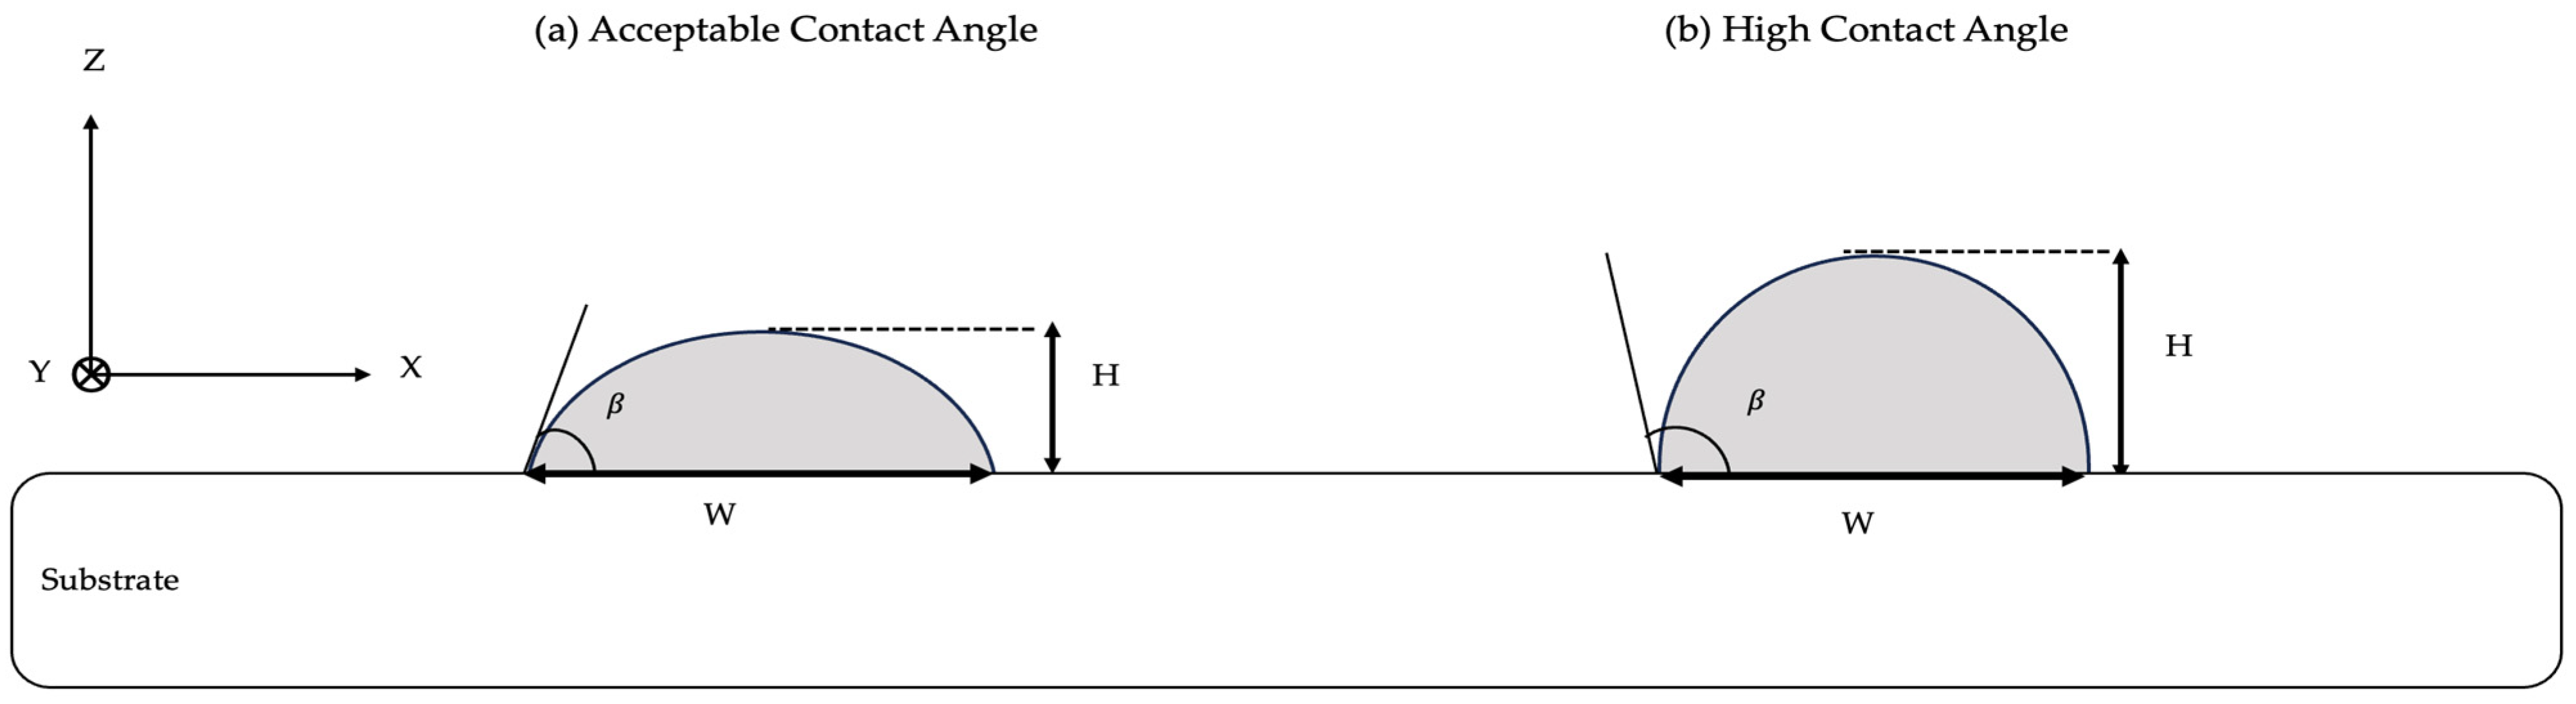
Figure 15.
Schematic representation of various lateral overlapping rates.

Figure 16.
Pore formation due to incorrect overlap.
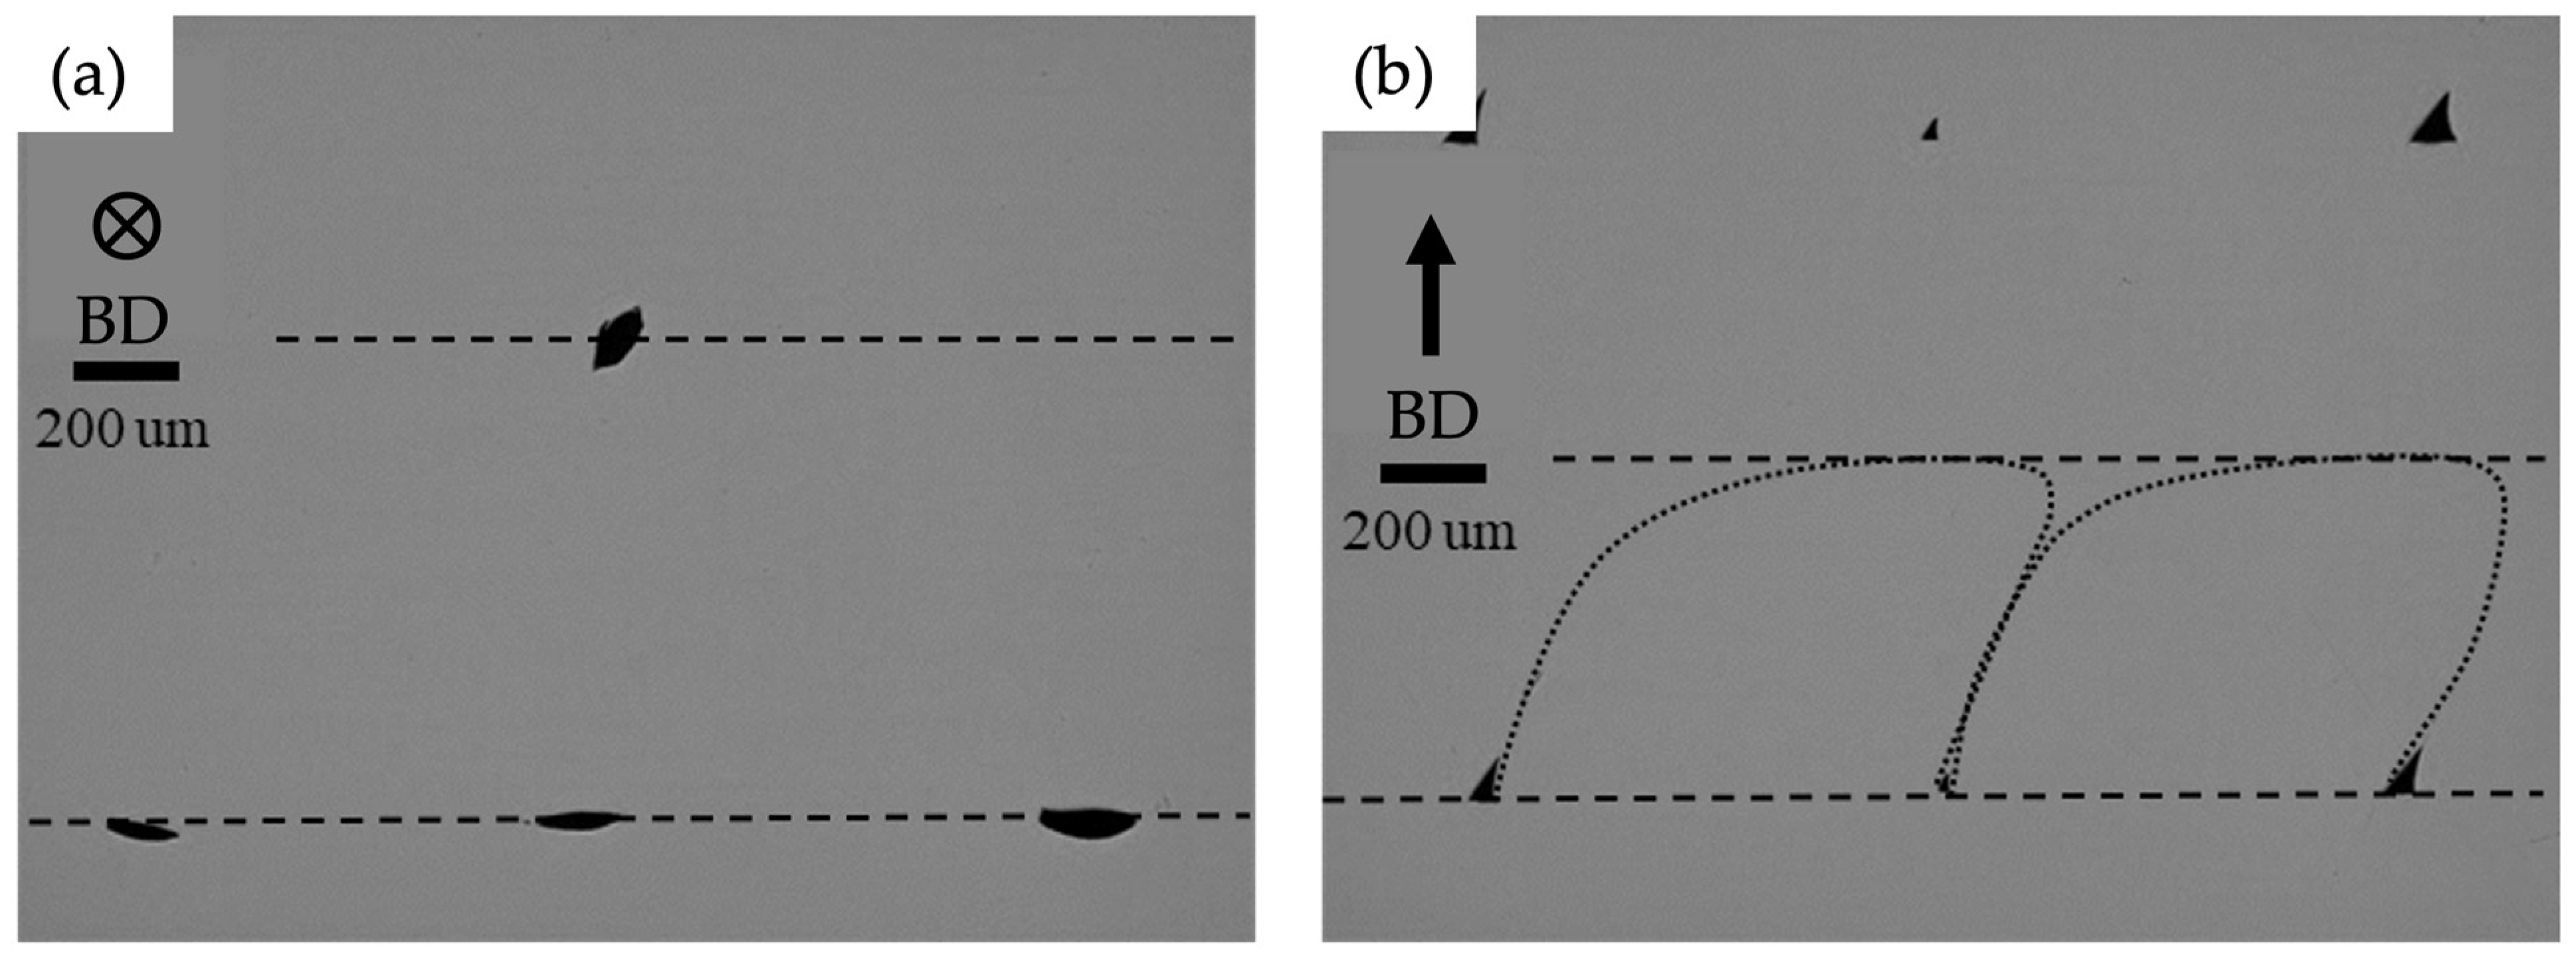
Figure 17.
Optical microscopy images of laterally deposited beads using different overlap ratios of (a) 30%, (b) 40%, (c) 50%, (d) 60%, (e) 70%, and (f) 80%. A lateral overlap of 70% results in the lowest Ra using fine (0.1 mm) SS304 wire. (reproduced with permission from [65]: copyright 2020, Emerald Publishing Limited).
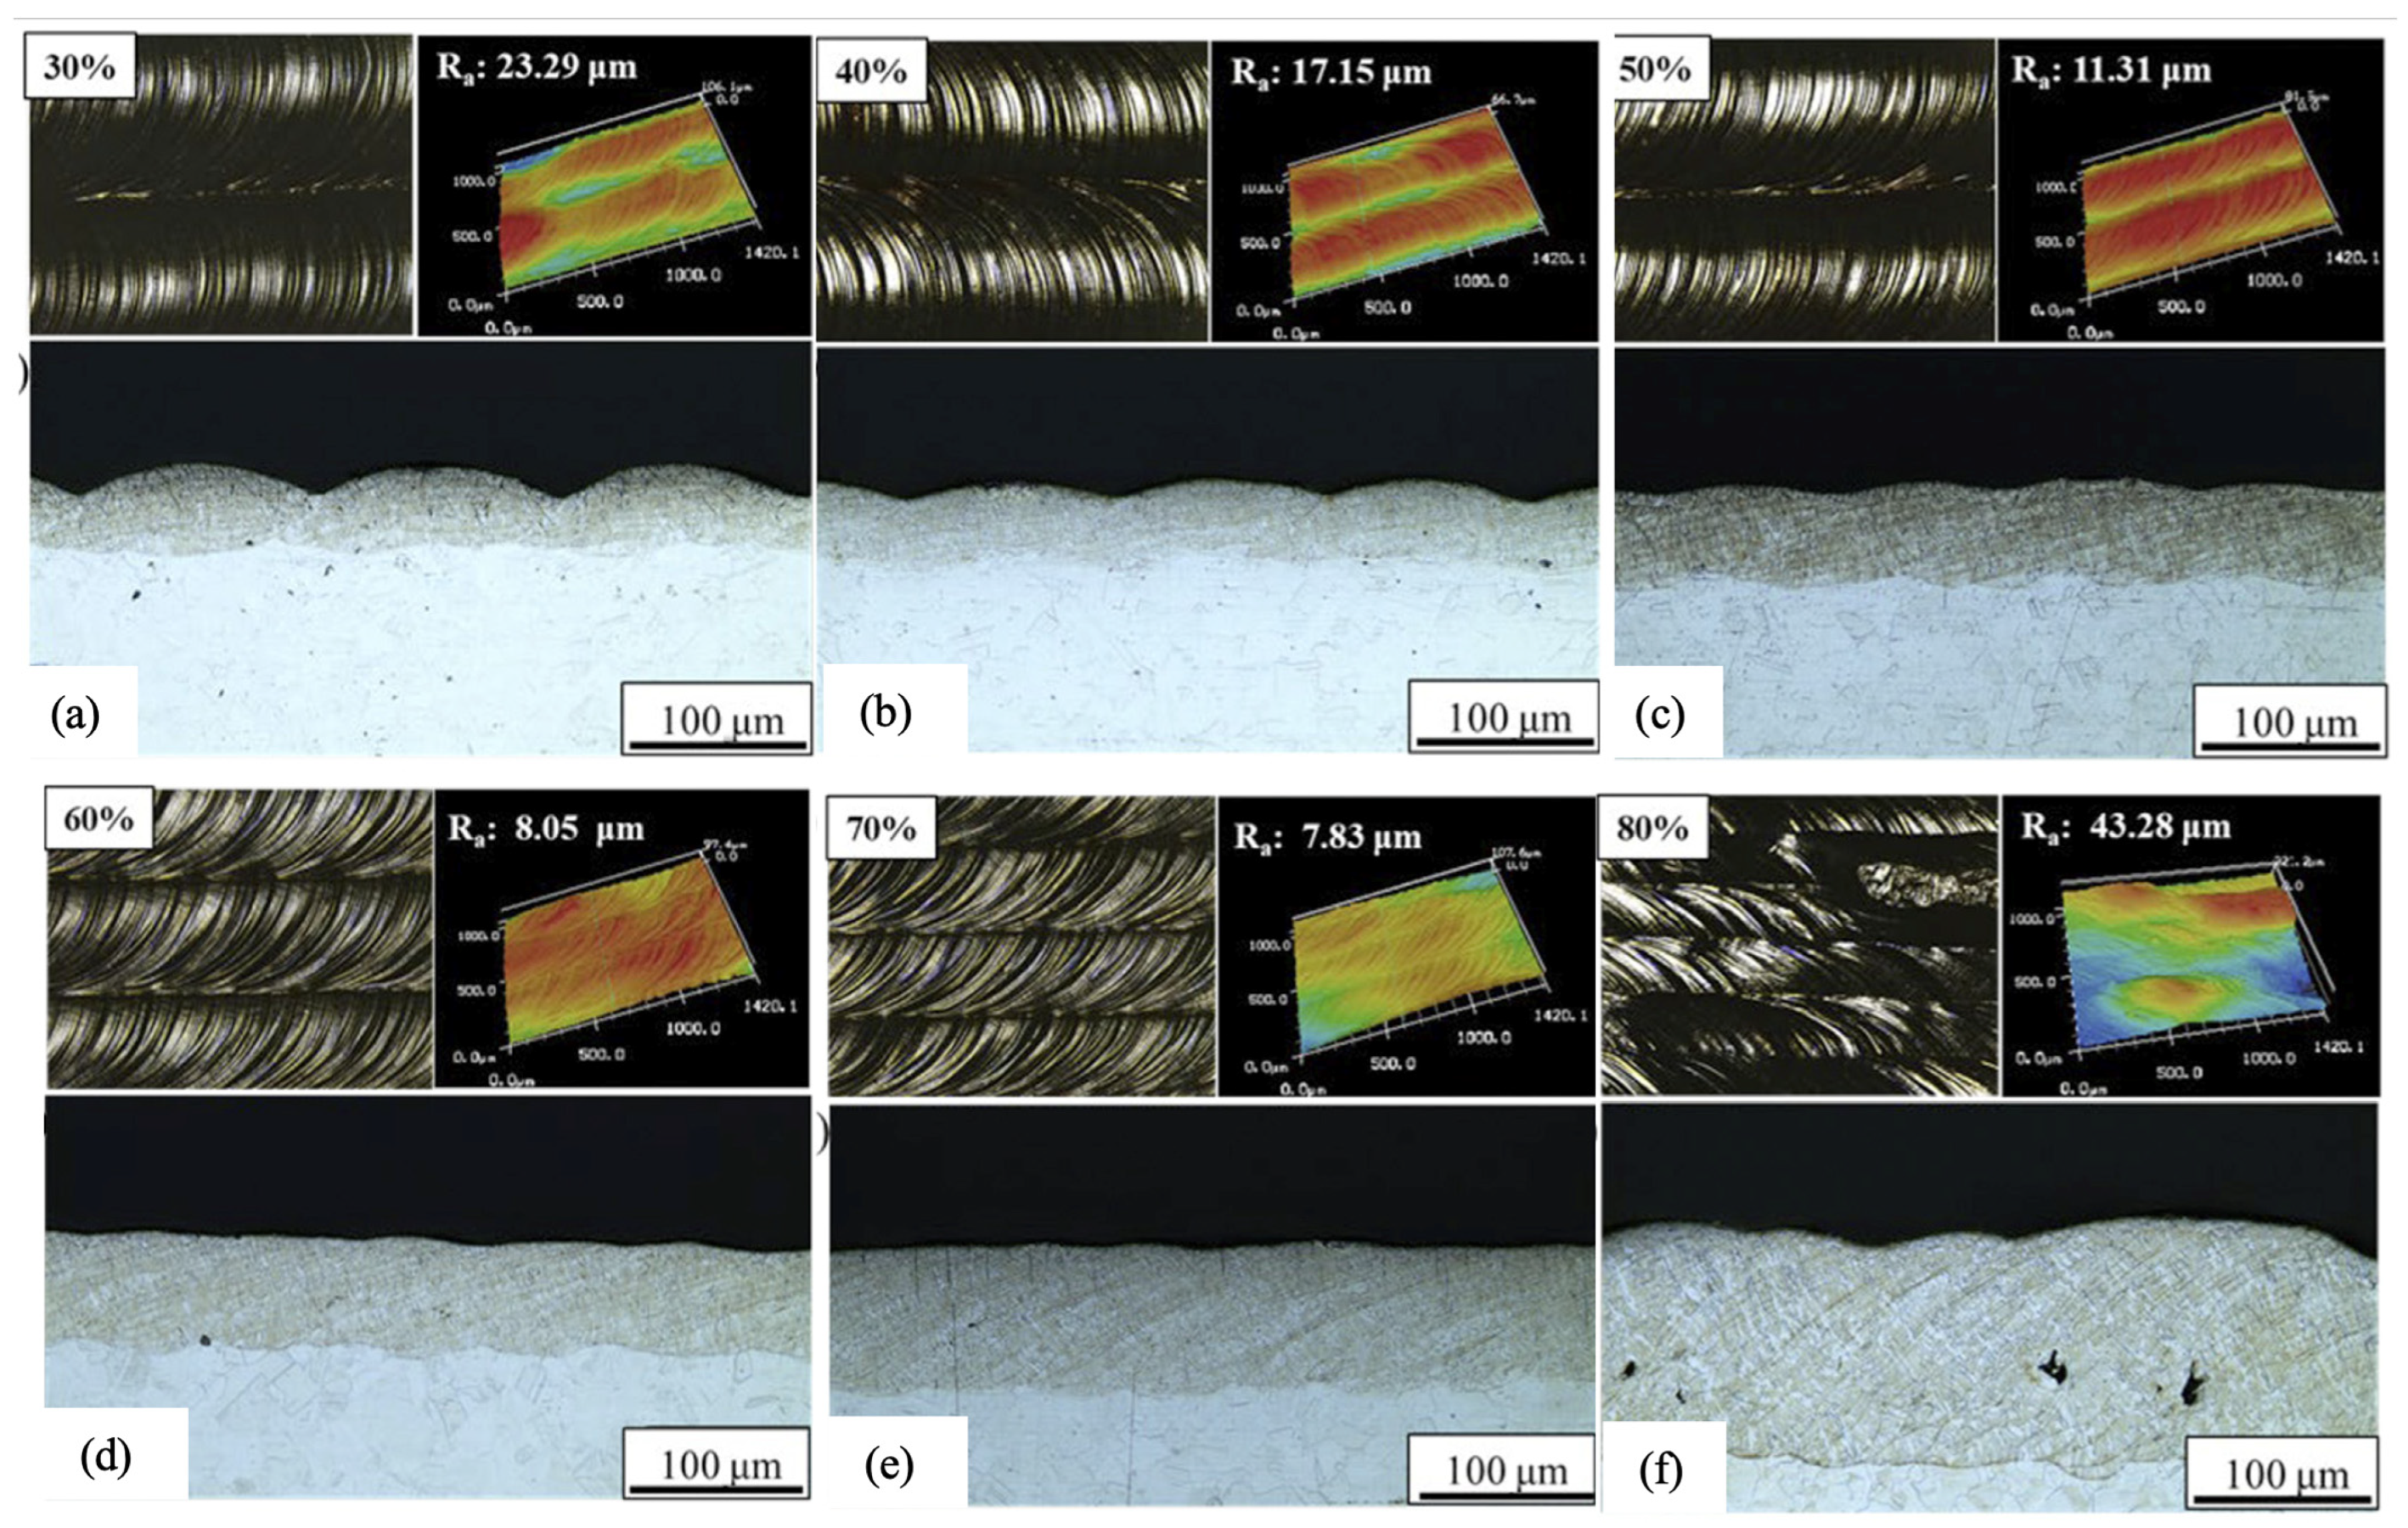
Figure 18.
Schematic representation of various vertical overlapping rates.
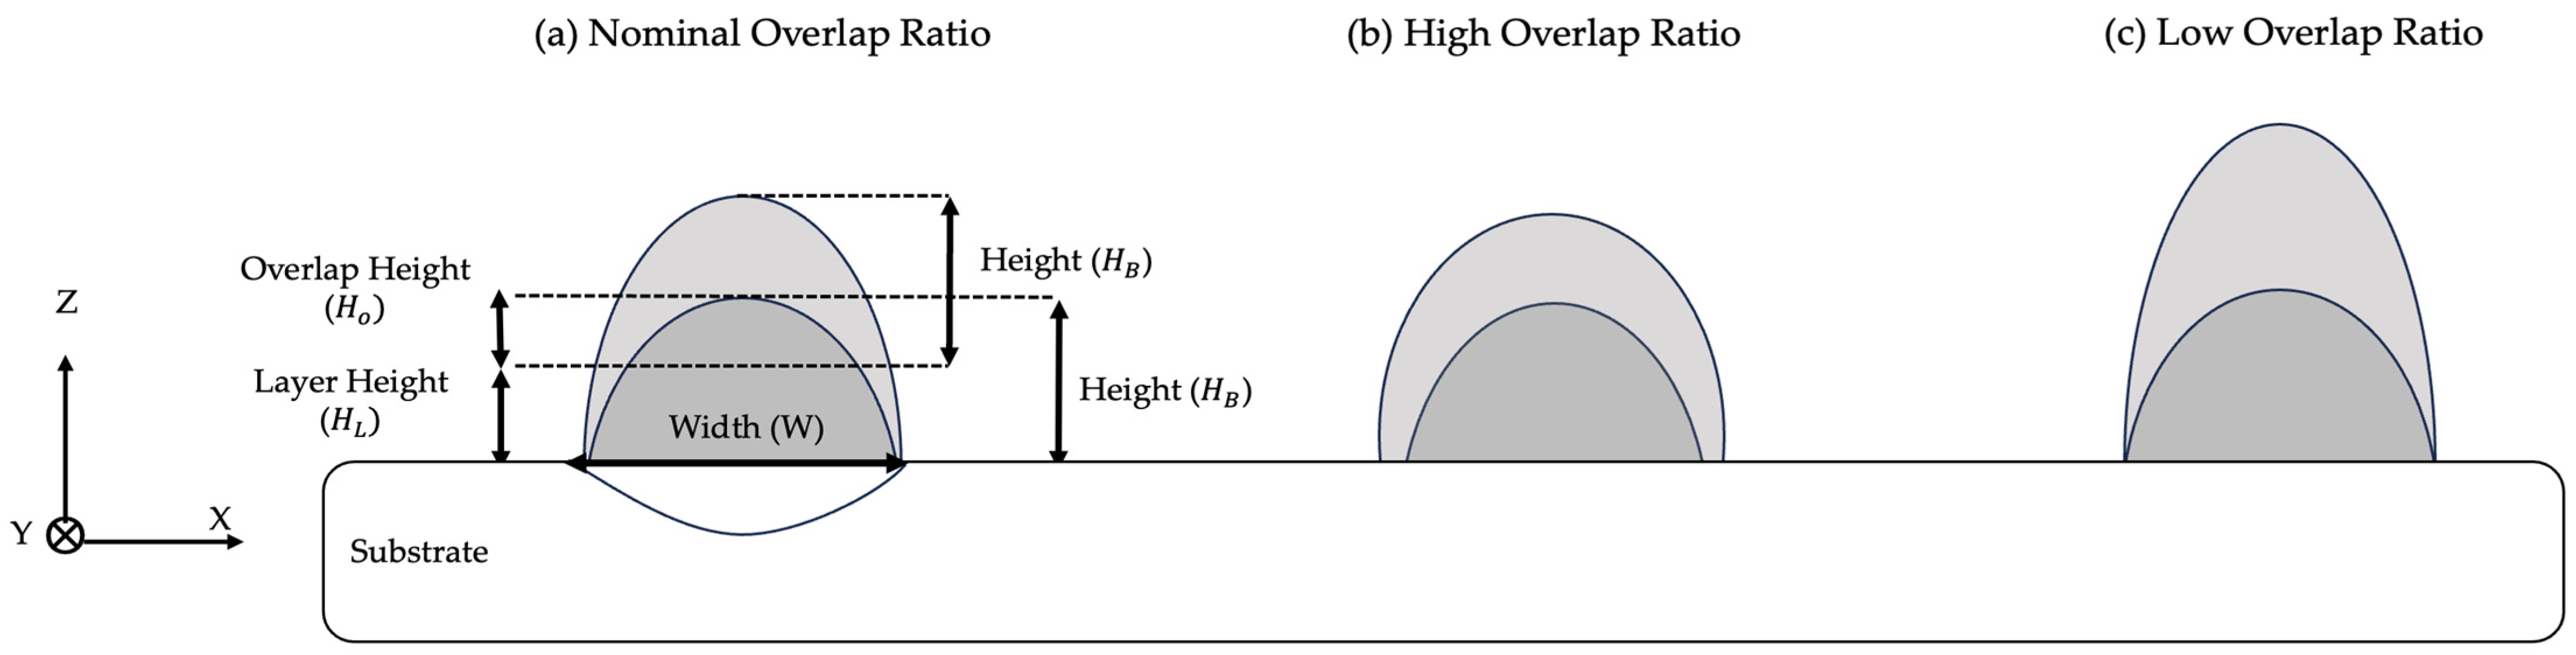
Figure 19.
W-LDED of thin-walled structures. (a,b) Inclined walls with 13 mm height at 58° and 69° inclination angles with respect to the substrate plane. (c) A cone with 11.5 mm height at 46° (reproduced with permission from [66]: copyright 2018, Elsevier Ltd.).
Figure 19.
W-LDED of thin-walled structures. (a,b) Inclined walls with 13 mm height at 58° and 69° inclination angles with respect to the substrate plane. (c) A cone with 11.5 mm height at 46° (reproduced with permission from [66]: copyright 2018, Elsevier Ltd.).
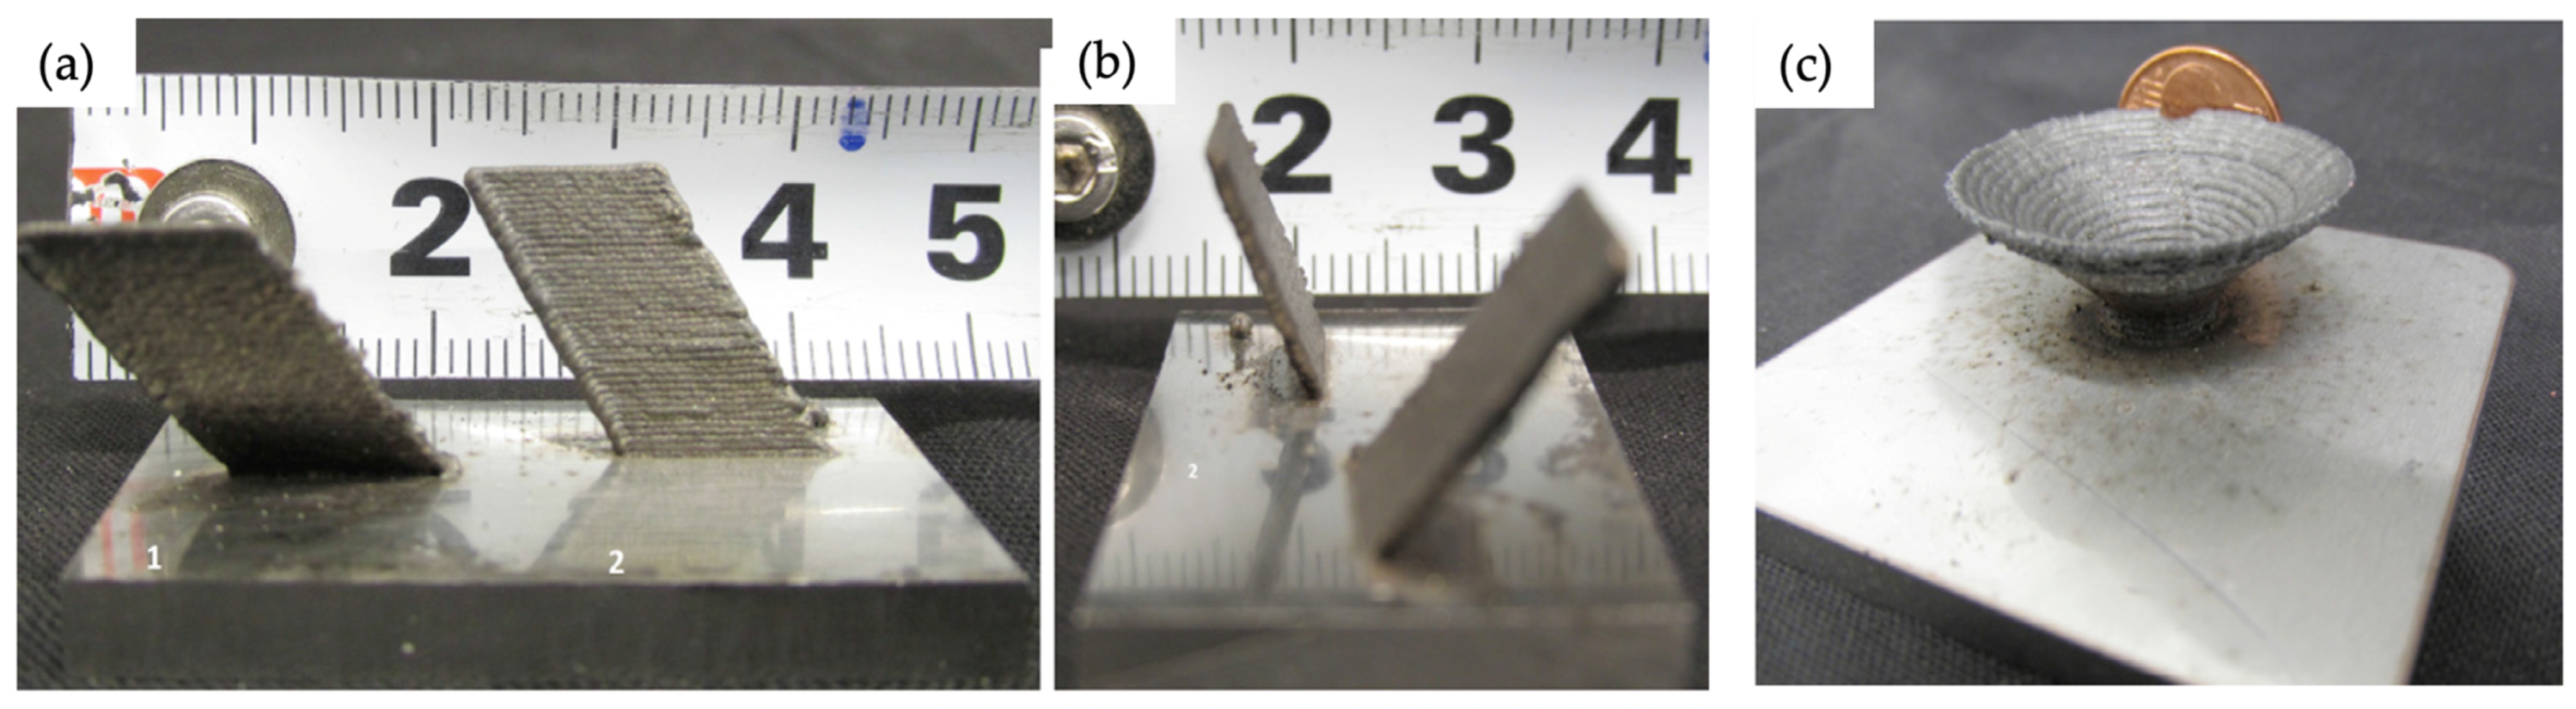
Figure 20.
(a) Dripping defect formation, (b) stubbing defect formation (reproduced with permission from [57]: copyright 2018, Elsevier Ltd.), (c) deposition track containing dripping, and (d) deposition track containing stubbing (reproduced with permission from [110]: copyright, MDPI).

Figure 21.
The track deposited with an oscillation defect (reproduced with permission from [161]: copyright 2024, Elsevier Ltd.).
Figure 21.
The track deposited with an oscillation defect (reproduced with permission from [161]: copyright 2024, Elsevier Ltd.).

Figure 22.
The process map shows the possible positions of different types of defects and a stable deposition condition. Diagonal lines indicate constant linear energy densities. (Adapted with permission from [159]: copyright 2022, Elsevier Ltd.).
Figure 22.
The process map shows the possible positions of different types of defects and a stable deposition condition. Diagonal lines indicate constant linear energy densities. (Adapted with permission from [159]: copyright 2022, Elsevier Ltd.).

Figure 23.
Cross-section of a single bead (Al alloy) containing (a) gas pores and (b) cracks due to incorrect power and high TS (reproduced with permission from [63]: copyright 2022, Elsevier Ltd.).
Figure 23.
Cross-section of a single bead (Al alloy) containing (a) gas pores and (b) cracks due to incorrect power and high TS (reproduced with permission from [63]: copyright 2022, Elsevier Ltd.).
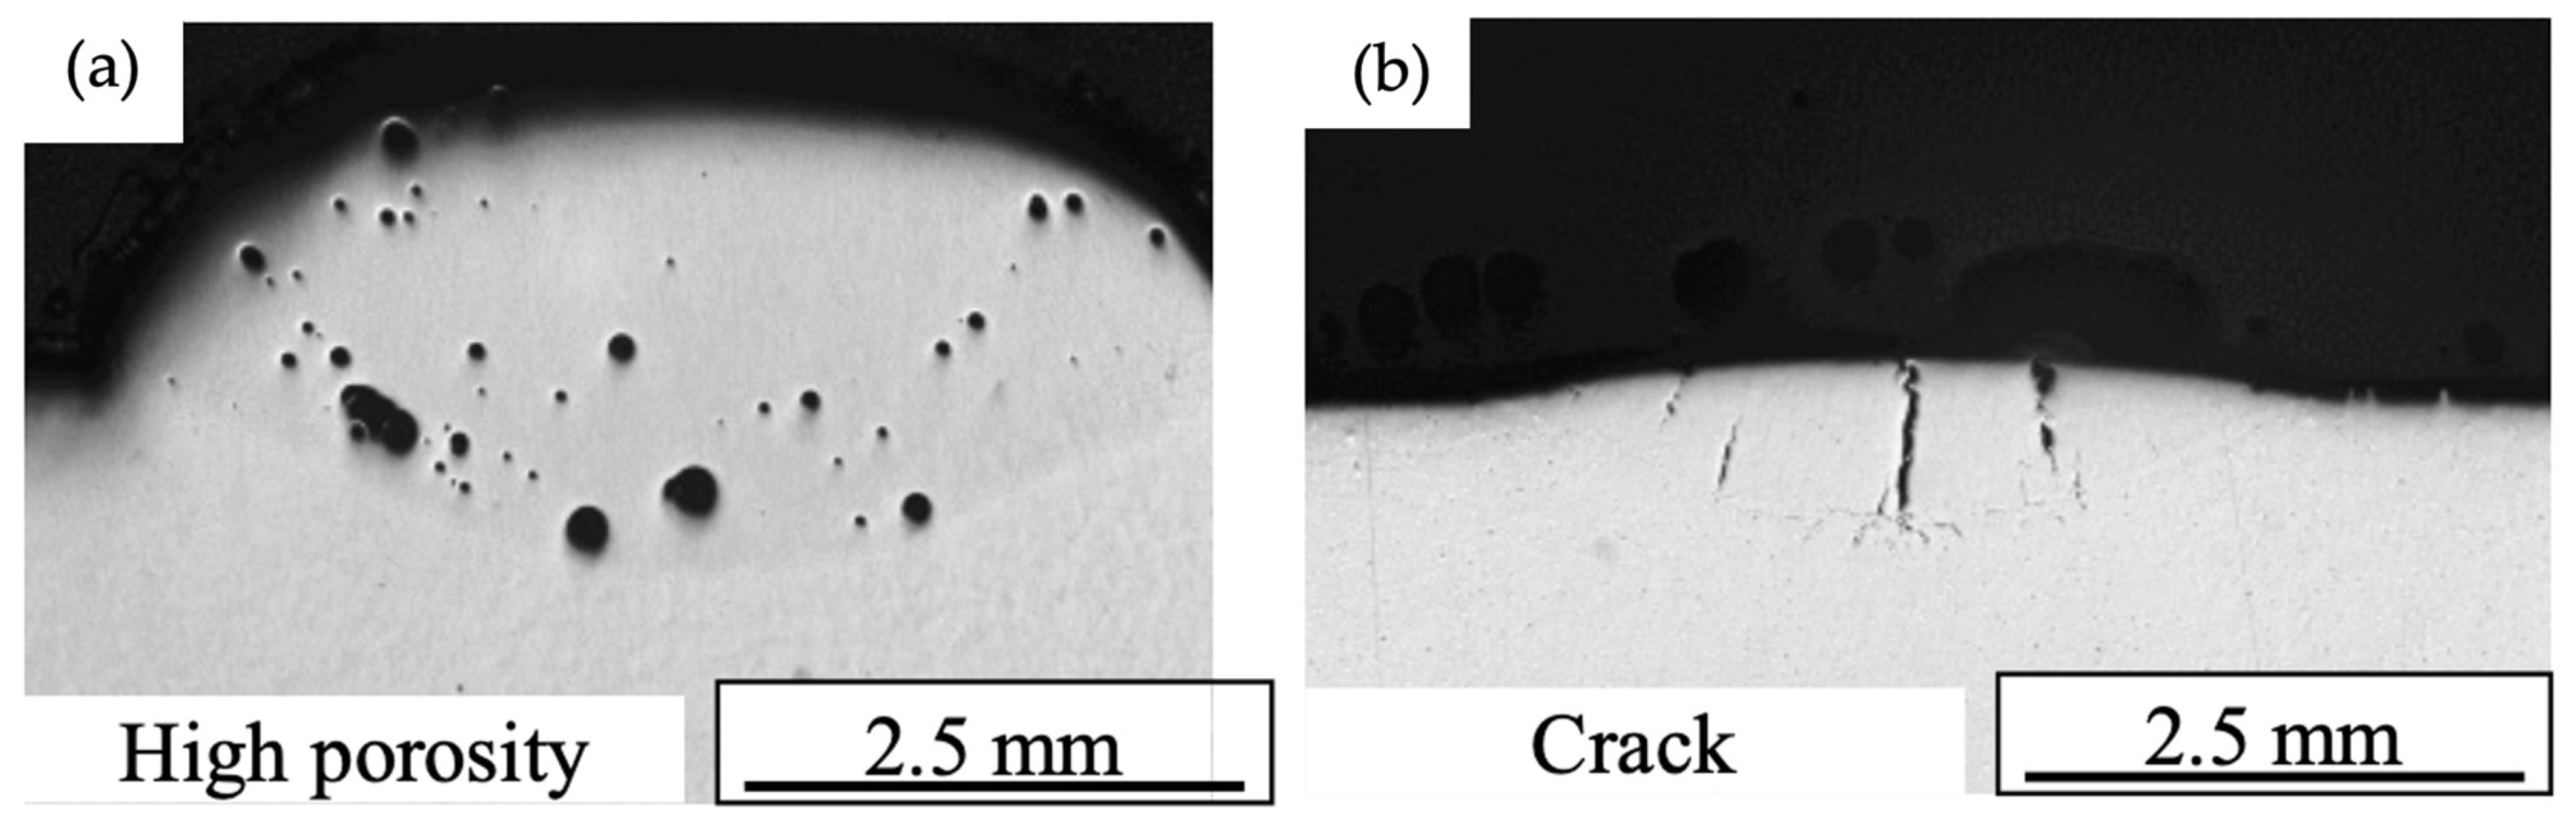
Figure 24.
LOF between layers formed due to insufficient laser power of (a) 700 W and (b) 900 W. (c) No LOF is present when using laser power of 1000 W for SS 309 (reproduced with permission from [59]: copyright 2023, EDP Sciences).
Figure 24.
LOF between layers formed due to insufficient laser power of (a) 700 W and (b) 900 W. (c) No LOF is present when using laser power of 1000 W for SS 309 (reproduced with permission from [59]: copyright 2023, EDP Sciences).
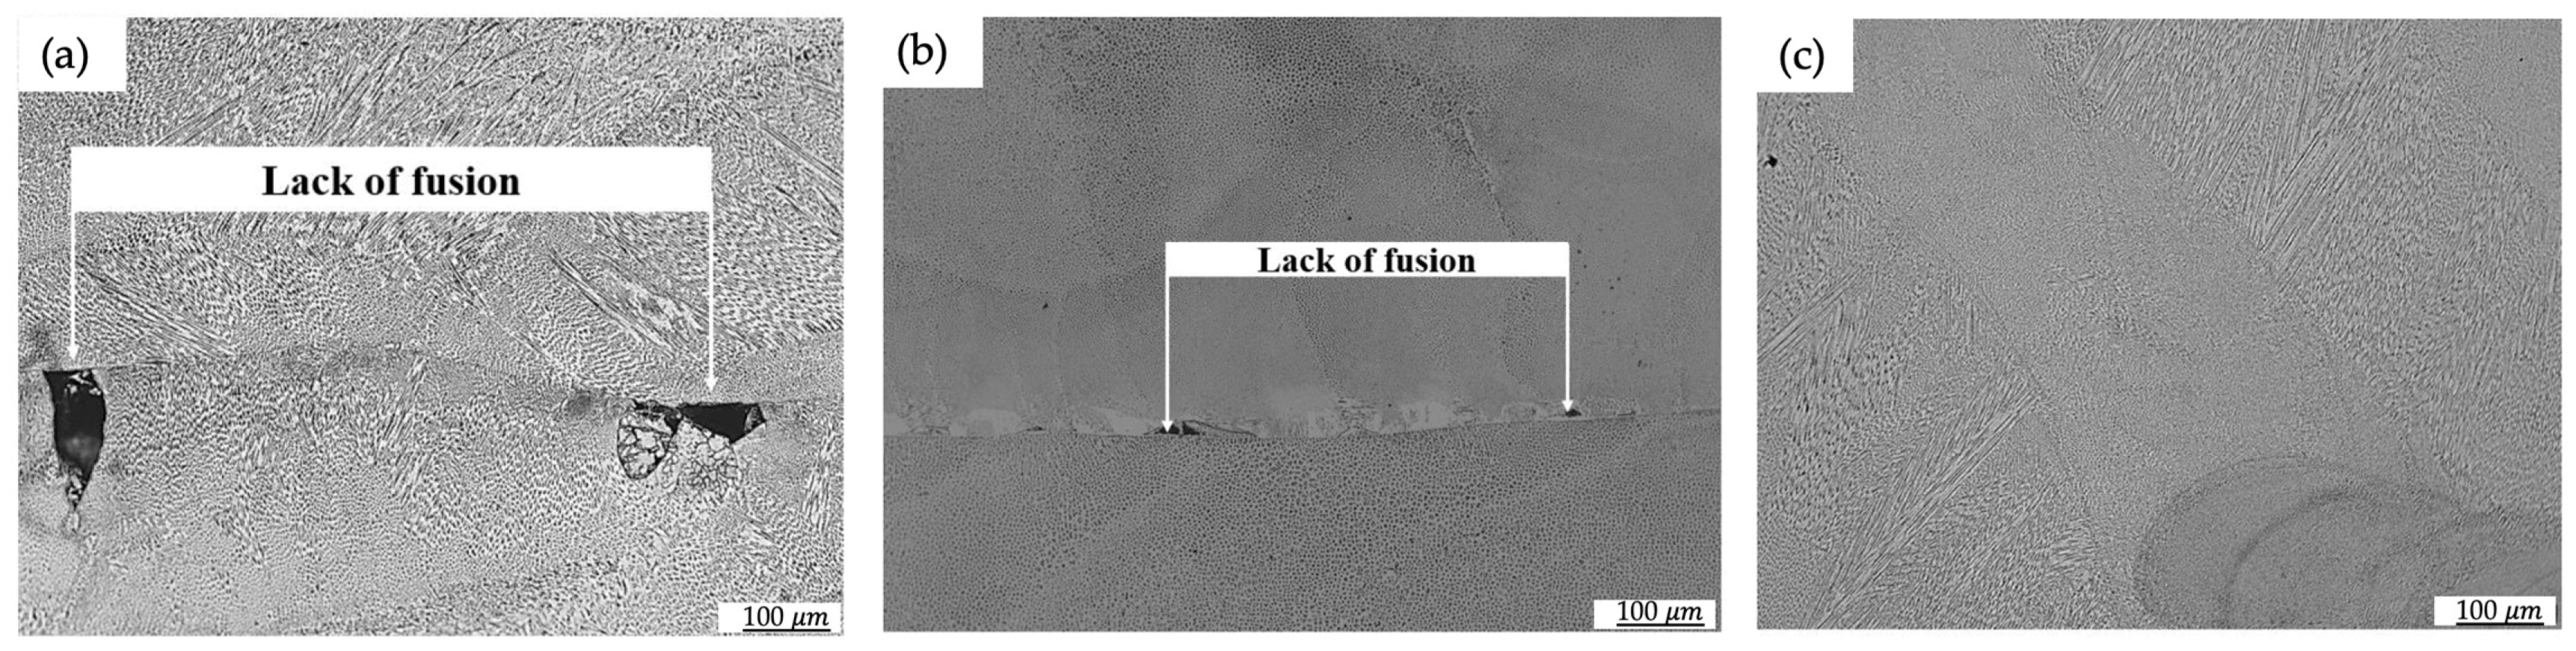
Figure 25.
Increasing the gas flow rate in (a) central shielding and (b) local shielding (reproduced with permission from [174]: copyright 2023, MDPI).
Figure 25.
Increasing the gas flow rate in (a) central shielding and (b) local shielding (reproduced with permission from [174]: copyright 2023, MDPI).
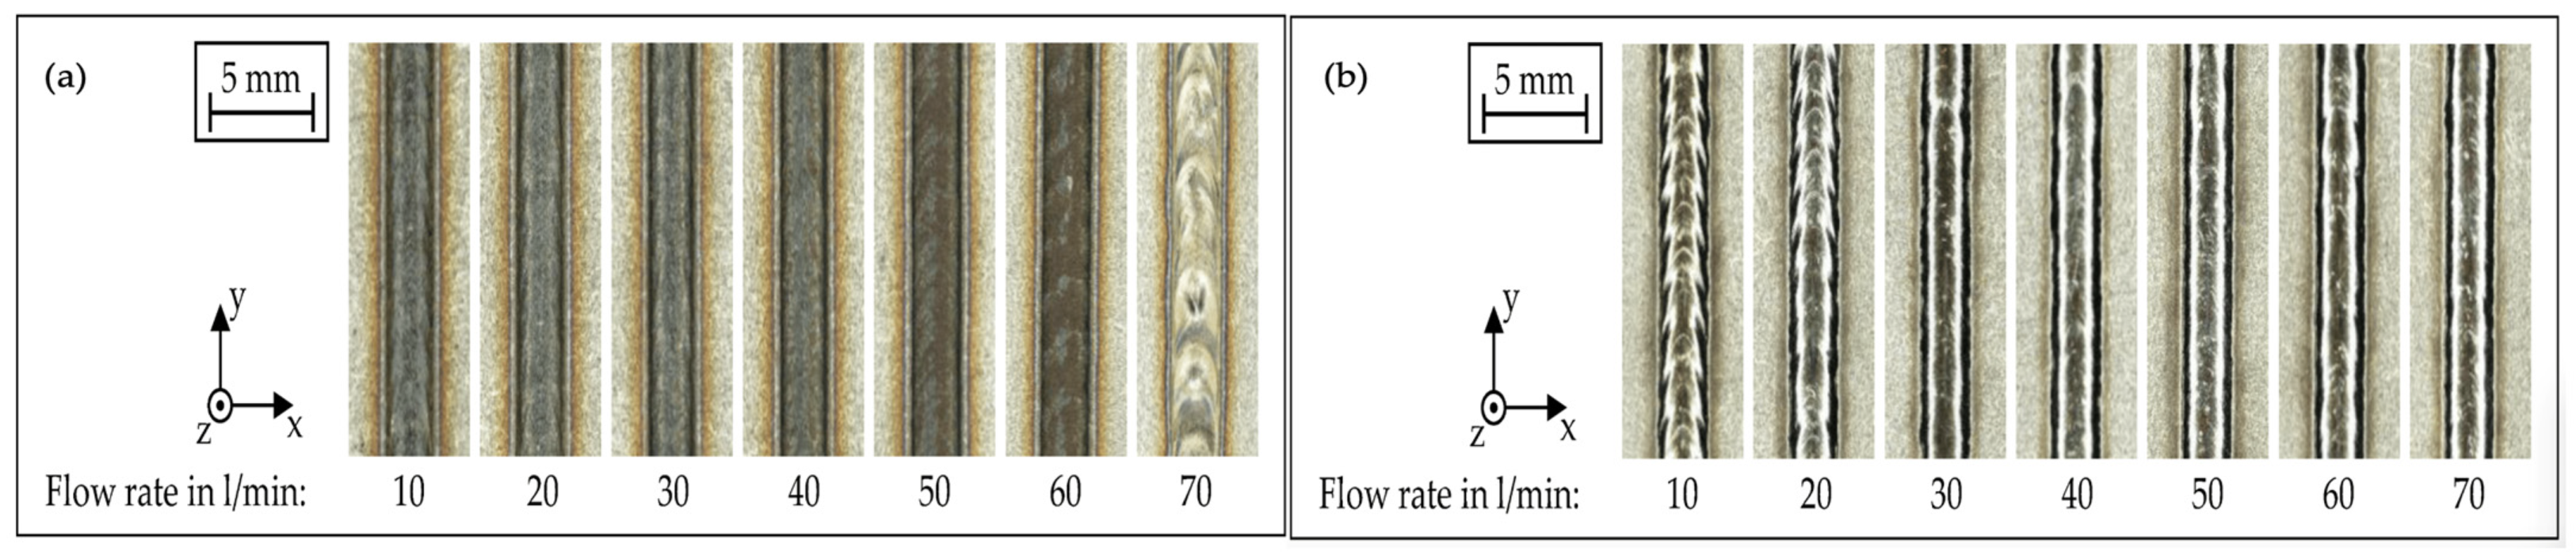
Figure 26.
Schematics of three types of deposition patterns. Black lines indicate the initial deposited layer while blue lines are the consecutive layer.
Figure 26.
Schematics of three types of deposition patterns. Black lines indicate the initial deposited layer while blue lines are the consecutive layer.
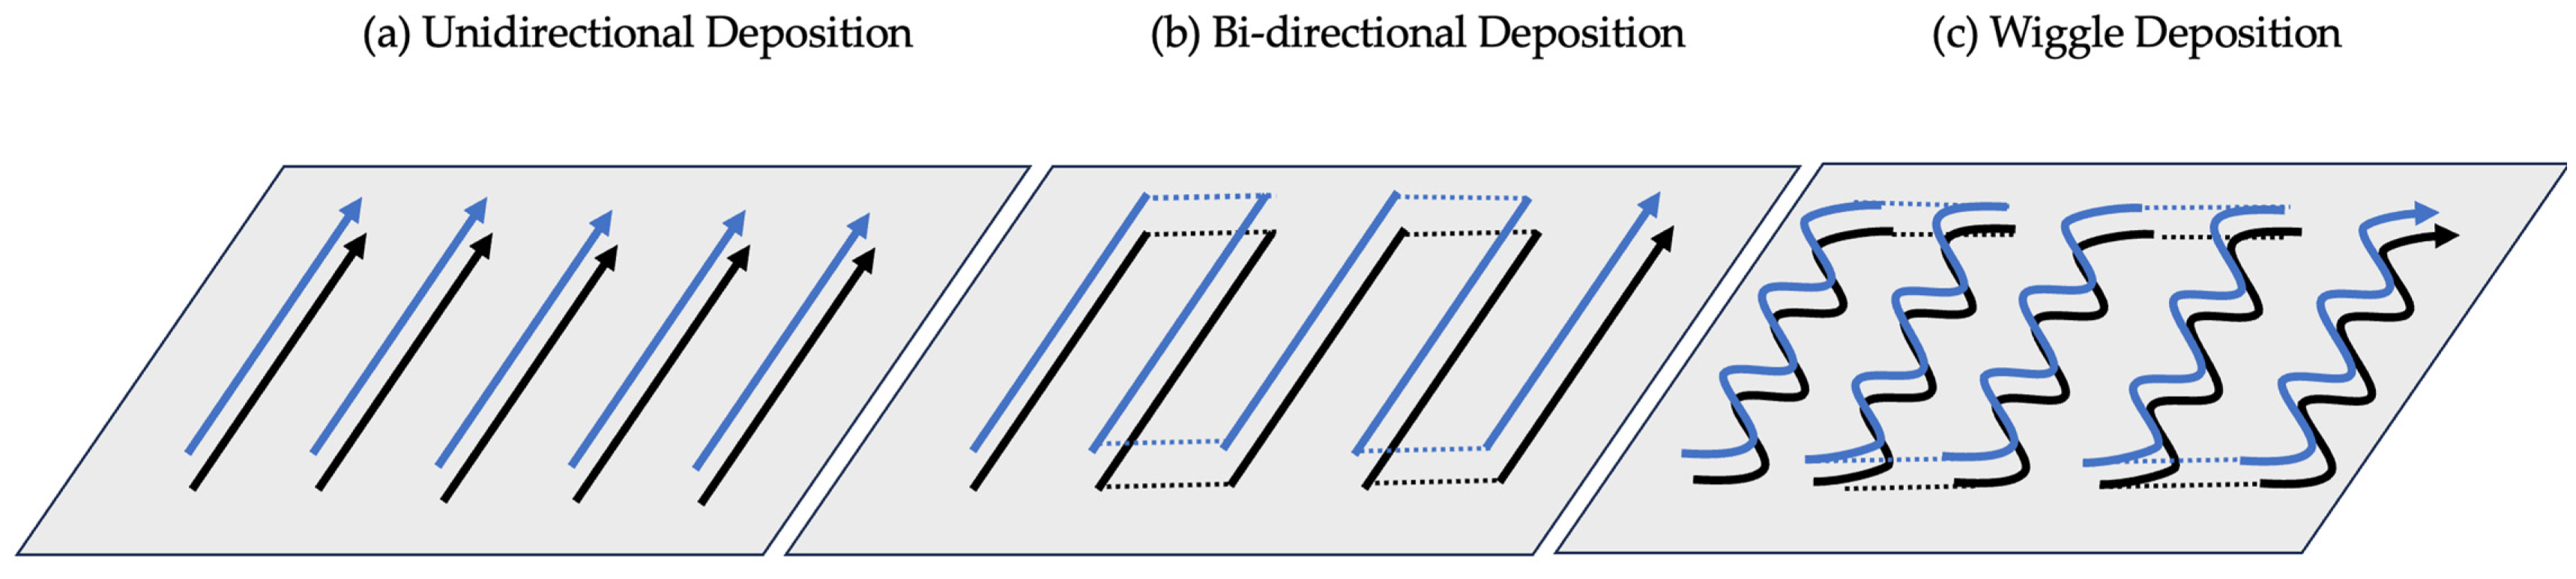
Figure 27.
Material buildup at the initial point of deposition and a lack of material at the ending point in unidirectional deposition (reproduced with permission from [52]: copyright 2021, Elsevier Ltd.).
Figure 27.
Material buildup at the initial point of deposition and a lack of material at the ending point in unidirectional deposition (reproduced with permission from [52]: copyright 2021, Elsevier Ltd.).
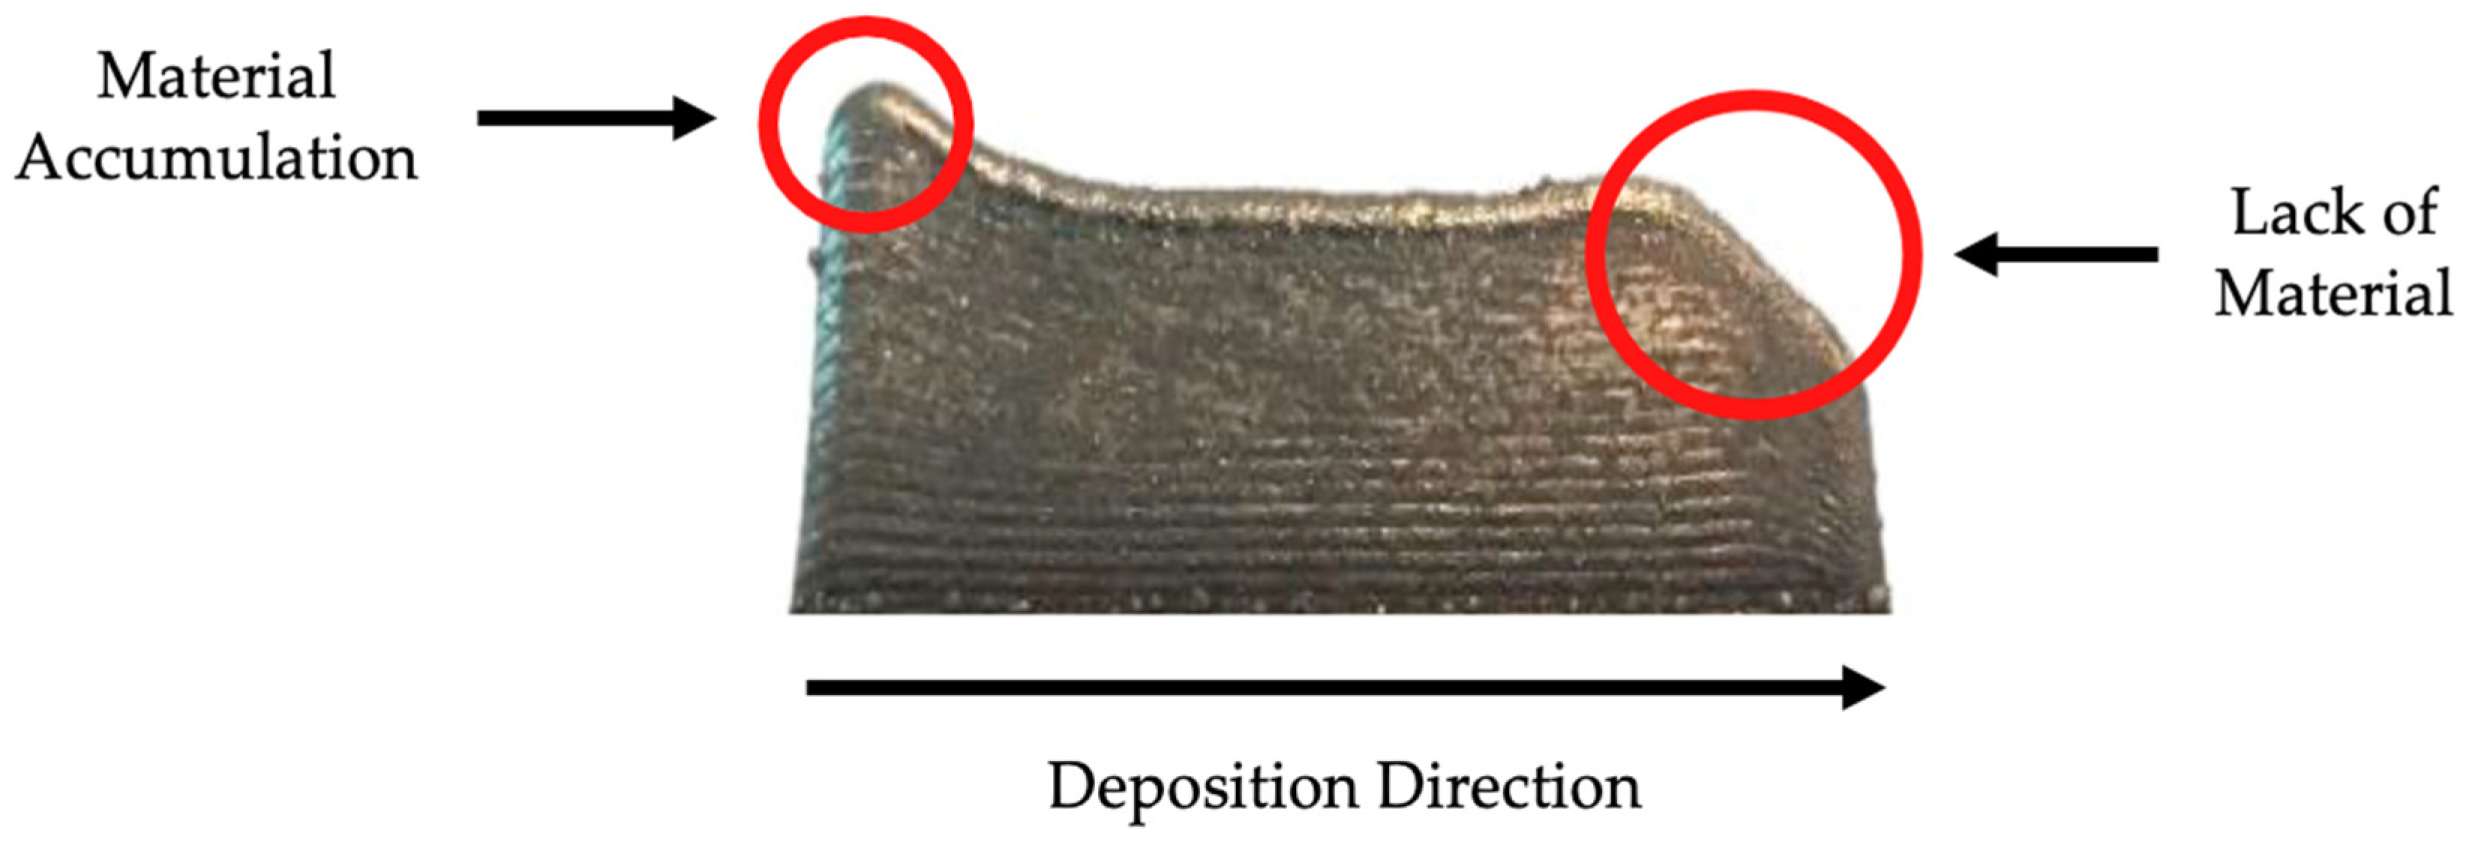
Figure 28.
Single bead appearance deposited with the hot and cold wire with increasing linear energy density (reproduced with permission from [192]: copyright 2014, Elsevier Ltd.).
Figure 28.
Single bead appearance deposited with the hot and cold wire with increasing linear energy density (reproduced with permission from [192]: copyright 2014, Elsevier Ltd.).

Figure 29.
The penetration depth of (a) cold wire and (b) hot wire with constant laser power and different TS. is the area of the bead and is the penetration area (reproduced with permission from [54]: copyright 2021, Elsevier Ltd.).
Figure 29.
The penetration depth of (a) cold wire and (b) hot wire with constant laser power and different TS. is the area of the bead and is the penetration area (reproduced with permission from [54]: copyright 2021, Elsevier Ltd.).
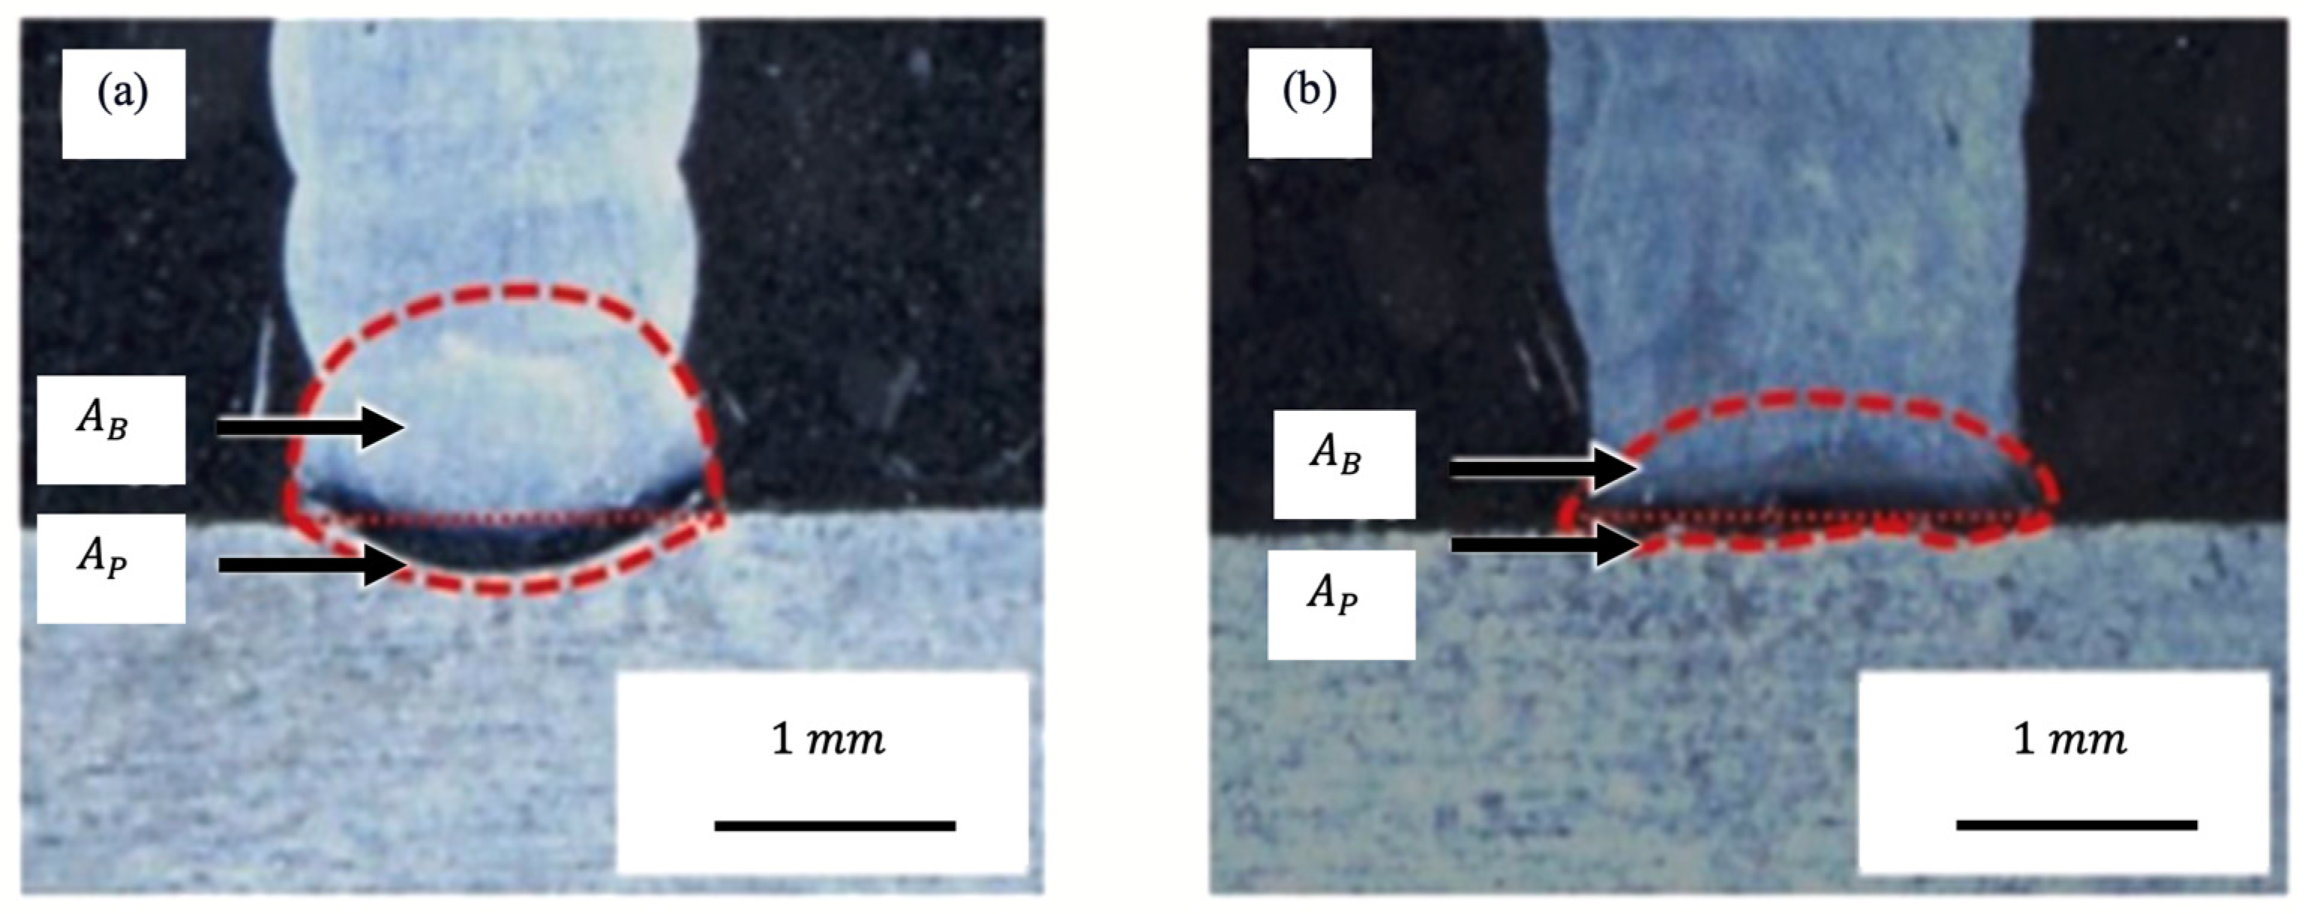
Figure 30.
Deposited track with (a) low wire current, (b) appropriate wire current, (c) high wire current (reproduced with permission from [108]: copyright 2021, MDPI).
Figure 30.
Deposited track with (a) low wire current, (b) appropriate wire current, (c) high wire current (reproduced with permission from [108]: copyright 2021, MDPI).

Figure 31.
Different types of building strategies in multilayer deposition: (a) continuous building strategy with constant laser power, (b) discontinuous building with power reduction after each deposited layer, and (c) discontinuous building with inter-layer cooling after each deposited layer.
Figure 31.
Different types of building strategies in multilayer deposition: (a) continuous building strategy with constant laser power, (b) discontinuous building with power reduction after each deposited layer, and (c) discontinuous building with inter-layer cooling after each deposited layer.
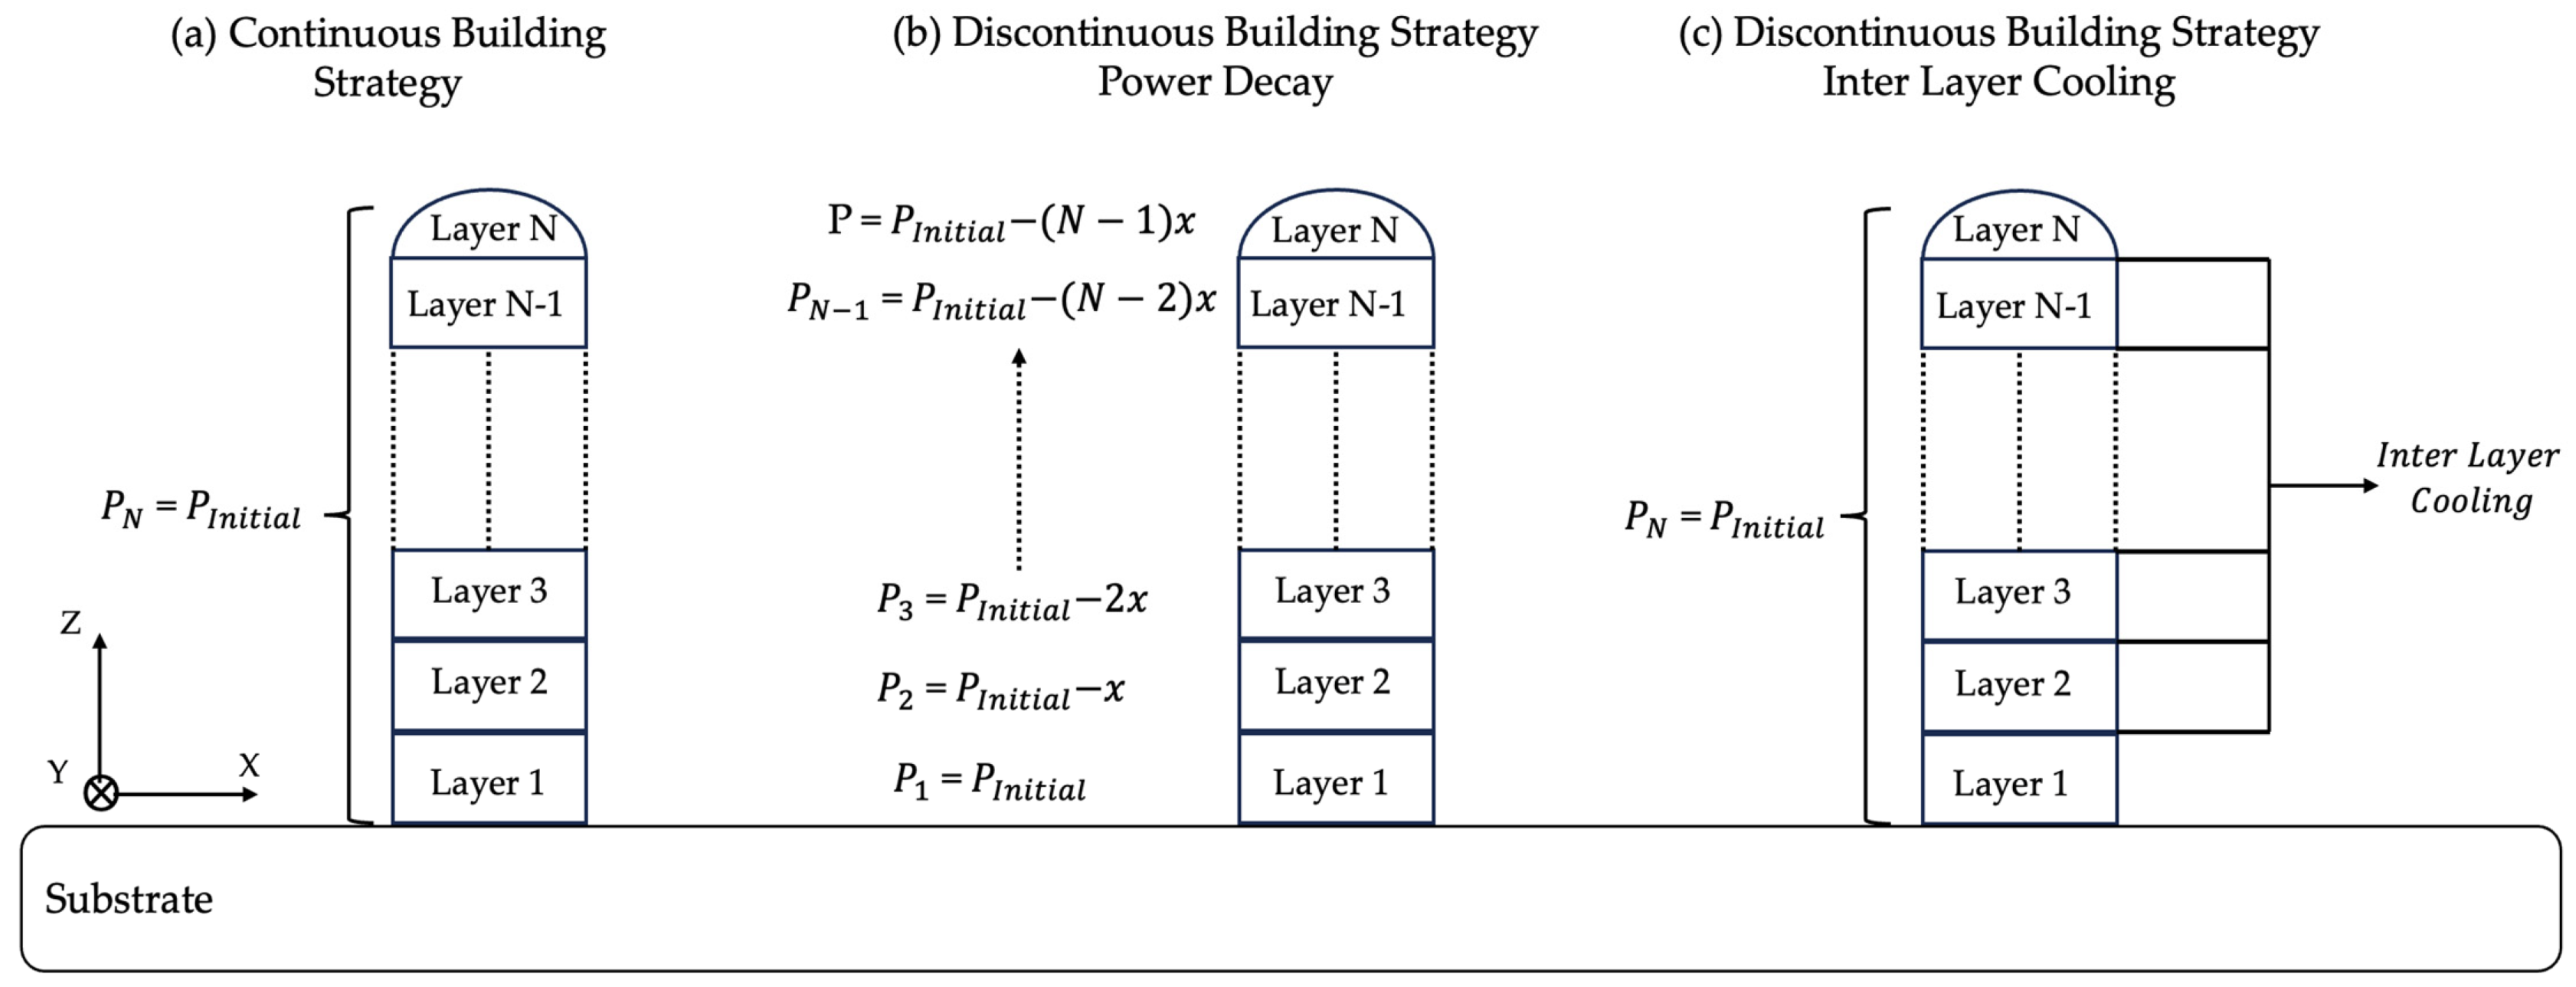
Figure 32.
(a) Schematics of W-LDED monitoring setup, (b) bead’s width measurement obtained by the top camera, and (c) bead’s height measurement acquired by the front camera detecting the shape of the projected laser line (reproduced with permission from [213]: copyright 2010, Elsevier Ltd.).
Figure 32.
(a) Schematics of W-LDED monitoring setup, (b) bead’s width measurement obtained by the top camera, and (c) bead’s height measurement acquired by the front camera detecting the shape of the projected laser line (reproduced with permission from [213]: copyright 2010, Elsevier Ltd.).
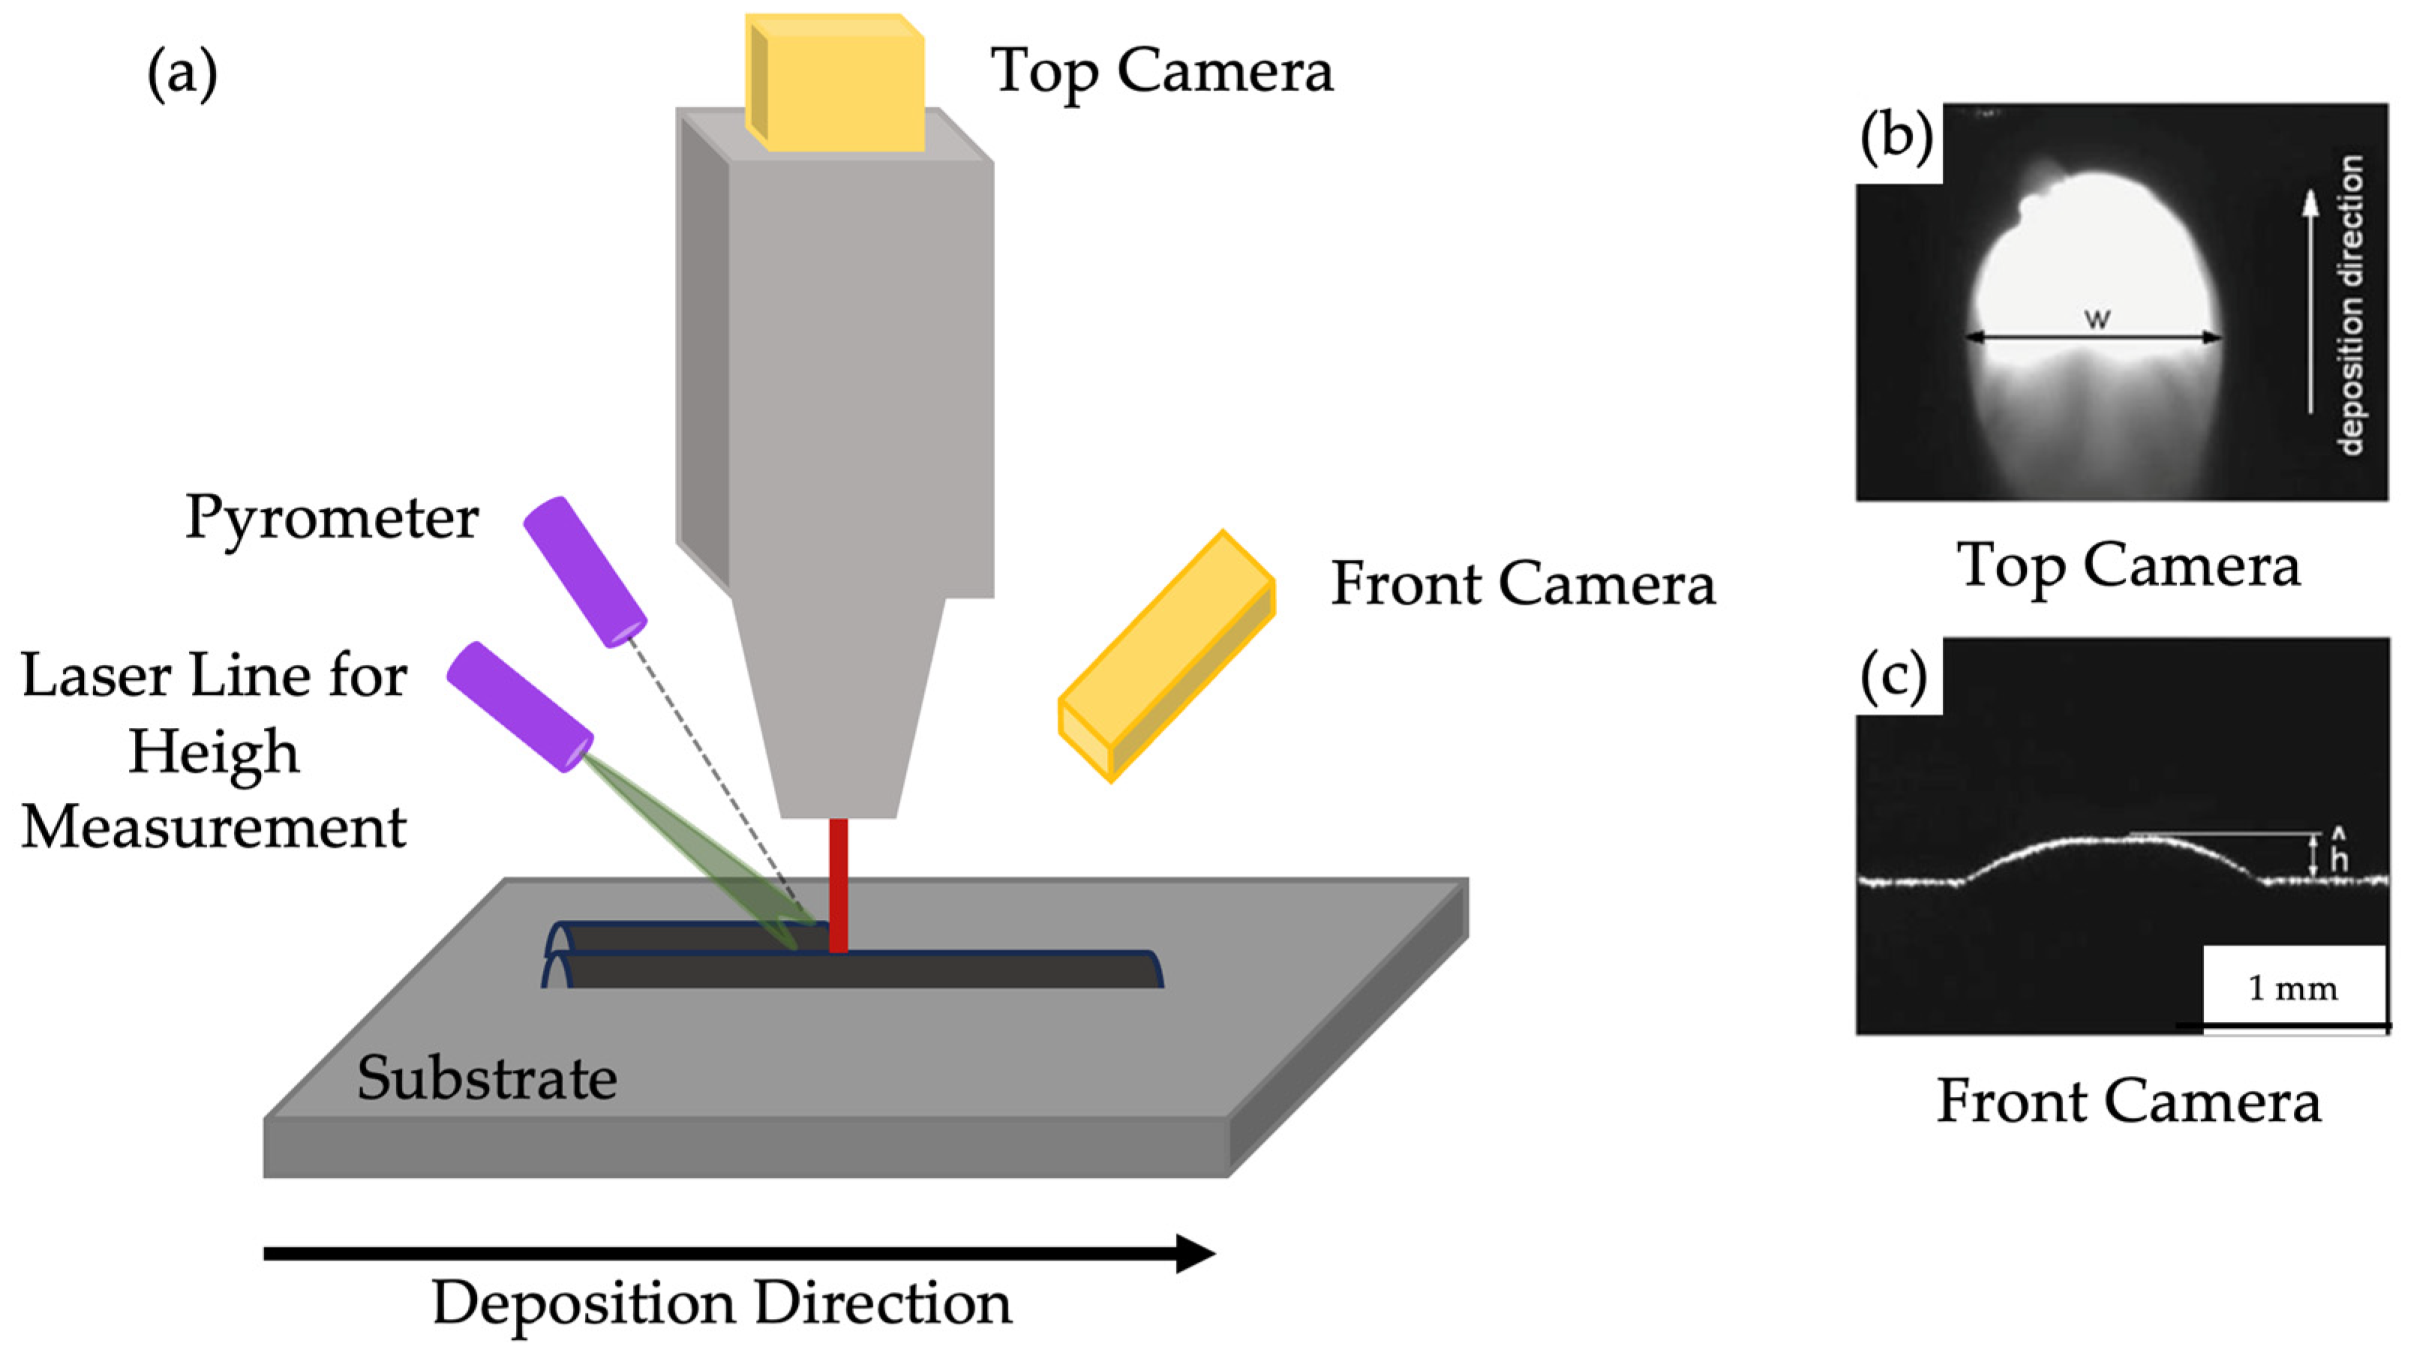
Figure 33.
Top track deposited without employing a controller. The bottom track deposited utilizing a controller for adjusting the position of the deposition head in the Z direction (reproduced with permission from [97]: copyright 2014, Elsevier Ltd.).
Figure 33.
Top track deposited without employing a controller. The bottom track deposited utilizing a controller for adjusting the position of the deposition head in the Z direction (reproduced with permission from [97]: copyright 2014, Elsevier Ltd.).
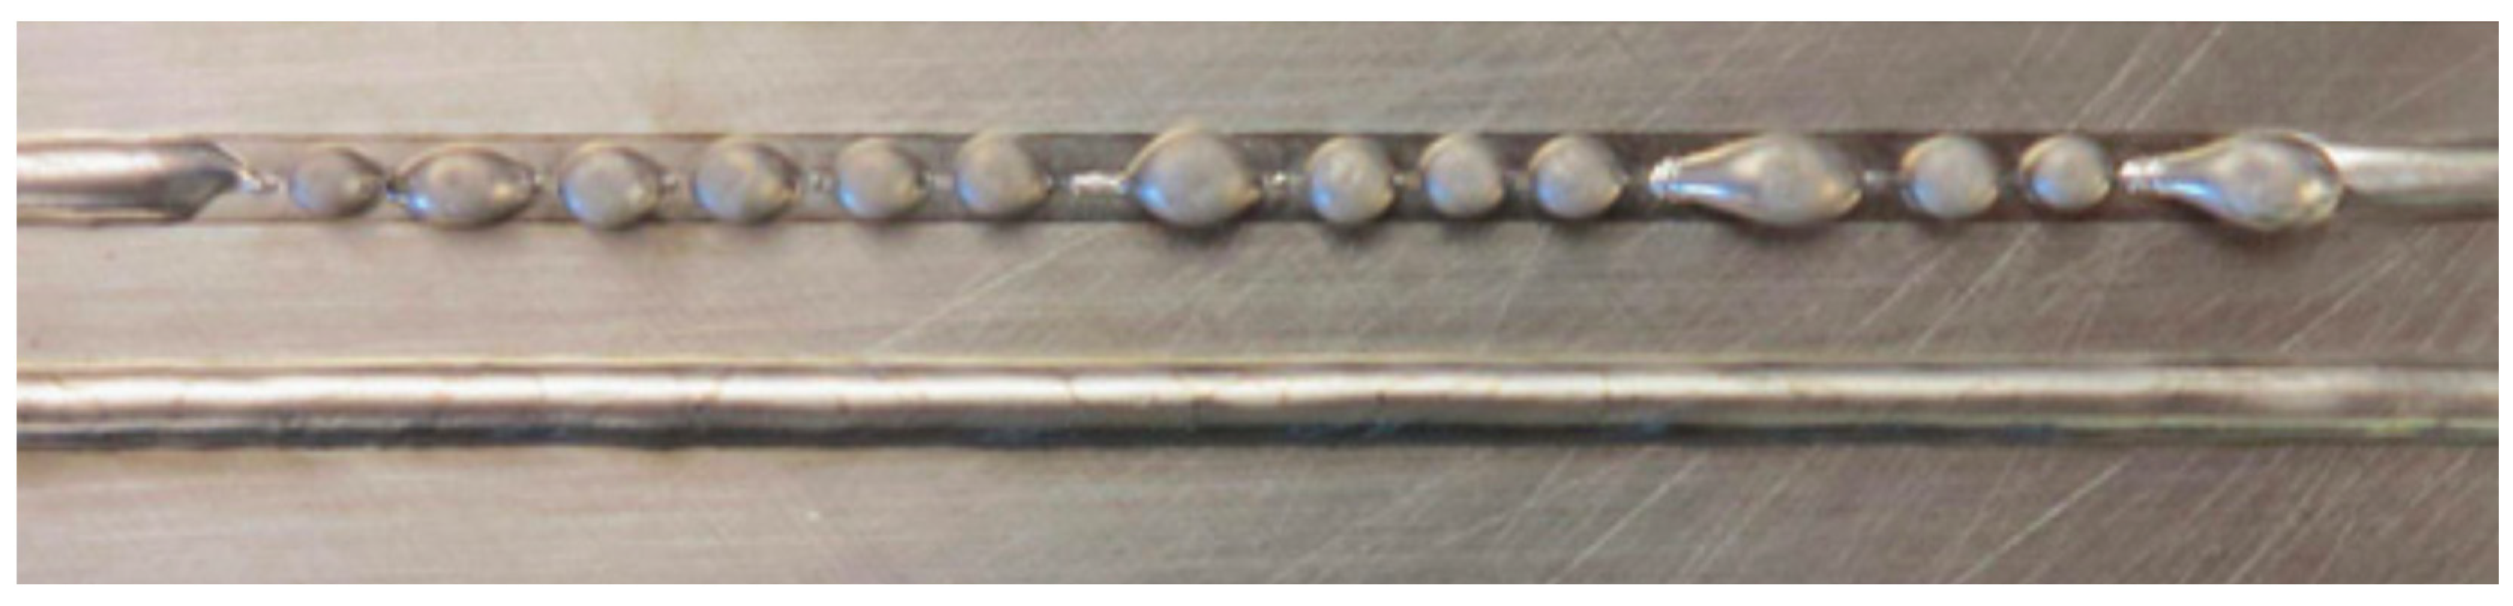
Figure 34.
(a) Example of melt pool image captured by a thermal camera, (b) increase in melt pool temperature and size resulting from increased laser power (reproduced with permission from [221]: copyright 202, MDPI), and (c) example of regulating melt pool temperature by varying laser power set by the PI controller during the deposition of a weld bead (reproduced with permission from [125]: copyright 2022, Journal of Laser Applications).

Figure 35.
(a) Stable transition link between the molten wire tip and the melt pool, (b) narrowing transition link between the molten wire tip and the melt pool, and (c) break of the transition link and occurrence of arcing (reproduced with permission from [34]: copyright 2021, MDPI).
Figure 35.
(a) Stable transition link between the molten wire tip and the melt pool, (b) narrowing transition link between the molten wire tip and the melt pool, and (c) break of the transition link and occurrence of arcing (reproduced with permission from [34]: copyright 2021, MDPI).
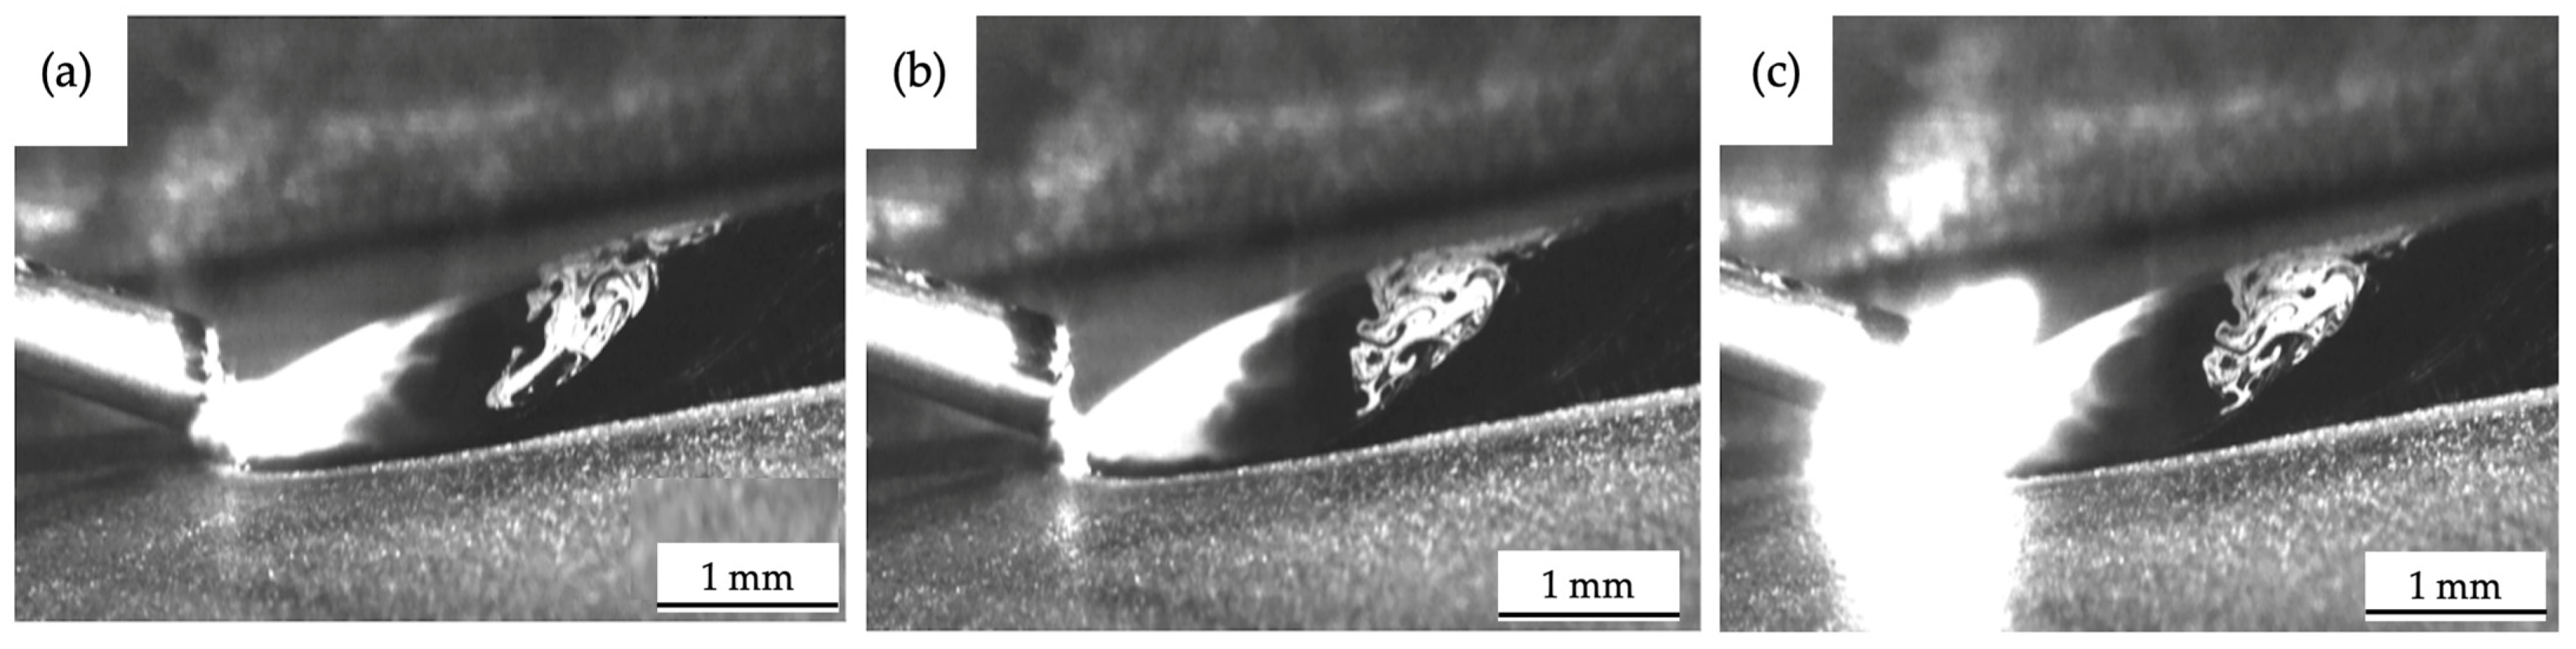
Figure 36.
FEA simulation of (a) temperature profile and (b) melt pool profile. Temperatures are reported in (reproduced with permission from [214]: copyright 2016, Elsevier Ltd.).
Figure 36.
FEA simulation of (a) temperature profile and (b) melt pool profile. Temperatures are reported in (reproduced with permission from [214]: copyright 2016, Elsevier Ltd.).

Figure 37.
(a) The cross-sectional area of the deposited track obtained from experiment and simulation and (b) the temperature distribution profile and fluid flow pattern along the deposition direction. Temperatures are reported in (reproduced with permission from [154]: copyright 2018, Elsevier Ltd.).
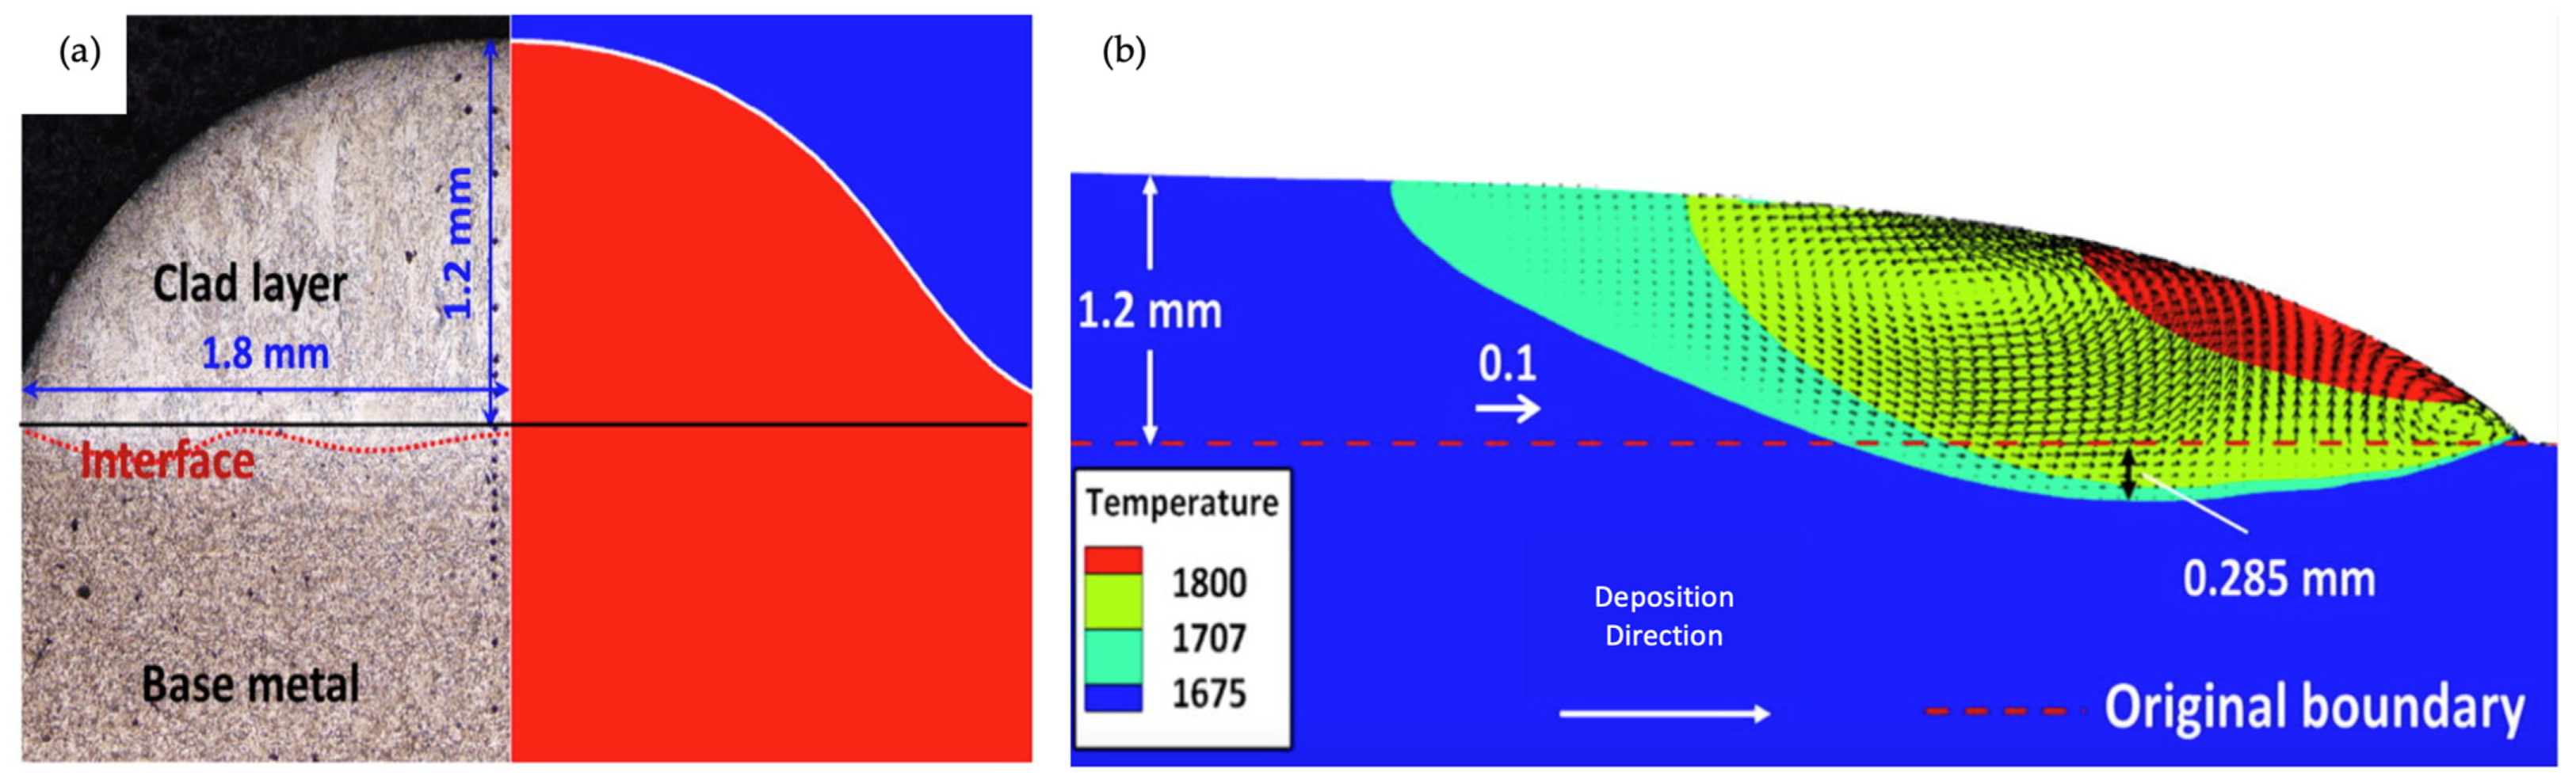
Figure 38.
Temperature field and deposition morphology at (a–d) 10% overlap ratio, (f–j) 20% overlap ratio, and (k–n) 30% overlap ratio as a function of time. (e,j,o) are the cross-sectional areas of 10%, 20%, and 30% overlap ratios, respectively. Temperatures are reported in k (reproduced with permission from [146]: copyright 2022, Journal of Physics).


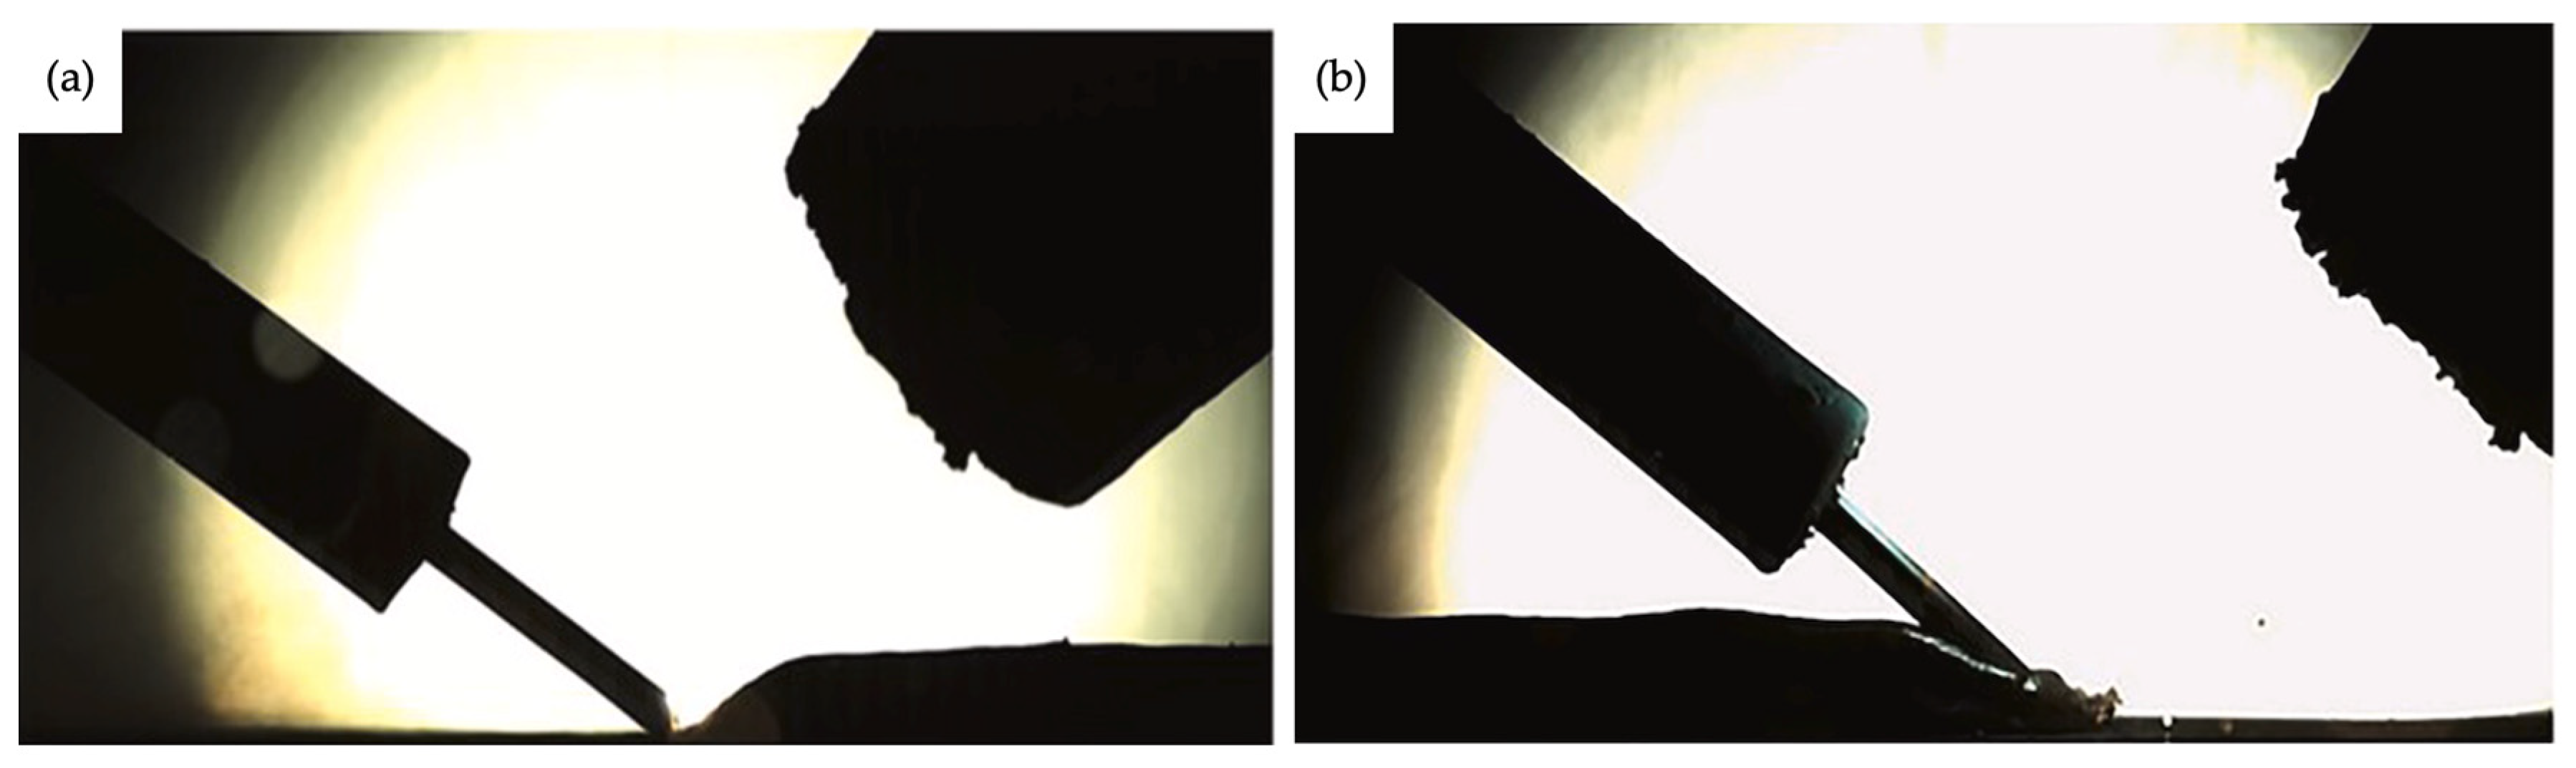
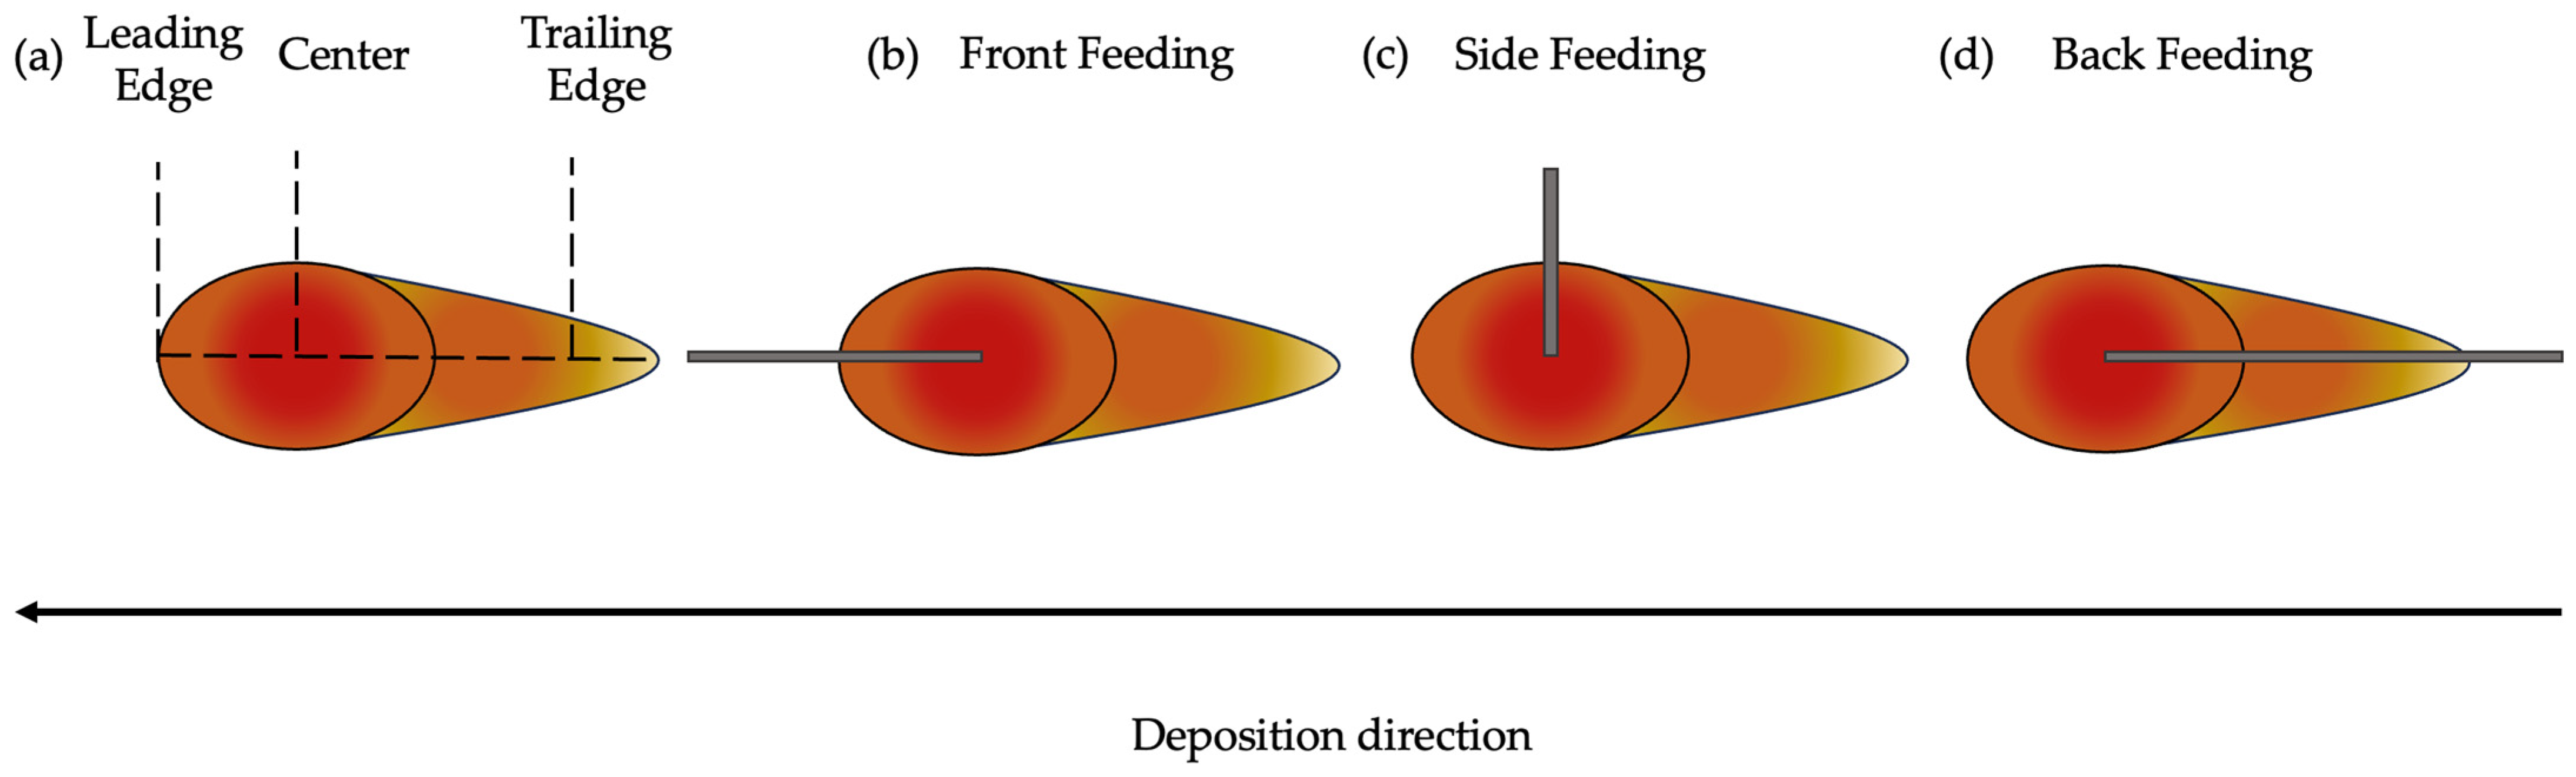
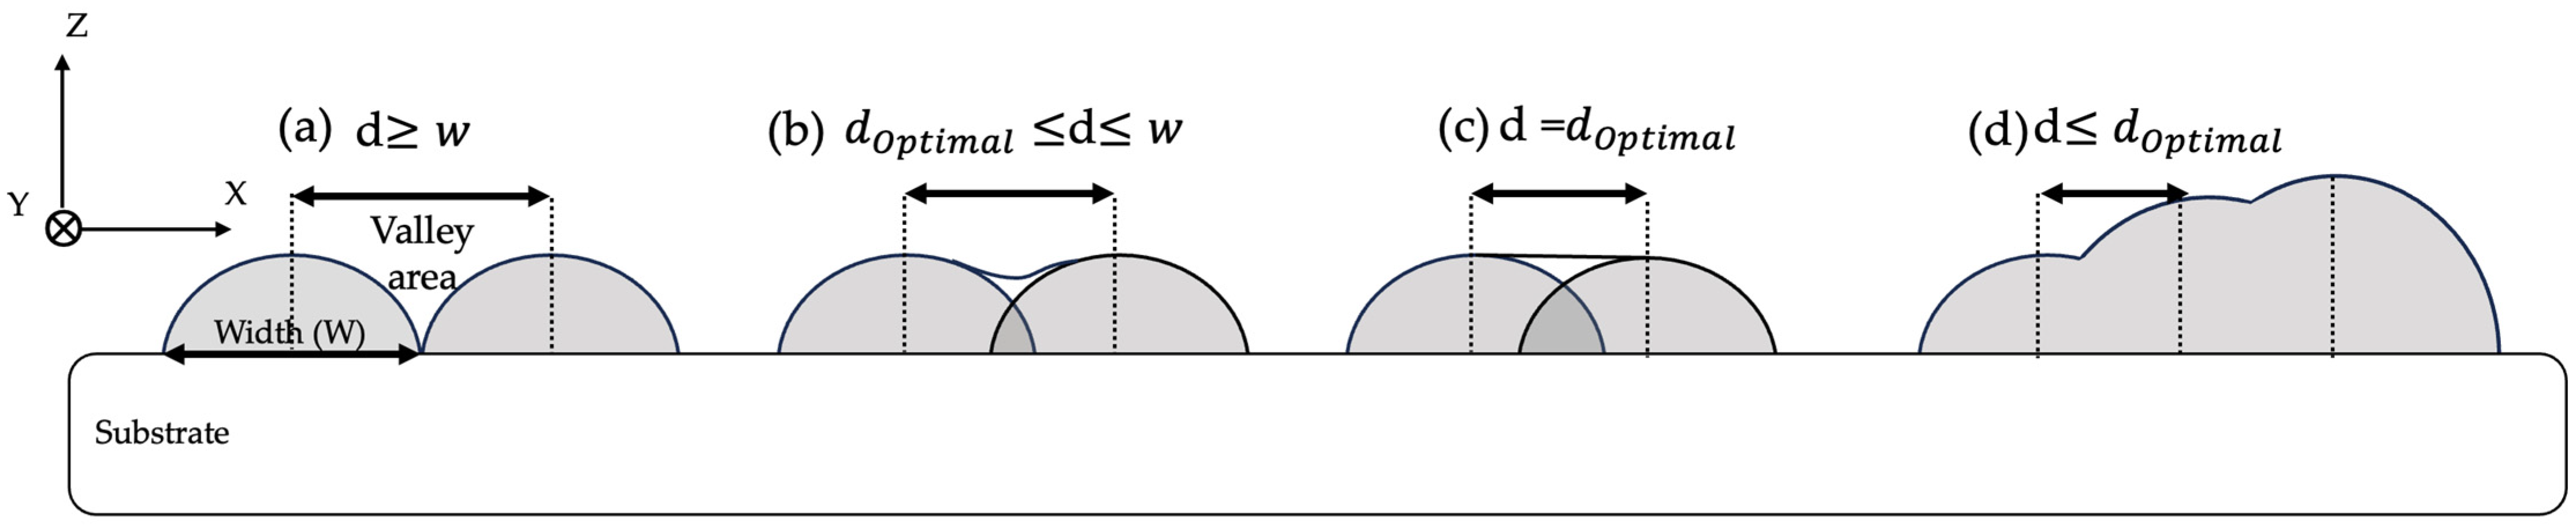
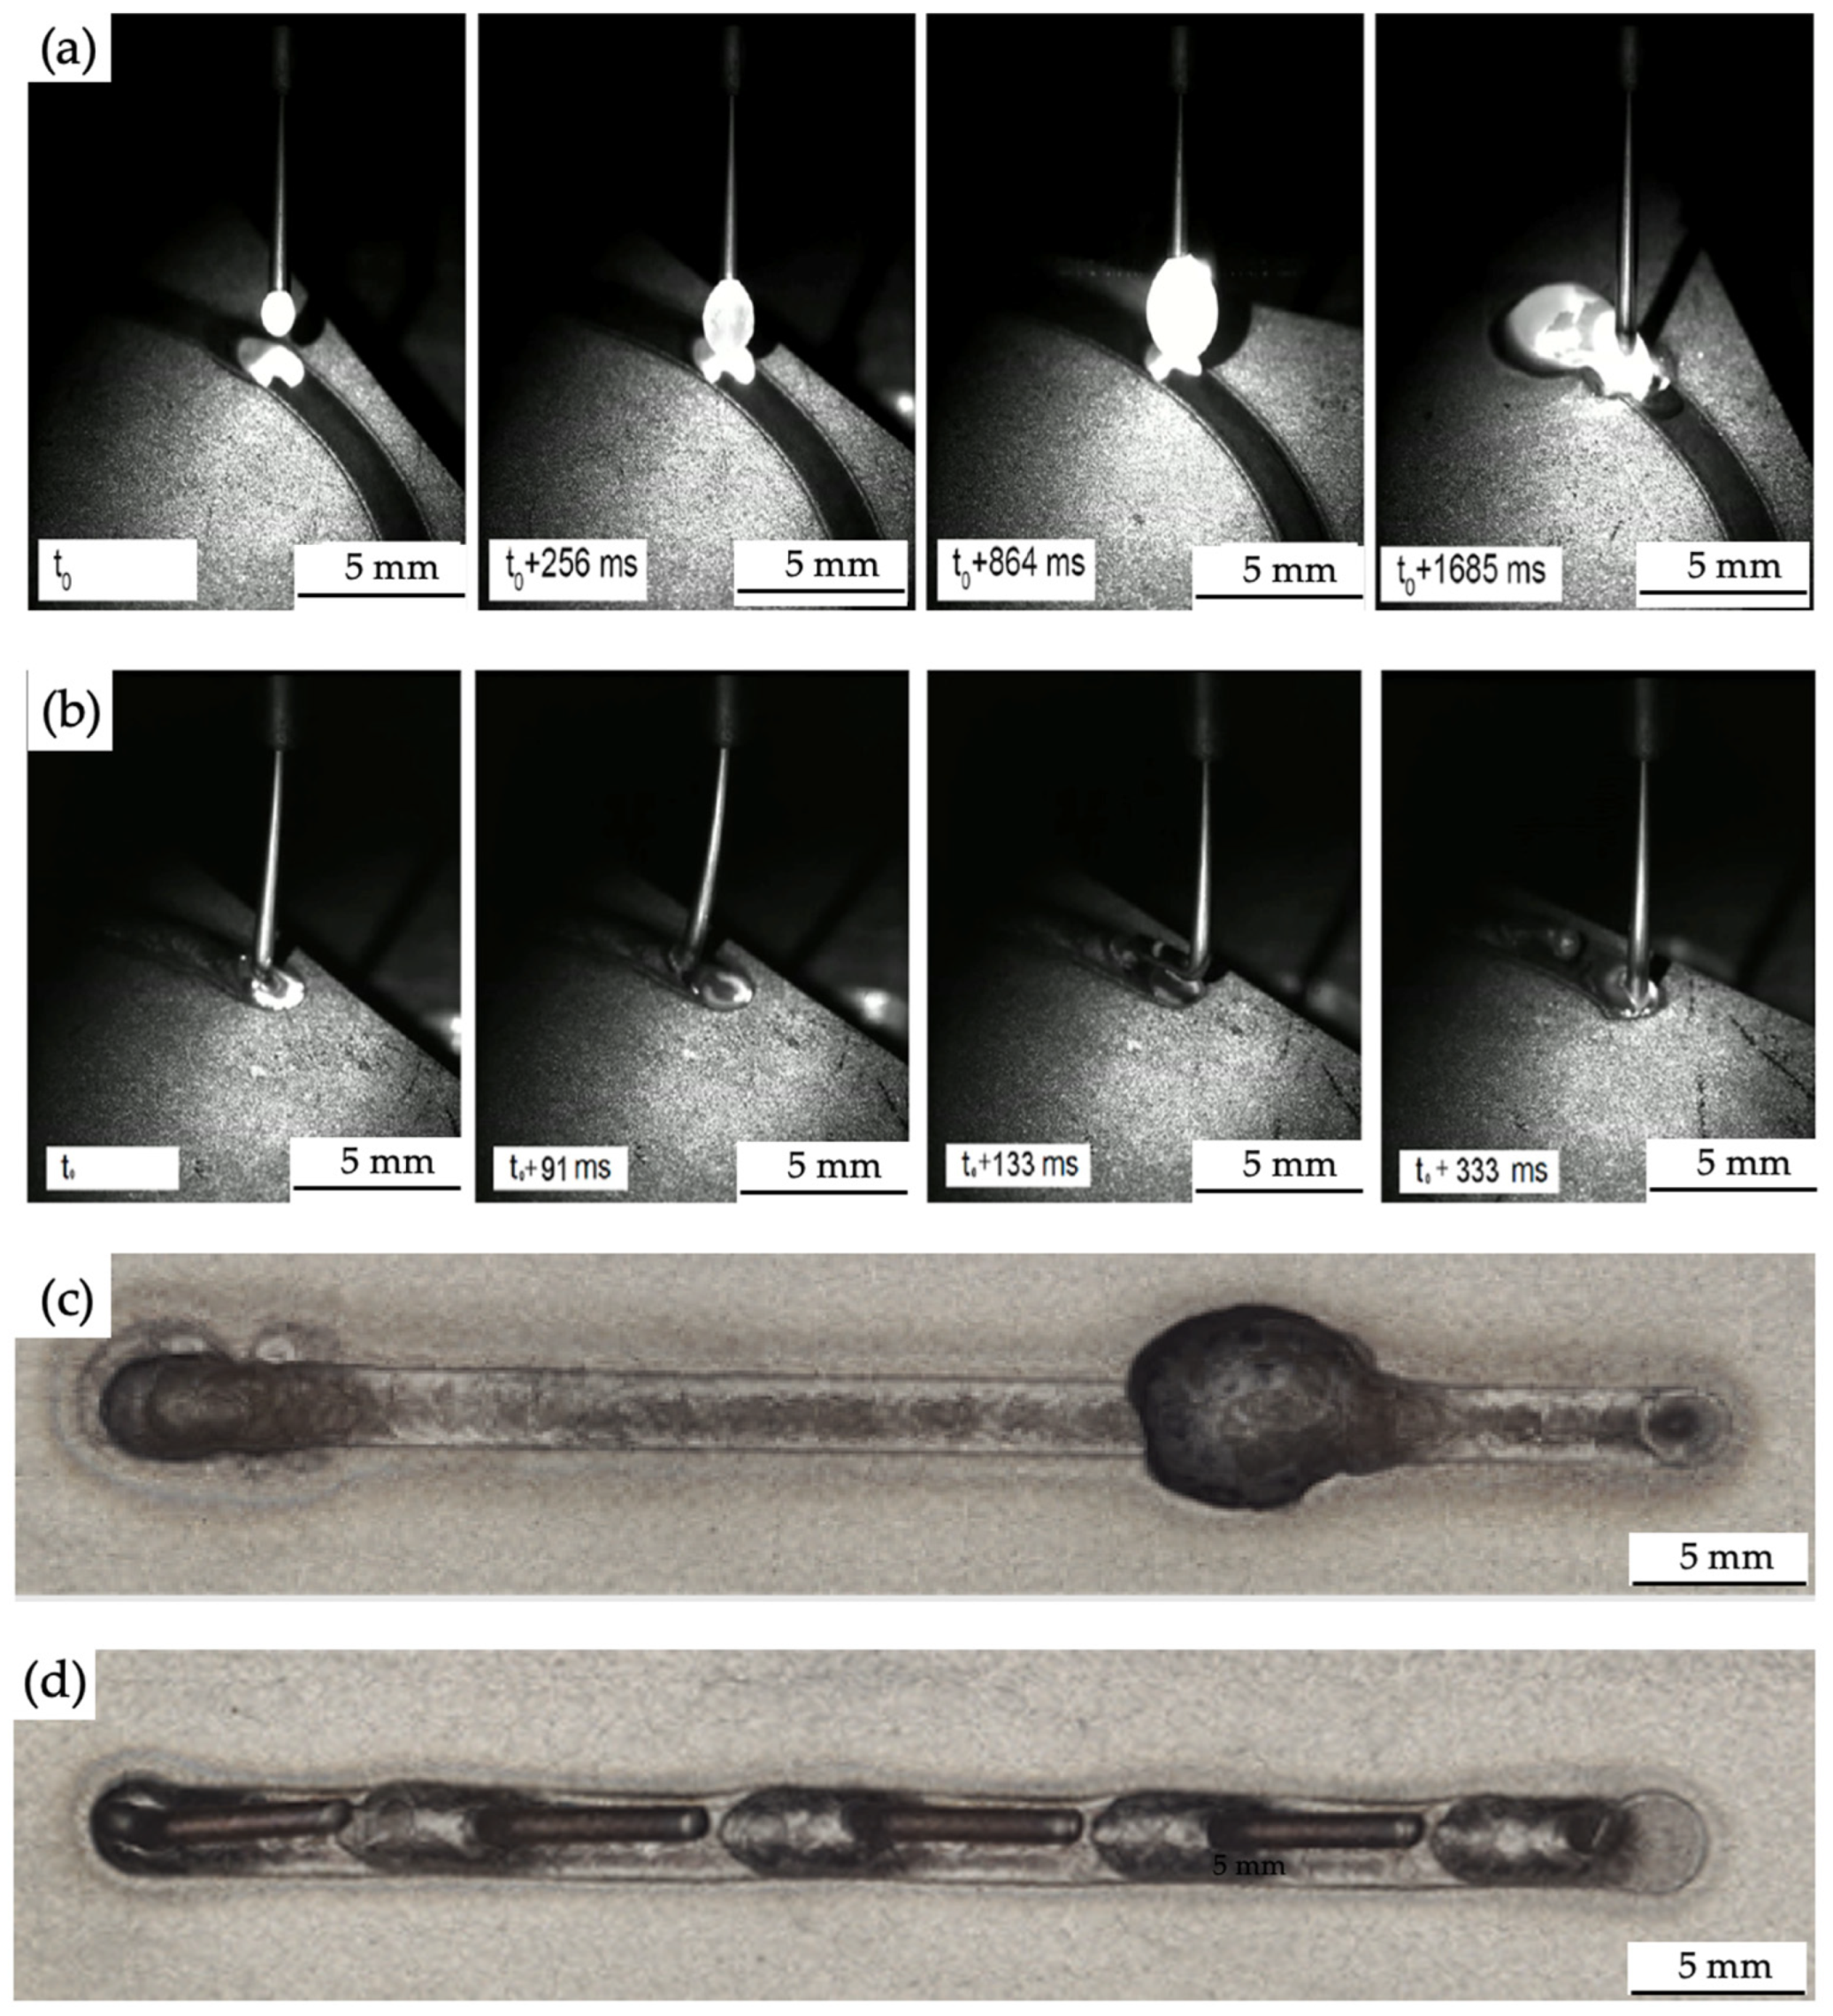
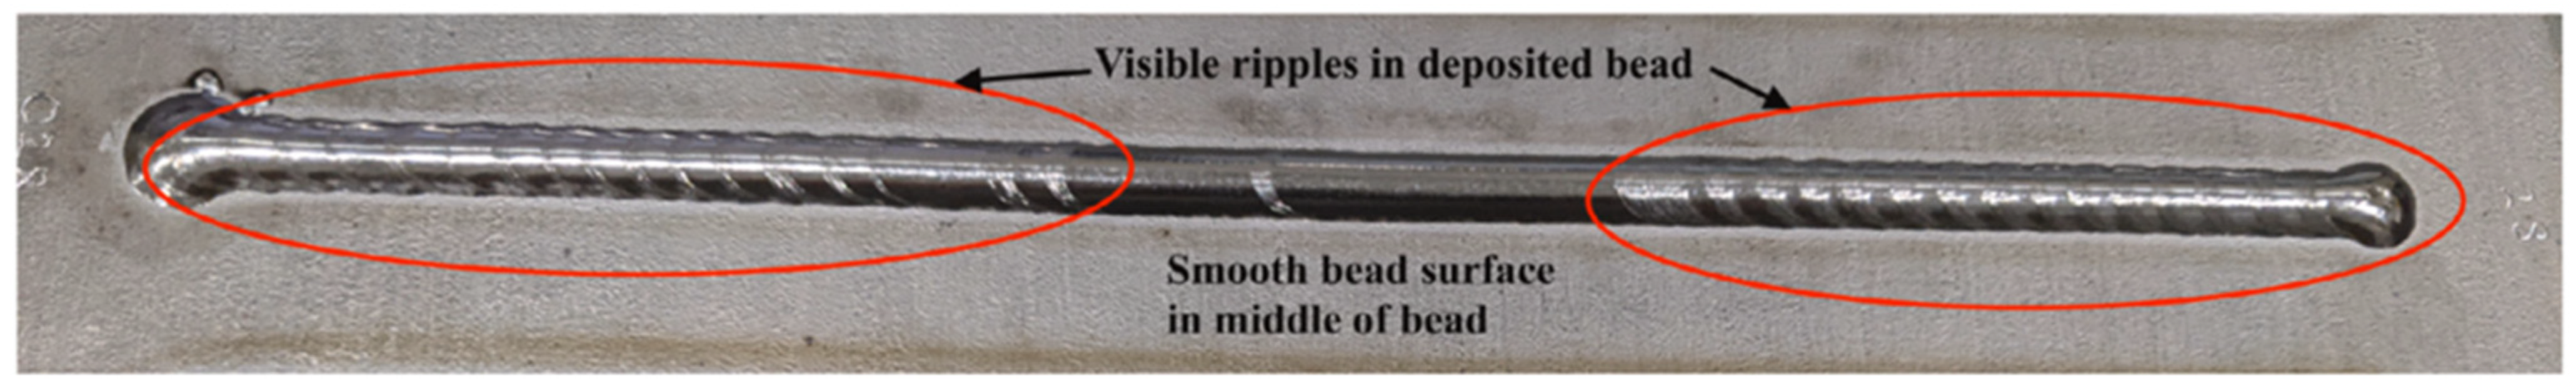
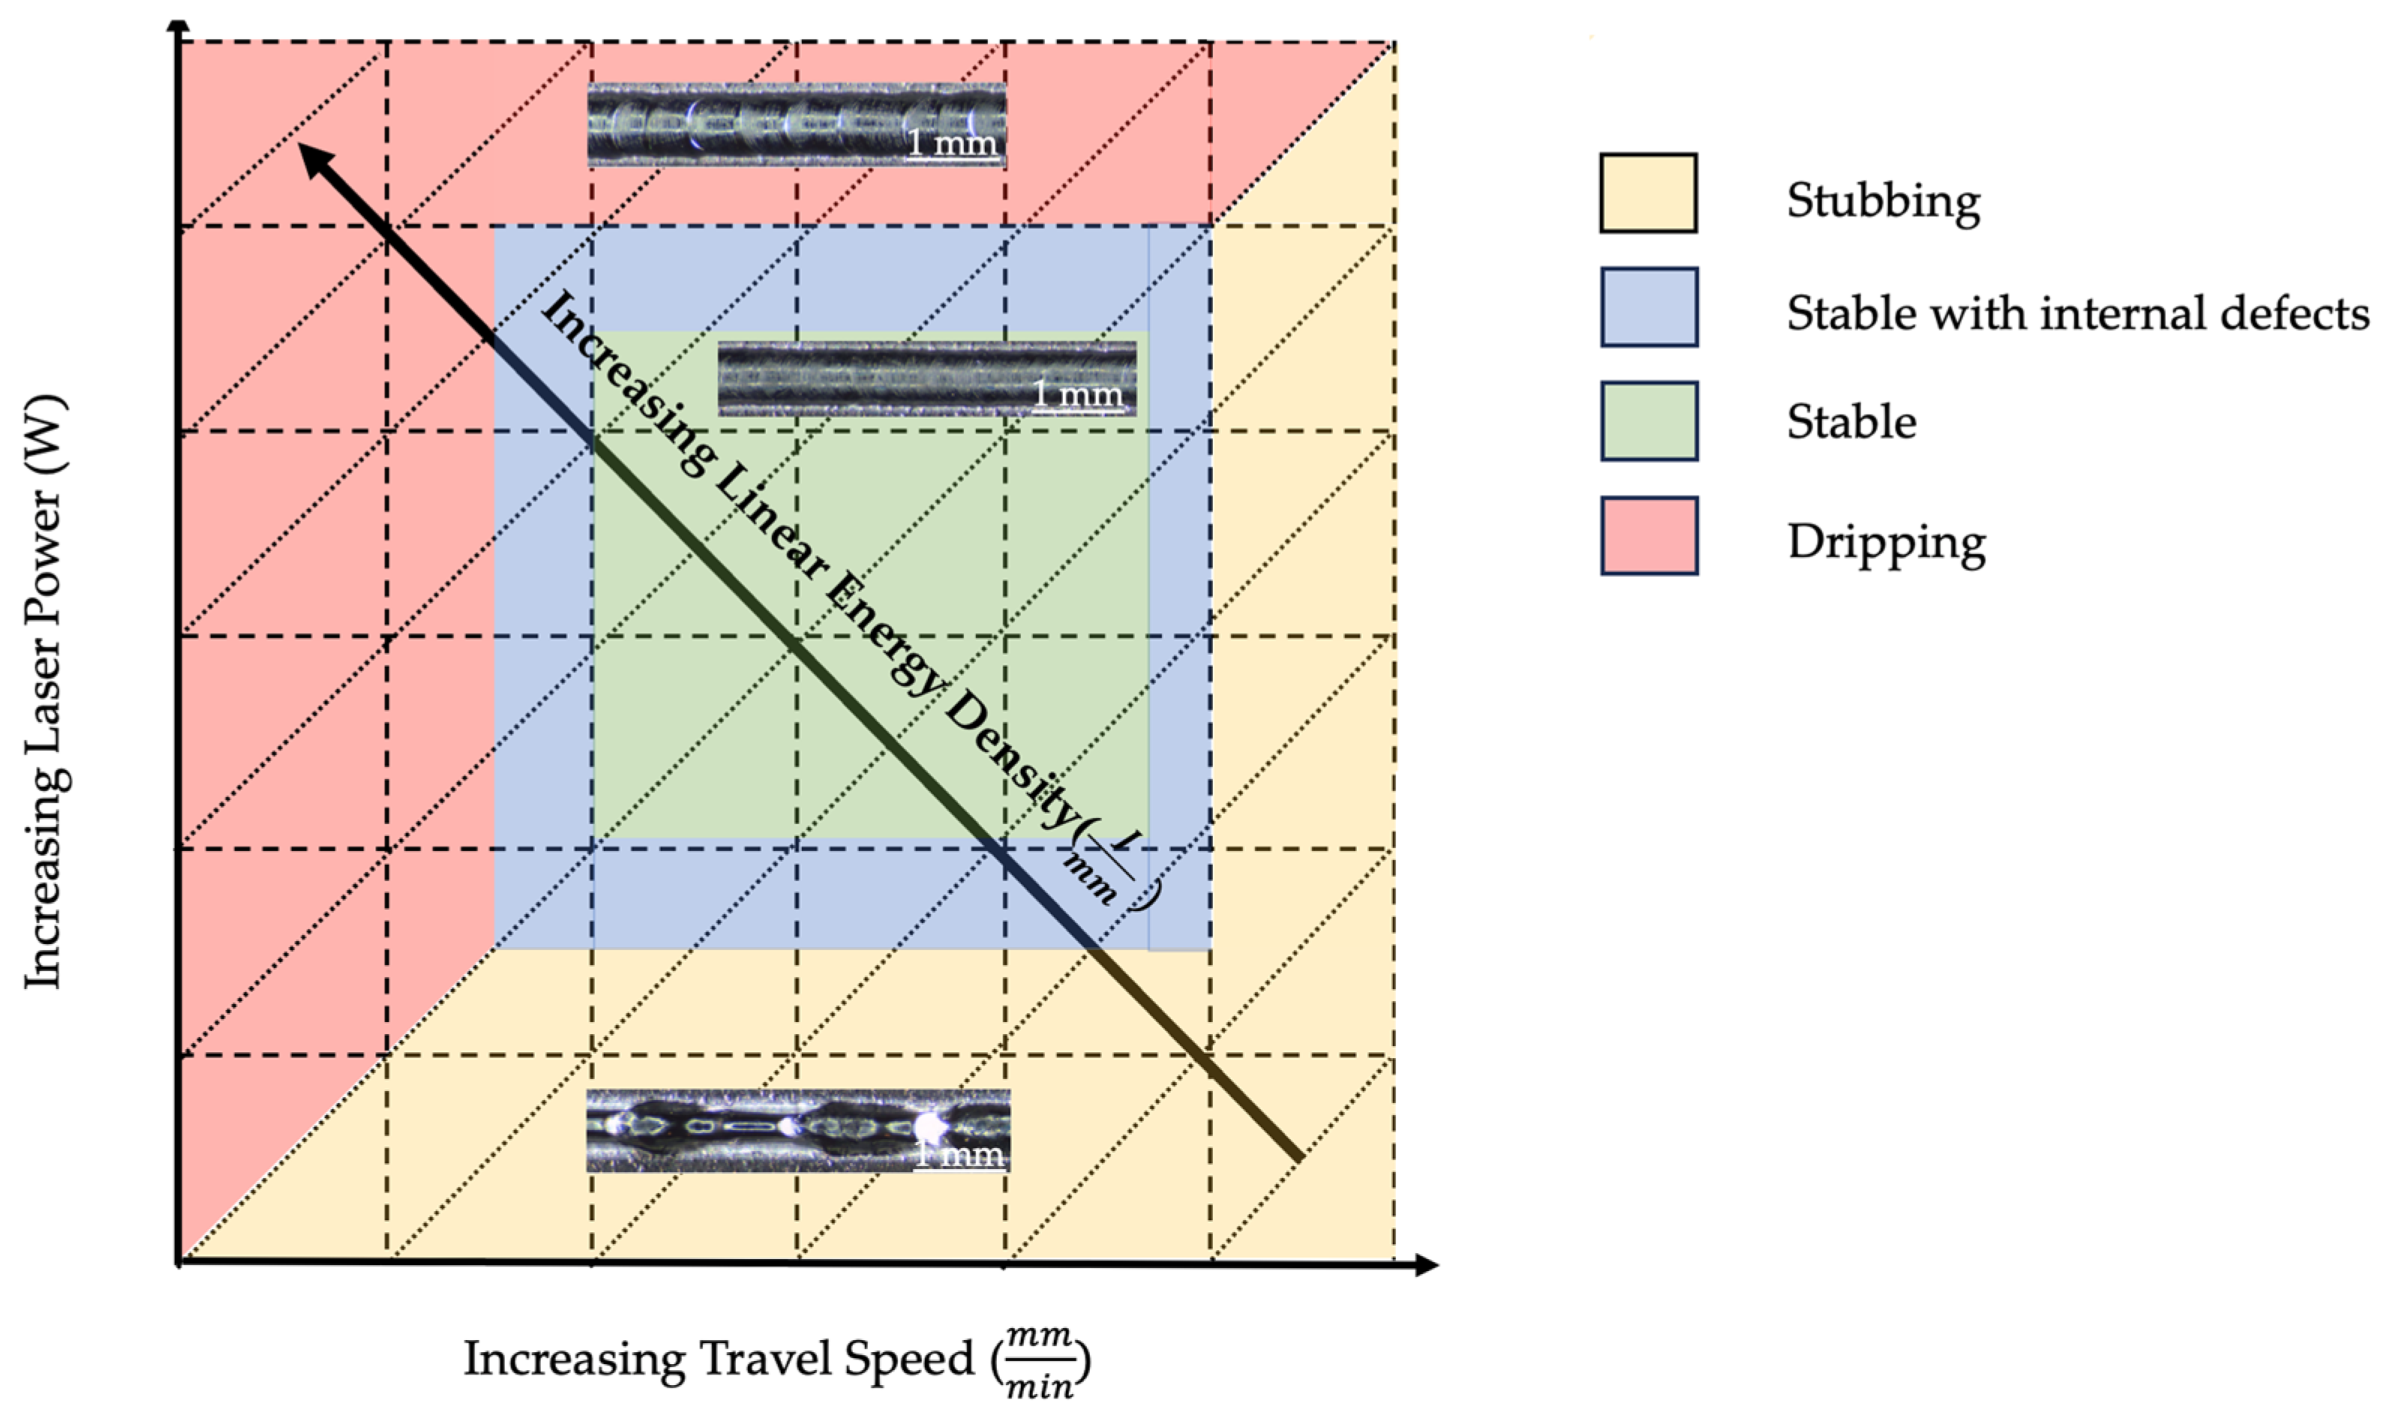
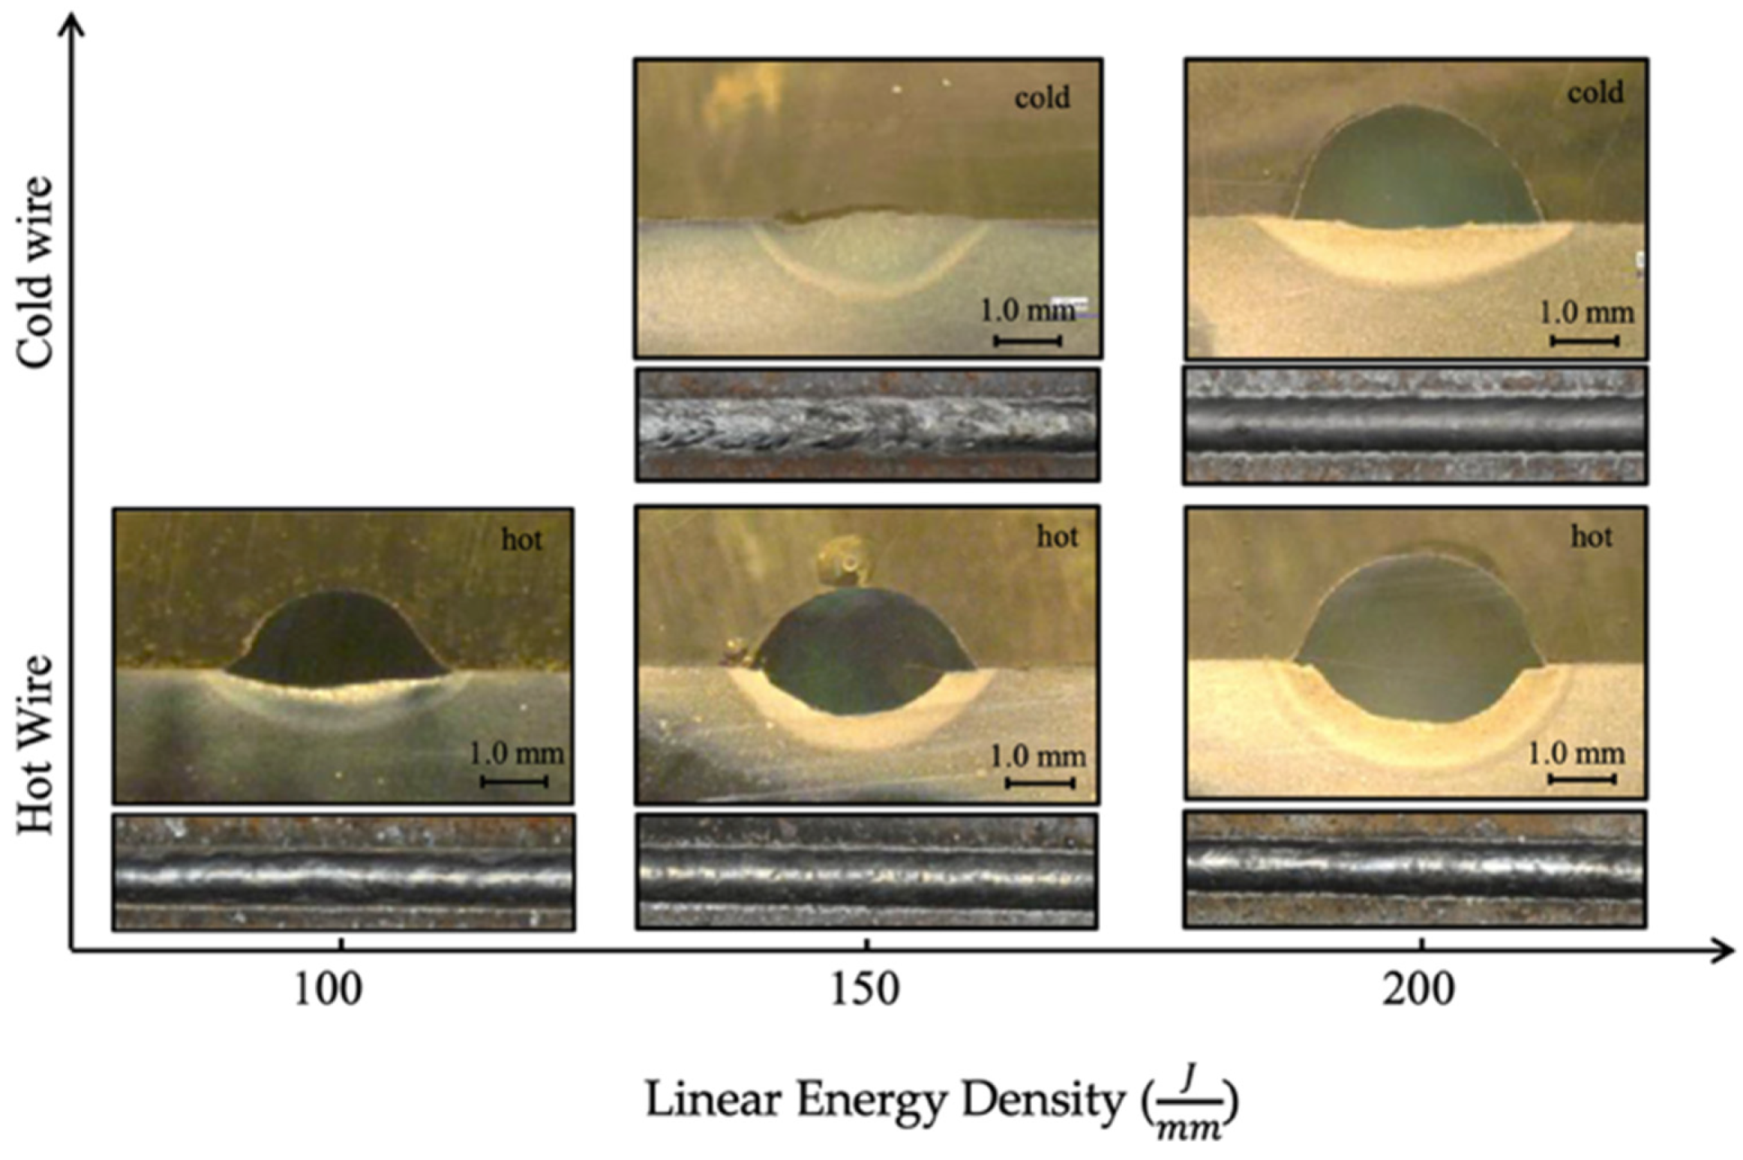
Table 1.
List of abbreviations used in the manuscript.
| Abbreviation | Full Name | Abbreviation | Full Name |
|---|---|---|---|
| AM | Additive manufacturing | HAZ | Heat effected zone |
| MAM | Metal additive manufacturing | LOF | Lack of fusion |
| PBF | Powder bed fusion | CCD | Charge-coupled device |
| LPBF | Laser powder bed fusion | CMOS | Complementary metal oxide semiconductor |
| DED | Directed energy deposition | OCT | Optical coherence tomography |
| EB-DED | Electron beam DED | PI | Proportional-Integral |
| LDED | Laser DED | PLC | Programmable Logic Controller |
| P-DED | Plasma DED | MPC | Model Predictive Control |
| WAAM | Wire arc DED | ILC | Iterative Learning Control |
| W-LDED | Wire-laser DED | FEA | Finite element analysis |
| TS | Travel speed | CFD | Computational fluid dynamics |
| WFS | Wire feed speed | ML | Machine learning |
Table 2.
Advantages and disadvantages of using wire and powder as feedstock.
| Wire | Powder | |
|---|---|---|
| Cost effectiveness | ✓ | |
| Deposition rate | ✓ | |
| Material efficiency | ✓ | |
| Material availability | ✓ | |
| Build volume | ✓ | |
| Dimensional resolution | ✓ | |
| Multi-material deposition capability | ✓ | |
| Health/Safety hazards | ✓ | |
| Ease of handling/storing | ✓ | |
| Contamination sensitivity | ✓ | |
| Oxygen/moisture pickup sensitivity | ✓ |
Table 3.
Summary of dilution, aspect ratio, and contact angle relationship with processing parameters.
Table 3.
Summary of dilution, aspect ratio, and contact angle relationship with processing parameters.
| Dilution | Aspect Ratio | Contact Angle | |
|---|---|---|---|
| ↑ Power | ↑ | ↑ | ↓ |
| ↑ TS | ↑ | ↑ | ↓ |
| ↑ WFR | ↓ | ↓ | ↑ |
Table 4.
Summary of feedstock and substrate material, feeding type, laser type, laser classification, shielding gas, and the machine types used in W-LDED literature.
Table 4.
Summary of feedstock and substrate material, feeding type, laser type, laser classification, shielding gas, and the machine types used in W-LDED literature.
| Wire Material | Diameter (mm) | Wire Feeding Type | Laser Type | Laser Classification | Substrate Material | Shielding Gas | Machine Type | Ref. |
|---|---|---|---|---|---|---|---|---|
| AA4043 | 1.2 | Lateral Front feeding 30 | Fiber laser Diode laser | Continuous | AA5083 | Argon | Custom Built | [74] |
| AA4043 | 0.4 | Coaxial | Fiber laser | Continuous | Ti6Al4V | Argon | Custom Built | [140] |
| AA4047 | 0.4 | Lateral Front feeding 30 | Nd:YAG laser | Pulsed | AA5754 | Argon | Custom Built | [67] |
| AA5A06 | 1.2 | Lateral Front, back feeding 45 | Fiber laser | Continuous | AA4043 | Argon | KUKA 6-axis Robot (Augsburg, Germany) | [47] |
| AA5A06 | 1.2 | Lateral 45 | Fiber laser | Continuous | AA5052 | Argon | Custom Built | [193] |
| AA5078 | 1 | Coaxial | Disc laser | Continuous | AA5078 | Argon | KUKA 6-axis Robot | [122] |
| AA5083 | 1 | Coaxial | Disc laser | Continuous | AlSi1MgMn | - * | KUKA 6-axis Robot | [110] |
| AA5087 | 1 | Lateral Front feeding 35 | Fiber laser | Continuous | AA 5754 | Argon | CNC-supported XYZ-machining center (IXION Corporation) | [62] |
| AA5087 | 1 | Lateral Front feeding 35 | Fiber laser | Continuous | AA5754 | Argon | CNC Controlled Machine | [83] |
| AA5356 | 1 | Coaxial | Fiber-guided disk laser | Continuous | AlSi1MgMn | Nitrogen | CoaxPrinter (Precitec GmbH & Co. KG, Gaggenau, Germany) | [35] |
| AA5356 | 1.2 | - | Fiber Laser | Continuous | AA5052 | - | KUKA 6-axis Robot | [106] |
| AA7075 | 1.2 | Lateral Front, back, side feeding 45 | Disk laser | Continuous | A7075 | Argon | CNC Controlled Machine | [63] |
| AA7075 | 1.2 | - | Disk laser | Continuous | AA7075 | Argon | CNC Controlled Machine | [61] |
| AlSi10Mg | 1.6 | Vertical wire feeding, Inclined laser 50 | Fiber laser | Continuous | AA6061 | Argon | Custom Built | [64] |
| Ti6Al4V | 1.2 | Lateral Front feeding 55 | Diode laser | Continuous | Ti6Al4V | Argon | KUKA 6-axis Robot | [114] |
| Ti6Al4V | 1.2 | Coaxial | Disk laser | Continuous | Ti6Al4V | Argon | KUKA 6-axis Robot | [84] |
| Ti6Al4V | 1 | Lateral Front feeding 50 | Fiber laser | Continuous | Ti6Al4V | Argon | Custom Built | [131] |
| Ti6Al4V | 1.2 | Lateral 30 | Fiber laser | Continuous | Ti6Al4V | Argon | KUKA 6-axis Robot | [197] |
| Ti6Al4V | 1 | Coaxial | Diode lasers | Continuous | - | Argon | Meltio M450 (Jaén, Spain) | [184] |
| Ti6Al4V | 1.2 | Lateral Front feeding 30 | Fiber laser Diode laser | Continuous | AA5083 | Argon | Custom Built | [74] |
| Ti6Al4V | 1.2 | Lateral Front feeding 45 | Customized Laser | Continuous | Ti6Al4V | Argon | CNC Controlled Machine | [198] |
| Ti6Al4V | 1.6 | Lateral 30 | Fiber laser | Continuous | Ti-6Al-4V | Argon | Custom Built | [48] |
| Ti6Al4V | 1.2 | Lateral Front, side, back feeding | Diode laser | Continuous | Ti6Al4V | Argon | CNC Controlled Machine | [113] |
| NAB | 1.14 | Lateral | Fiber laser | Continuous | NAB | - | ABB 6-axis Robot (ABB Robotics, Västerås, Sweden) | [199] |
| AWS ER 100S-G | 1.2 | Lateral Front Feeding | Fiber laser | Continuous | - | Argon | KUKA 6-axis Robot | [56] |
| Mild steel Lincoln ER 100S-G | 1.2 | Lateral Front feeding 40 | Fiber laser | Continuous | - | Argon | KUKA 6-axis Robot | [150] |
| H11 | 1.2 | Lateral 46.5 | Diode laser | Continuous | 42CrMo4 alloy steel | Argon | 5-axis CNC machine | [141] |
| SS 301 | 0.5 | Lateral Front feeding 30 | Nd:YAG laser | Pulsed | SS 316 | Argon | Custom Built | [66] |
| SS 304 | 1.2 | Lateral 35 | Fiber laser | Continuous | SS 304 | - | - | [93] |
| SS 304 | 0.5 | Coaxial | Co2 Laser | Continuous | SS 304 | - | - | [72] |
| SS 304 | 0.1 | Lateral 20 | Nd:YAG laser | Pulsed | SS316 | Argon | Custom Built | [65] |
| SS 308L | 1.2 | Lateral Front feeding 45 | Diode laser | Continuous | 590-MPa- class steel | Argon | Custom Built | [108] |
| SS 308 | 1 | Coaxial | Fiber laser | Pulsed | SS 316 | Argon | ABB 6-axis Robot | [57] |
| SS 308LSi | 1.2 | Lateral Front feeding 42 | Fiber laser | continuous | SS 304 | Argon | CNC Controlled Machine | [112] |
| SS 309 | 1 | Coaxial | Diode lasers | Contiguous | SS304 | Argon | Meltio M450 | [59] |
| SS 309 | 0.9 | Coaxial | Diode lasers | Continuous | AISI 1018 | Argon | Meltio M450 | [159] |
| SS 316L | 0.8 | Coaxial | Fiber laser | Continuous | C45 Carbon Steel | Argon | ABB 6-axis Robot | [89] |
| SS 316LSi | 1 | Coaxial | Disk laser | Continuous | SS 304 | Argon | KUKA 6-axis robot | [174] |
| SS 316LSi | 1.2 | Lateral Side feeding | Fiber laser | Continuous | SS 304 | Argon | KUKA 6-axis Robot | [51] |
| SS 316L | 0.8 | Lateral Front feeding 35–45 | Fiber laser | Continuous | SS 316L | Argon | ABB 6-axis Robot | [33] |
| SS 316 | 0.9 | Coaxial | Diode laser | Continuous | SS316 | Argon | Meltio M450 | [118] |
| SS 316 | 0.8 | Lateral Front feeding | Fiber laser | Continuous | SS 316 | Argon | ABB 6-axis Robot | [148] |
| SS 316 | 1 | Coaxial | Disk laser | Continuous | SS 304 | Argon | KUKA 6-axis Robot | [125,126] |
| SS 316L | 1 | Coaxial | Disc laser | Continuous | SS 304 | - | KUKA 6-axis Robot | [110] |
| SS 316 | 0.6 | Coaxial | Fiber laser | Pulsed | SS304 | Argon | Custom Built | [81] |
| DSS 2209 | 1.2 | - | Fiber laser | Continuous | DSS 2205 | - | ABB 6-axis Robot | [34] |
| DSS 2209 | 1.2 | Lateral | Fiber laser | continuous | DSS 2205 | Argon | ABB 6-axis Robot | [190] |
| DSS 2209 | 1.2 | - | Fiber laser | Continuous | DSS 2205 | Argon Nitrogen | ABB 6-axis Robot | [101] |
| DSS 2209 | 1.2 | Lateral | Fiber laser | Continuous | DSS 2205 | Argon | ABB 6-axis Robot | [151] |
| DSS 2209 | 0.8 | Coaxial | Fiber laser | Continuous | SS | Argon | KUKA 6-axis Robot | [95] |
| INC 718 | 1 | Coaxial | Diode laser | Continuous | SS 304 | Argon | Custom Built | [54] |
| INC 718 | 1 | Lateral Front feeding | Diode laser | Continuous | INC 718 | Argon | 5-axes CNC machine | [130] |
| INC 718 | 0.89 | Coaxial | Fiber laser | Continuous | INC 718 | Argon | ABB 6-axis Robot | [102] |
| INC 718 | 0.9 | Coaxial | Diode lasers | Continuous | INC 718 | Argon | μPrinter (Additec, USA) | [73] |
| INC 718 | 0.9 | - | Fiber laser | Continuous | INC 718 | Argon | Custom Built | [200] |
| INC 625 | 1.2 | Lateral Front feeding 42 | Fiber laser | Continuous | SS 304 | Argon | CNC controlled table | [58] |
* The “-” entries denote missing information that was not provided in the respective references.
Table 5.
Summary of the utilized monitoring and control systems in W-LDED.
| Input Variable | Controlled Variable | Monitoring | Sensor Position | Controller | Ref. |
|---|---|---|---|---|---|
| TS | Layer height | Structured light scanner | Off-axis | Closed loop | [127] |
| Deposition head Z position | Layer height | Structured light scanner | Off-axis | Closed loop | [144] |
| Deposition head Z position | Laser power | High speed camera, Laser line scanner | Off-axis | Closed loop | [57] |
| WFS | Layer height | OCT | In-axis | Closed Loop, PI Controller | [35] |
| Input temperature | Bead height | Laser profilometer | In-axis | MPC | [222] |
| WFS, Deposition head Z position | Layer height | 3D scanning system | In-axis | ILC, Step-height compensator | [111] |
| Laser power, WFS | Bead geometry | Cameras, Projected laser line | In-axis, Off-axis | PI-controller, Feed-forward compensator | [213] |
| Laser power, WFS | Bead geometry | Camera, Projected laser line | Off-axis | Closed loop | [107] |
| Laser power, Deposition rate, | Melt pool size, Laser power | Thermal camera | In-axis | Closed loop | [203] |
| Laser power | Melt pool size | Thermal camera | In-axis | Closed loop | [221] |
| WFS, Laser power | Bead height, Melt pool temperature | OCT, IR camera | In-axis | Closed loop | [125] |
| Laser power | Melt pool temperature | Pyrometer | In-axis | PI controller | [126] |
| Laser power | Melt pool temperature | Pyrometer | In-axis | PLC | [128] |
| WFS | Bead height | Camera, Laser line scanner | In-axis, Off-axis | Closed loop | [98] |
| Laser power, WFS | Melt pool temperature | Pyrometer | In-axis | Closed loop | [85] |
| Wire Preheating voltage and current | Liquid bridge transfer | Camera, Measurement circuit | In-axis Off-axis | PLC | [34] |
Table 6.
Summary of modeling and predicting methods utilized in W-LDED.
| Process Input | Predicted Output | Modelling Approach | Material | Ref. |
|---|---|---|---|---|
| Different deposition strategy | Temperature field | Numerical FEA | Ti6Al4V | [240] |
| Different ambient pressure | Bead geometry | Numerical CFD-ANSYS | SS 316 | [40] |
| Different beam shape and sizes | Bead geometry, Melt pool temperature | Numerical COMSOL | SS 316 | [87] |
| Increasing deposited layers | Melt pool temperature, Temperature profile | Numerical FEA | H13 | [214] |
| Different parameter set | Bead geometry, Melt pool geometry | Numerical ANSYS | SS 304 | [154] |
| Varying overlap ratio | Geometry of the multi-track deposition | Numerical Fluent | 5A06 aluminum | [146] |
| Different parameter set | Melt pool temperature, Melt pool geometry | Numerical FEA | AA5078 | [122] |
| Different deposition strategy | Temperature field | Numerical Flow 3D | 316L SS | [118] |
| Different scanning strategies | Temperature field | Numerical Flow 3D | INC 718 | [73] |
| Different focal position | Melt pool temperature | Numerical COMSOL | 304 SS | [100] |
| Different parameter set | Temperature field | Numerical FE-model | Al-mg | [182] |
| Different parameter set | Melt pool temperature | Python | Ti-6Al-4V | [48] |
| Wire tip temperature | Wire preheating temperature | Analytical | ER5A06 | [193] |
| Different parameter set | Bead geometry | Analytical | ER5A06 | [47] |
| Different parameter set | Bead geometry, Melt pool geometry | Analytical | SS 316 | [117] |
| Different parameter set | Bead geometry | ML Neural networking | INC 718 | [180] |
| Different parameter set | Bead geometry | Empirical model | INC 718 | [233] |
| Different parameter set | Melt pool geometry | ML | Ti6Al4V | [228] |
| Different parameter set | Bead geometry | ML | Ti6Al4V | [137] |
Disclaimer/Publisher’s Note: The statements, opinions and data contained in all publications are solely those of the individual author(s) and contributor(s) and not of MDPI and/or the editor(s). MDPI and/or the editor(s) disclaim responsibility for any injury to people or property resulting from any ideas, methods, instructions or products referred to in the content. |
© 2024 by the authors. Licensee MDPI, Basel, Switzerland. This article is an open access article distributed under the terms and conditions of the Creative Commons Attribution (CC BY) license (https://creativecommons.org/licenses/by/4.0/).
Share and Cite
MDPI and ACS Style
Ghanadi, N.; Pasebani, S. A Review on Wire-Laser Directed Energy Deposition: Parameter Control, Process Stability, and Future Research Paths. J. Manuf. Mater. Process. 2024, 8, 84. https://doi.org/10.3390/jmmp8020084
AMA Style
Ghanadi N, Pasebani S. A Review on Wire-Laser Directed Energy Deposition: Parameter Control, Process Stability, and Future Research Paths. Journal of Manufacturing and Materials Processing. 2024; 8(2):84. https://doi.org/10.3390/jmmp8020084
Chicago/Turabian StyleGhanadi, Nahal, and Somayeh Pasebani. 2024. "A Review on Wire-Laser Directed Energy Deposition: Parameter Control, Process Stability, and Future Research Paths" Journal of Manufacturing and Materials Processing 8, no. 2: 84. https://doi.org/10.3390/jmmp8020084