
A Selective Integration-Based Adaptive Mesh Refinement Approach for Accurate and Efficient Welding Process Simulation
1
School of Mechanical and Electrical Engineering, Soochow University, Suzhou 215137, China
2
Joining and Welding Research Institute, Osaka University, Ibaraki 567-0047, Osaka, Japan
*
Author to whom correspondence should be addressed.
J. Manuf. Mater. Process. 2023, 7(6), 206; https://doi.org/10.3390/jmmp7060206
Submission received: 9 October 2023
/
Revised: 4 November 2023
/
Accepted: 21 November 2023
/
Published: 24 November 2023
(This article belongs to the Special Issue Advanced Joining Processes and Techniques 2023)
Abstract
:To save computational time and physical memory in welding thermo-mechanical analysis, an accurate adaptive mesh refinement (AMR) method was proposed based on the feature of moving heat source during the welding. The locally refined mesh was generated automatically according to the position of the heat source to solve the displacement field. A background mesh, without forming a global matrix, was designed to maintain the accuracy of stress and strain after mesh coarsening. The solutions are always carried out on the refined computational mesh using a selective integration scheme. To evaluate the performance of the developed method, a fillet welding joint was first analyzed via validation of the accuracy of conventional FEM by experiment. Secondly, a larger fillet joint and its variations with a greater number of degrees of freedom were analyzed via conventional FEM and current AMR. The simulation results confirmed that the proposed method is accurate and efficient. An improvement in computational efficiency by 7 times was obtained, and memory saving is about 63% for large-scale models.
1. Introduction
Fusion welding has been widely employed in modern industries such as ship construction and aerospace and automobile manufacturing for its excellent joining capability. Usually, a large amount of heat is produced by arc, plasma, or laser, etc., in a local area of the welding joint. Due to the high temperature and internal constraint, the welding metal and local base material will expand and reach a compressive plastic state. At the cooling stage, the welded region is subjected to non-uniform shrinkage, leading to welding distortion and residual stress. As a result, the dimension and quality of the welded component could deteriorate before the subsequent production process.
For several decades, engineers and researchers have made a great effort to explore the mechanism of welding residual stresses and deformations, and they tried to predict or measure the welding deformation and residual stress via empirical equations or simplified models as shown by Goldak and Ma et al. [1,2,3,4,5]. The advent of computer systems and the finite element method (FEM) made it realistic to simulate welding for detailed stress and strain. Initially, only one- or two-dimensional problems could be solved due to the limitation of computer speed and memory. Ueda and Yamakawa proposed a 2D finite element method using triangle plane elements to obtain transient temperature and stress [6]. They calculated the transient and residual stresses of a bead on a plate welded by a moving electrode with consideration of a change in the mechanical properties with temperature. Andersson investigated the residual stresses induced by submerged arc welding using membrane elements in the cross section [7]. In the late 1980s, a three-dimensional model for local joints was employed for the simulation of welding stresses. Ueda et al. later established a non-stationary thermal conduction analysis and elastic–-plastic analysis model, and the characteristics of residual stresses and plastic strains in thick plates were examined [8]. Tekriwal developed a mathematical model to simulate the TIG welding process; the weld bead dimensions estimated were in close agreement with experimental results [9]. Karlsson performed a three-dimensional welding simulation for circumferential butt welding and found that the variation in residual stress and deformation exists around the pipe [10].
Although large-size computers with fast speed and large memory have become available for research institutes and certain companies nowadays, a full process simulation of practical welded structures, such as the assembly of ship blocks, still remains a large challenge. The major reason is that the finite element model of stress analysis needs to take the global structure into account, which means a tremendous number of mesh and time steps in the process simulation. For example, engineering structures have many welds that can easily reach several tens or hundreds of meters in total length. Transient simulation of the welding process will need weeks to years of computational time. As there is an increasing need to analyze large-scale welded structures, such as multi-pass welding, it is urgent to develop accurate and efficient algorithms to compute welding deformation and residual stress. The past two decades have seen great progress in analysis methodology to enhance the computation performance. Atluri et al. [11,12] developed a meshless method based on the local Petrov–Galerkin approach for heat conduction finite element analysis. Anisotropic heat conductance can be simulated efficiently and accurately. Murakawa et al. investigated an iterative substructure method (ISM), which solves different nonlinear regions in the model separately, and the boundary of the highly nonlinear region is kept consistent via iteration [13,14,15]. Shibahara developed a novel idealized explicit FEM to simulate transient thermal and mechanical processes [16]. The computational speed was increased by ten times compared to conventional FEM. Ma [17] proposed an accelerated explicit FEM to reduce the computational costs in the analysis of a large construction machinery structure. The temperature history was scaled by determining the time over a constant temperature increment.
In addition, the remeshing technique or adaptive mesh refinement (AMR) has also been implemented in thermal elastic–plastic FEM for welding simulation. Hamide et al. [18] introduced an adaptive mesh technique based on tetrahedral elements for the transient thermal–metallurgical modeling of arc welding. The mesh density can be varied in an arbitrary direction to fit the thermal gradient. Hu et al. [19] proposed an octree-based adaptive mesh refinement approach for 3D modeling of keyhole-mode welding by a laser beam. While heat and fluid flow analyses focus on the temperature field in a local domain, stress analysis has to take the whole structure into account. Lindgren et al. initiated a type of transition element that has variable nodes to model an electron beam welding (EBW) of a copper canister, and furthermore, designed a posterior error estimator to optimize the remeshing procedure [20,21]. Duranton et al. applied linear constraints on the interface of non-conformable elements with the aid of a penalty method, and they successfully simulated the multi-pass welding process in a stainless pipe [22]. However, most AMRs employ coarsening in the region after the heat source moves away, which will cause inevitable errors in analysis due to the sudden loss of a local detailed solution. The current literature report a simulation speedup factor in a range of 2 to 4 by using the remeshing technique [23] when the welding distortion and stresses are solved. Shi et al. [24] reported only a 30% improvement in computational efficiency if the refined mesh is not transformed into coarse mesh to keep the solution accurate.
Huang and Murakawa [25] proposed a mesh refining method by introducing a background mesh to compensate for global solution accuracy. However, the computation of the stiffness matrix of the background mesh involves a large amount of computer memory and solution time as well. In this study, a simple but efficient AMR method is proposed with formulations of equivalent stiffness matrix and nodal force vector on locally refined mesh. Additionally, the computation flow of the proposed AMR method is shown in detail. A fillet welding model with an L-shaped stiffener is simulated by the conventional finite element method (C-FEM) and the newly developed adaptive mesh refinement (N-AMR) method. Comparisons are made between N-AMR and C-FEM to validate the accuracy. A series of fillet welding models of different lengths are analyzed to investigate the computation efficiency of the proposed scheme. Finally, the potential application and limitations of the developed approach are discussed.
2. Concept and Implementation of Adaptive Mesh Refinement
2.1. Basic Concept
Fusion welding features a highly concentrated heat source that travels along a predefined path to join the two parts together. For simulation using conventional FEM, the region near the welding path should be meshed with fine elements, while the rest region can be meshed into coarse elements. The AMR method takes advantage of the fact that only a small region near the moving heat source has a large thermal gradient at a specific time. Therefore, a locally refined mesh around the heat source can be employed to reduce the number of degrees of freedom (DOF) in the heat conduction analysis. However, the heated zone will have a very complex distribution of stress and plastic strain. A fine mesh description for the welded region is still needed to keep the stress resolution and update the solution as necessary. On the other hand, as the welded region cools down and the thermal gradient becomes very small, a weakly nonlinear response can be expected for this region. Computation in this region with a much larger time increment is possible to achieve a good balance of accuracy and efficiency. Based on these considerations, a locally refined mesh termed computational mesh (CM) is used for incremental thermo-mechanical analysis, and a background mesh (BM) with all fine elements is introduced to bookkeeping and updating the stress and strain, as shown in Figure 1. The fine mesh region can be selected based on the temperature profiles caused by the moving heat source, and the same CM will be employed for a few time steps of analysis before the heat source travels outside the fine mesh. In this study, an automatic refinement program has been developed to ease the effort in generating the CM and BM. Local refinement is realized by subdividing one parent element into eight child elements, and the compatibility is fulfilled by transforming the nodal vectors of displacement and force. Here, the T denotes the temperature field, u denotes the displacement field, σ denotes the stress field, and ε denotes the strain field that consists of plastic strain, thermal strain, and elastic strain. K is the stiffness matrix, and F is the load term.
2.2. Interface Connection
On the interface between the refined element (child element) and non-refined element (adjacent parent element), there will be nodes which are not shared by the two elements. They are called dummy nodes, and other nodes are called real nodes. In the articles [20,22], additional constraint equations were introduced in solution with the penalty function method or Lagrange multiplier. For simplicity, an interface between the two different graded elements is contacted by linking the dummy nodes of the child element to the real nodes of the parent element, as shown in Figure 2. Similar to applying the linear constraint, the following transformation relationships are first introduced:
where is the interface between the child element and the adjacent parent element. i denotes a node of the child element, and j is a node belonging to the parent element. p denotes a point on the interface and, meanwhile, takes the same position as node i. u represents the nodal variable, such as temperature value or displacement component in the child element, and is that in the parent element. is the jth component of parent element interpolation functions (column vector) for node i (at position p) with respect to node j.
Following Equation (1), we can write all the nodal variables within a child element in the form of real nodes as follows:
where u denotes the nodal variable vector of the child element (with both real and dummy nodes) and utf denotes that of the transformed child element (with only real nodes). The element is transformed by mapping the dummy node to the corresponding real node in the same nodal sequence of interface . T represents the transformation matrix between u and utf. It can be easily formed by identifying the type (real or dummy) and position of nodes, as shown in Figure 2. For example, the transformation matrix of the child element E2 is demonstrated herein. For the real nodes, the vector in the T matrix takes the corresponding ith column of a unit matrix, while for the dummy nodes, the linear constraint equation in Equation (1) can be directly observed.
Obviously, the ordinary form can be achieved when the dummy nodes do not exist in the mesh, as shown in child element E1. In the finite element equations of thermal conduction and mechanical analysis, the equivalent stiffness matrix and nodal force (heat flux) can be obtained via transformation. Furthermore, the displacement (temperature in thermal analysis) at arbitrary position r(x, y, z) inside an original child element can be represented by the following:
Moreover, the derivatives of u can also be expressed in the transformed formulation
As shown in the above equations, nodal variables on dummy nodes can be eliminated by substituting N with NT and B with BT as
Therefore, we can rewrite the stiffness matrices and load vectors in the form of real nodes using relation (6). Take the elastic terms of stiffness Ke and temperature-induced load vector fte as examples; it follows that
where De is the elasticity matrix for isotropic material, ΩE is the domain of an element, and B is the strain matrix. The integration domain does not change so that the originality of the program style can be kept. The other terms, such as plastic stiffness, will have a similar format, and consequently, the incremental force–displacement equation free of dummy nodes can be derived as shown in Equation (9):
The transformation process of thermal conduction equations can be derived in the same manner. For the sake of simplicity, it was not described in detail here.
2.3. Selective Integration and Refinement Control
To facilitate the stress and strain update using computational mesh (CM) throughout the simulation, it is necessary to keep the consistency of the stiffness matrix between the assembled load vector from BM and those from the original CM. The concept of reduced integration in Joining and Welding Research Institute ANalysis (JWRIAN) code is schematically shown in Figure 3a. Different from one-point integration, the second-order integration points are still used, but they are moved toward the position of the first-order integration point (or element center). This integration scheme can greatly reduce the stiffness of the element and prevent the hourglass mode. As shown in Figure 3b, the parameter PREDU is called the reducing factor. In the case of thermal elastic-plastic analysis, reduced integration with PREDU taking a value around 0.1–0.2 can ensure the solution’s accuracy. For the N-AMR method, reduced integration for all elements indicates a full integration when the stiffness and load vector are assembled from BM to CM. It can be anticipated that the inconsistency between the CM stiffness (direct reduced integration) and the one assembled from the BM (equivalent to full integration) will hinder a continuous solution using computational mesh due to convergence problems. When the stiffness and load of child elements in BM are calculated via reduced integration and then summed up to CM, it is equivalent to a second-order full integration on the parent element in CM, as shown in Figure 3c. Therefore, the hybrid integration scheme has the potential to fulfill the consistency condition and stabilize the analysis.
With the progression of the heat source, the computational mesh will be updated with the fine mesh region moving along the welding direction. Take the moment (t1) as an example: all computation will be carried out using elements in CM for the time increments before the next mesh generation. Therefore, the solution of stress and plastic strain in the refined zone with a large thermal gradient will be guaranteed with reduced integration. Full integration is used in the outer region to ensure a smooth transition of the stress and strain solution when the background mesh is updated because the reduced integration used for child elements in BM is close to full integration of parent element in CM. When the heat source moves to the next stage (t2), new child elements will be generated, while fine elements in the rear part of the heat source will become coarse again. The integration scheme will be switched automatically based on the type of element.
As for the welding problem, the main source of nonlinearity is non-uniform temperature, for which analytical solution can be approximately calculated. On the other hand, the background mesh contributes to global equilibrium by correcting stress and strain in elements as long as the displacement field has been obtained with high accuracy on the computational mesh. In this study, a simple refinement control is employed for the sake of fast computation with good accuracy.
The elements to be refined for computational mesh were determined by sweeping a sphere with radius R along a distance of OP, as schematically shown in Figure 4a. The distance is related to welding torch movement and transient temperature profile. Here, ∆t denotes the time interval for mesh refinement, V is the traveling velocity of the welding torch, and L is the characteristic length of a temperature profile by an analytical solution of a moving heat source on a plate. To estimate the values of R and L, the analytical form of the temperature distribution at a quasi-steady state [26,27] was used, as shown in Equation (10). Although the equation is derived from the finite thickness plate, with the heating torch traveling along a straight path, it can also be applied in a curvy path due to the thermal lag effect and localized plastic strain:
In the above equation, λ is thermal conductivity, and a is thermal diffusivity; they are assumed to be constants. Q is the net heat input, and V is the traveling velocity of the heat source. N denotes the number of periodically reiterated layers. xi is the x coordinate of the estimated point, and Ri is the distance from that point to the center of the heat source with respect to the ith layer.
With a predefined temperature value of T0, the points that have a value close to T0 can be sampled from Equation (10) in the Euclidian space. As an illustration in Figure 4b, the points are searched for three temperature contours with a tolerance of ±3 °C on the x-y plane. It can be seen that the region near the heat source has a steeper temperature gradient, while the rear part has smoother distribution as indicated by the bandwidth of temperature. By measuring the width and length of the preferred temperature profile, the initial length L0 and initial radius R0 are obtained as (xp − xm) and (yp − ym)/2, respectively. Then, the initial values can be multiplied with a scaling factor to meet the requirement of non-uniform stress distribution at the front part of the heat source, as shown in Equation (11). The scaling also takes into account the plasticity effect at the rear part, which is still under thermal load.
where fL and fR denote the scaling factors of length and radius, respectively. In the present study, the refining process is operated with predefined temperature T0 as 170 °C, scaling factors 3.0 for the radius, and 1.0 for the length. Such prior-error estimation is based on the fact that temperatures below 200 °C will cause less nonlinear change to the thermo-mechanical properties of the material. In addition, the thermal gradient is small in the rear part of the heat source and region outside the high-temperature zone. The determination of the refinement zone based on post-error will add to more calculations and frequent updates of the stiffness matrix, although the number of elements in CM can be minimized.
2.4. Computational Flowchart
The computation flow of the developed adaptive mesh refinement method is schematically shown in Figure 5. Initially, a coarse mesh is prepared for refinement; the maximum mesh size takes a reference to the studies in the literature [28,29]. The parameters for the welding condition and solution control are defined as the input data. The thermal analysis and mechanical analysis are sequentially coupled, and the analyses for each time increment are organized in a loop.
The first module is the mesh refinement for the current time step. The CM and BM are created, and the relations of nodes and elements between the two meshes are established. A specific time interval determines the frequency of redefining the mesh and updating the solution on BM. The interval should be designed from the viewpoint of computational accuracy and efficiency. Relatively larger intervals will lead to more elements in the CM and also lose accuracy due to late solution updating on BM, while the smaller one may result in slow computation speed due to frequent feedback on BM. A time interval corresponding to time steps of 20~30 is recommended based on numerical tests.
Secondly, the thermal conduction analysis is performed on CM. Heat flux on elements is determined based on relative position with respect to the heat source. Node relation is necessary to map the initial temperature from the previous CM to the current one. Temperature data for each node, at every time step, is written in a file, which will be read by mechanical analysis as thermal load. Here, the temperature at the final step of the time interval is interpolated on BM for the purpose of bookkeeping.
Thirdly, mechanical analysis is performed on CM with the previously solved results as the initial condition. The incremental steps are automatically controlled by the number of temperature records. At the final temperature record, the nodal forces and element stiffness matrix for CM are assembled from BM. In the current study, the stress and strain for parent elements are obtained by averaging that from their children elements. Solutions are updated and saved on BM as input for subsequent analysis. It is necessary to judge if the welding has been finished by setting a global variable in the program. If the variable indicates the end, then the simulation will be terminated. Otherwise, the analysis will continue at the beginning of the loop.
3. Validation of N-AMR by Simulation of Fillet Welding Joints
This section presents the simulation of fillet welding models by means of the developed adaptive mesh refinement method. For comparison, the analysis with the conventional finite element method (C-FEM), which utilizes the background mesh in N-AMR, was also performed. The first part is to confirm the accuracy of the conventional FEM in simulating a real-world welding process. The second part is to verify the accuracy of the proposed method by comparing the transient temperature and welding deformations of a baseline model. In the third part, a series of simulations were carried out to investigate the performance of N-AMR with respect to shortening computation time when the model scale becomes larger.
3.1. Accuracy of Conventional FEM
The simulation approach N-AMR was developed based on an in-house code JWRIAN developed by the Joining and Welding Research Institute at Osaka University. To confirm the accuracy of the thermal elastic–plastic analysis, the JWRIAN code, representing a typical conventional FEM, was employed to analyze welding deformation in a fillet joint. The experimental model designed by Deng et al. [30] is shown in Figure 6a. The flange plate has dimensions of 500 mm × 500 mm × 12 mm, and the web plate is 500 mm × 300 mm × 9 mm. The welding was performed using a single-sided welding process. Two sides were sequentially welded using welding current 270 A, voltage 29 V, and a speed of 400 mm/min. Vertical displacements were measured on three lines, as shown in Figure 6b. The distances from the welding start position were 20 mm, 250 mm, and 480 mm, respectively. In addition, the transverse displacements at four locations, which are 10 mm away from the weld ends and 50 mm away from the web plate, were measured on both the upper surface and the lower surface. The welding was carried out via tack welding first at the beginning, middle, and end of the flange plate, and then regular welding was performed along the weld line. The details, such as experiment conditions and material properties, can be referred to in the original article.
In the experimental work cited for model validation, the temperature was not measured in the welding process, and there was no cross-section cut to compare with the numerical results as well. In this study, the bead shape predicted by C-FEM is taken as a reference to validate the modeling accuracy by comparing it with the measured fillet with a size of 6 mm, as shown in Figure 6b. The material deposition process was currently not considered in the thermal and stress analysis; the impact from the metal droplet was considered to have a limited effect on the welding distortion and residual stress because the yield strength and stiffness over melting temperature is quite low compared to the state at room temperature. In this research, we align the welding direction to be the X-direction while it is the Y-axis in the publication by Deng et al. [30], but this will not affect the simulation accuracy and comparison with the experiment.
In the present study, a double ellipsoidal heat source with a uniform distribution of heat flux was employed to compute the temperature history. Element birth was not taken into account, as the tack welds were used before regular welding. The welding deformation after the cooling was evaluated. Figure 7 shows the predicted transverse displacement contour and the comparison with the experiment. It can be seen that the upper surface has positive shrinkage, and the distribution along the welding direction is relatively uniform. The lower surface depicts a negative shrinkage, which is mainly caused by the bending effect. Figure 8 shows the vertical displacement at the evaluated lines. The prediction and measurement both have shown that the maximum deflection increases along the welding direction. This can be explained by the preheating effect and decrease in internal constraint as the welding heat source precedes. The simulation and experiment show good agreement in welding deformations. The accuracy of JWRIAN, which is termed a conventional FEM in this article, was confirmed.
3.2. Study on a Larger-Size Fillet Joint
To validate the proposed N-AMR, a baseline model and the scaled models were studied. The baseline model consists of a bottom plate and an L-shaped stiffener, as shown in Figure 9. Compared with a flat stiffener, the additional wall in an L-shape stiffener will increase bending stiffness, which can reduce deviations during welding. The dimensions of the basic model and welding condition are shown in Table 1. The stiffener is assumed to be welded simultaneously on double sides without external constraint. Initial coarse mesh is also plotted in Figure 9, as it can be seen that the fillet part has only one division in the thickness direction and width direction. The elements have a length of 10 mm in the welding direction. The finite element model holds 12,555 nodes and 8160 elements for the initial mesh. The material properties are summarized in Figure 10; base metal, and filler metal were supposed to be the same material. To record temperature and displacements during the welding, four virtual measurement points in the background mesh were selected at the middle cross-section (Figure 11). It is noted that small deformation theory is used throughout the case study since the major purpose is to demonstrate the efficiency and accuracy of N-AMR within the existing computational framework.
The fillet welding time was 160 s, and then the weld cooled down to room temperature by heat transfer. It should be noted that the simulation using the initial course will not capture the heat input accurately due to a limited number of integration points. Further, the temperature and stress gradient will have very low resolution due to a single-element representation of a weld bead using the background mesh by refined elements; the penetration shape analyzed by N-AMR is shown in Figure 11. It can be seen that a reasonable melting zone was computed as indicated by the solid–fluid transformation line. Detailed temperature profiles, displacements, and stresses are presented in Section 4.
4. Results and Discussion
4.1. Accuracy Validation of Novel AMR
The transient temperatures at the measured points were evaluated for time history. From Figure 12a, it can be observed that a sharp rise in temperature appeared when the welding torches passed by the points. As the distance from the welding line increased, the peak temperature of each point decreased due to heat diffusion. In addition, the different gradients of temperature were reproduced via simulation. When the heat source moved away, the difference in temperature between the points gradually became smaller.
In addition, the transient displacements at the four points were measured to clarify the phenomenon during the welding and cooling, as shown in Figure 12b–d. In the case of longitudinal displacement, there were rapid changes in trend when the heating torch passed (t ≈ 80 s) and eventually left the plate (t = 160 s). This is because thermal expansion continues to accumulate in the welding direction during heating. And the contribution to X-displacement changed in the opposite direction when the heating torch traveled away from the point. This effect is much weaker in the Y and Z displacements, as reflected by the curves. For the nodal displacements in X, Y, and Z directions, the response of the model became smooth after the heat source moved off the plate, as can be observed in the three figures. The results from the analysis of the N-AMR (P1′~P4′) were in excellent agreement with that of C-FEM (P1~P4).
The temperature and von Mises stress contour at t = 30 s, 90 s, and 3000 s counting from the start of welding are plotted in Figure 13, Figure 14 and Figure 15. The stress contours for C-FEM and N-AMR are both shown on the background mesh, while the temperature is plotted on the computational mesh. As can be observed from Figure 13 and Figure 14, the temperature and stress field near the heat source stay in a quasi-steady state during the welding of the intermediate part of the model. The stress field has large values in front of the heat source due to thermal expansion and restraints on the local region. Perpendicular to the welding direction, the stress contour has a much wider region with higher values than that in the temperature contour. The stress contours obtained via the two methods agreed very well at each time step.
Residual deformation and stress computed by the adaptive mesh refinement method are plotted in Figure 16. Longitudinal shrinkage (in the X direction) near the weld line and transverse shrinkage (in the Y direction) along the welding direction can be seen. The deflection (in the Z direction), with a magnitude of about 4 mm, indicates angular distortion. Longitudinal bending is not obvious since the ratio of stiffener height to plate length is large. For the current model, computational time for the conventional FEM and adaptive mesh refinement method are 13 h and 5 h, respectively. Based on the results, it can be concluded that the N-AMR reduces a large amount of computational time while keeping very good accuracy.
4.2. Performance of Models in Different Scales
A series of models with the same cross-section and welding condition were analyzed to evaluate the performance of the proposed method. The model dimension and mesh data of the models are listed in Table 2. Both computation time and physical memory cost in the simulations were tested. A CPU in single-core mode was used for each simulation on a Linux system equipped with a CPU of Intel Xeon E5-2650. For a comparison, the same model was solved using conventional FEM. The computation information of all models is shown in Table 3. It has been verified that the reduction in computing time increases with the scale of a model with respect to elements. In the case of Model No. 5, a reduction factor of about 6 in CPU time and 3 in physical memory was obtained. Two lines on the bottom of the plate, as depicted in Figure 15, were used to extract the residual deflection and stress values. Line A is at the center of the plate along the welding direction, and Line B is at the middle cross-section. The results are plotted in Figure 17 and Figure 18. Fairly good agreement between results computed by N-AMR and that by C-FEM can be observed for both the displacement and the stresses.
To clarify the influence of model scale on the performance of N-AMR, the ratios of element number, physical memory, and CPU time between C-FEM and N-AMR were plotted in Figure 19. In the case of element numbers, the maximum one among all computational meshes was used as the reference for N-AMR. In each model, the element number in the CM is much smaller compared to that in the BM (Table 2). The stiffness matrix is always formed and solved based on the CM; thus, computing time and memory can be saved with respect to conventional FEM. The ratio of CPU time is roughly the same as that of the element number. Certainly, time spent on factorizing the stiffness matrix will take up a large proportion when the CM increases its element number. A static condensation technique can be introduced to collect the elements around the heat torch as a super element, such that the total number of DOFs for the CM can be maintained at a lower level. Memory consumption has a weaker dependence on the model scale, as the solution recording on the BM is necessary for all cases. A multi-level refinement can be used to further decrease the number of DOFs in both computational mesh and background mesh, which will help to improve the performance of the adaptive mesh refinement method.
4.3. Application to a Large Stiffened Structure
To demonstrate the capability of the proposed N-AMR in analyzing more practical welded structures, the novel simulation method was employed to predict the welding deformation and residual stress for a large, stiffened structure. Stiffened panels are essential structural components widely used in aircraft, ships, and bridges. Welding of longitudinal and transverse stiffeners can easily induce out-of-plane deformation on panels in the form of angular distortion by fillet welds. Therefore, numerical simulation is necessary to predict the effect of heat input, stiffener spacing, and welding sequence on the welding deformation of the target structure.
In the present study, a stiffened structure for the numerical study consists of a square plate with a thickness of 12 mm, and stiffening plates with a thickness of 8 mm, and detailed dimensions are shown in Figure 20. The stiffener–stiffener connections, which are termed cross-joints, are firstly welded via single-pass welding, and then panel–stiffener connections, which are termed T-joints, are welded via simultaneous welding on the two sides of each stiffener. For the two types of connections, the fillet size is all the same as 6 mm. Material properties for the base material and deposited material are assumed to have the same values as shown in Figure 10. The welding heat input for the cross-joint is 4000 W, and that for the T-joint is 3850 W. The welding speed is the same as 5 mm/s. A similar heat source modeling approach in Section 3 was employed to generate heat flux for the fillet region. The initial gap between stiffeners and panel plate is supposed to be negligible. After finishing each welding pass, the temperature of the whole structure is naturally cooled down to room temperature. To simplify the modeling, no external constraint was applied, and rigid body motion was fixed only. The initial coarse mesh of the structures is shown in Figure 21. The background mesh is constructed by 468,352 hexahedral elements and 582,197 nodes, and the total number of DOFs reaches 1,746,585.
The contours of displacements are plotted in Figure 22. From the displacement results, it is observed that shrinkage along the welding line has occurred. The upper part of the stiffened plate has the largest magnitude due to the shrinkage generated by cross joints and the bending effect induced by angular distortion. The maximum value of shrinkage is less than 2 mm. For welded structures such as a ship block with large dimensions, the effect of shortening needs to be taken into account for the purpose of component assembly. The out-of-plane displacement shows that the deformed shape of the structure is almost symmetric about its center due to the symmetry of heat input and model geometry. Maximum deflection is about 5 mm at the center of the panel. In practice, external fixtures can be designed to restrict welding distortion of the structure, especially for the part with free edges. Distortion can also be minimized by optimizing the welding sequence and the thermal tension technique, as well as the pre-bending technique.
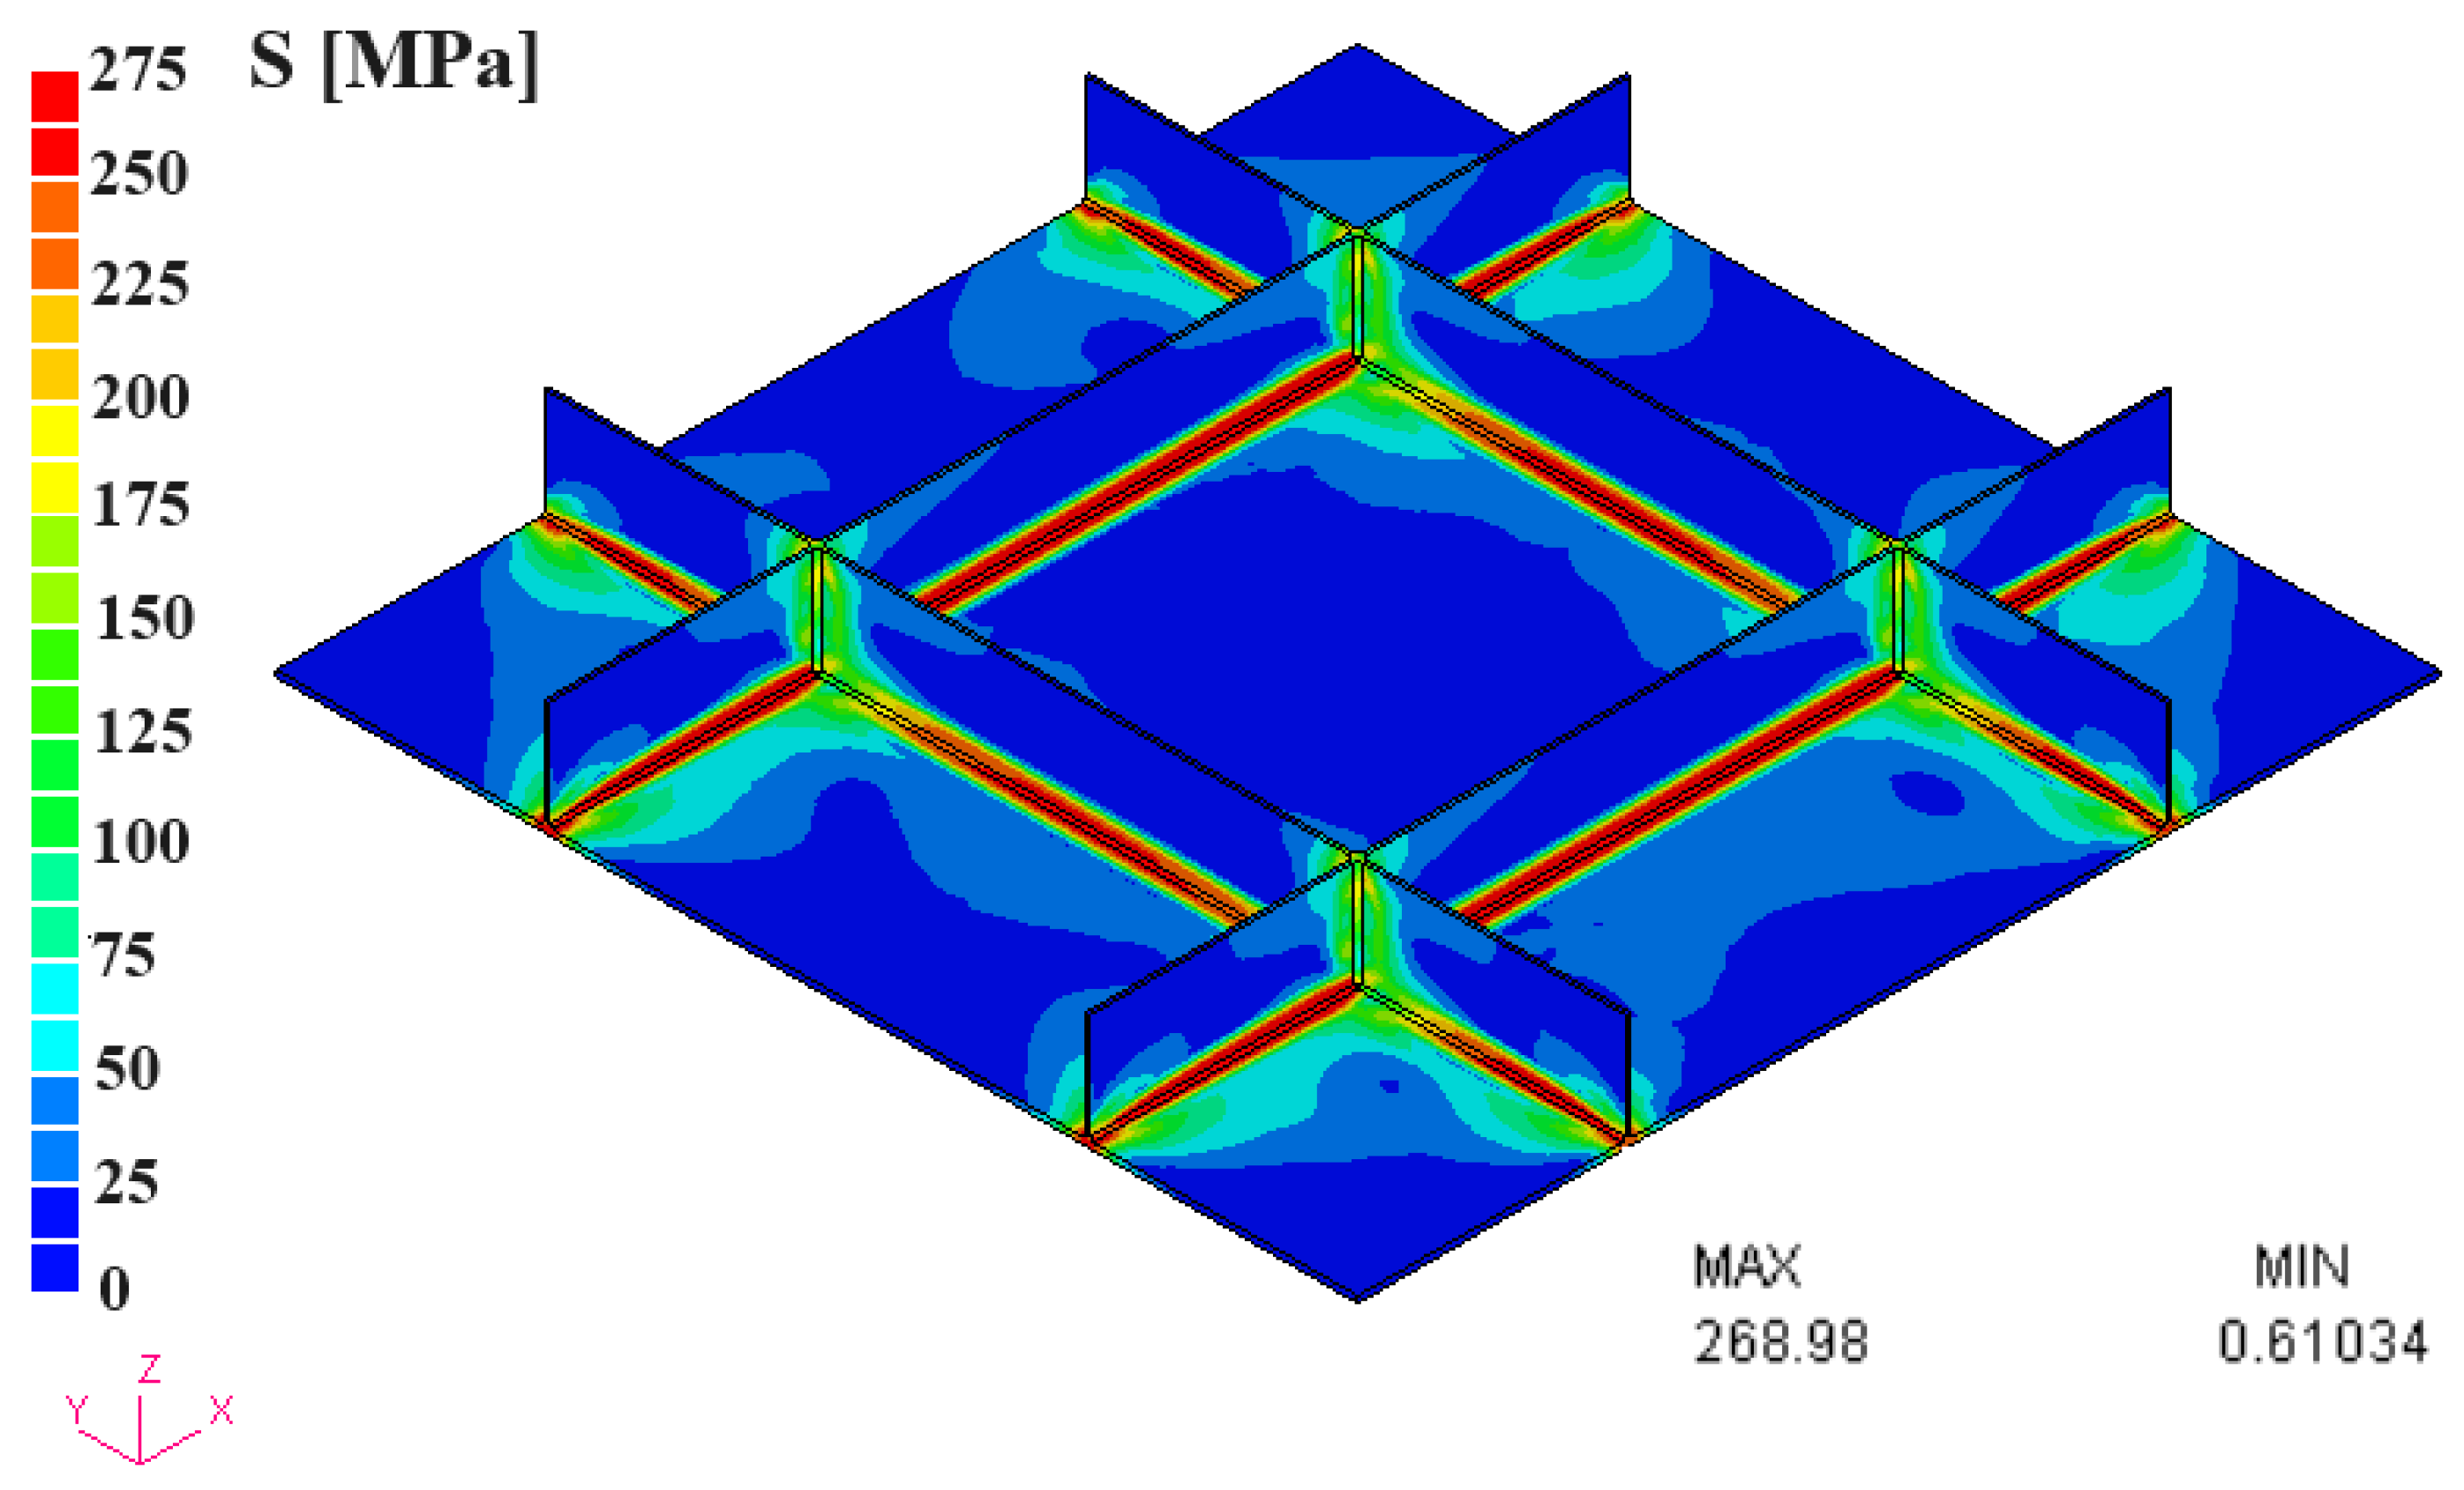
The contour of von Mises stress is plotted in Figure 23. It can be observed that a high value up to the yield stress is exhibited in the welded zone because the material reached a plastic state in the heating–cooling cycle. The stress field can be used for fatigue analysis and ultimate strength analysis with consideration of residual stress. To reduce the high tensile stress in the welding joint, post-welding heat treatment (PWHT) or line heating can be used. The computation was run on an Intel Xeon W5580 (Quad Core 3.20 GHz, 1 CPU). There are 8436 temperature increments for stress analysis. It only took 4.5 days to finish the computation by means of the N-AMR. The computational time can be further reduced by the parallelizing technique. On the other hand, computation via C-FEM would take more than 32 days, as estimated by the trial analysis of the initial 200 temperature increments. The acceleration factor is close to 7, which means the factor keeps increasing as the model scale (number of DOFs) is larger. The numerical example has shown the superior performance of the N-AMR in analyzing large-scale models by saving computational time and physical memory.
5. Conclusions and Outlook
This paper presents a novel adaptive mesh refinement method for the finite element simulation of thermal–mechanical behavior during the welding process. The numerical formulation and computation flowchart of the proposed method are presented in detail. The N-AMR has taken advantage of the features of transient high temperature, as well as the localized plastic strain in welding problems. Different from traditional AMR methods, a background mesh is originally introduced to thermo-mechanical analysis in addition to the locally refined mesh, which allows the mesh refining zone to be simply determined by the analytical temperature profiles. Numerical examples were illustrated in the present work. A fillet welding joint is employed to validate the accuracy of the proposed method. The conventional FEM by JWRIAN was first validated by experiment, showing good agreement between predicted welding distortion and measured values. Then, a larger fillet joint and the scaled models were simulated by conventional FEM and the newly developed AMR method. The following conclusions can be drawn:
- (1)
- A novel adaptive mesh refinement (N-AMR) approach has been developed based on a selective integration scheme with reduced integration for the refined region and full integration for the coarsen region, respectively.
- (2)
- Via the introduction of a background mesh, the solution on each fine element is kept and updated to ensure the accuracy of the full model, rather than losing resolution during the mesh coarsening in ordinary AMR.
- (3)
- Since the global matrix and incremental displacements are always solved on the computational mesh, the proposed method brings a great reduction of computational time and memory cost.
- (4)
- Transient temperature, distortions, and residual stresses are compared between conventional FEM and the proposed approach. Simulation results have confirmed the accuracy of N-AMR, and the computation speed has been improved by 5.7 times in the case of a welding joint with a length of 4 m.
- (5)
- The acceleration factor increased to 7.1 for the welding simulation of a structure with a weld length of about 9 m. It can be anticipated that more savings in computational cost and physical memory can be achieved if a larger-scale structure is analyzed by the developed method. Moreover, the new AMR, developed in-house, can improve the prediction accuracy compared with traditional AMR, which is very important for engineering applications.
There are several limitations of the developed AMR to be noted as well. Currently, only hexahedral elements are supported in the mesh refinement framework, whereas the tetrahedral elements will be necessary to generate a mesh for more complex models. It remains a future task to implement mesh generation and selective integration to fit into any weld bead shape. In addition, only one-level mesh refinement is allowed in the AMR, which may result in a large number of elements in the practical weld structure or additive manufacturing part [31]. A hybrid modeling by AMR and explicit FEM approach will be possible to avoid solving a large stiffness matrix when the structure has more than millions of DOFs. Although the simulation approach is based on an in-house code, such an approach could be developed using a commercial code to benefit more engineers and researchers in need of large-scale weld analysis capabilities.
Author Contributions
Conceptualization: H.H. and H.M.; methodology: H.H. and H.M.; software: H.H. and H.M.; validation: H.H.; formal analysis: H.H. and H.M.; investigation: H.H.; resources: H.M.; data curation: H.H.; writing—original draft preparation: H.H.; writing—review and editing, H.H. and H.M.; visualization: H.H.; supervision: H.M. All authors have read and agreed to the published version of the manuscript.
Funding
This research received no external funding.
Data Availability Statement
The data will be available upon request from the individual.
Acknowledgments
The first author, Hui Huang, would like to thank the Ministry of Education in the Japanese Government (Monbukagakusho: MEXT) Scholarship for supporting his doctoral study at Osaka University, Japan. The authors express special thanks to Rashed Sherif for reviewing the manuscript and providing invaluable suggestions.
Conflicts of Interest
The authors declare that they have no conflict of interest to report regarding the present study.
References
- Goldak, J.A.; Akhlaghi, M. Computational Welding Mechanics; Springer: New York, NY, USA, 2014. [Google Scholar] [CrossRef]
- O’Meara, N.; Francis, J.A.; Smith, S.D.; Withers, P.J. Development of Simplified Empirical Phase Transformation Model for Use in Welding Residual Stress Simulations. In Proceedings of the ASME 2014 Pressure Vessels and Piping Conference, PVP2014-29100, Anaheim, CA, USA, 20–24 July 2014. [Google Scholar] [CrossRef]
- Yang, Y.P. Recent Advances in Prediction of Weld Residual Stress and Distortion—Part 2. Weld. J. 2021, 100, 193–205. [Google Scholar] [CrossRef]
- Romanin, L.; Ferro, P.; Berto, F. A simplified non-linear numerical method for the assessment of welding induced deformations. Mar. Struct. 2021, 78, 102982. [Google Scholar] [CrossRef]
- Ma, N.; Deng, D.; Osawa, N.; Rashed, S.; Murakawa, H.; Ueda, Y. Welding Deformation and Residual Stress Prevention, 2nd ed.; Butterworth-Heinemann: Oxford, UK, 2022. [Google Scholar] [CrossRef]
- Ueda, Y.; Yamakawa, T. Analysis of Thermal Elastic-plastic Stress and Strain during Welding by Finite Element Method. Trans. Jpn. Weld. Soc. 1971, 2, 186–196. [Google Scholar]
- Andersson, B.A.B. Thermal stresses in a submerged-arc welded joint considering phase transformations. J. Eng. Mater. Technol. Trans. ASME 1978, 100, 356–362. [Google Scholar] [CrossRef]
- Ueda, Y.; Kim, Y.C.; Garatani, K.; Yamakita, T.; Bang, H.S. Mechanical Characteristics of Repair Welds in Thick Plate (Report I): Distributions of Three-dimensional Welding Residual Stresses and Plastic Strains and Their Production Mechanisms. Trans. JWRI 1986, 15, 359–368. [Google Scholar]
- Tekriwal, P.; Stitt, M.; Mazumder, J. A Three-dimensional Transient Finite Element Model for TIG Welding. In A Report of the Materials Engineering-Mechanical Behavior; College of Engineering, University of Illinois at Urbana-Champaign: Champaign, IL, USA, 1986; p. 130. [Google Scholar]
- Karlsson, R.I.; Josefson, B.L. Three-dimensional finite element analysis of temperatures and stresses in a single-pass butt-welded pipe. J. Press. Vessel. Technol. 1990, 112, 76–84. [Google Scholar] [CrossRef]
- Atluri, S.N.; Shen, S. The meshless local Petrov-Galerkin (mlpg) method: A simple & less-costly alternative to the finite element and boundary element methods. Comput. Model. Eng. Sci. 2002, 3, 11–52. [Google Scholar] [CrossRef]
- Sladek, J.; Sladek, V.; Atluri, S.N. Meshless local petrov-galerkin method for heat conduction problem in an anisotropic medium. Comput. Model. Eng. Sci. 2004, 6, 309–318. [Google Scholar] [CrossRef]
- Beygi, R.; Marques, E.; da Silva, L.F.M. Thermomechanical Analysis in Welding. In Computational Concepts in Simulation of Welding Processes; Springer Briefs in Applied Sciences and Technology; Springer: Cham, Switzerland, 2022. [Google Scholar]
- Nishikawa, H.; Serizawa, H.; Murakawa, H. Actual application of FEM to analysis of large scale mechanical problems in welding. Sci. Technol. Weld. Join. 2007, 12, 147–152. [Google Scholar] [CrossRef]
- Rong, Y.; Xu, J.; Huang, Y.; Zhang, G. Review on finite element analysis of welding deformation and residual stress. Sci. Technol. Weld. Join. 2018, 23, 198–208. [Google Scholar] [CrossRef]
- Shibahara, M.; Itoh, S.; Okada, T.; Ikushima, K.; Nishikawa, S. Prediction of residual stress in multi-pass welded joint using idealized explicit FEM. In Proceedings of the ASME 2012 Pressure Vessels and Piping Conference, Toronto, ON, Canada, 15–19 July 2012; pp. 667–675. [Google Scholar]
- Ma, N. An accelerated explicit method with GPU parallel computing for thermal stress and welding deformation of large structure models. Int. J. Adv. Manuf. Technol. 2016, 87, 195–211. [Google Scholar] [CrossRef]
- Hamide, M.; Massoni, E.; Bellet, M. Adaptive mesh technique for thermal-metallurgical numerical simulation of arc welding processes. Int. J. Numer. Methods Eng. 2010, 73, 624–641. [Google Scholar] [CrossRef]
- Hu, R.; Pang, S.; Chen, X.; Liang, L.; Shao, X. An octree-based adaptive mesh refinement method for three-dimensional modeling of keyhole mode laser welding. Int. J. Heat Mass Transf. 2017, 115, 258–263. [Google Scholar] [CrossRef]
- Lindgren, L.-E.; Haggblad, H.A.; McDillb, J.M.J.; Oddy, A.S. Automatic remeshing for three-dimensional finite element simulation of welding. Comput. Methods Appl. Mech. Eng. 1997, 147, 401–409. [Google Scholar] [CrossRef]
- Runnemalm, H.; Hyun, S. Three-dimensional welding analysis using an adaptive mesh scheme. Comput. Methods Appl. Mech. Eng. 2000, 189, 515–523. [Google Scholar] [CrossRef]
- Duranton, P.; Devauxa, J.; Robin, V.; Gilles, P.; Bergheau, J.M. 3D modelling of multipass welding of a 316L stainless steel pipe. J. Mater. Process. Technol. 2004, 153–154, 457–463. [Google Scholar] [CrossRef]
- Lindgren, L.E. Finite element modeling and simulation of welding. Part 3: Efficiency and integration. J. Therm. Stress. 2001, 24, 305–334. [Google Scholar] [CrossRef]
- Shi, Q.; Lu, A.; Zhao, H.; Wu, A.P. Development and application of the adaptive mesh technique in the three-dimensional numerical simulation of the welding process. J. Mater. Process. Technol. 2002, 121, 167–172. [Google Scholar] [CrossRef]
- Huang, H.; Murakawa, H. Dynamic mesh refining and iterative substructure method for fillet welding thermo-mechanical analysis. Comput. Model. Eng. Sci. 2015, 106, 187–201. [Google Scholar] [CrossRef]
- Rykalin, N.N. Berechnung der Wärmevorgänge Beim SchweiBen (Calculation of Heat Processes during Welding); Verlag Technik: Berlin, Germany, 1957. [Google Scholar]
- Radaj, D. Heat Effects of Welding: Temperature Field, Residual Stress, Distortion; Springer: Berlin/Heidelberg, Germany, 1992; pp. 54–55. [Google Scholar]
- Chen, B.Q.; Hashemzadeh, M.; Guedes Soares, C. Numerical and experimental studies on temperature and distortion patterns in butt-welded plates. Int. J. Adv. Manuf. Technol. 2014, 72, 1121–1131. [Google Scholar] [CrossRef]
- Seles, K.; Peric, M.; Tonkovic, Z. Numerical simulation of a welding process using a prescribed temperature approach. J. Constr. Steel Res. 2018, 145, 49–57. [Google Scholar] [CrossRef]
- Deng, D.; Liang, W.; Murakawa, H. Determination of welding deformation in fillet-welded joint by means of numerical simulation and comparison with experimental measurements. J. Mater. Process. Technol. 2007, 183, 219–225. [Google Scholar] [CrossRef]
- Li, C.; Denlinger, E.R.; Gouge, M.F.; Irwin, J.E.; Michaleris, P. Numerical verification of an octree mesh coarsening strategy for simulating additive manufacturing processes. Addit. Manuf. 2019, 30, 100903. [Google Scholar] [CrossRef]
Figure 1.
Concept of the novel adaptive mesh refinement (N-AMR) method.
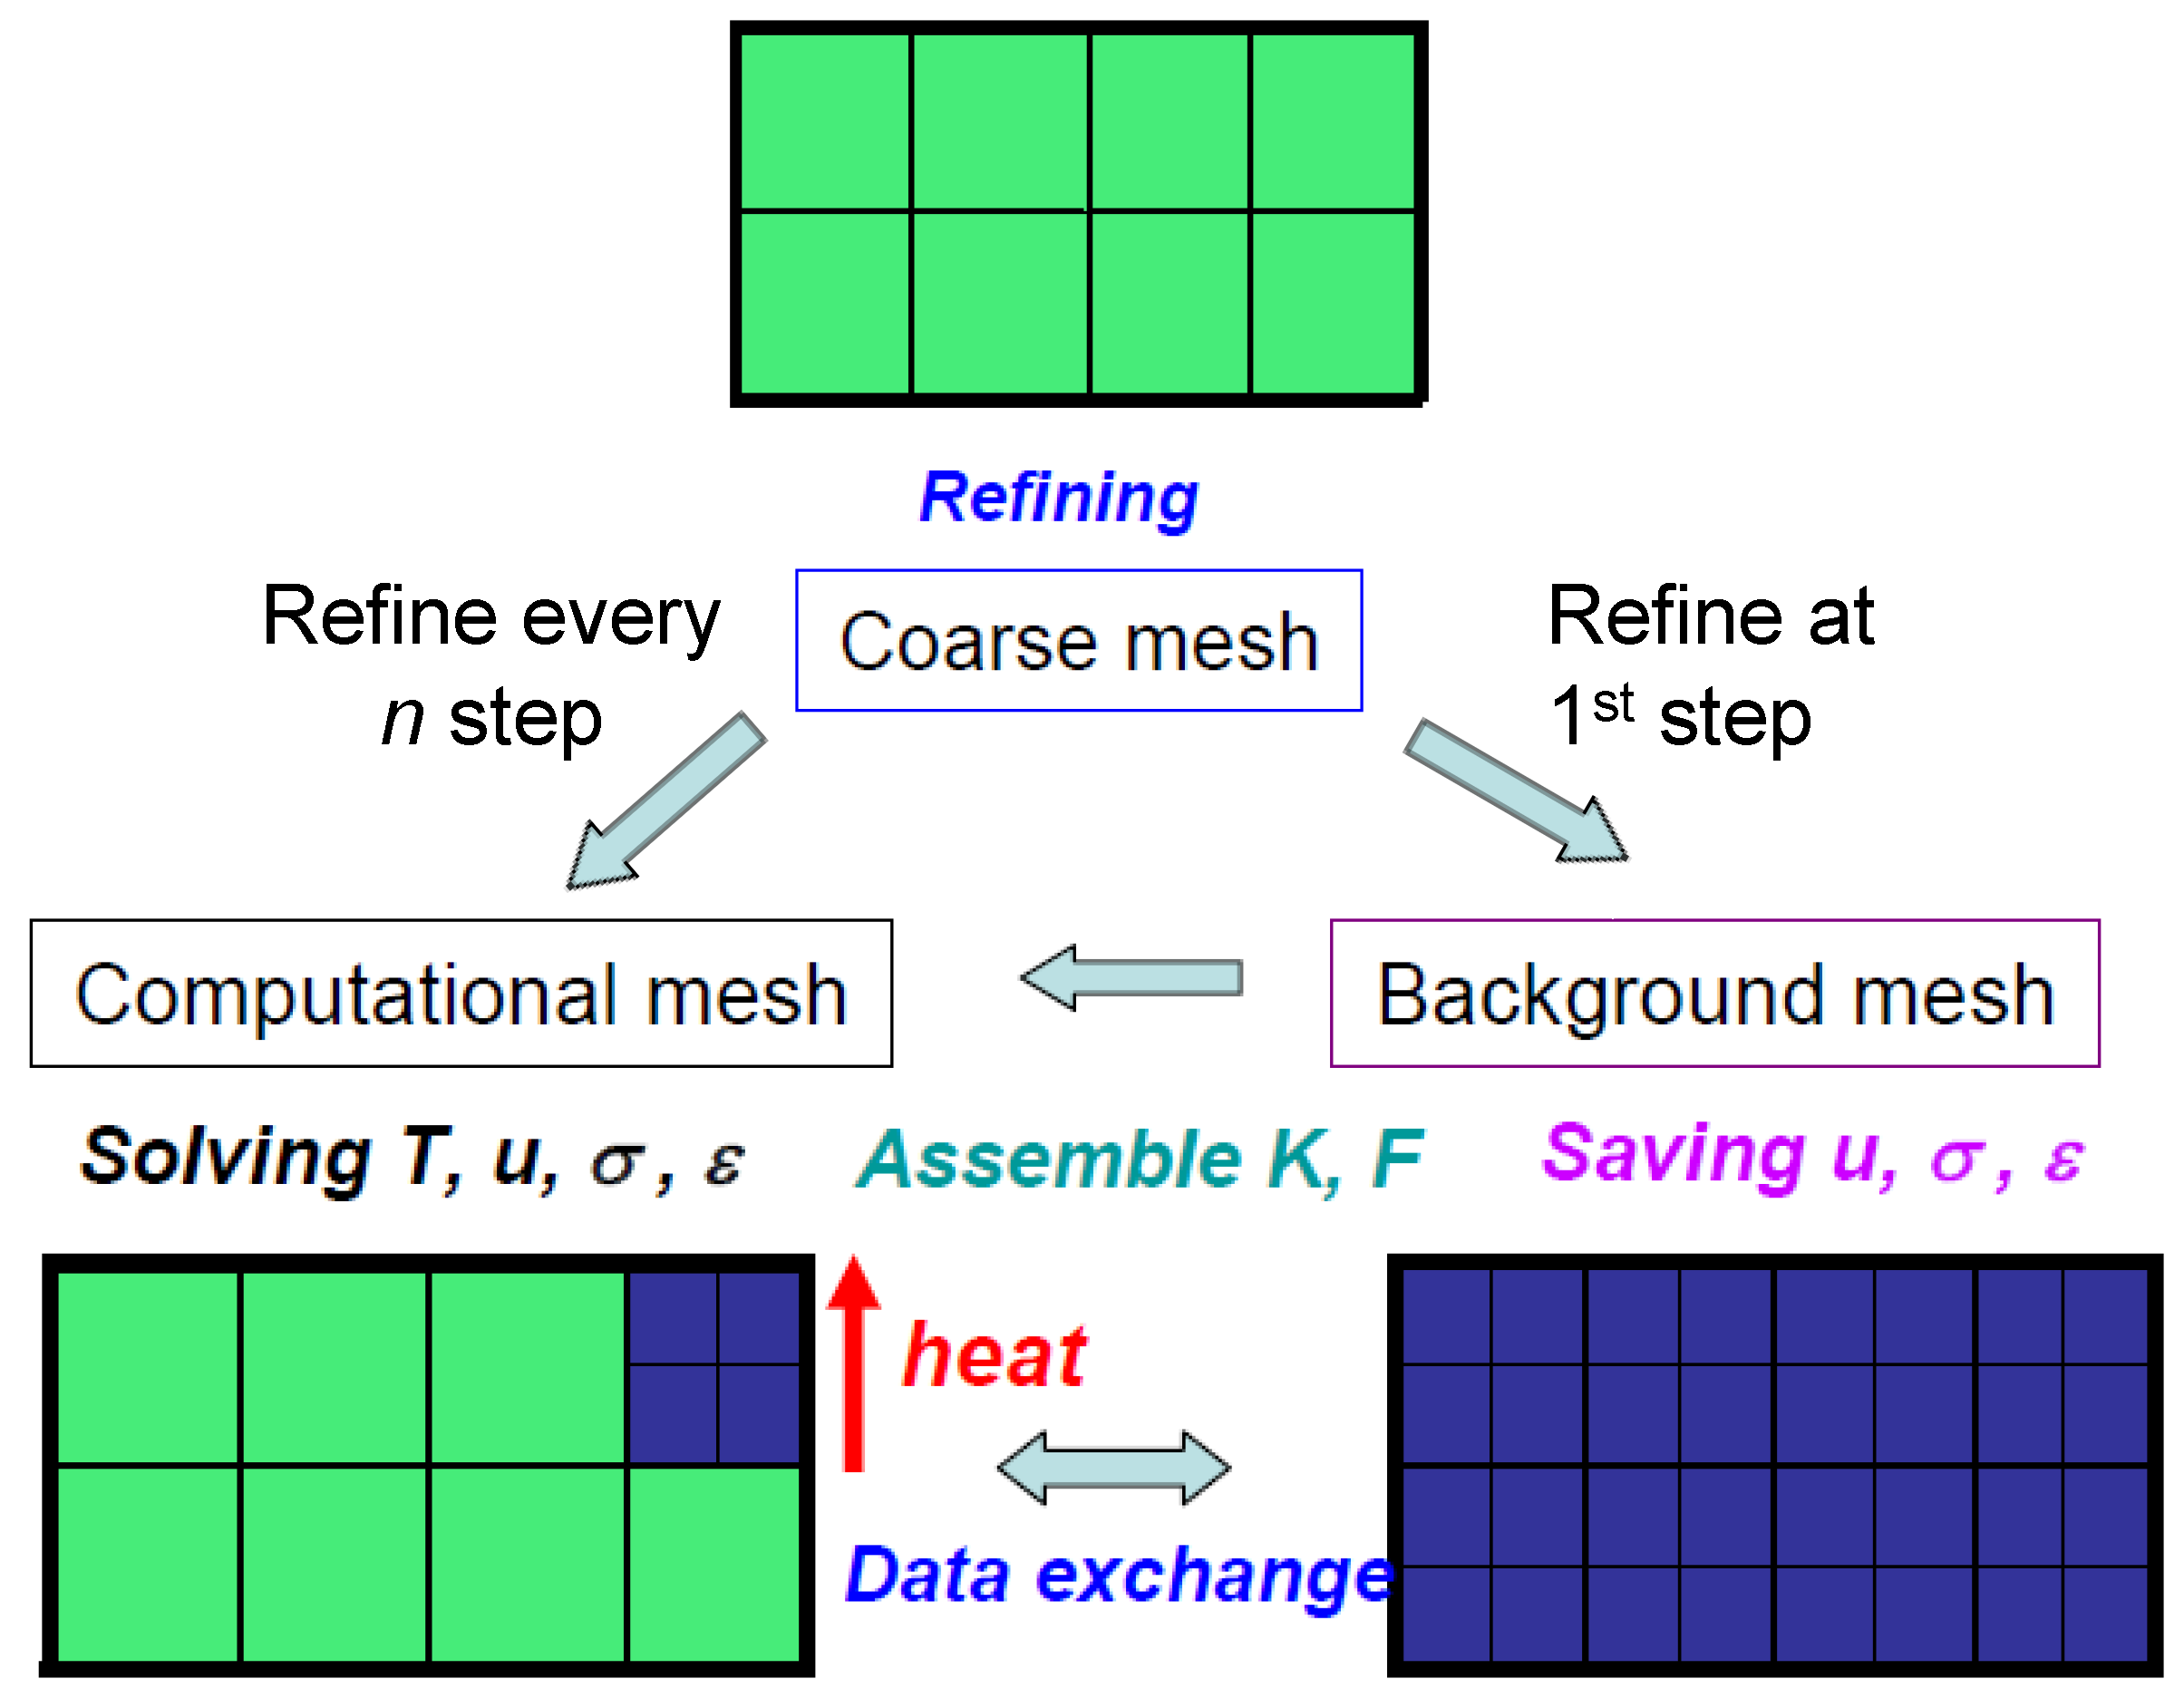
Figure 2.
The 3D refinement of elements with a single nodal degree of freedom.
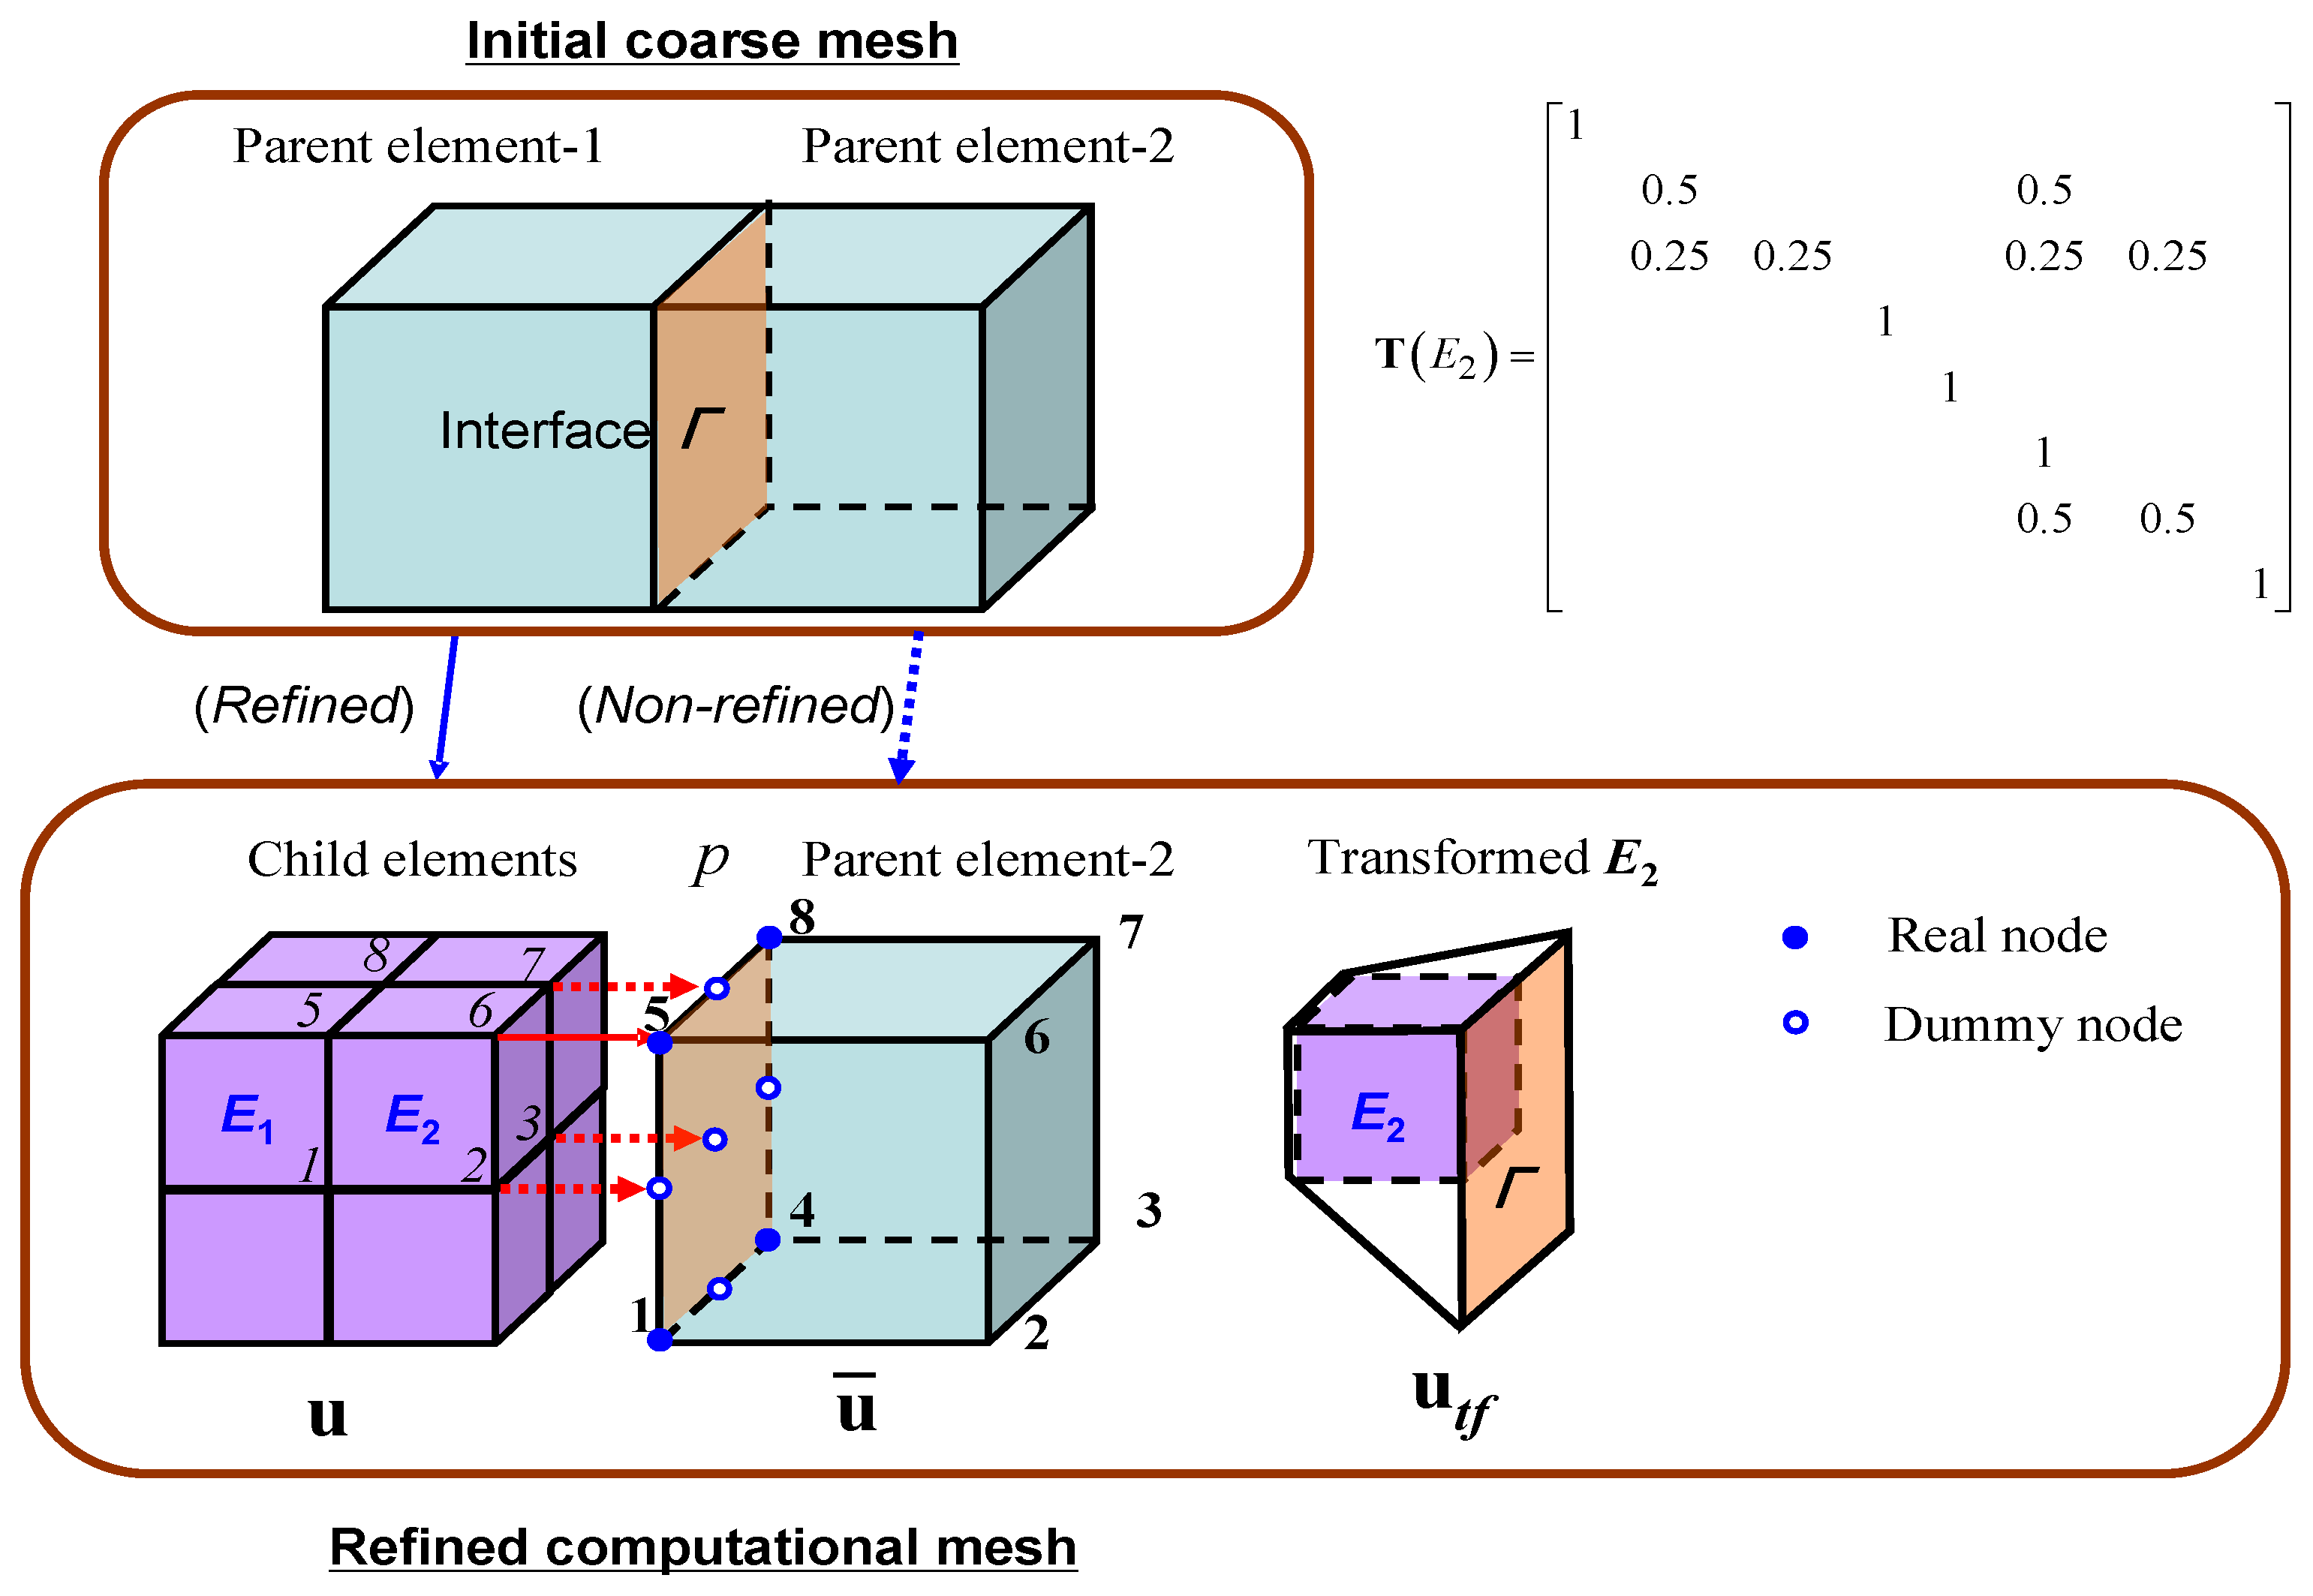
Figure 3.
Schematic drawing of selective integration scheme in novel AMR method.
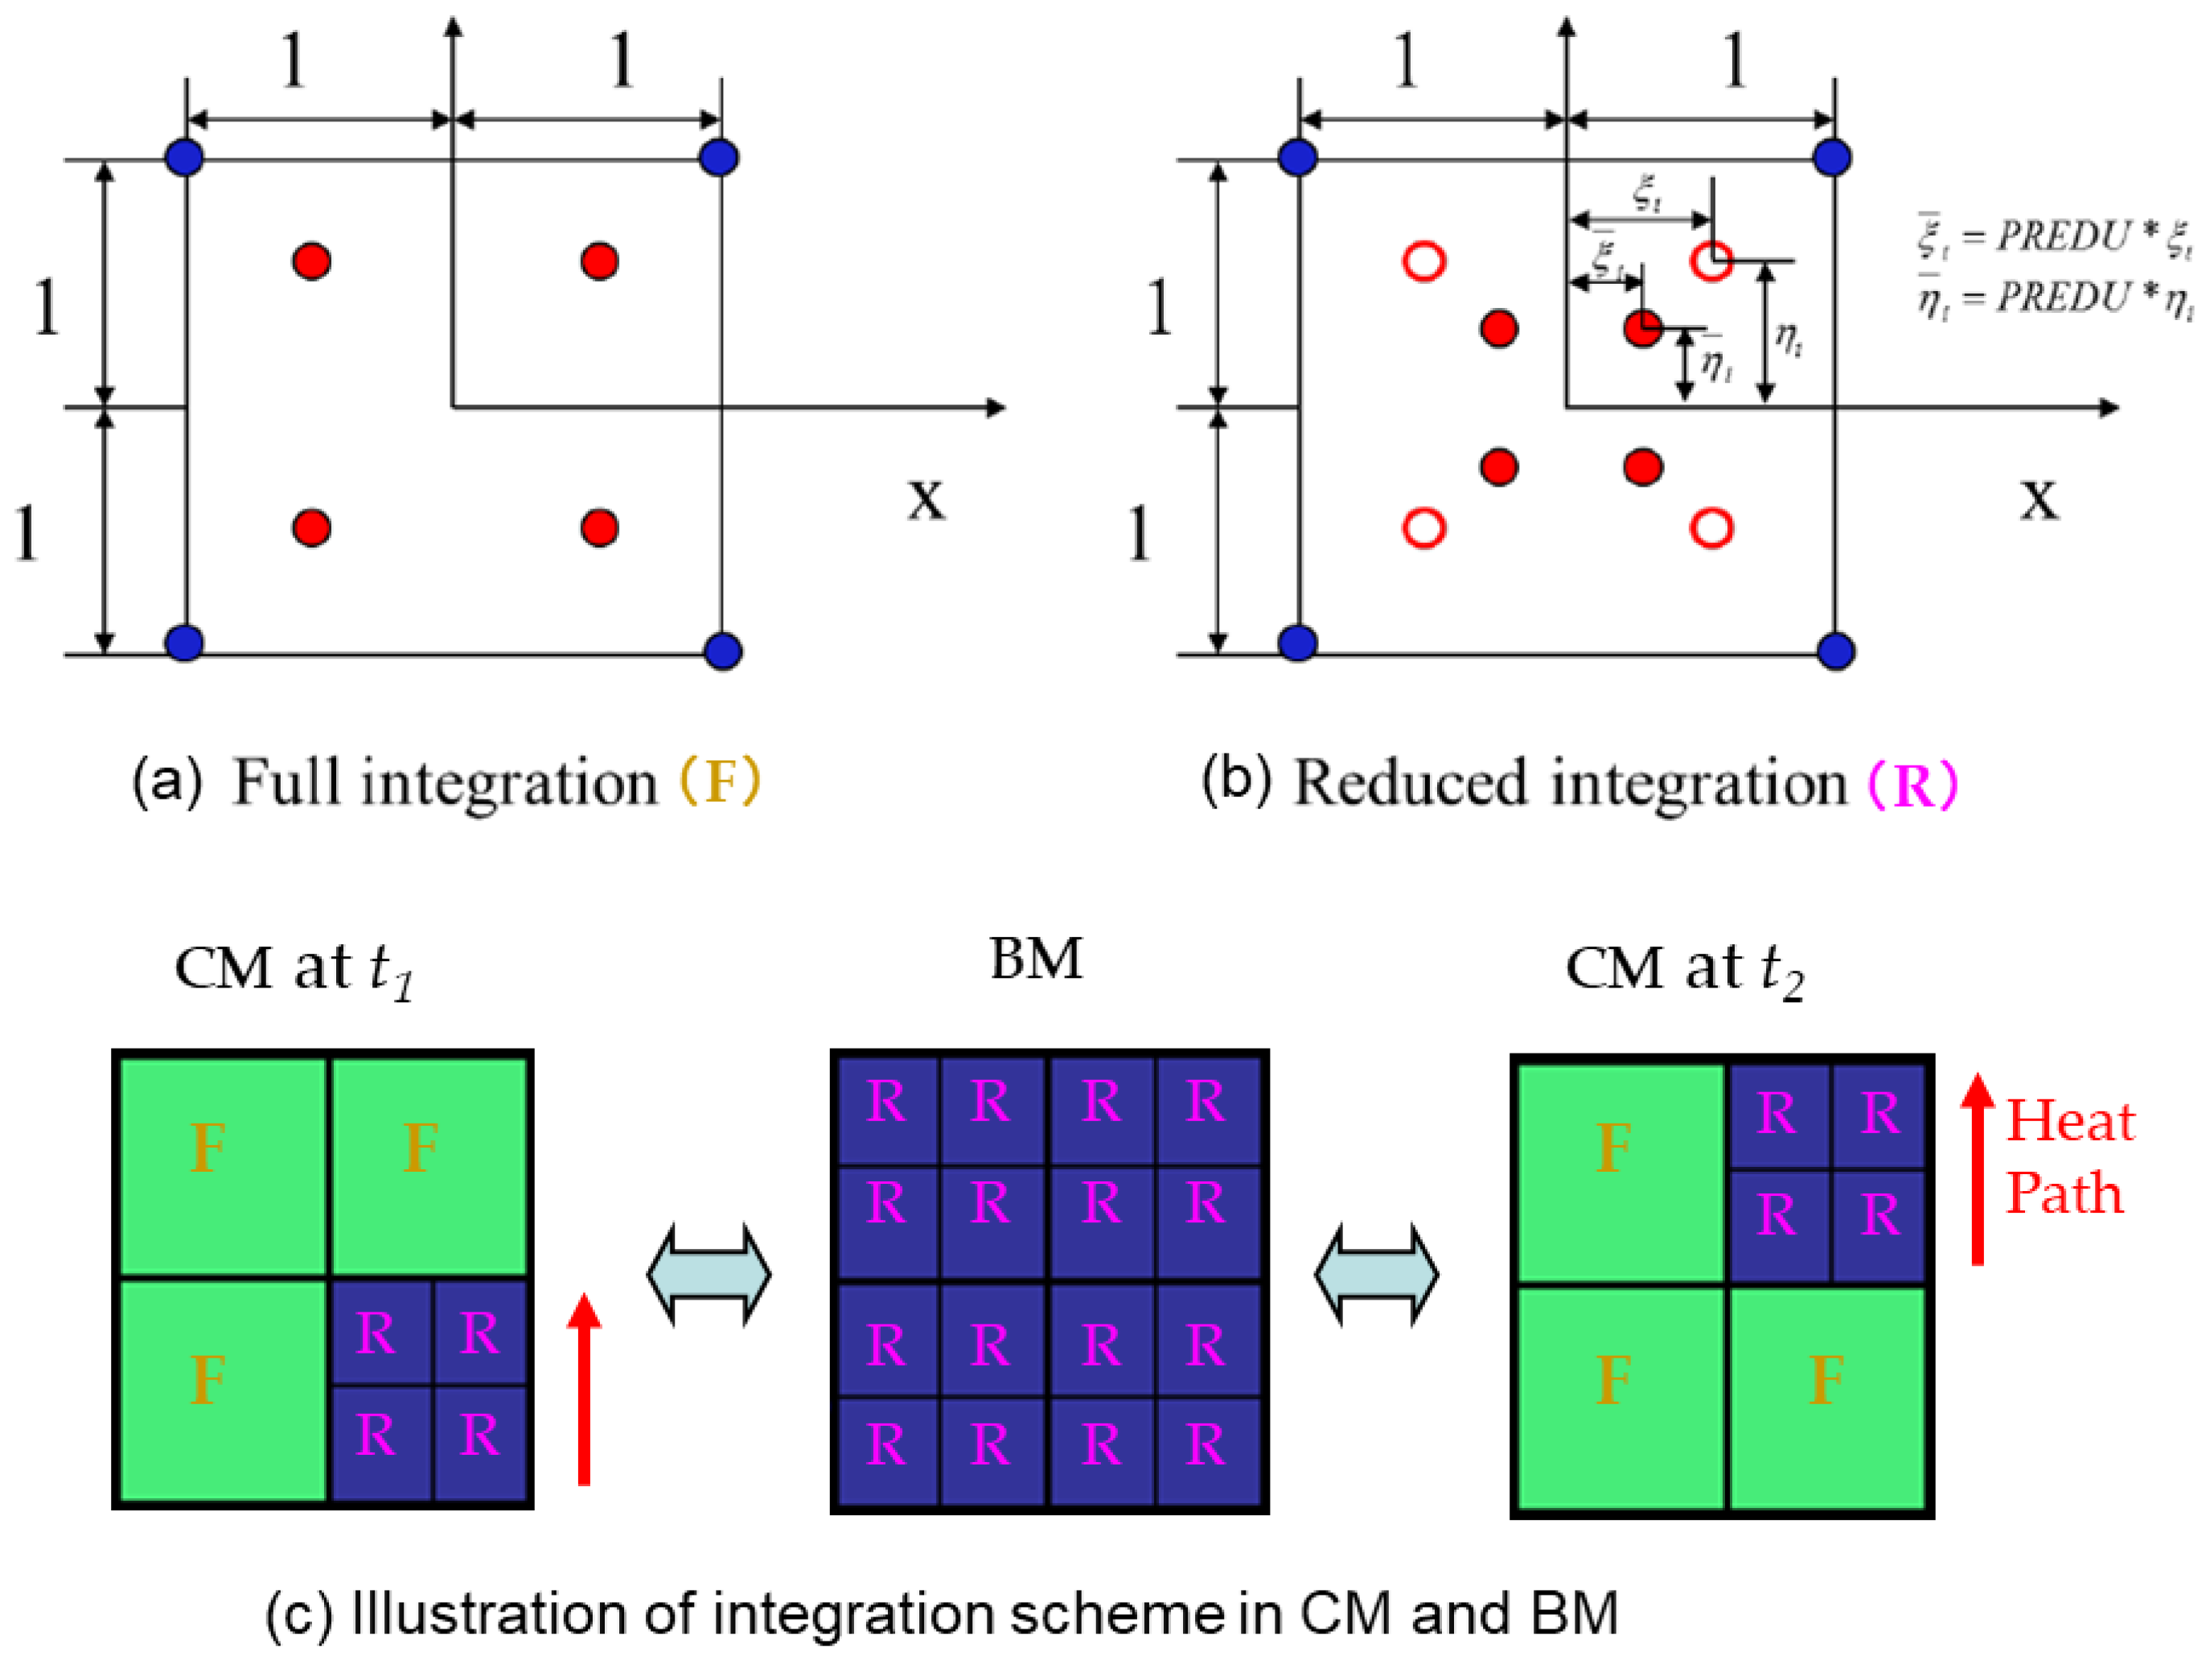
Figure 4.
Refinement scheme based on temperature profile and movement of heat source: (a) dimensions of refinement zone; (b) temperature contours depicted by analytical equation.
Figure 4.
Refinement scheme based on temperature profile and movement of heat source: (a) dimensions of refinement zone; (b) temperature contours depicted by analytical equation.
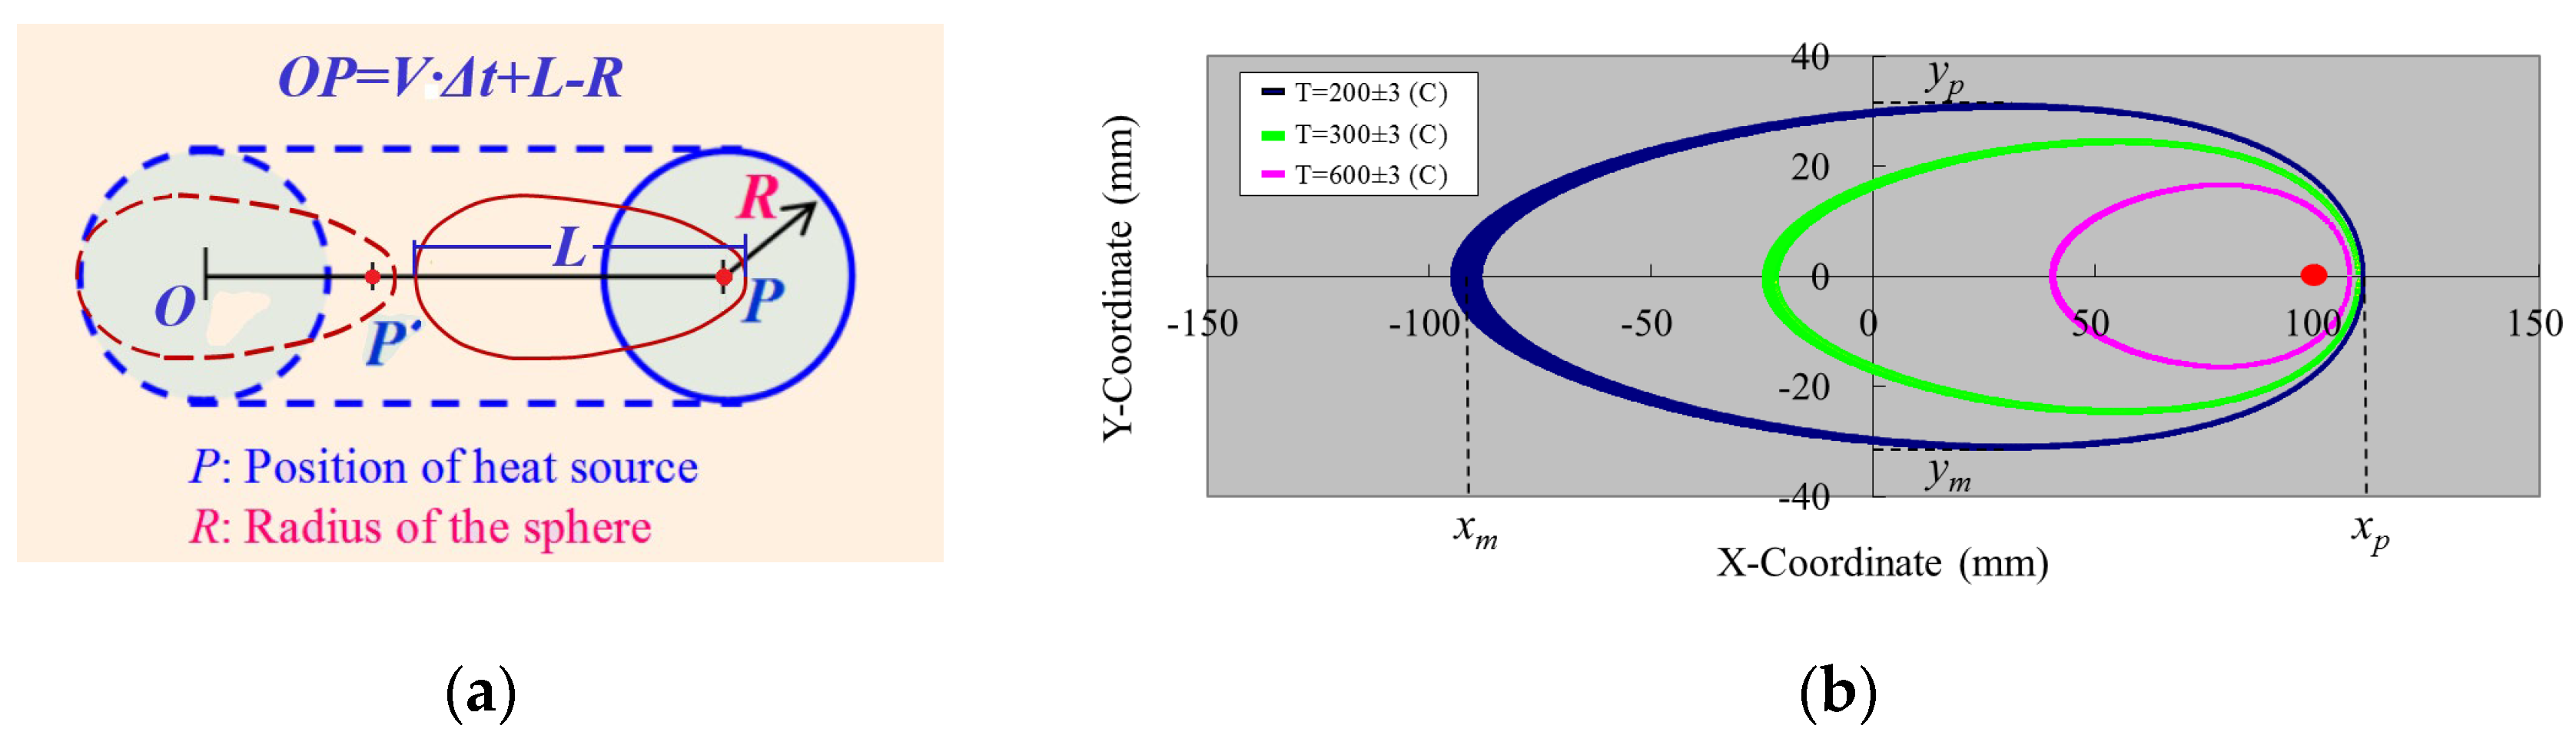
Figure 5.
Computation flowchart of the novel adaptive mesh refinement method.
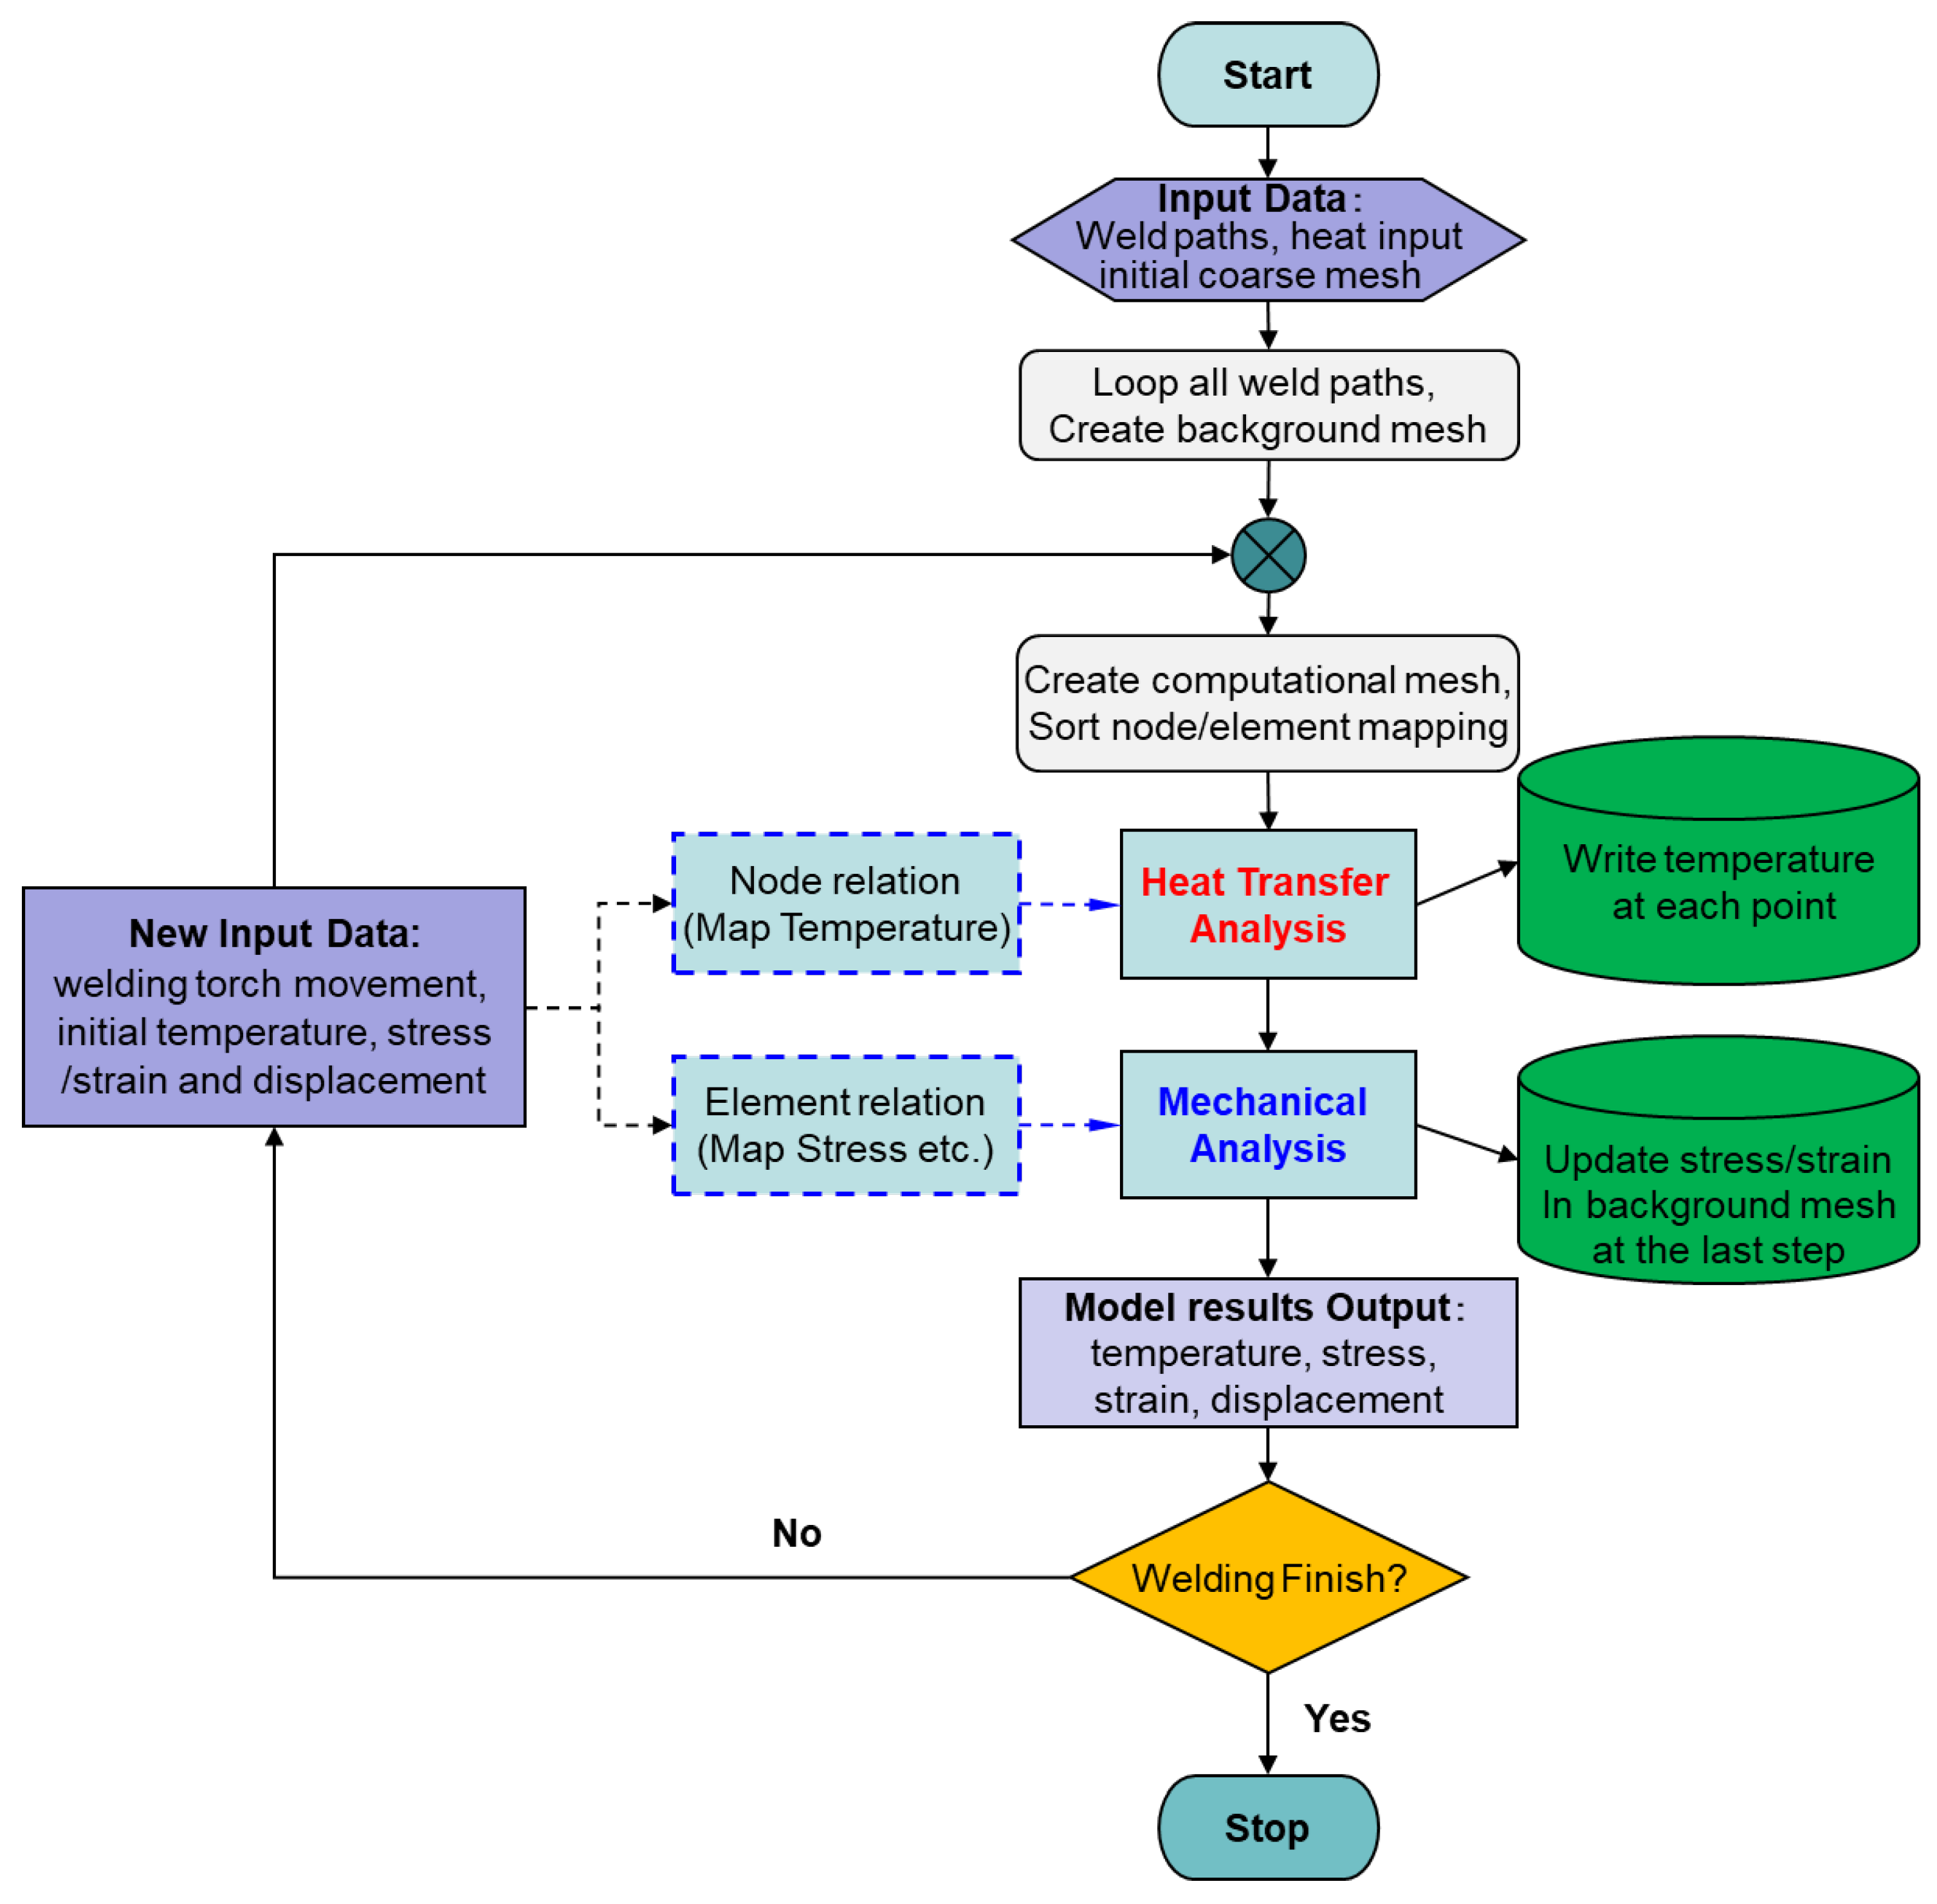
Figure 6.
Fillet welding joint studied: (a) experiment setup; (b) mesh detail and predicted weld.
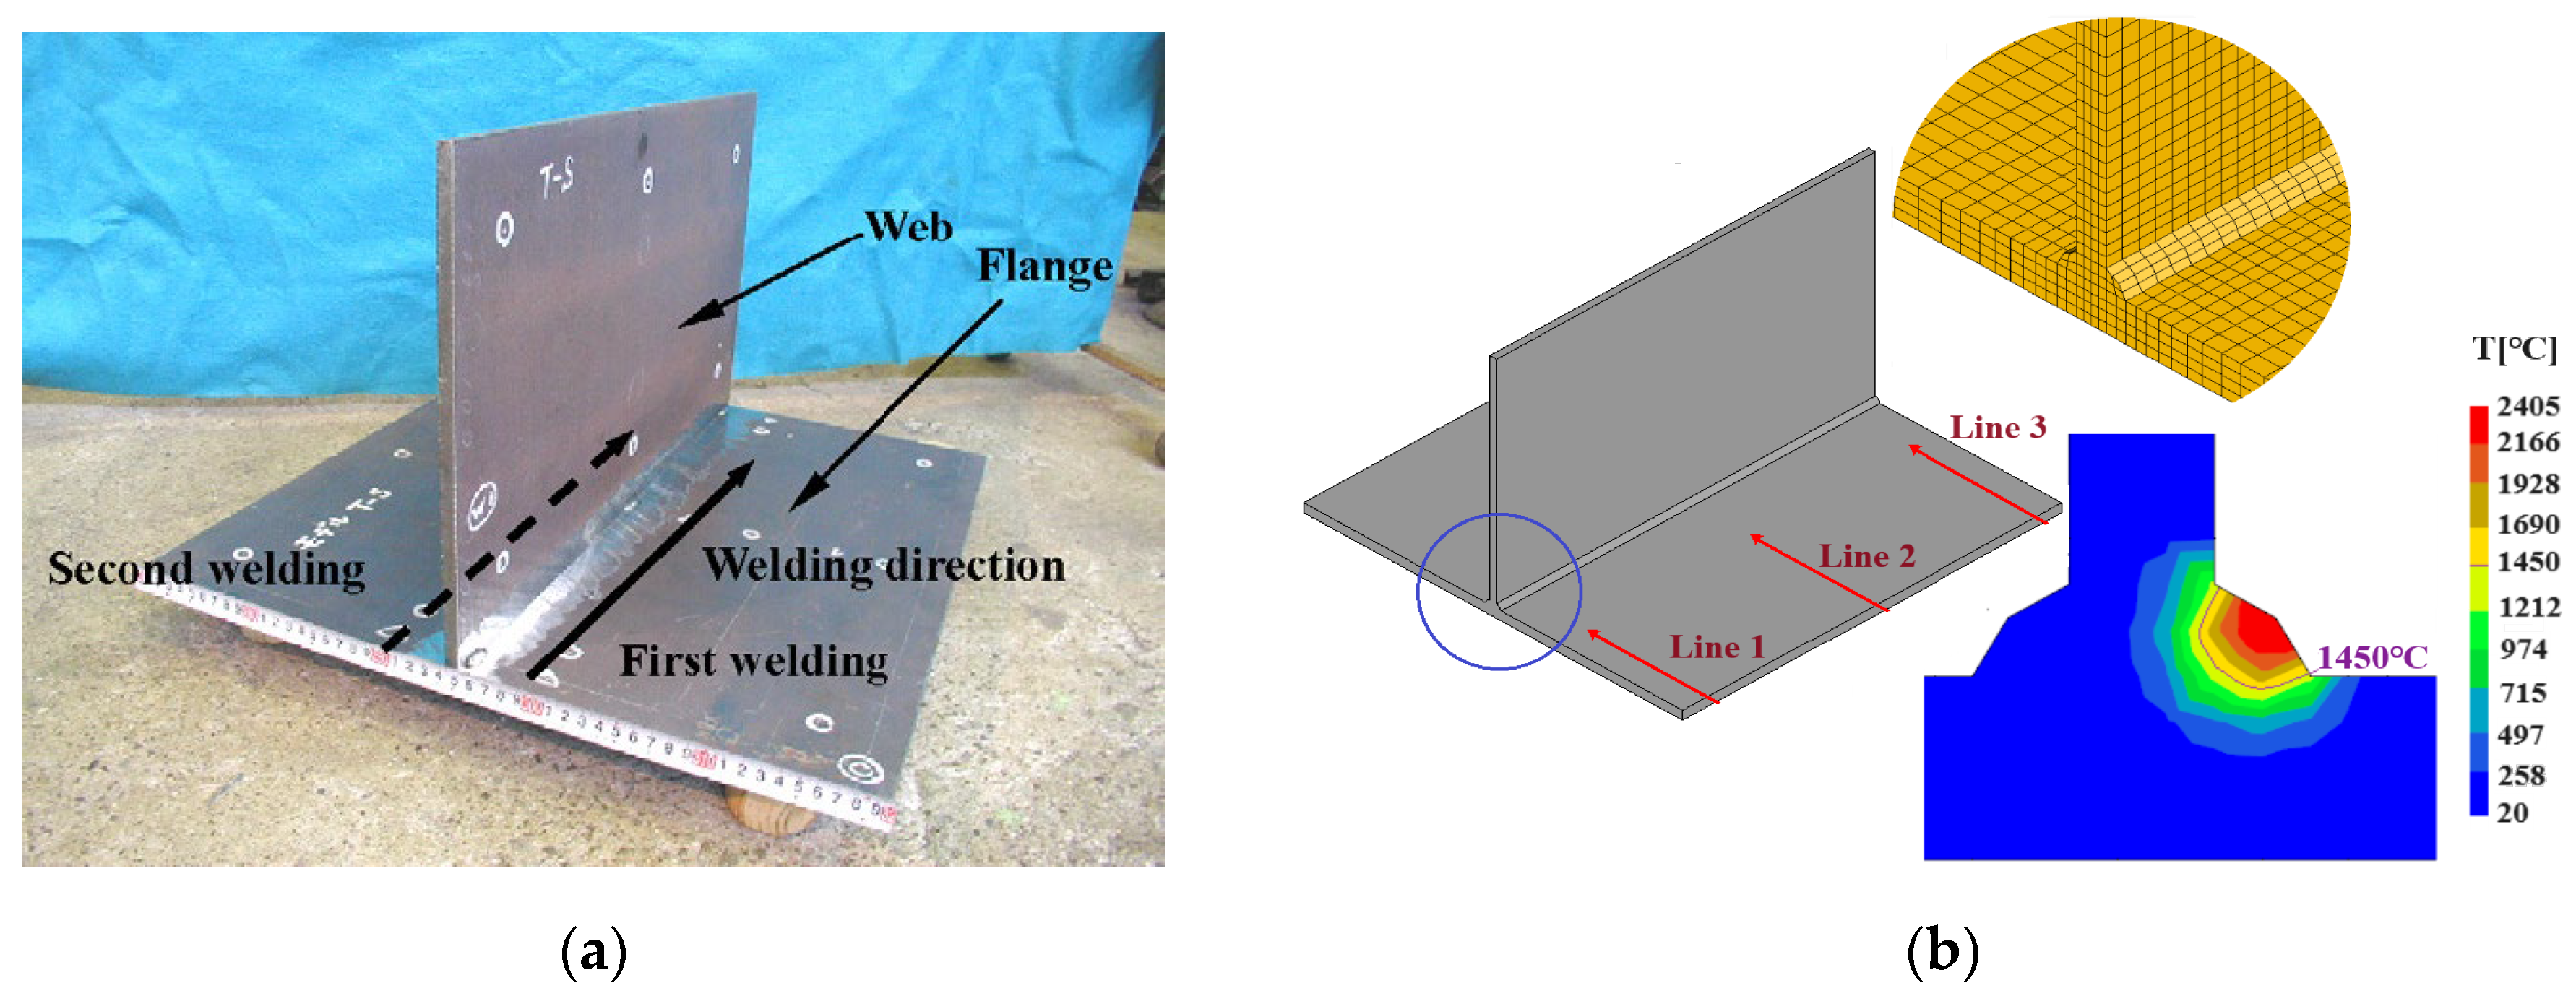
Figure 7.
Transverse displacement results: (a) predicted contour; (b) comparison with measurement.
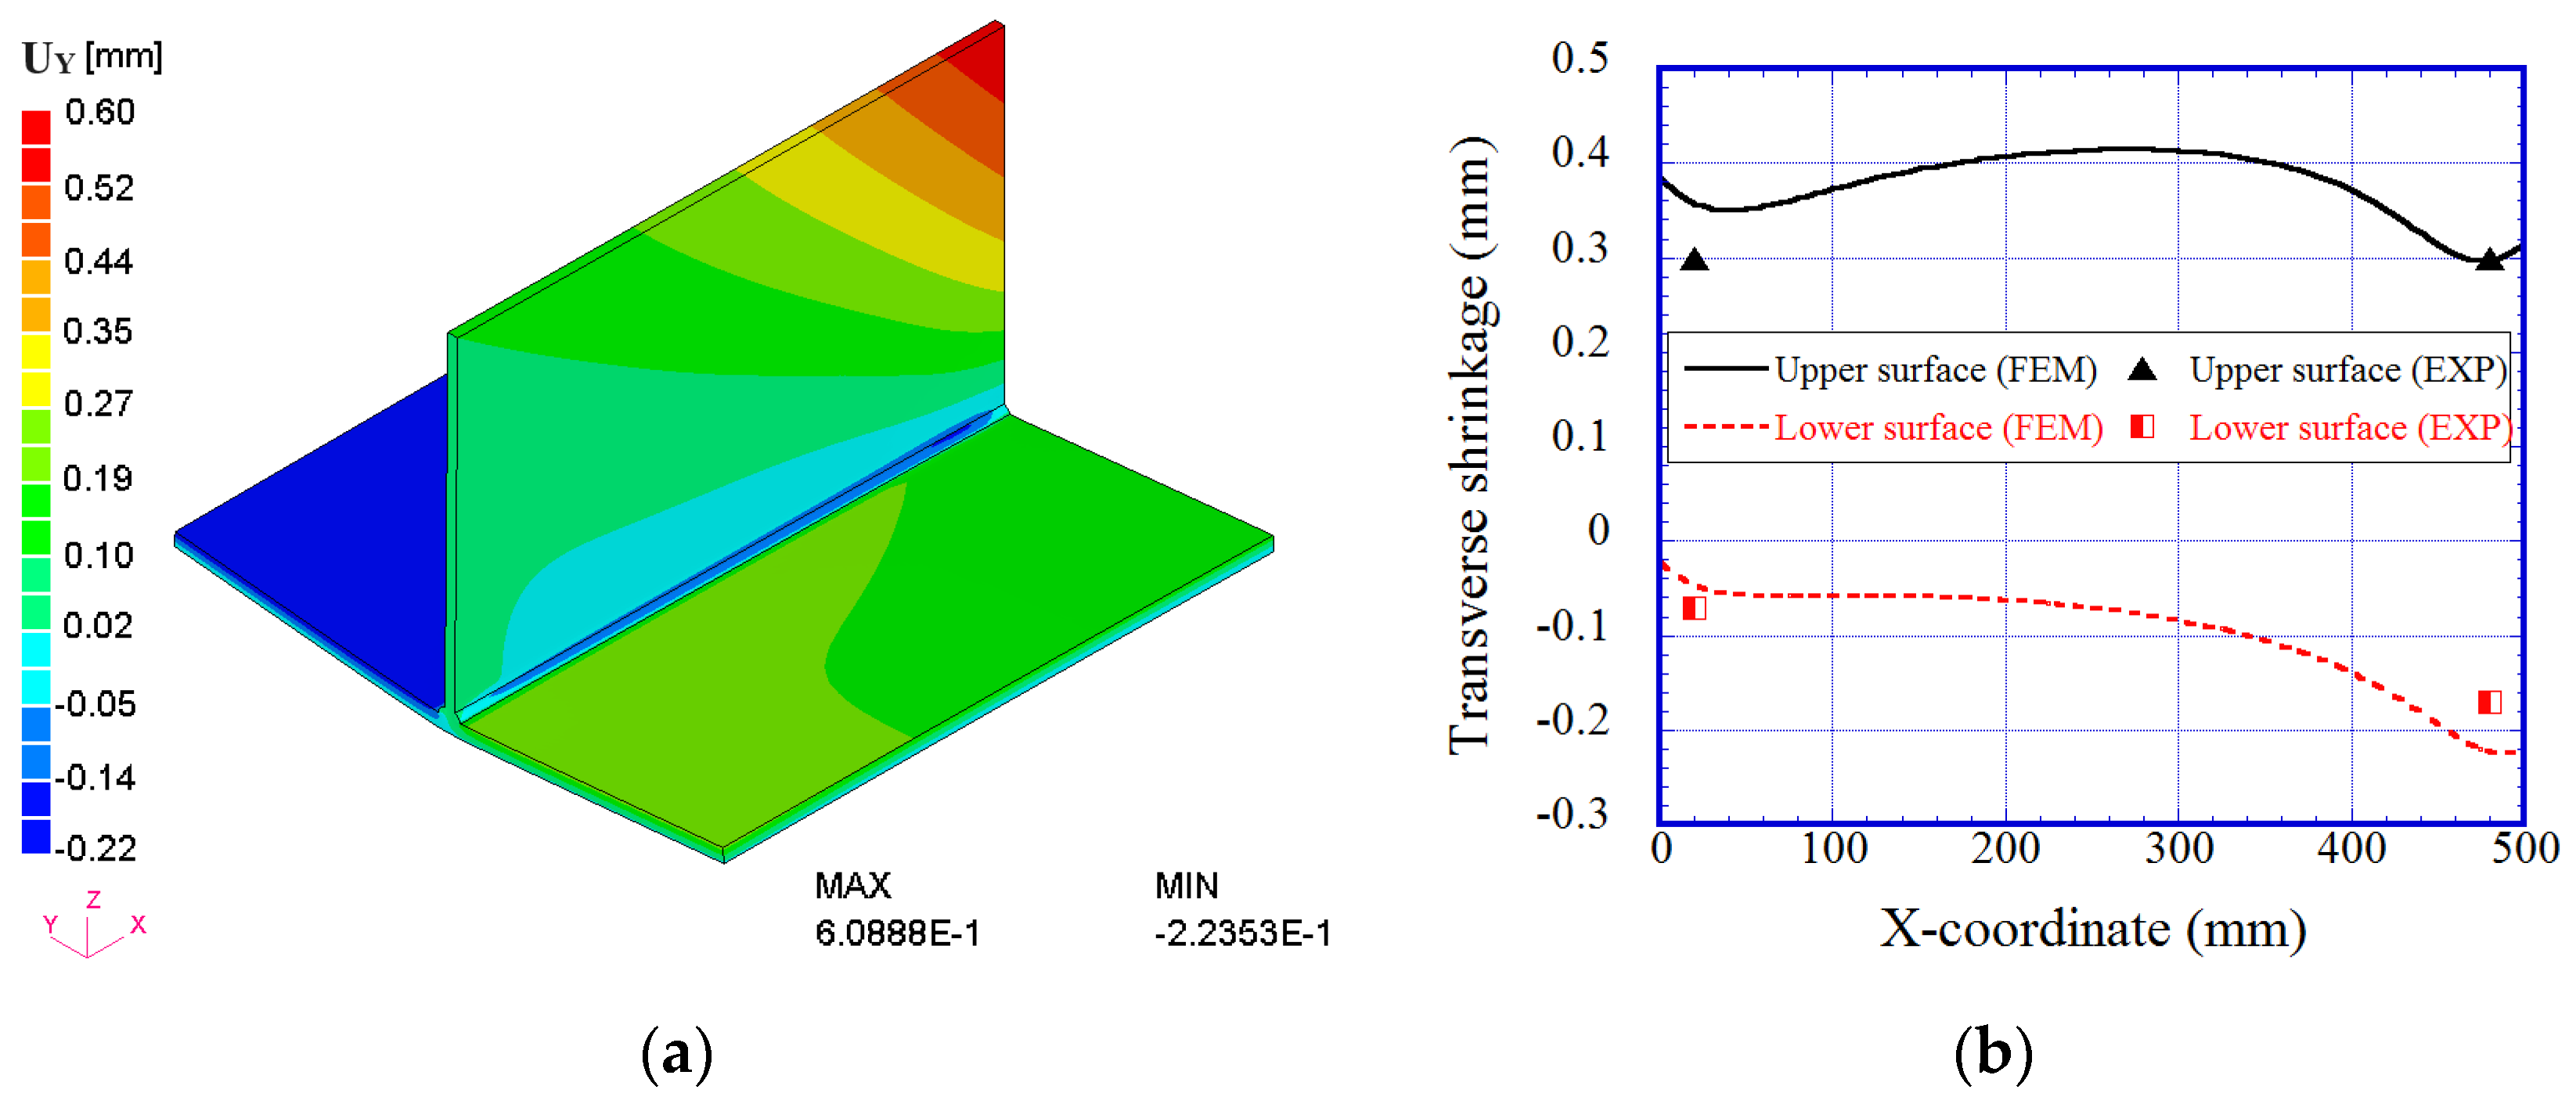
Figure 8.
Vertical displacement results: (a) predicted contour; (b) comparison with measurement.
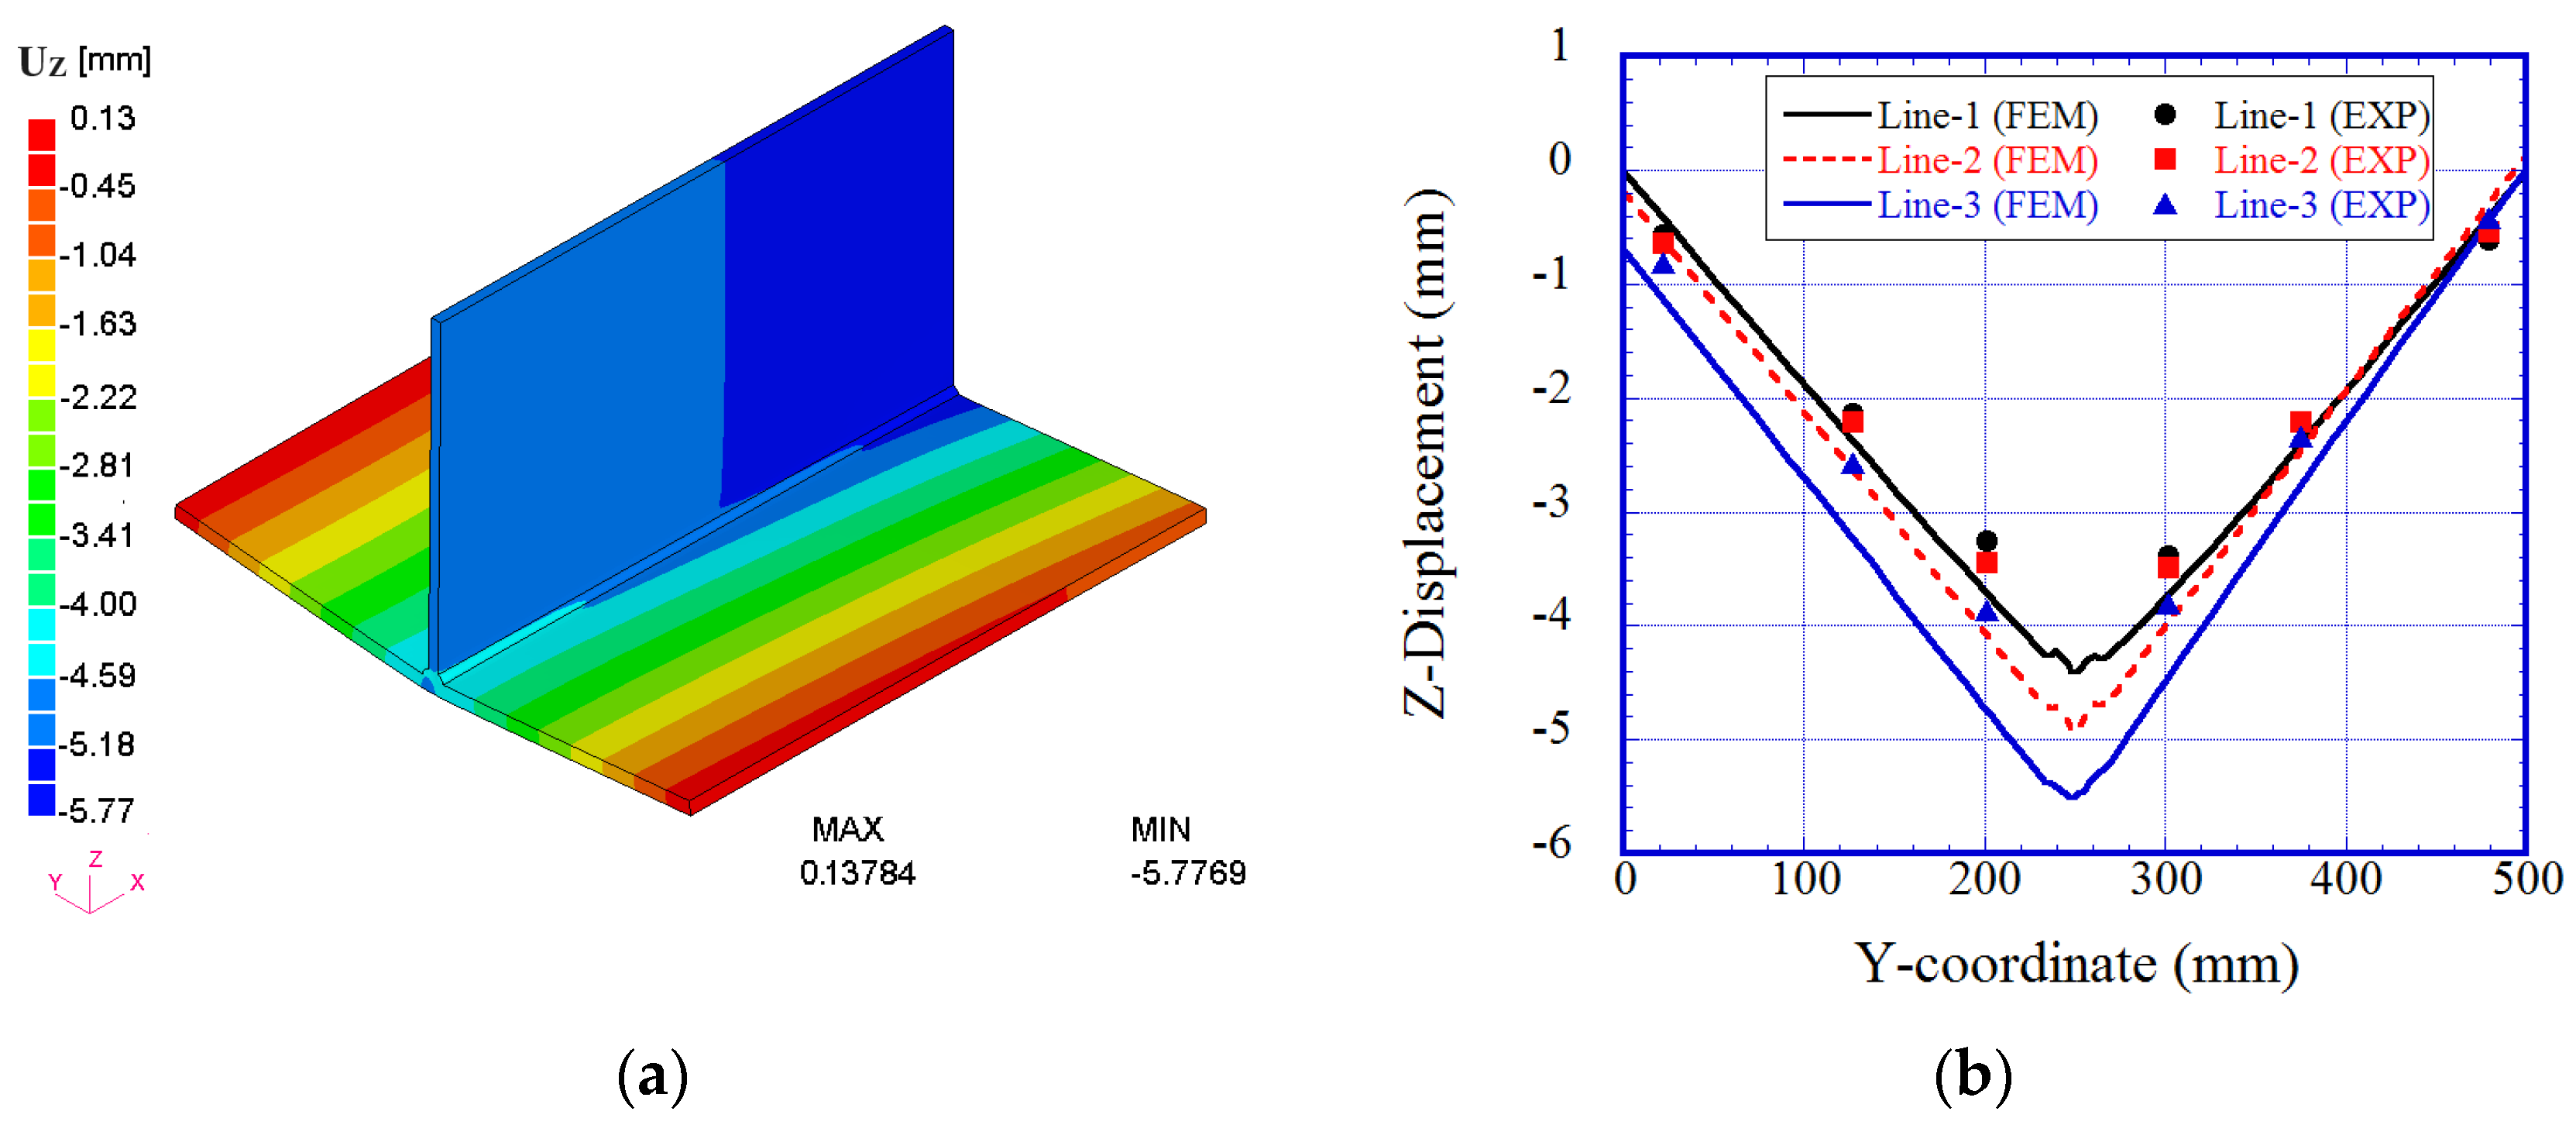
Figure 9.
Fillet welding model and initial coarse mesh.

Figure 10.
Temperature-dependent material properties: (a) thermal physical; (b) mechanical.
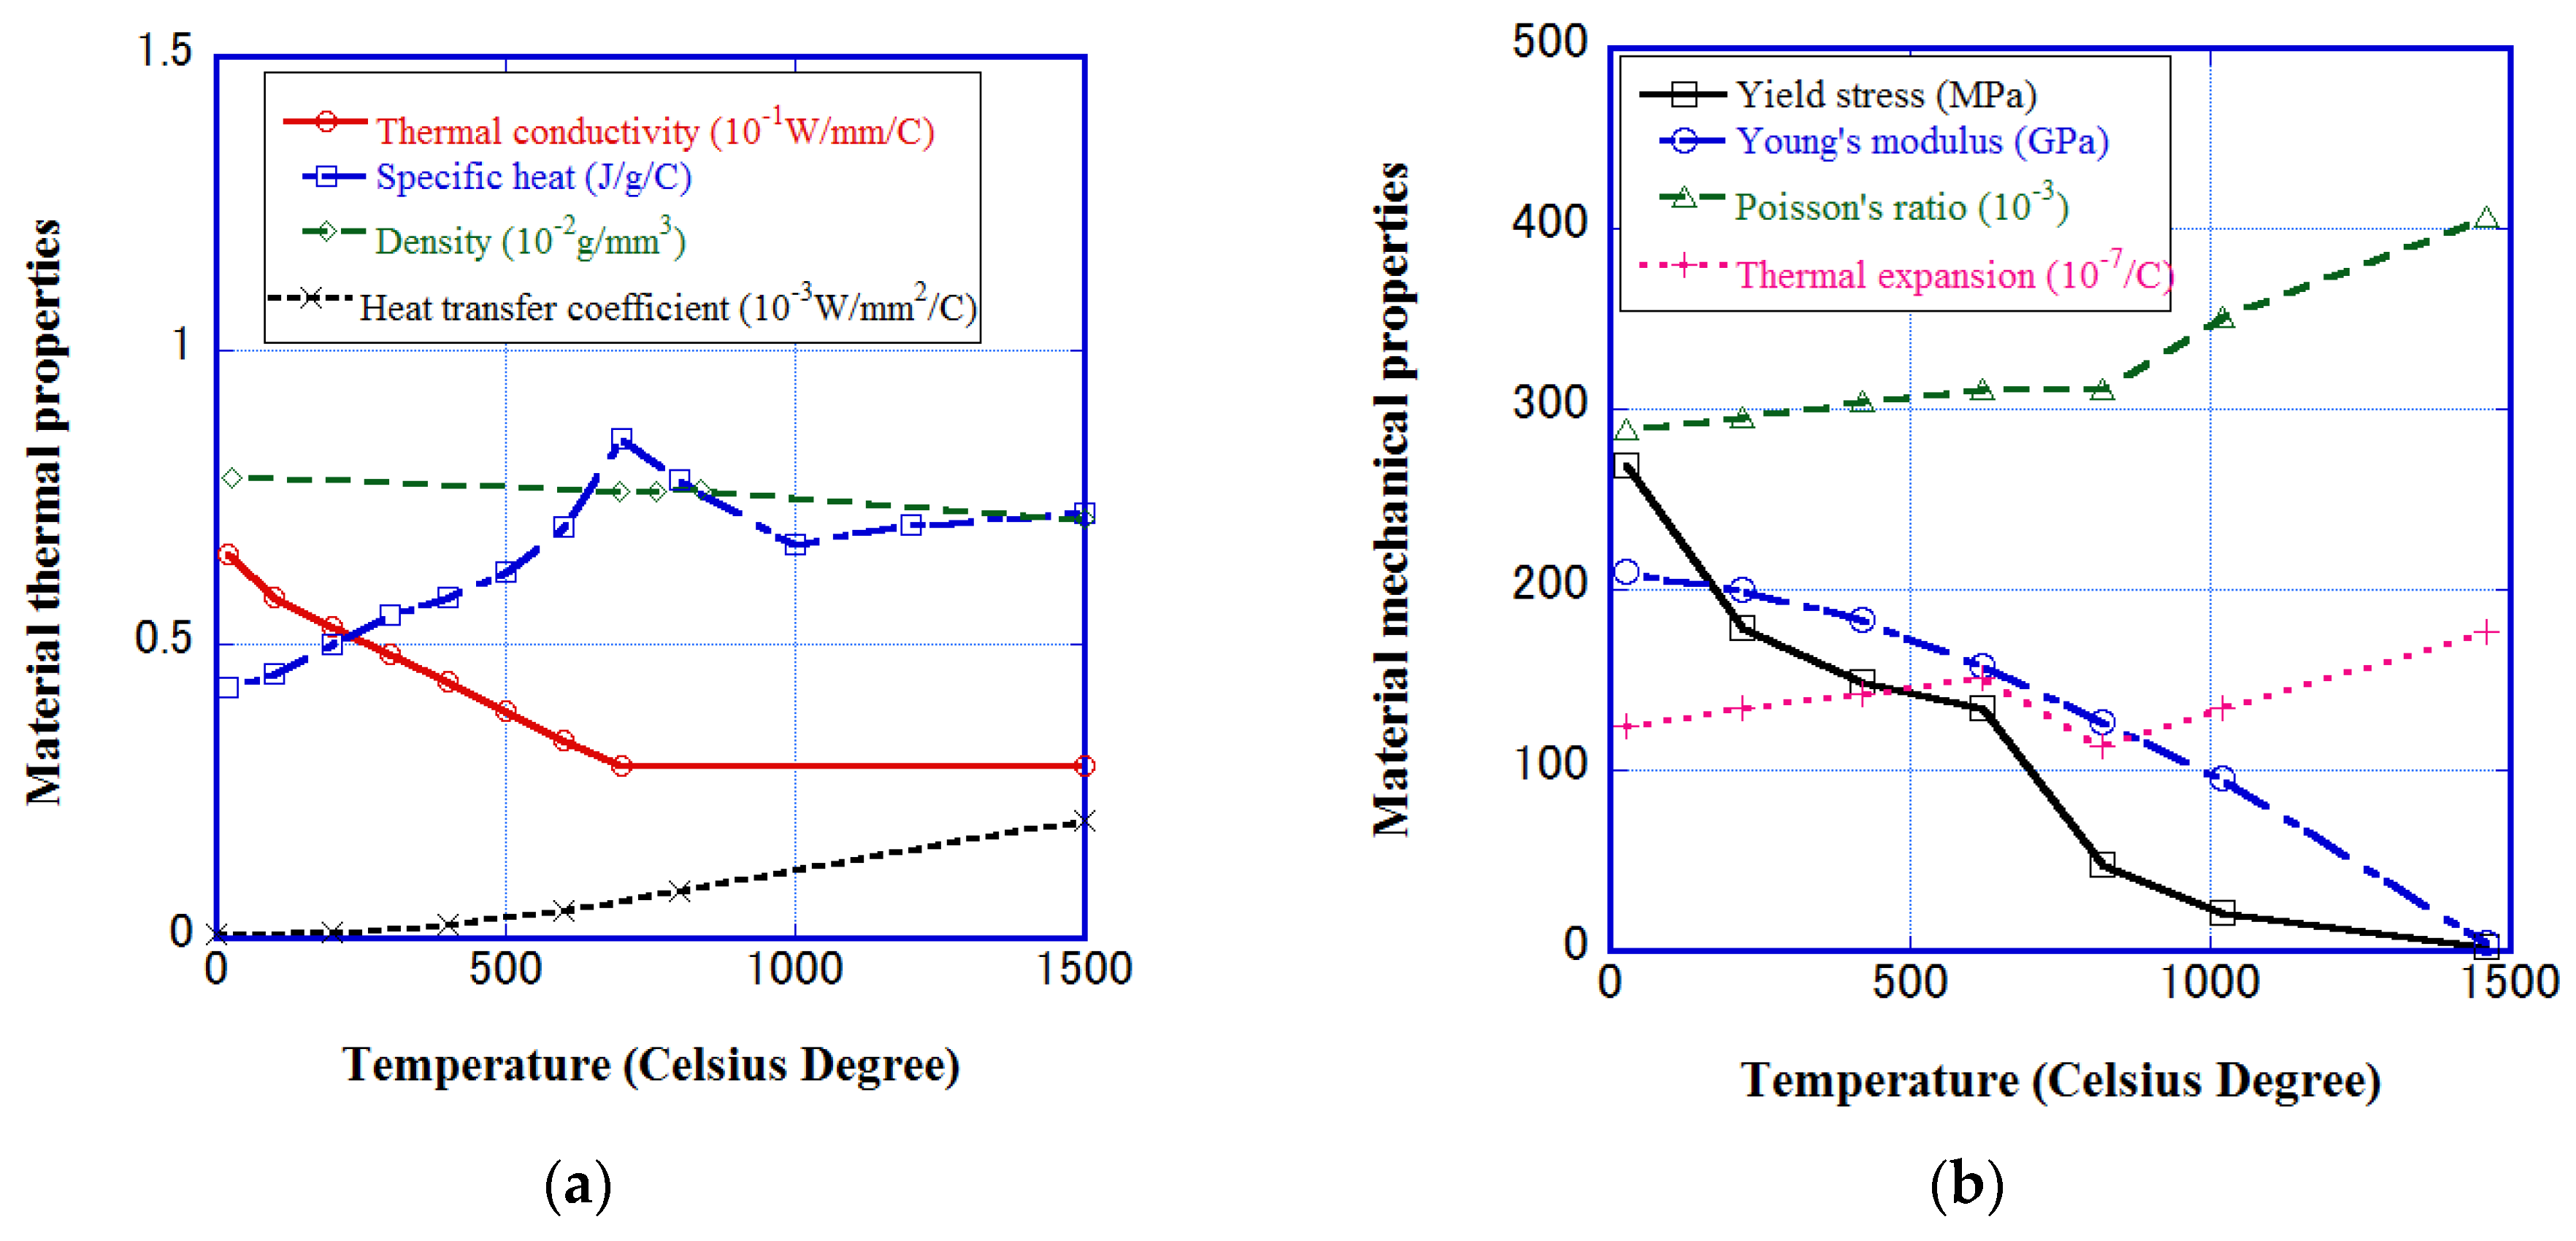
Figure 11.
Thermal conduction analysis: (a) positions of virtually measured points and (b) penetration shape on background mesh.
Figure 11.
Thermal conduction analysis: (a) positions of virtually measured points and (b) penetration shape on background mesh.
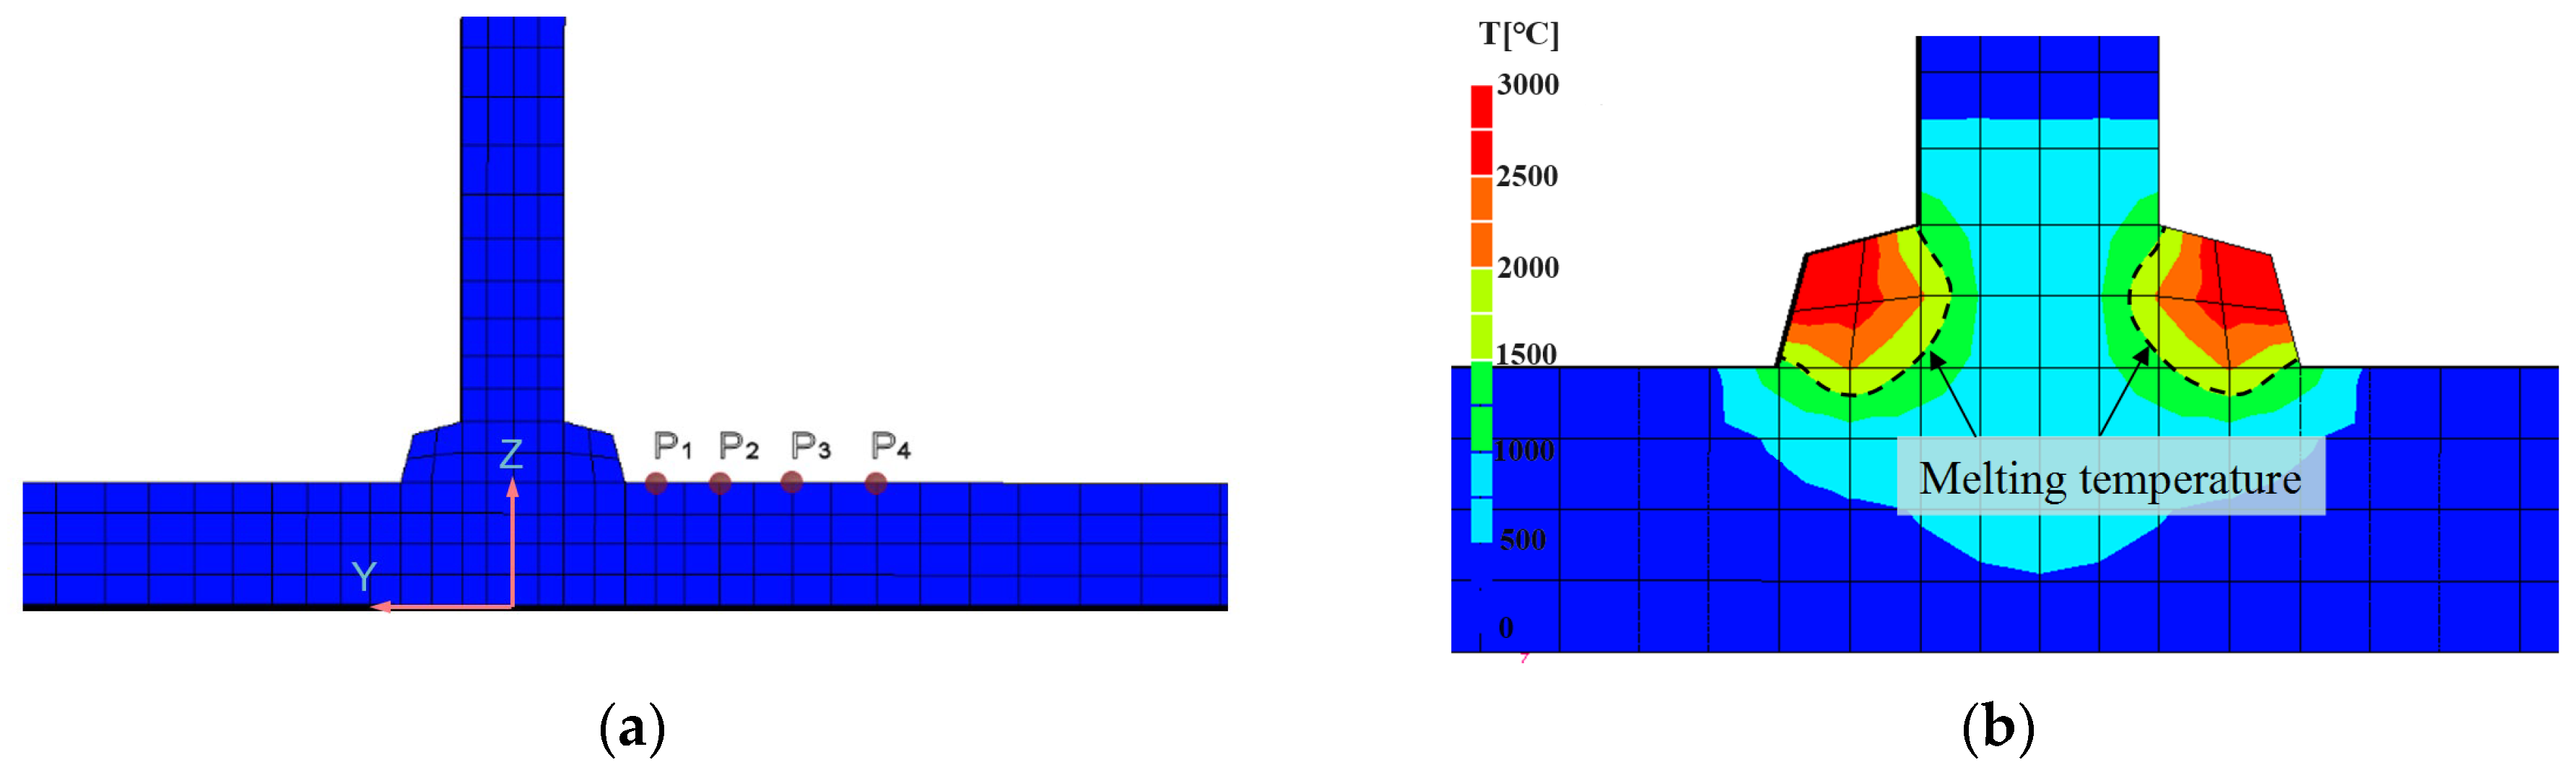
Figure 12.
Transient solution at typical points: (a) temperature; (b) X-displacement; (c) Y-displacement; (d) Z-Displacement.
Figure 12.
Transient solution at typical points: (a) temperature; (b) X-displacement; (c) Y-displacement; (d) Z-Displacement.
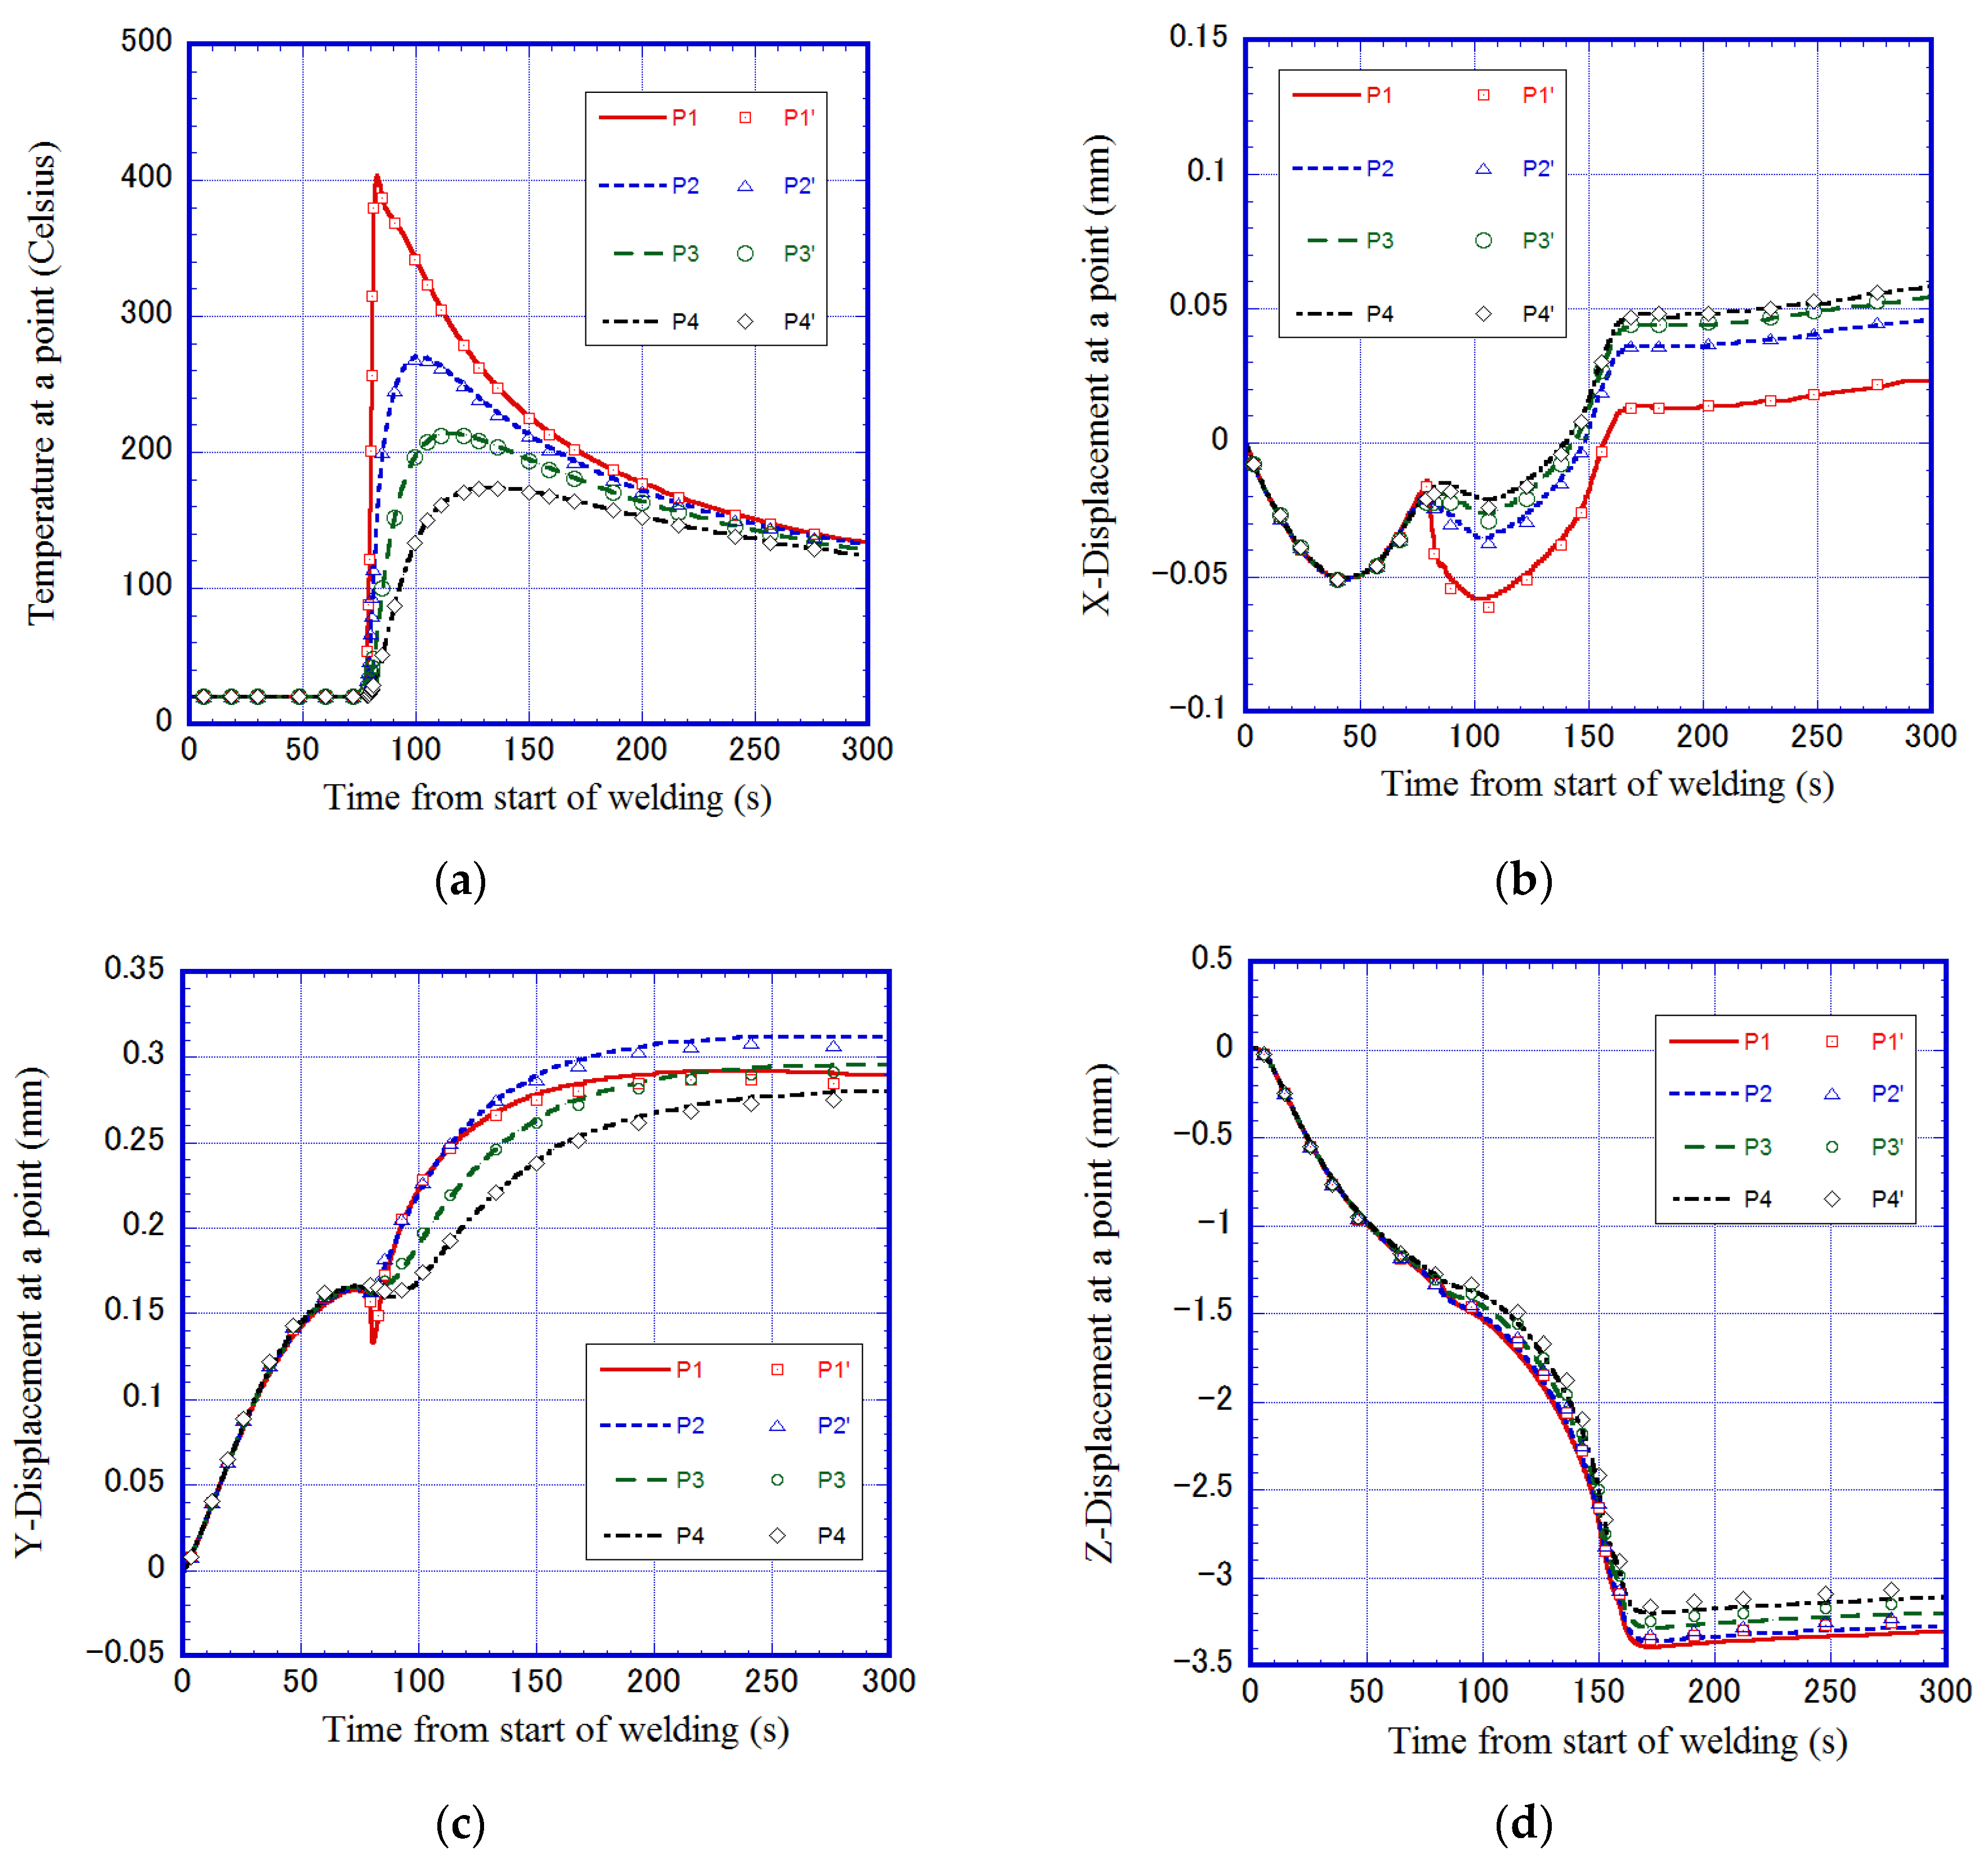
Figure 13.
Simulation results at 30 s: (a) temperature (N-AMR); (b) von Mises stress (N-AMR); (c) von Mises stress (C-FEM).
Figure 13.
Simulation results at 30 s: (a) temperature (N-AMR); (b) von Mises stress (N-AMR); (c) von Mises stress (C-FEM).
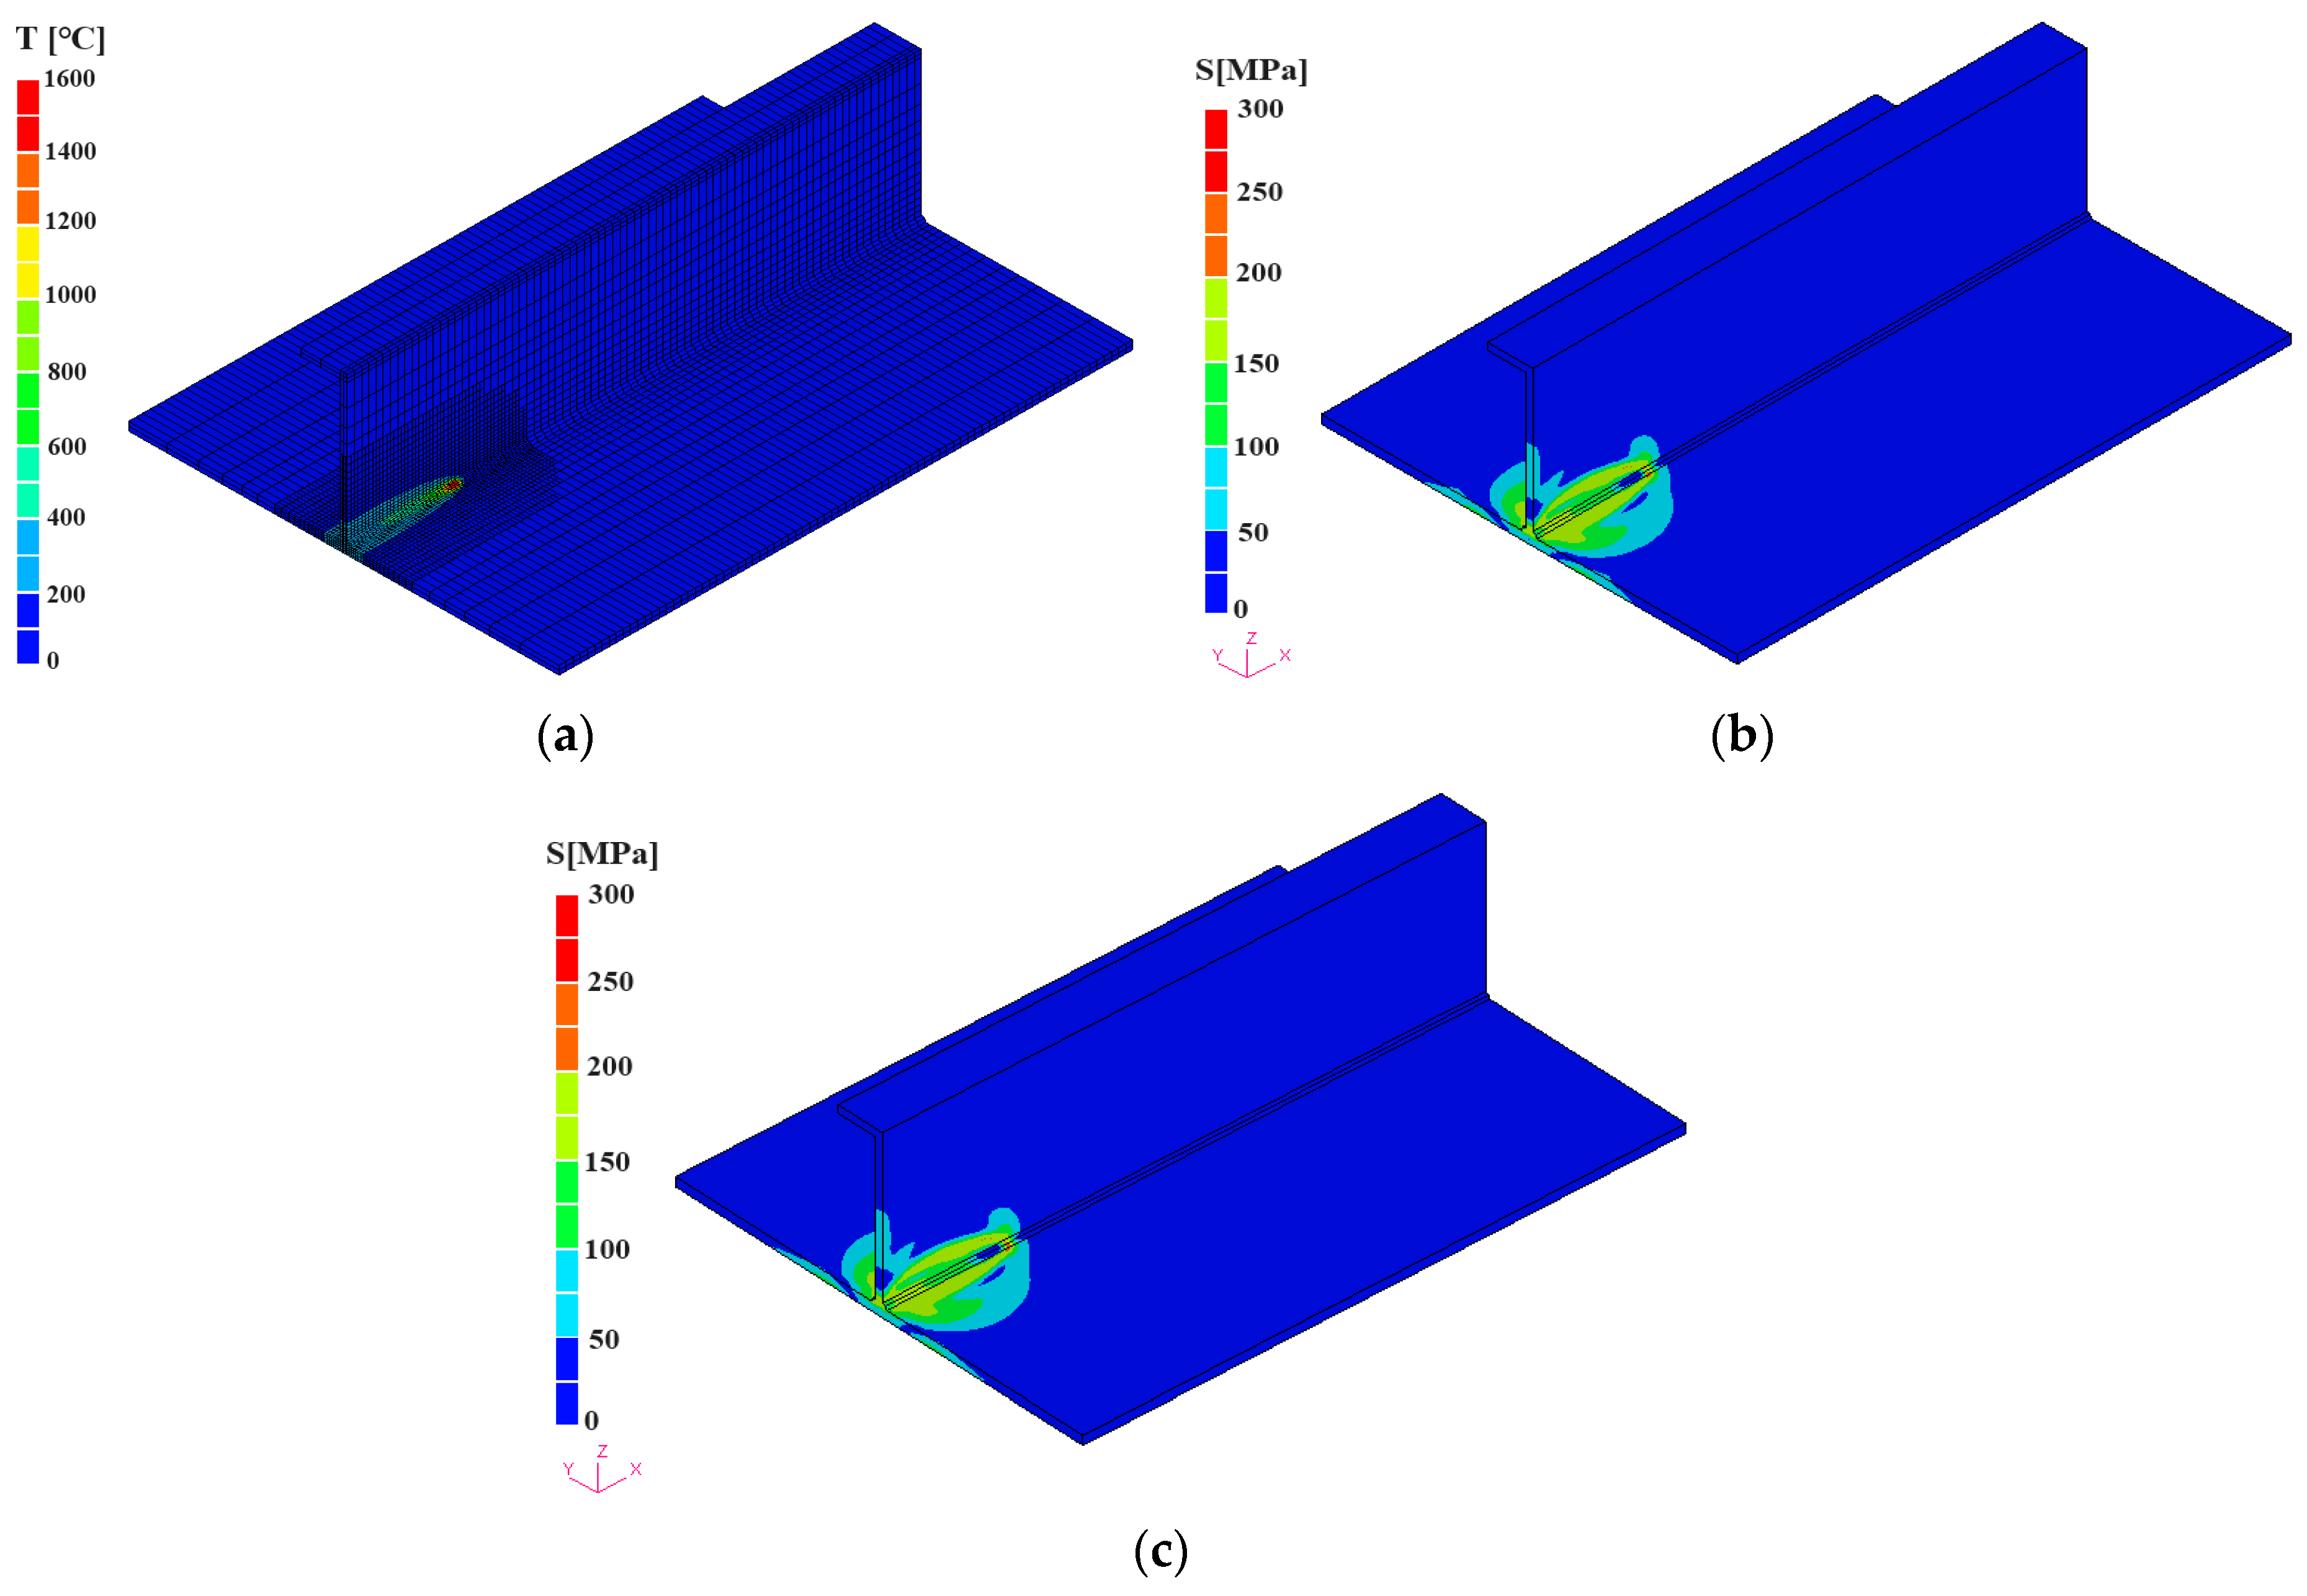
Figure 14.
Simulation results at 90 s: (a) temperature (N-AMR); (b) von Mises stress (N-AMR); (c) von Mises stress (C-FEM).
Figure 14.
Simulation results at 90 s: (a) temperature (N-AMR); (b) von Mises stress (N-AMR); (c) von Mises stress (C-FEM).
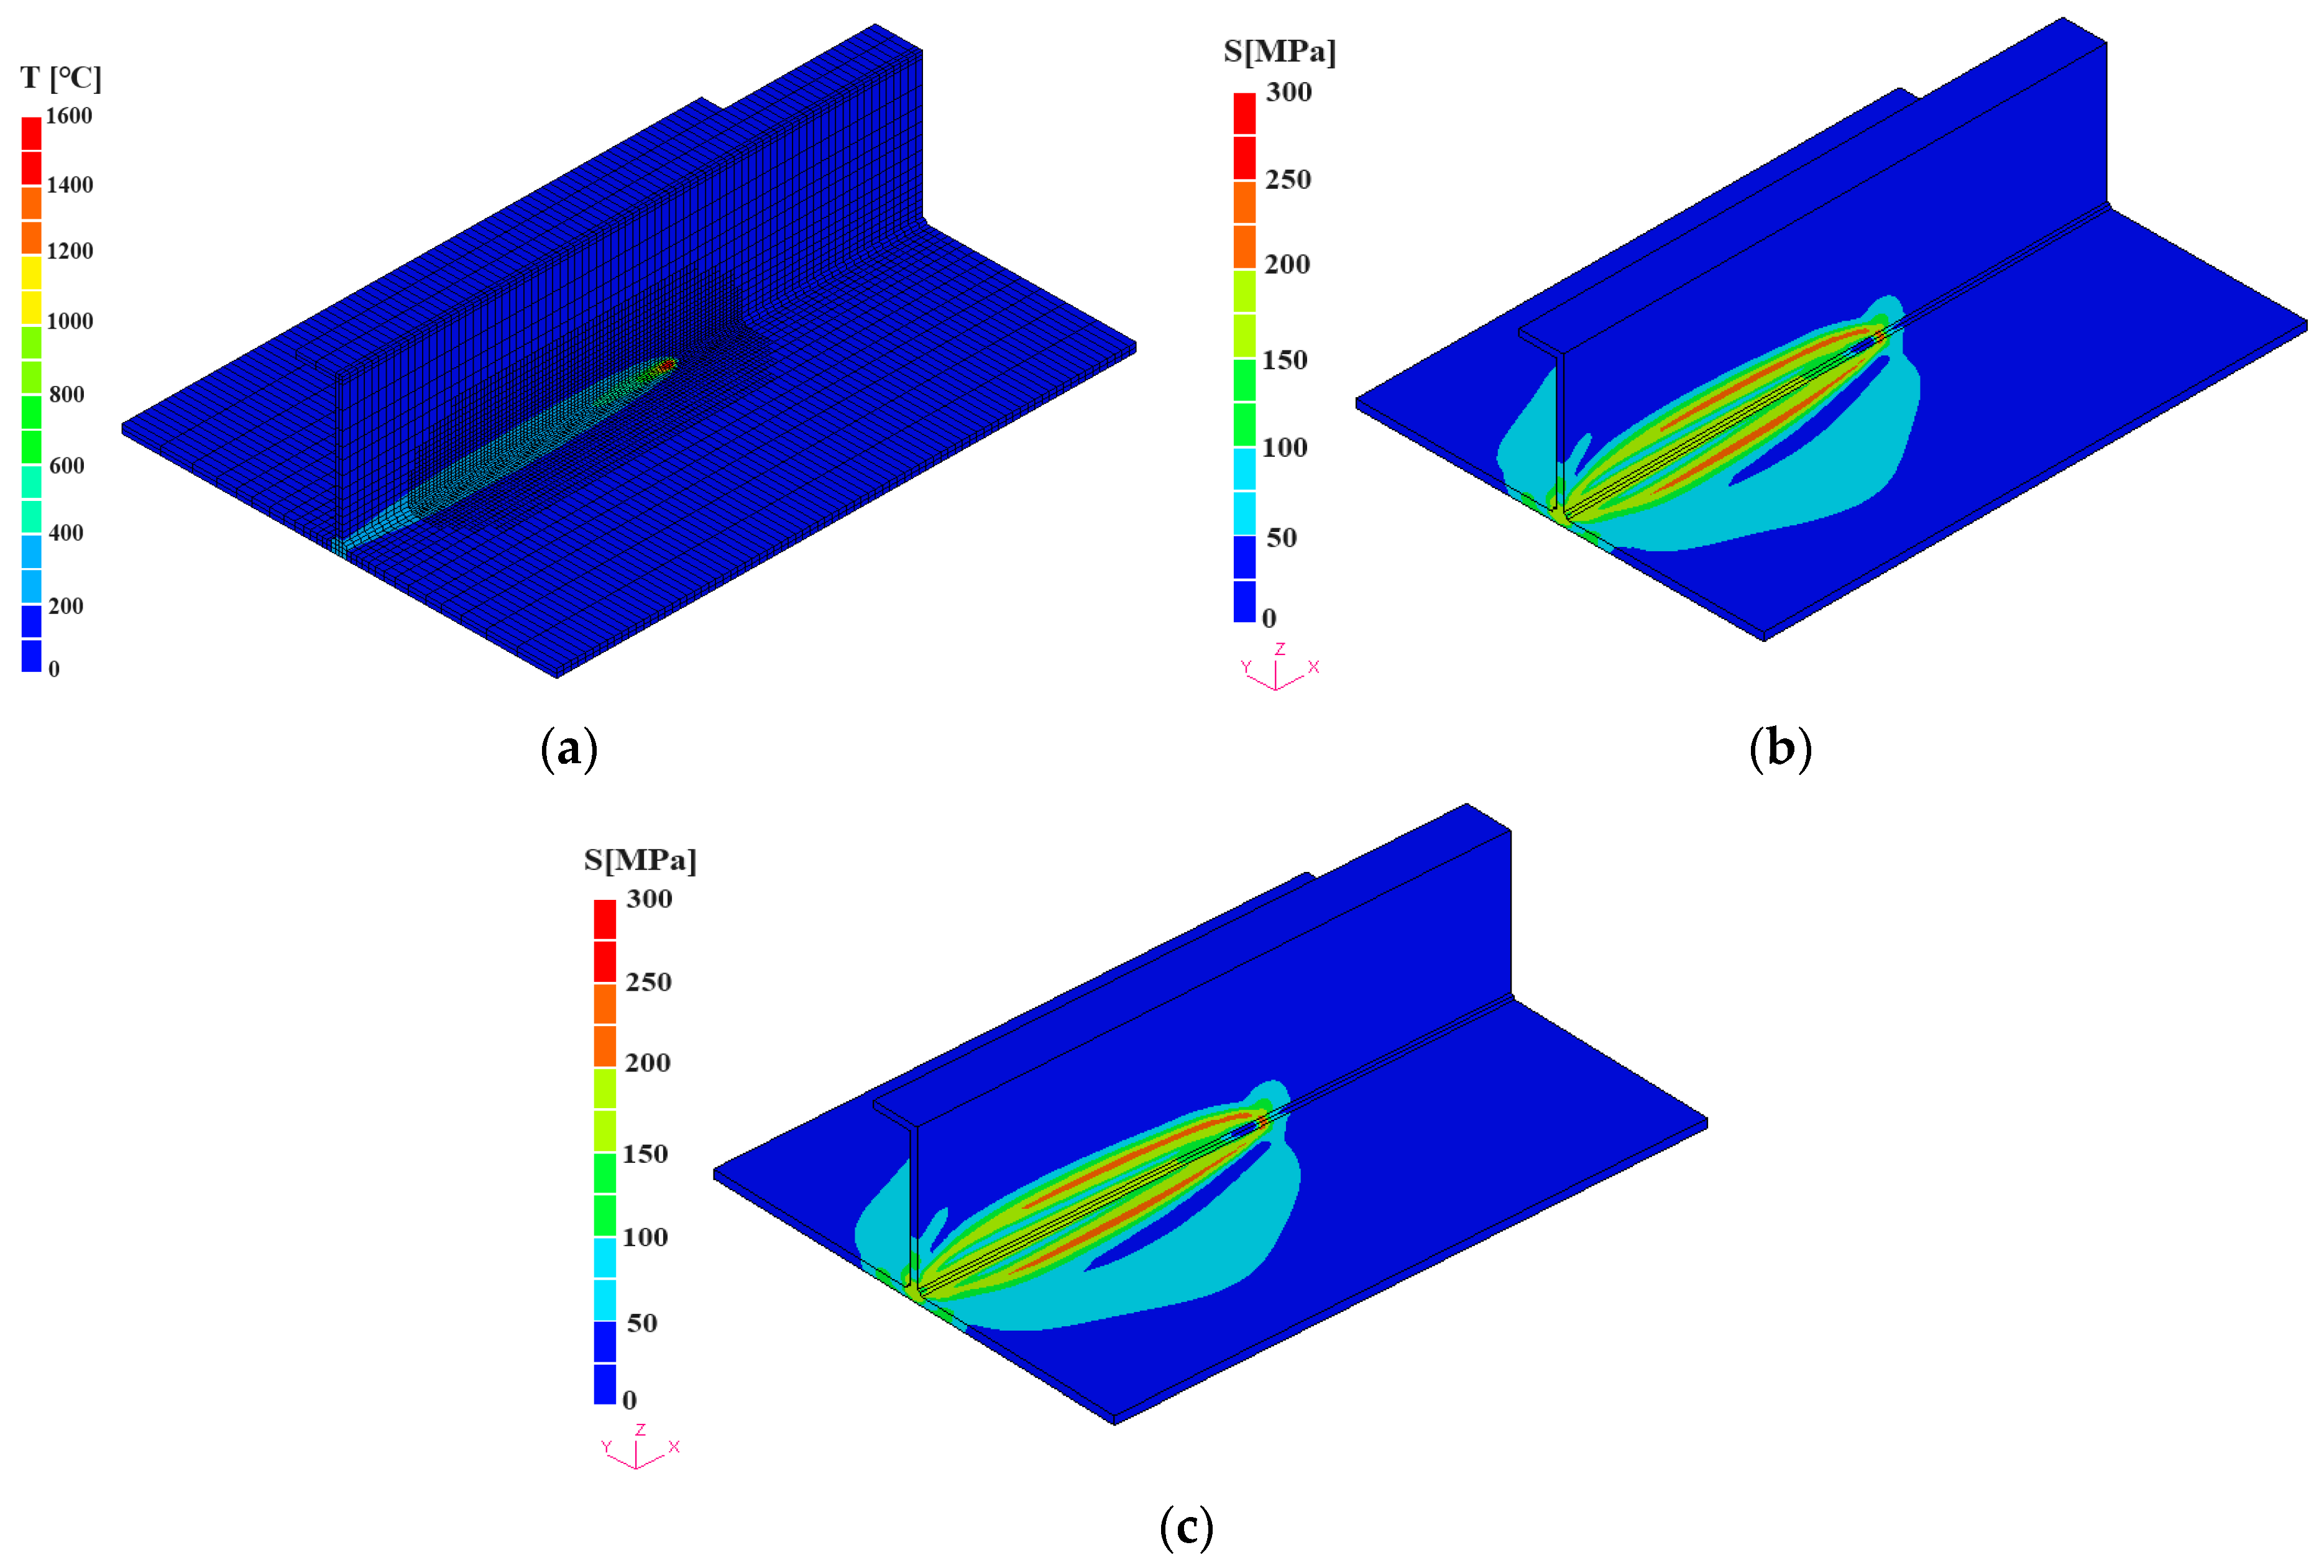
Figure 15.
Simulation results at 3000 s: (a) temperature (N-AMR); (b) von Mises stress (N-AMR); (c) von Mises stress (C-FEM).
Figure 15.
Simulation results at 3000 s: (a) temperature (N-AMR); (b) von Mises stress (N-AMR); (c) von Mises stress (C-FEM).

Figure 16.
Deformation contours after cooling: (a) X-displacement; (b) Y-displacement; (c) Z-displacement.
Figure 16.
Deformation contours after cooling: (a) X-displacement; (b) Y-displacement; (c) Z-displacement.
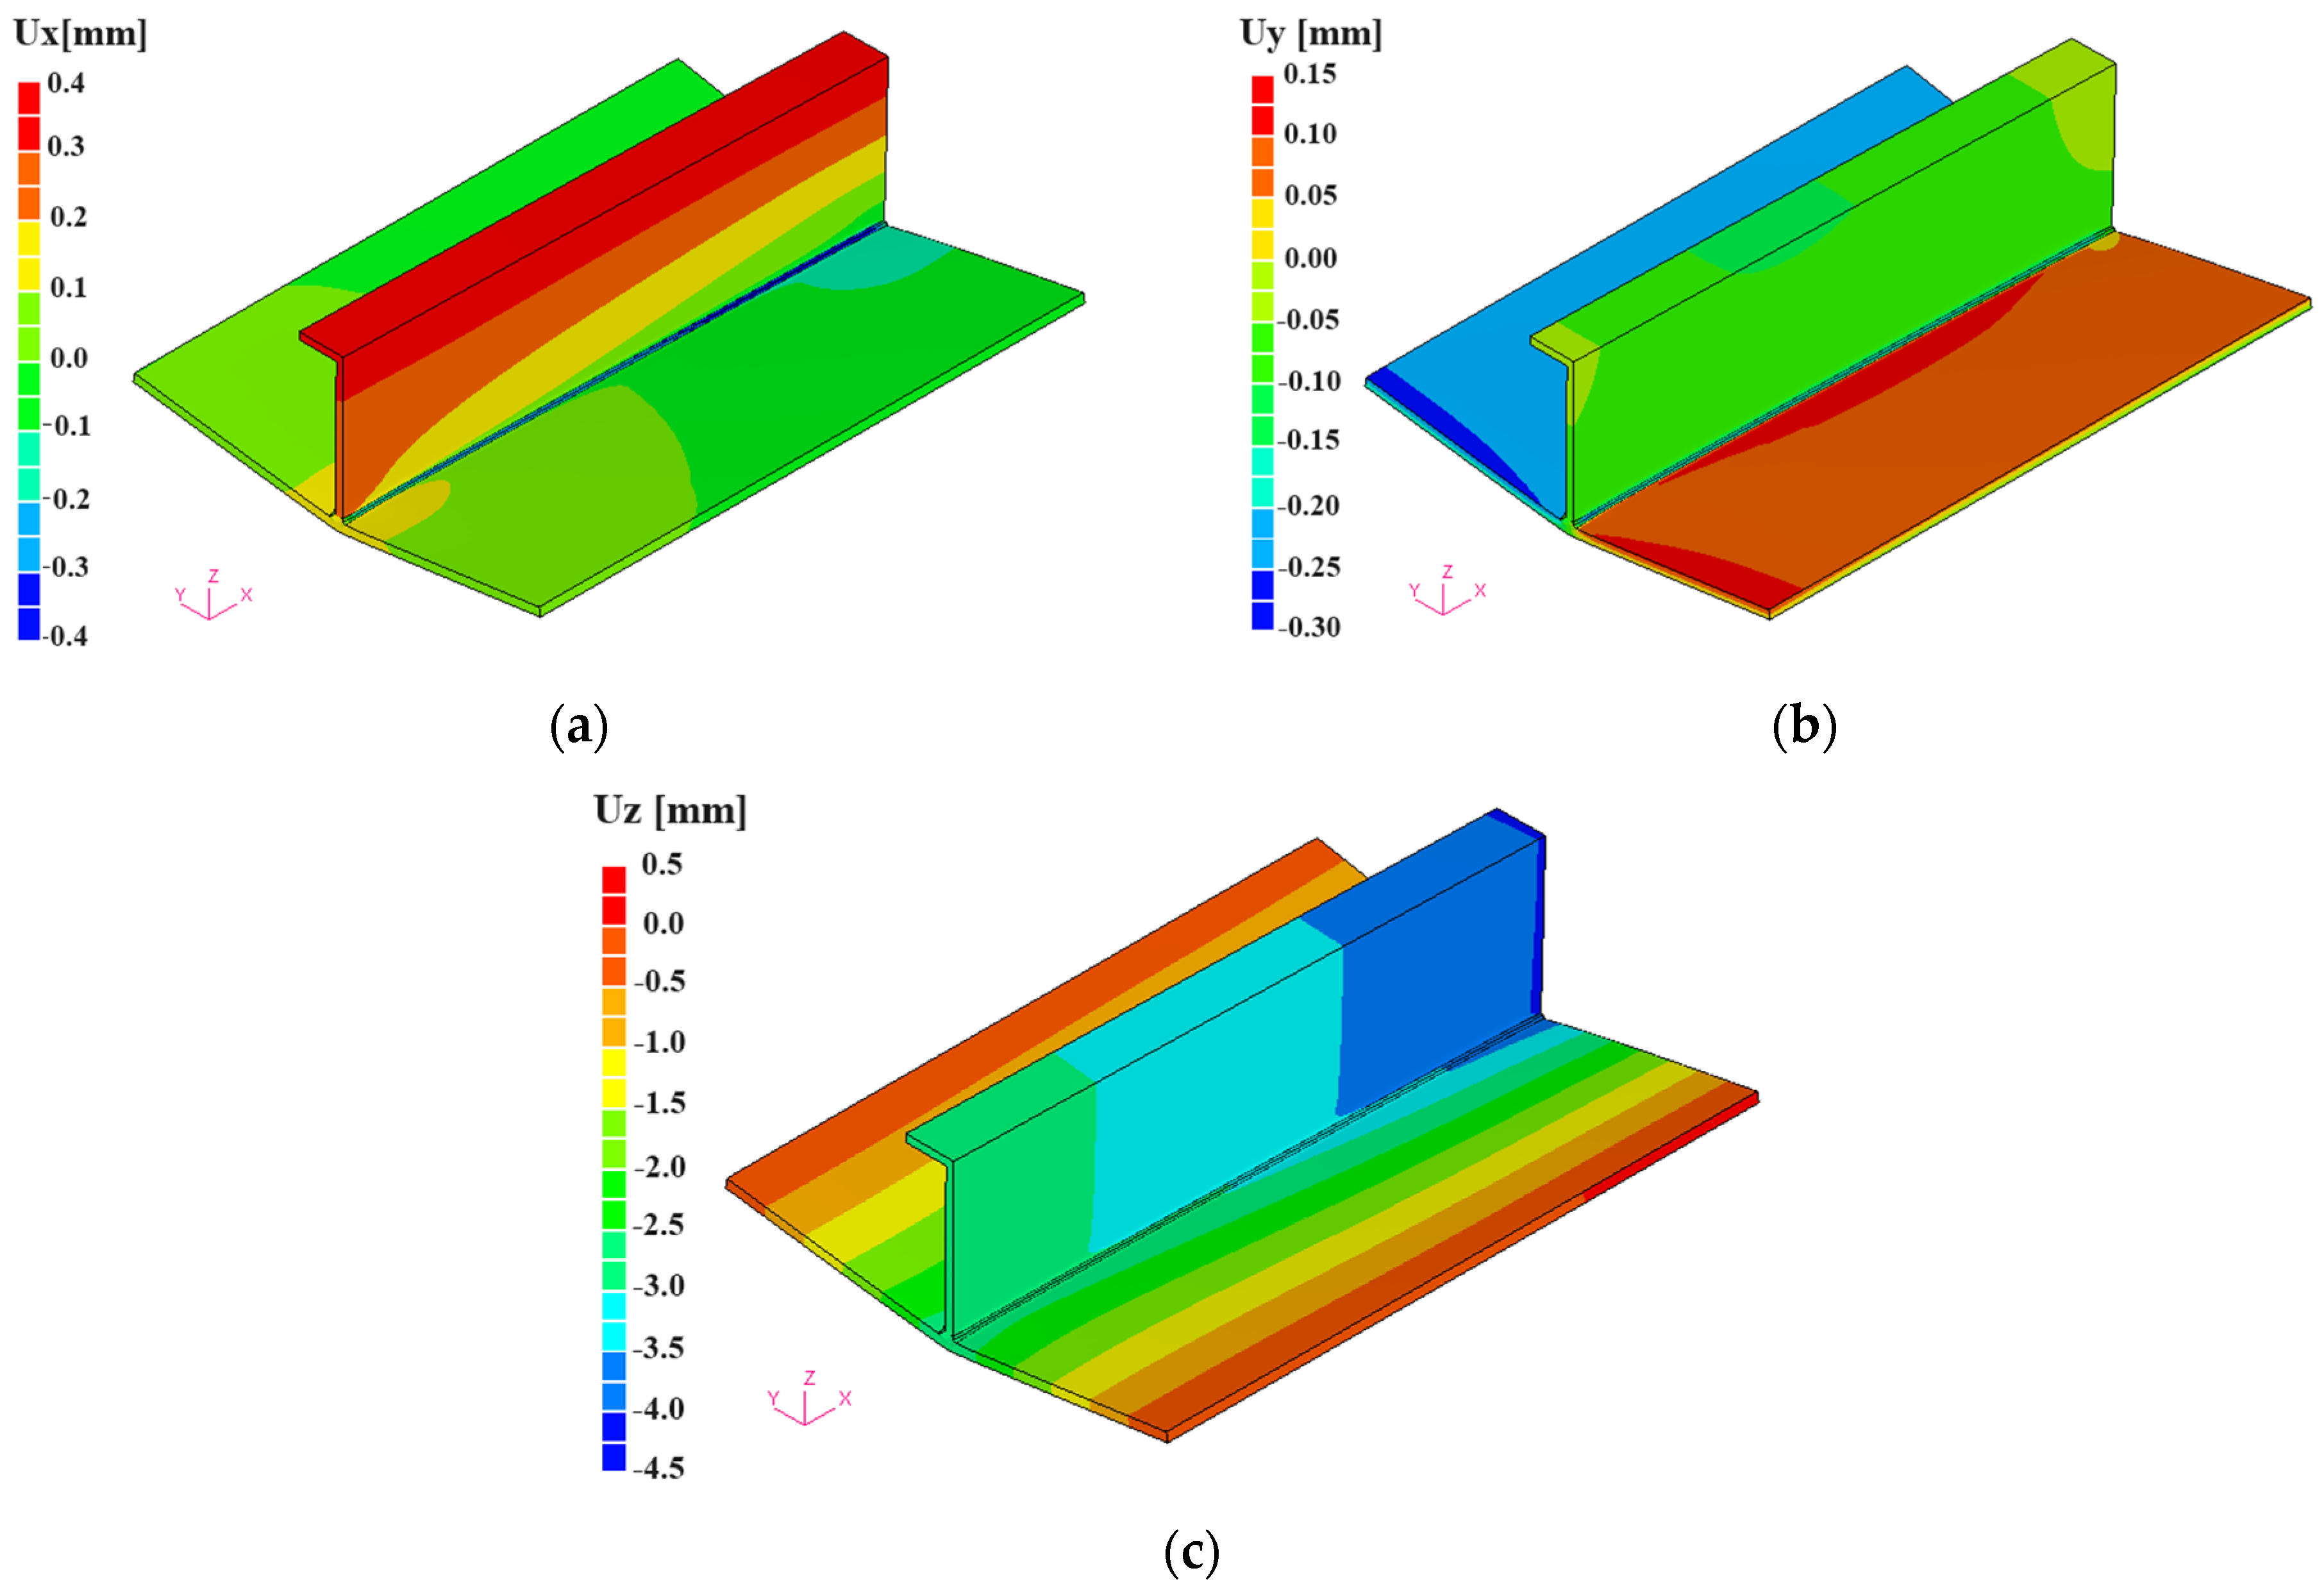
Figure 17.
Residual deflection along two lines: (a) Line A. (b) Line B.
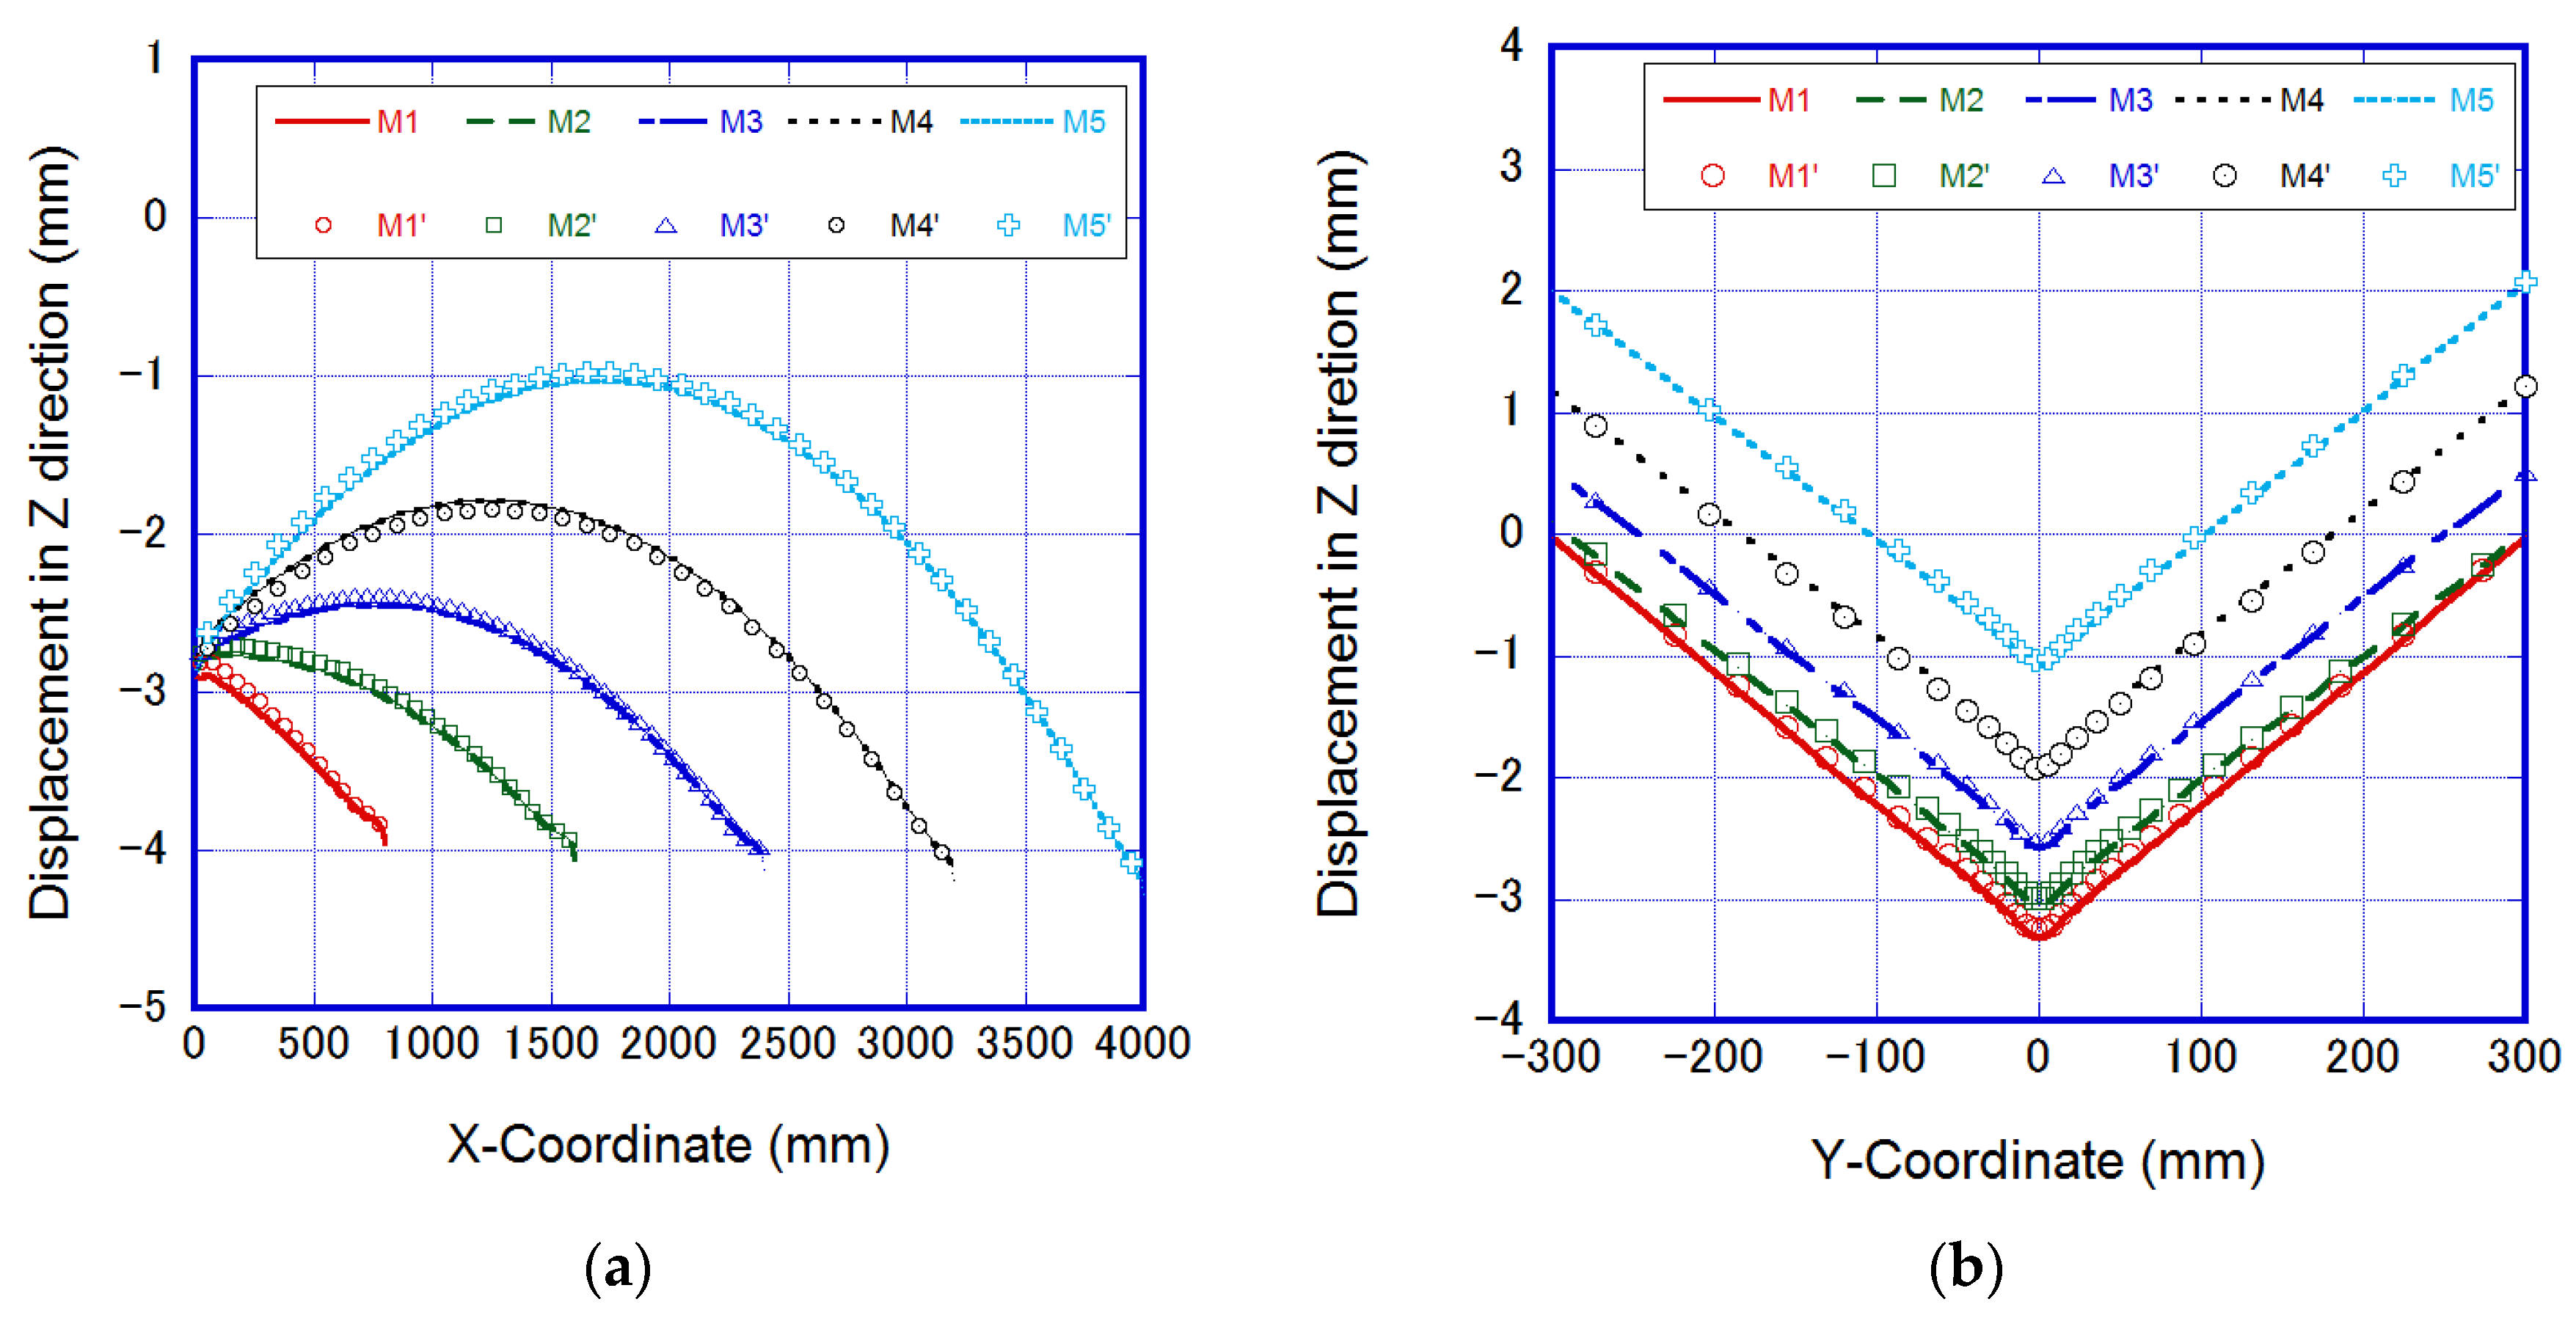
Figure 18.
Residual stress in the X direction along two lines: (a) Line A. (b) Line B.
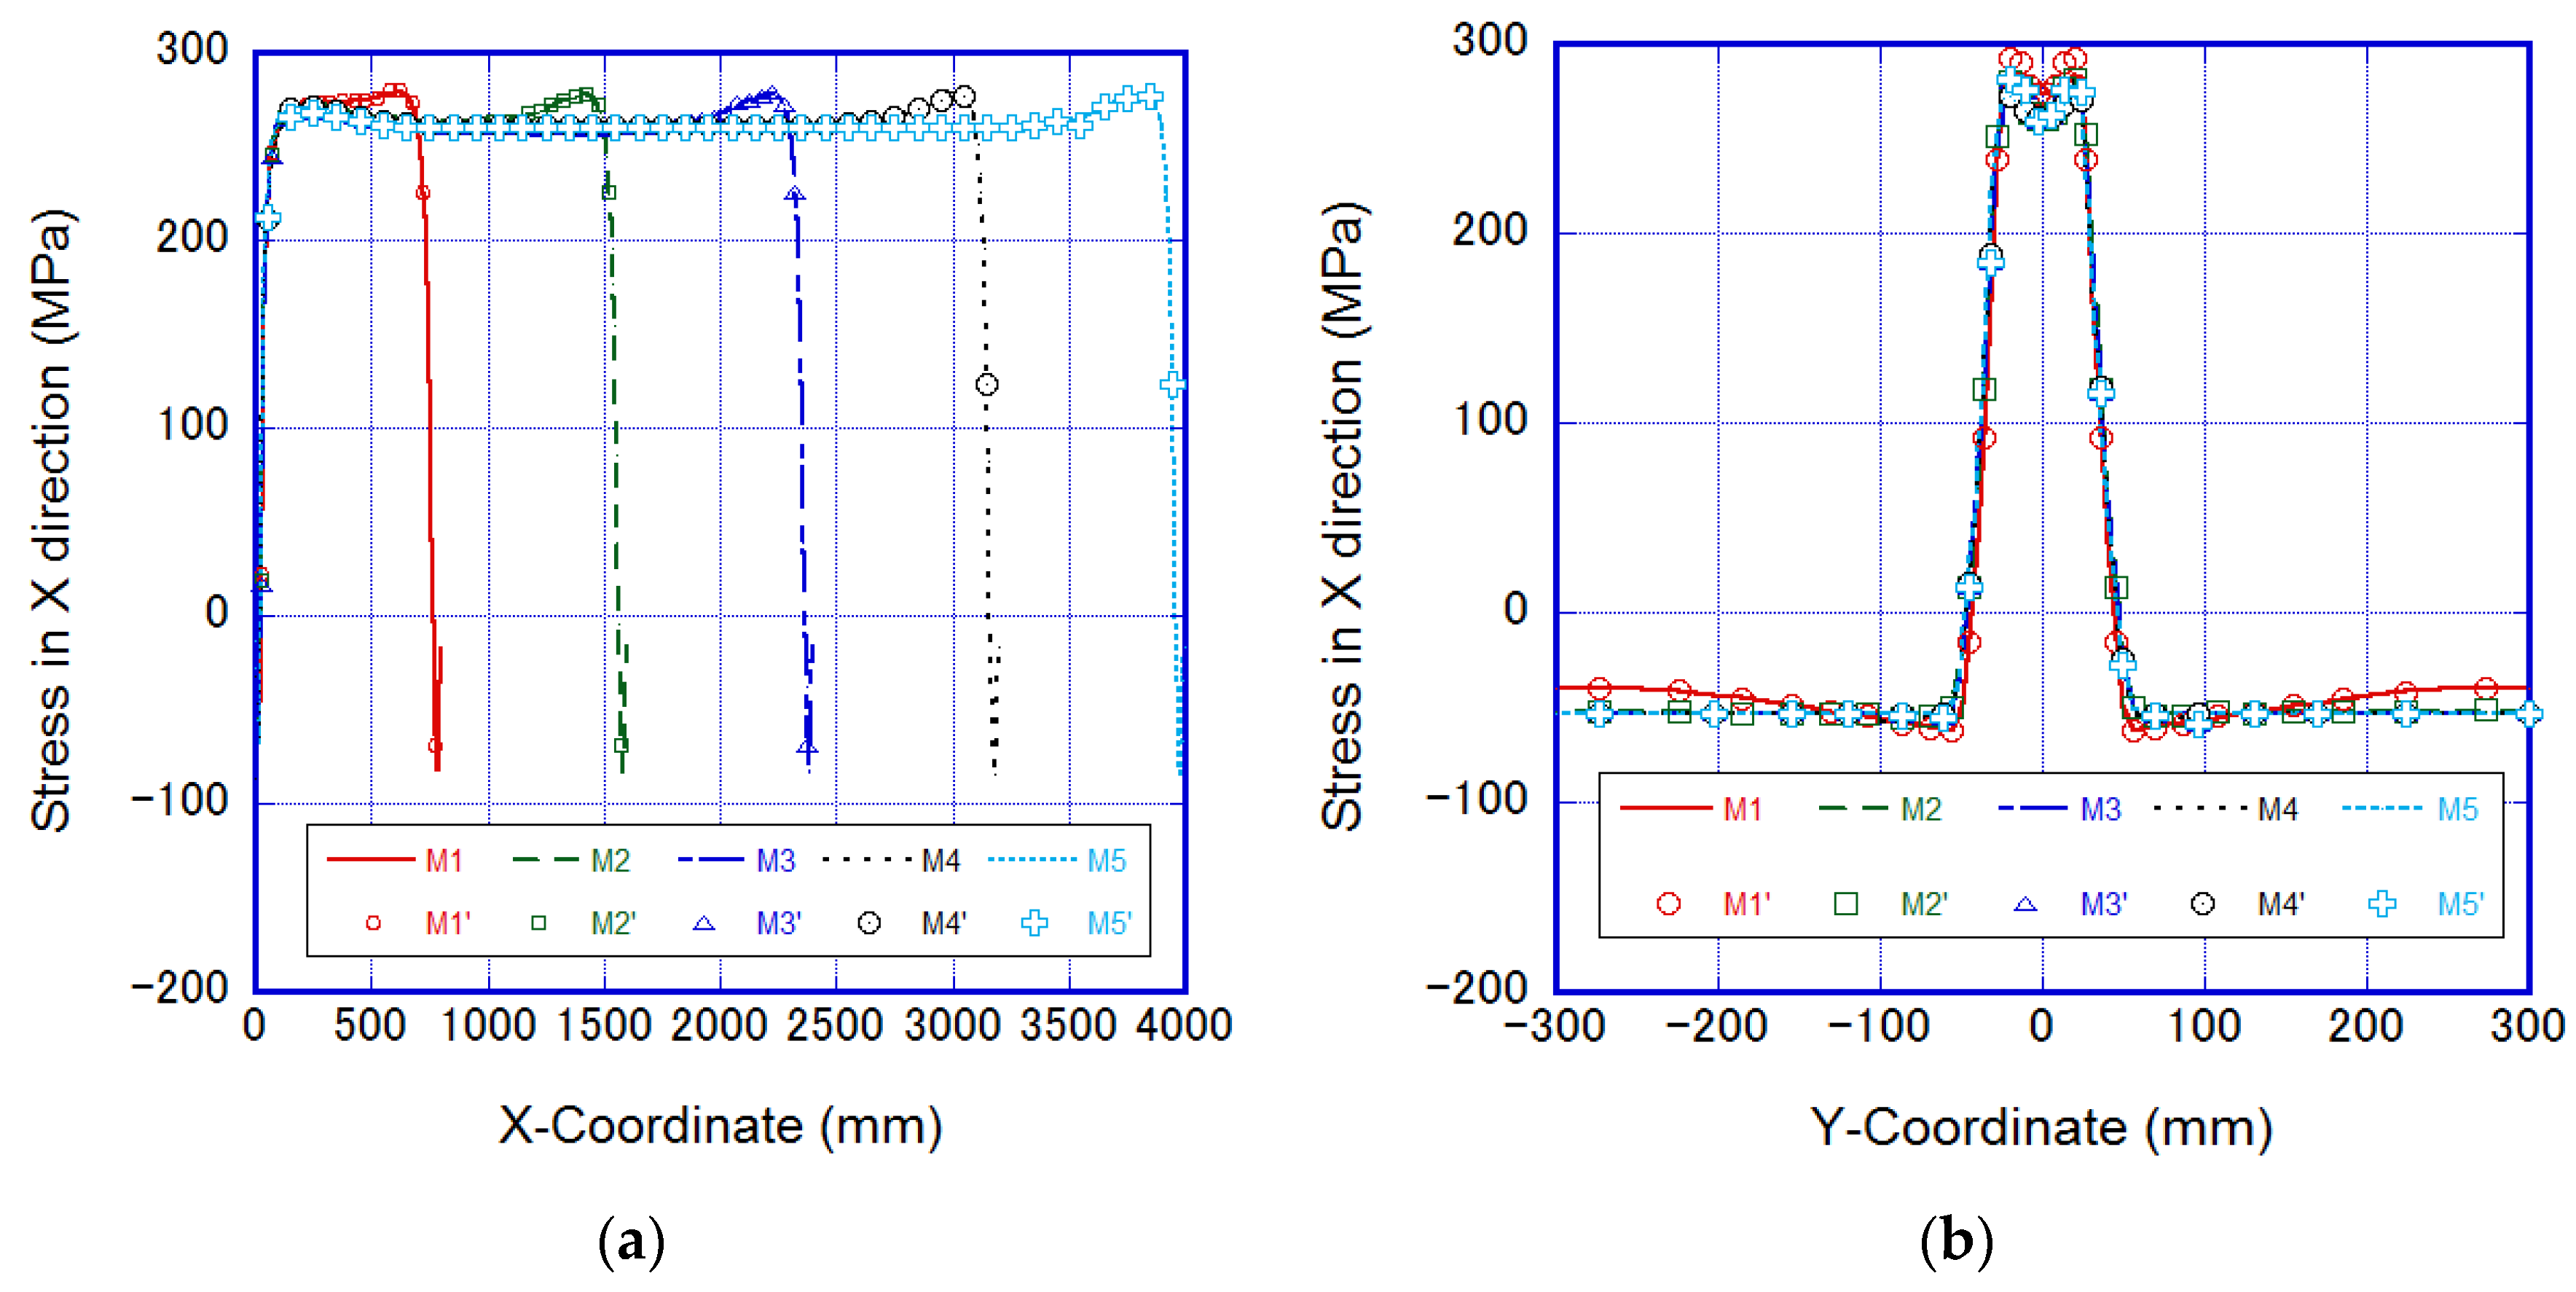
Figure 19.
Ratios of element number, physical memory, and CPU time between C-FEM and N-AMR.
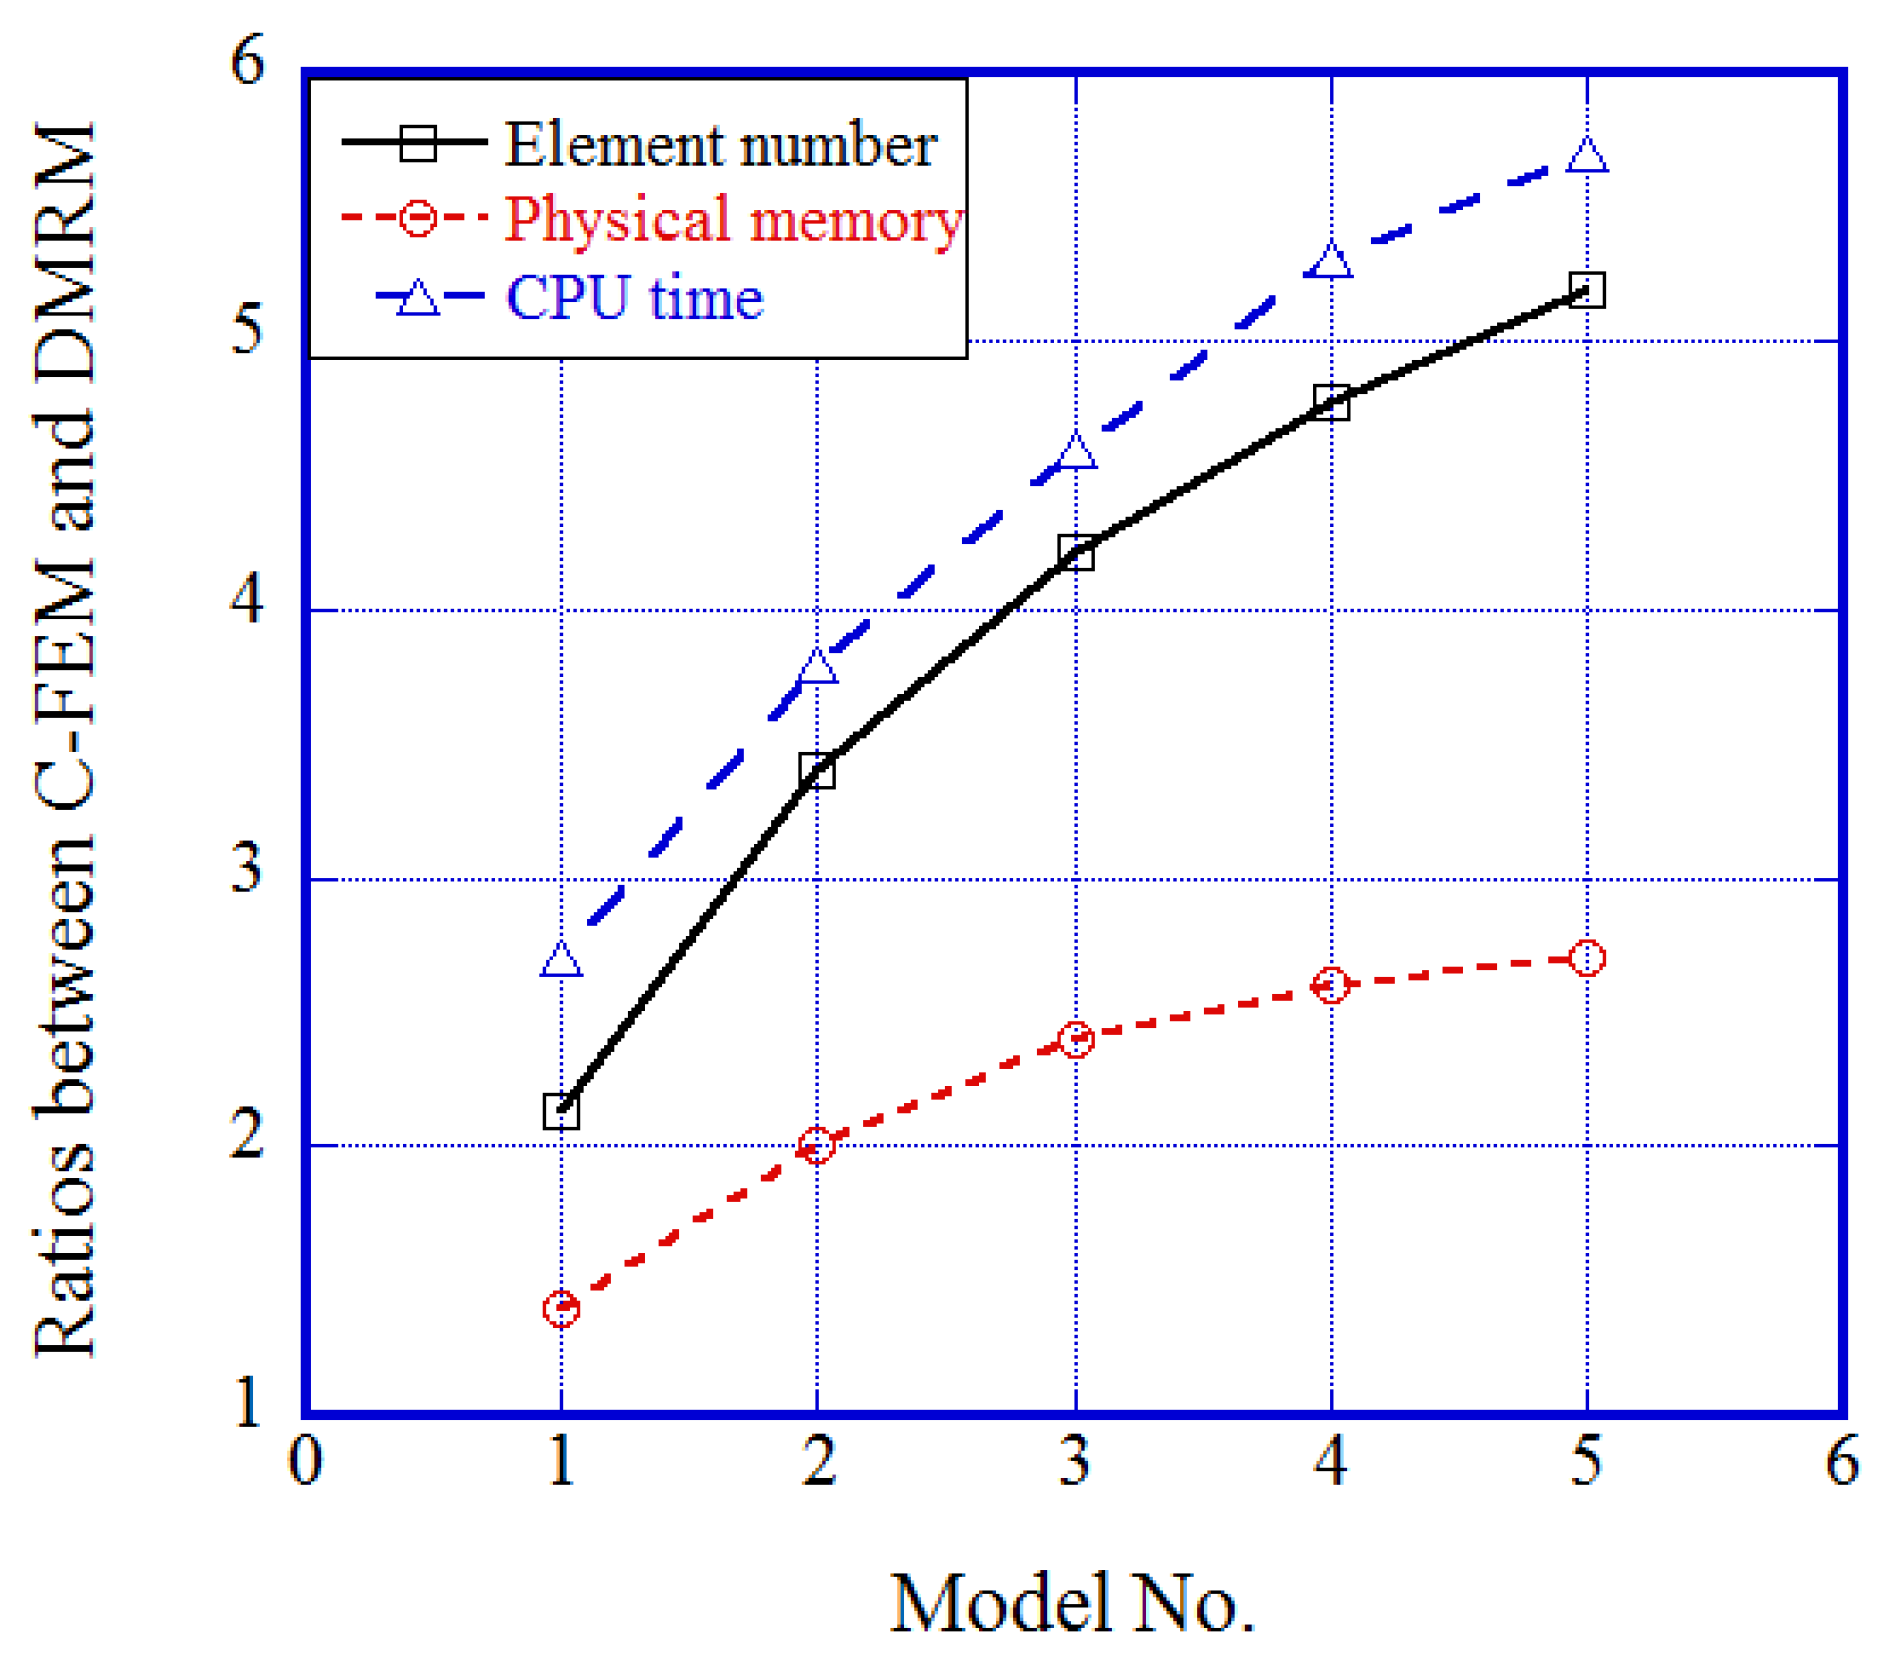
Figure 20.
Dimensions of stiffened panel structure [mm].
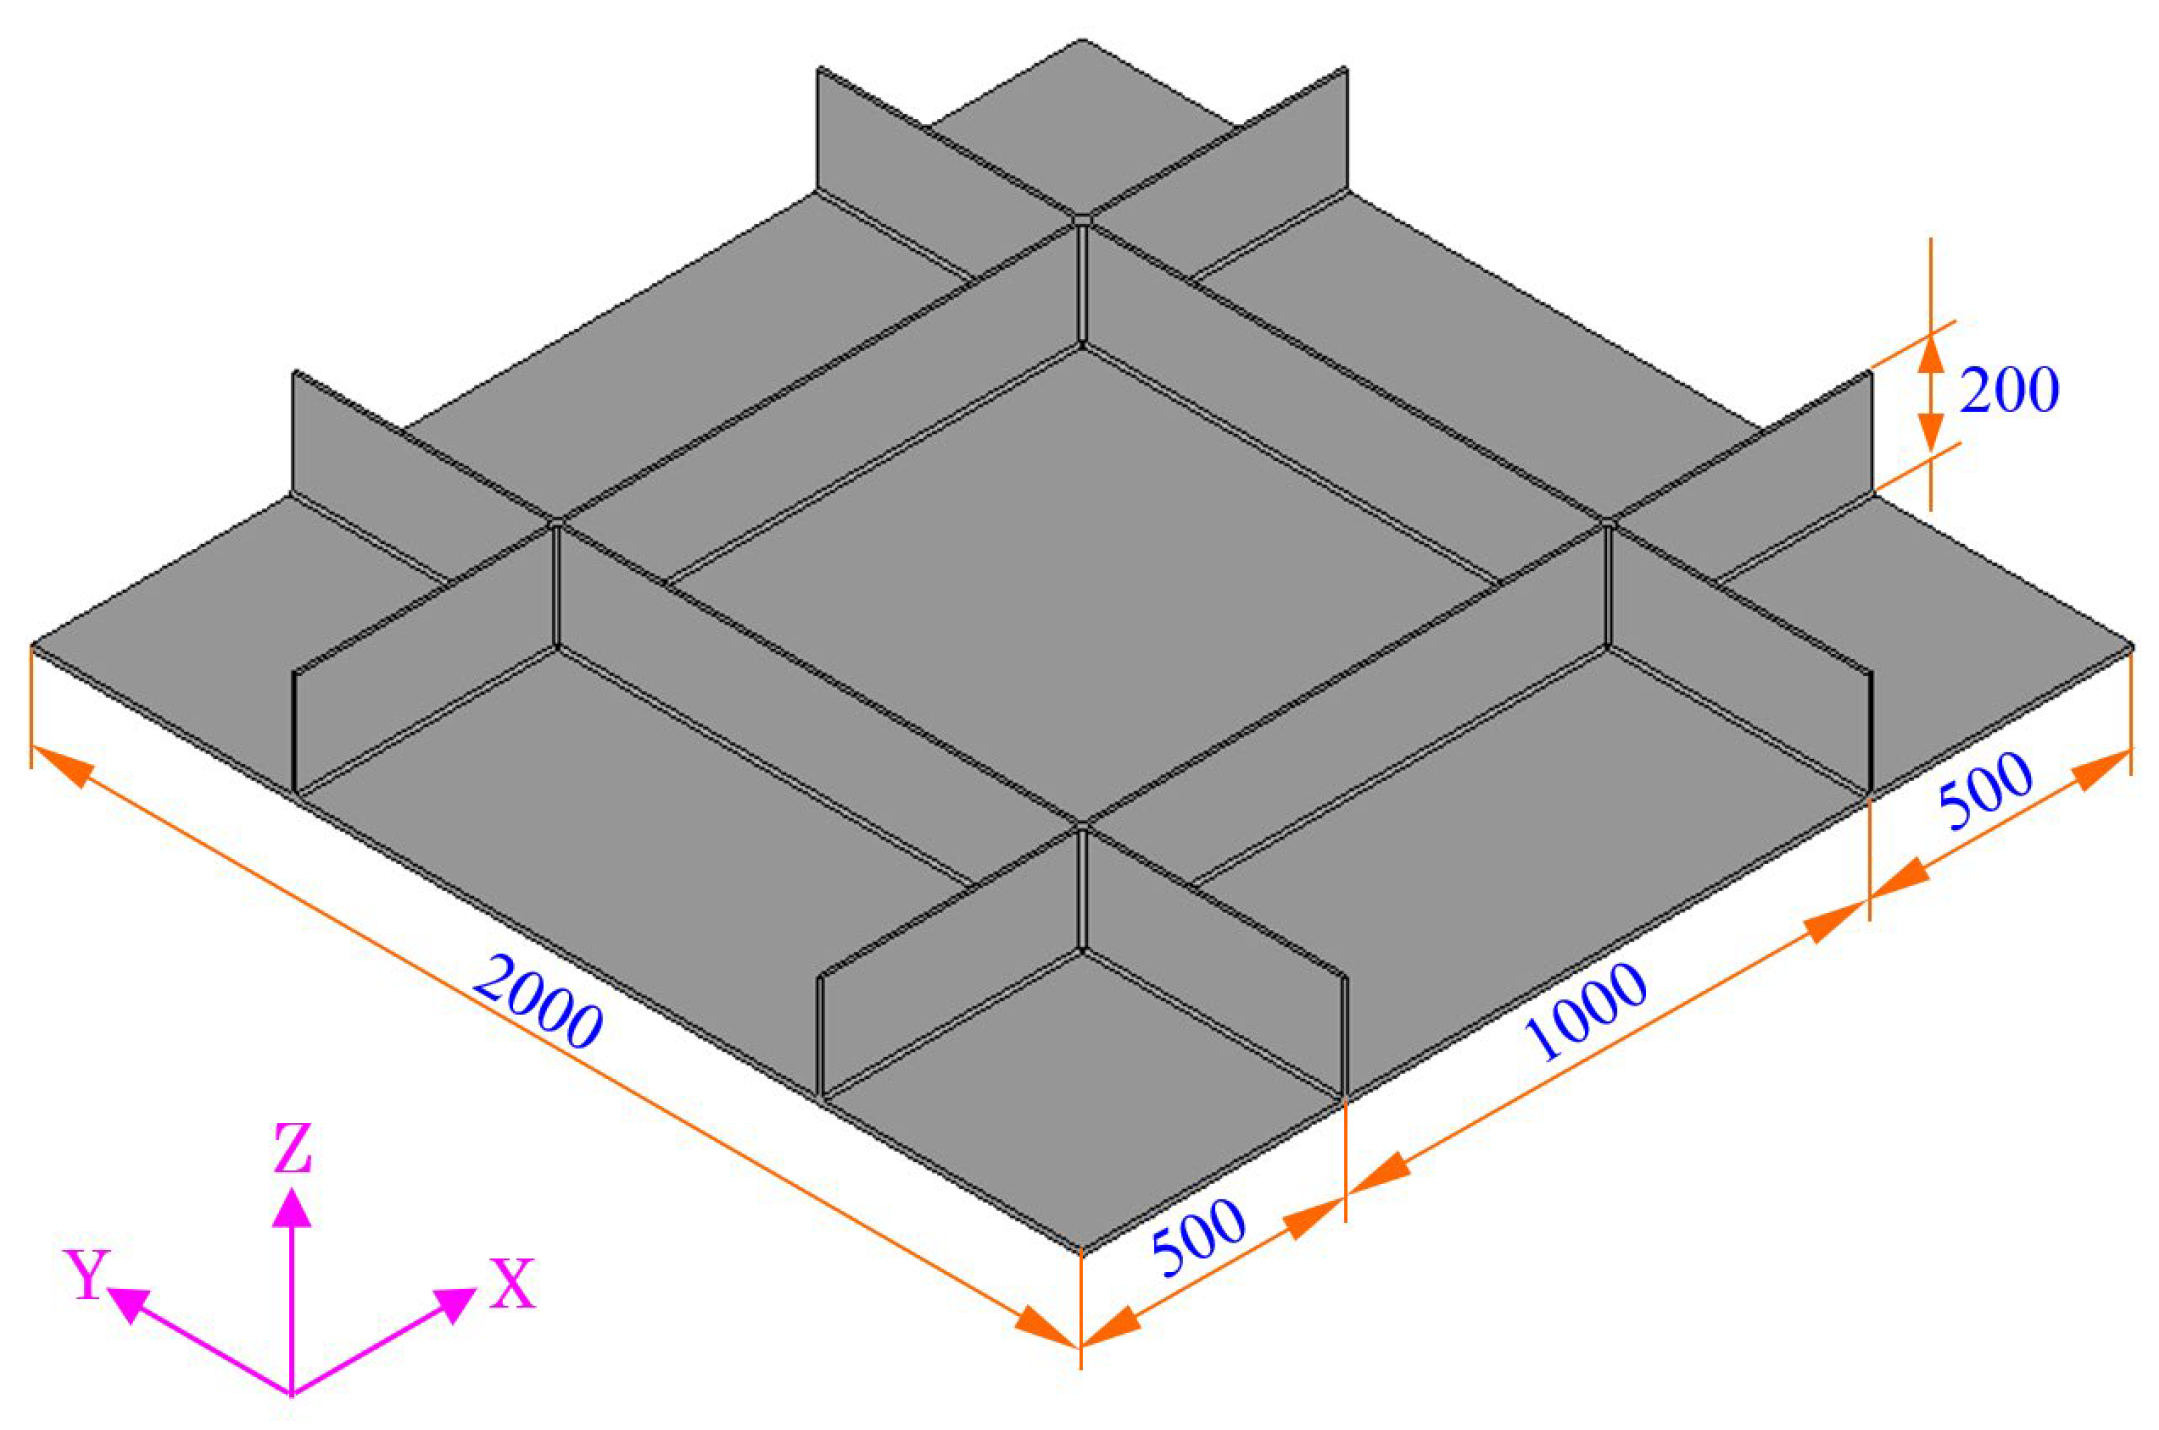
Figure 21.
Initial coarse mesh of stiffened plate structure (nodes: 87,003; elements: 58,544).
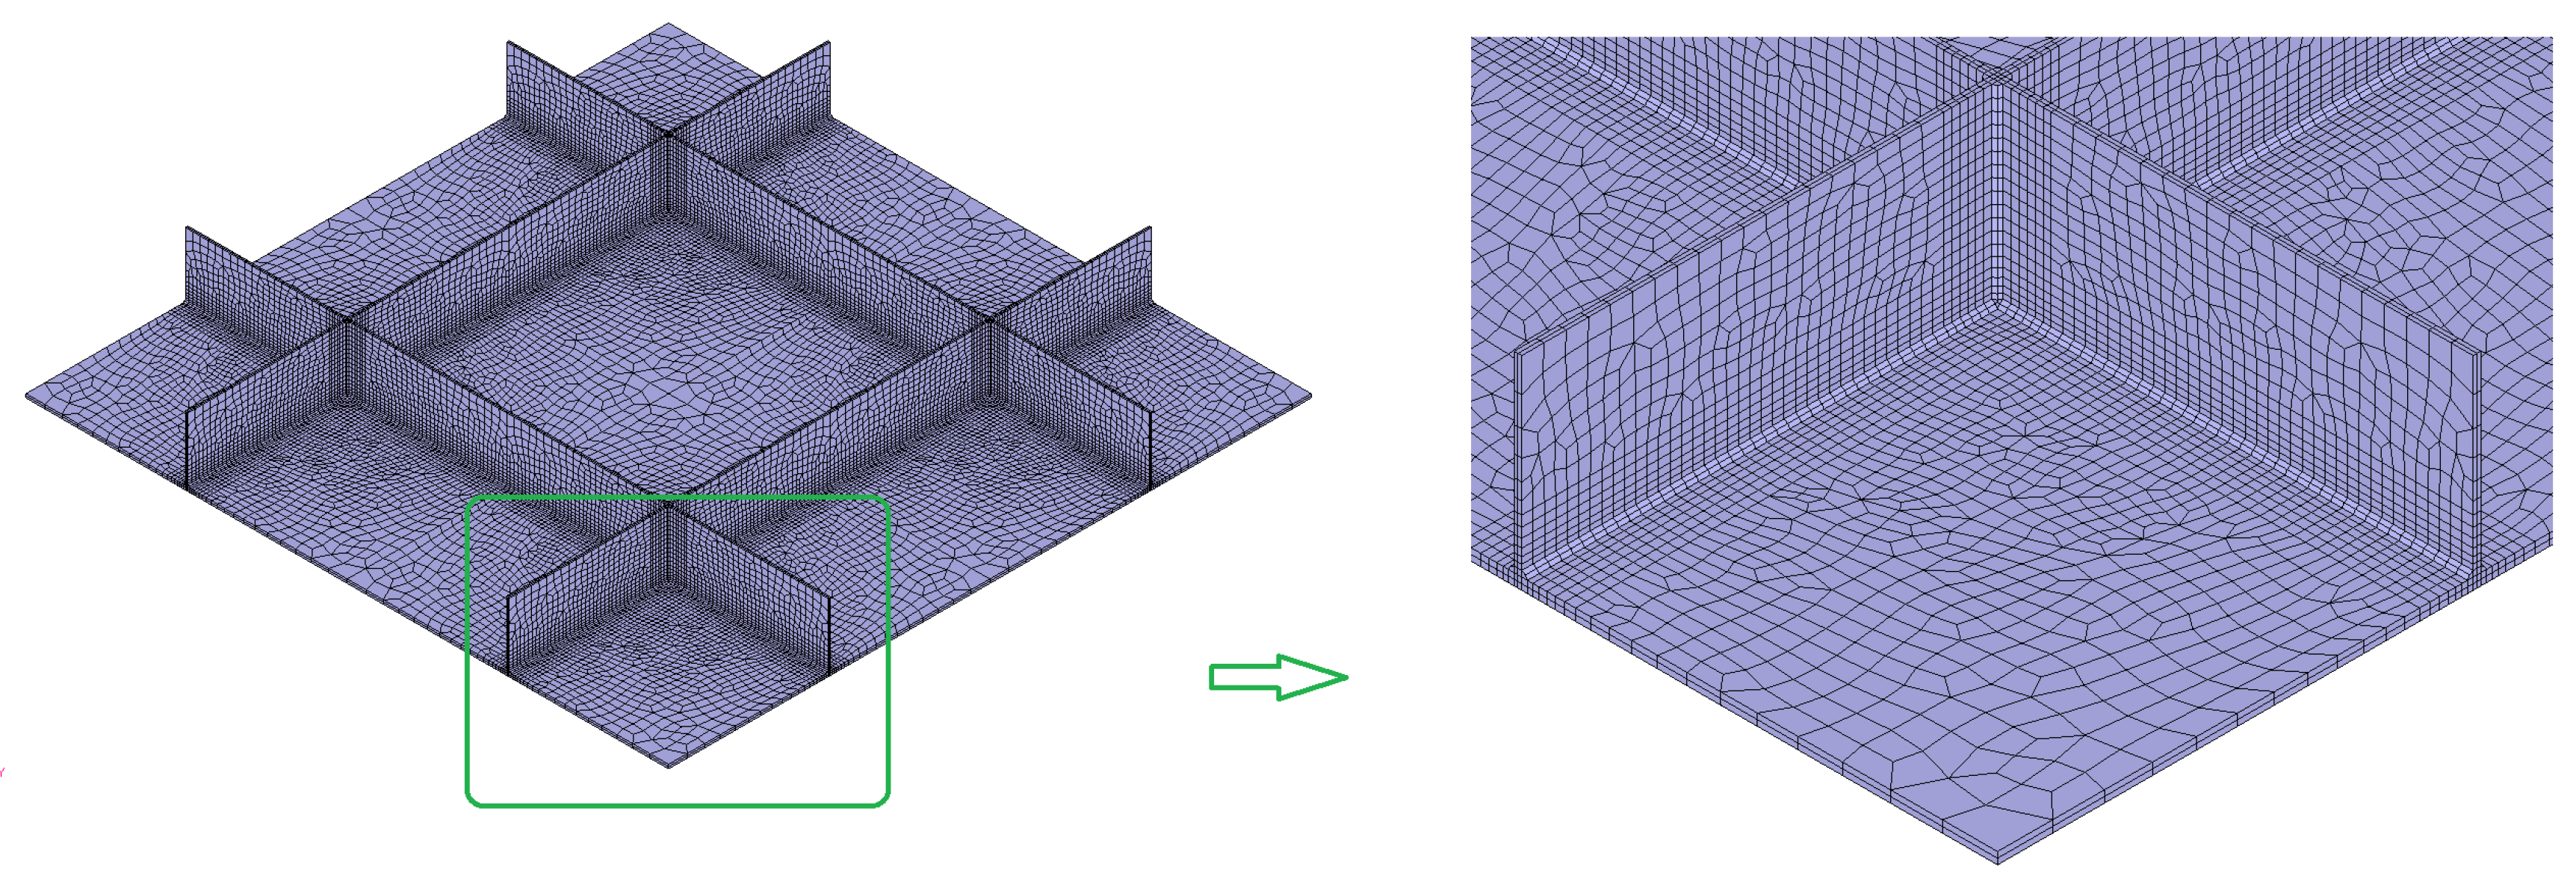
Figure 22.
Welding deformation in different directions: (a) X-direction, (b) Z-direction.
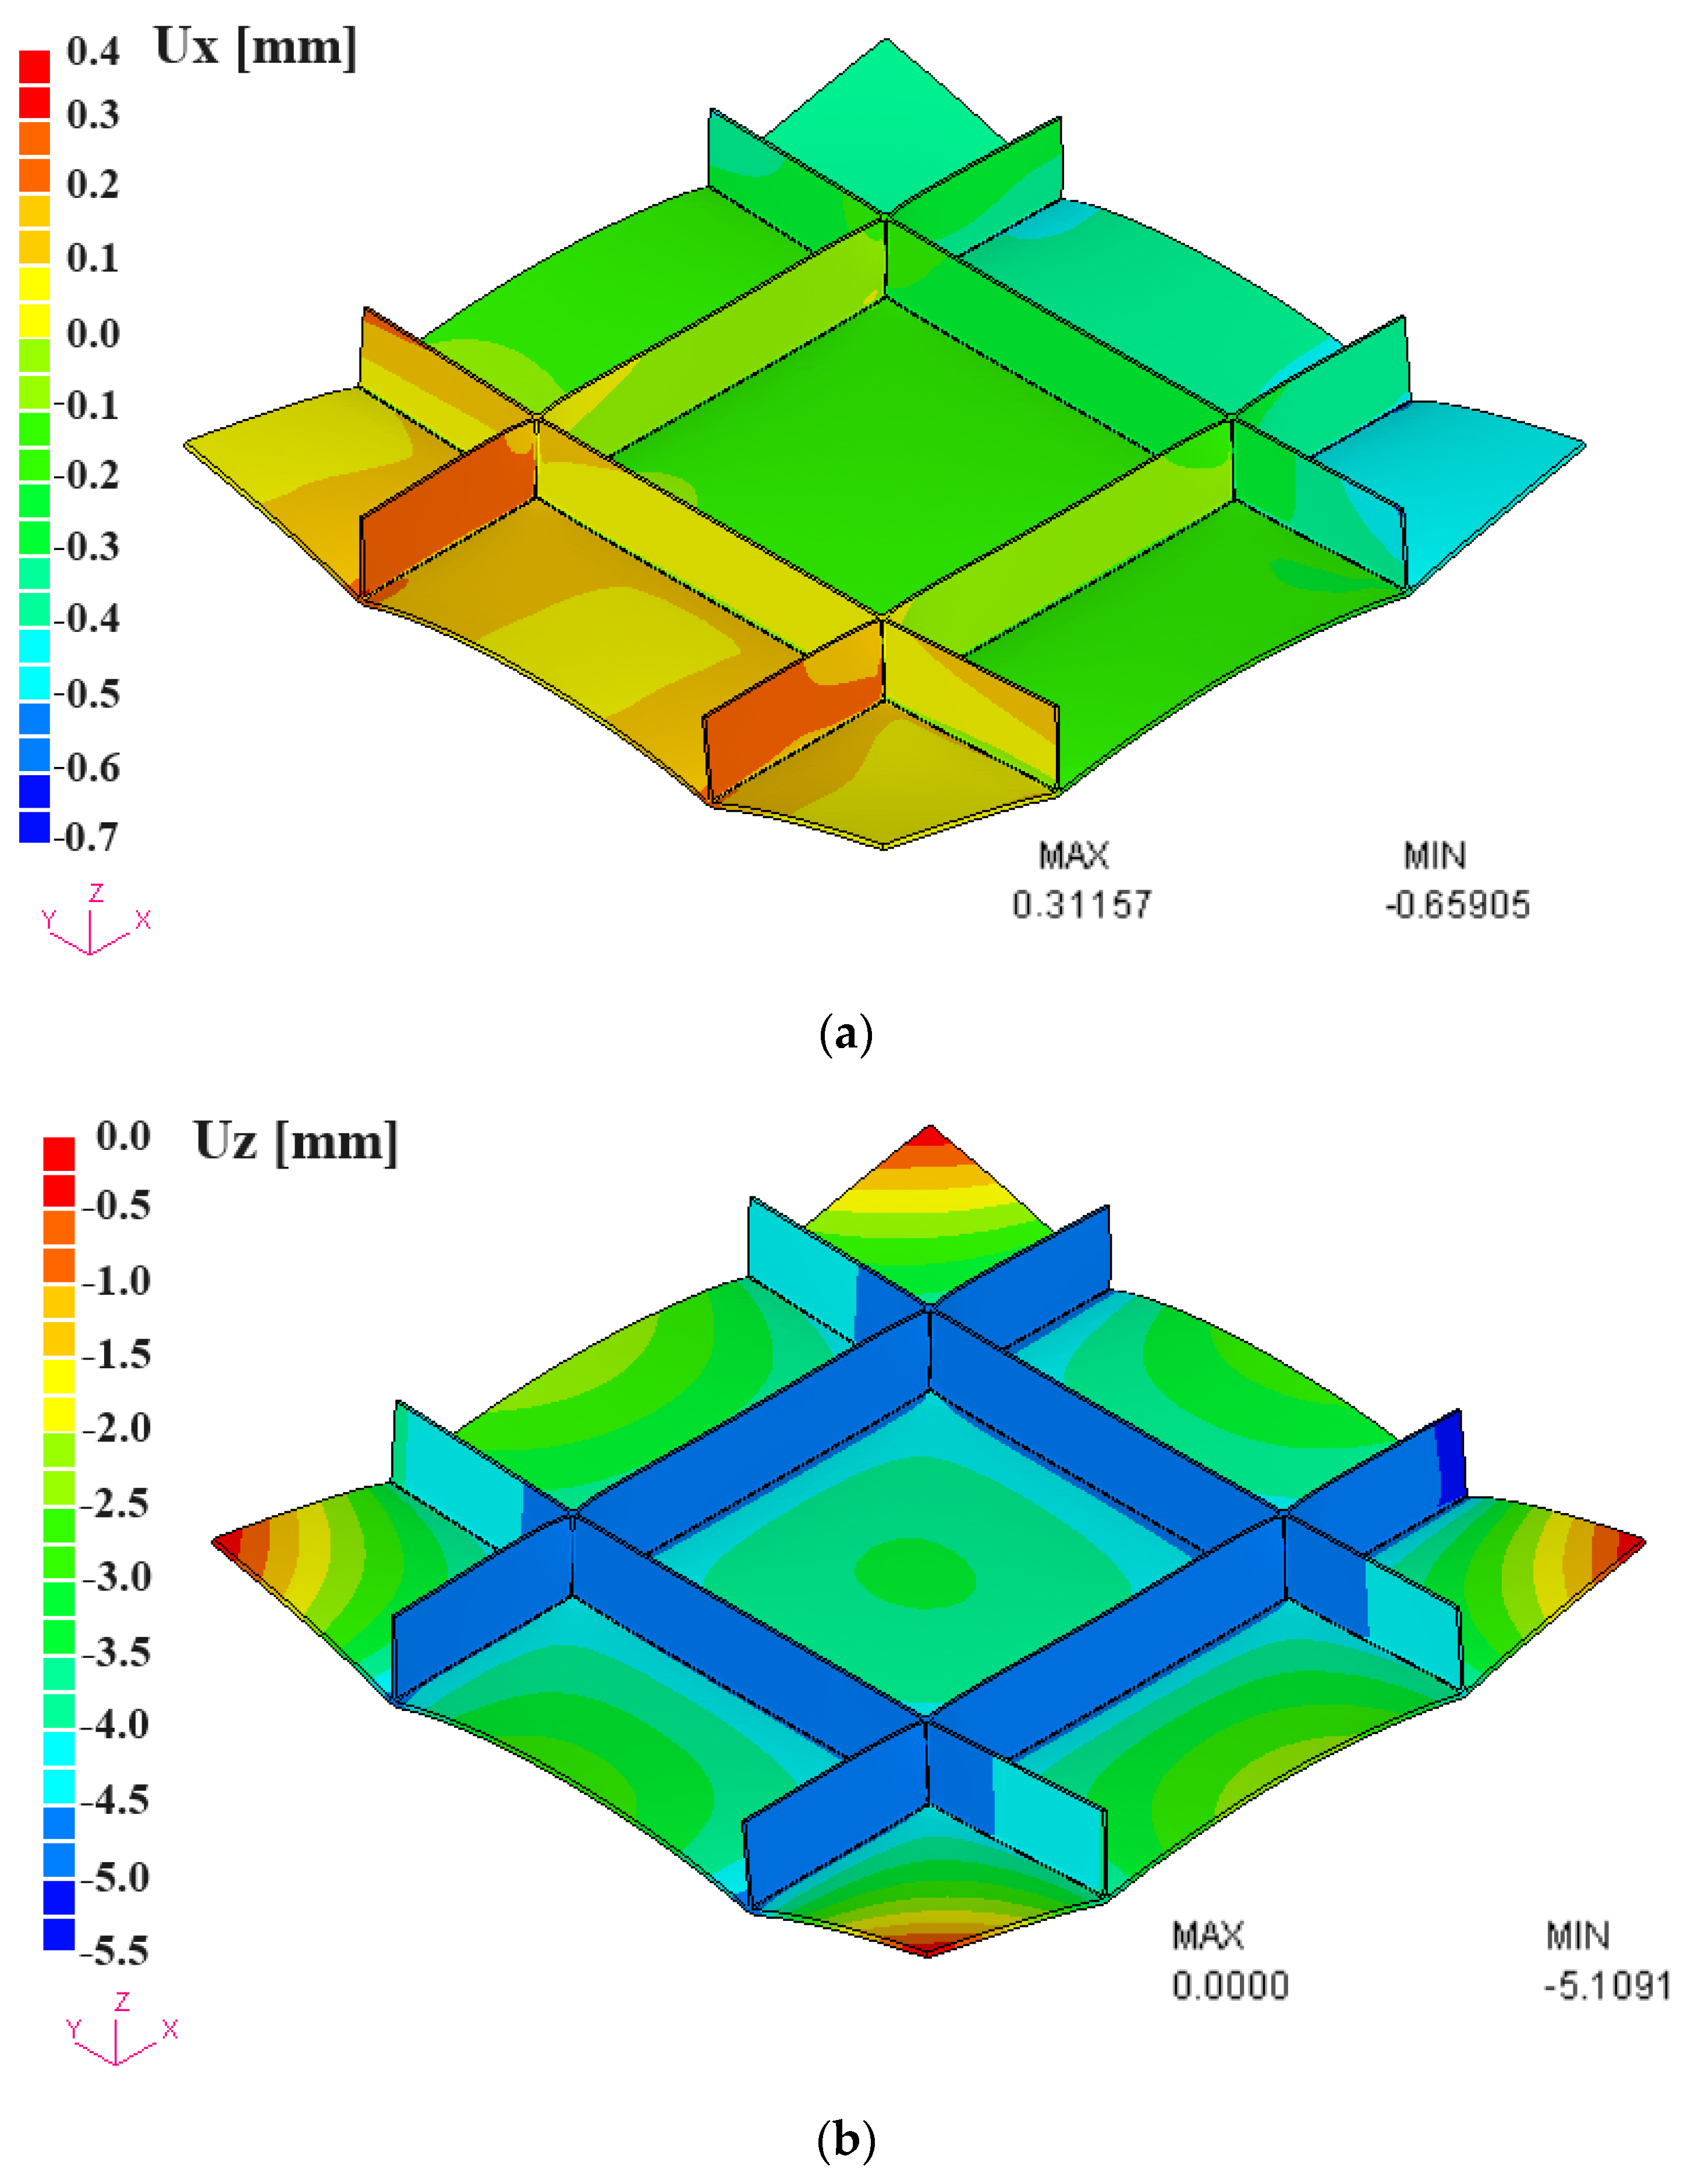
Figure 23.
Mises stress distribution after welding of the stiffened structure.

Table 1.
Welding condition of the basic fillet model.
| Flange Plate mm × mm × mm | Stiffener Plate mm × mm × mm | Fillet Size mm | Voltage (V) | Current (A) | Velocity (cm/min) |
|---|---|---|---|---|---|
| 800 × 600 × 12 | 800 × 210 × 10 | 6 | 26 | 150 | 30 |
Table 2.
Model dimension and mesh data.
| Model No. | M1 | M2 | M3 | M4 | M5 |
|---|---|---|---|---|---|
| Length (mm) | 800 | 1600 | 2400 | 3200 | 4000 |
| Nodes | 82,593 | 164,673 | 246,753 | 328,833 | 410,913 |
| Elements | 65,280 | 130,560 | 195,840 | 261,120 | 326,400 |
Table 3.
Computation information.
| Model No. | M1 | M2 | M3 | M4 | M5 | |
|---|---|---|---|---|---|---|
| C-FEM | Clock time (h) | 13.0 | 40.1 | 77.9 | 139.2 | 199.4 |
| Memory cost (GB) | 2.2 | 4.3 | 6.7 | 8.9 | 11.2 | |
| N-AMR | Clock time (h) | 4.8 | 10.6 | 17.1 | 26.2 | 35.3 |
| Memory cost (GB) | 1.6 | 2.1 | 2.8 | 3.4 | 4.2 | |
| C-FEM/N-AMR | Ratio of time | 2.7 | 3.8 | 4.6 | 5.3 | 5.7 |
| Ratio of memory | 1.4 | 2.0 | 2.4 | 2.6 | 2.7 |
Disclaimer/Publisher’s Note: The statements, opinions and data contained in all publications are solely those of the individual author(s) and contributor(s) and not of MDPI and/or the editor(s). MDPI and/or the editor(s) disclaim responsibility for any injury to people or property resulting from any ideas, methods, instructions or products referred to in the content. |
© 2023 by the authors. Licensee MDPI, Basel, Switzerland. This article is an open access article distributed under the terms and conditions of the Creative Commons Attribution (CC BY) license (https://creativecommons.org/licenses/by/4.0/).
Share and Cite
MDPI and ACS Style
Huang, H.; Murakawa, H. A Selective Integration-Based Adaptive Mesh Refinement Approach for Accurate and Efficient Welding Process Simulation. J. Manuf. Mater. Process. 2023, 7, 206. https://doi.org/10.3390/jmmp7060206
AMA Style
Huang H, Murakawa H. A Selective Integration-Based Adaptive Mesh Refinement Approach for Accurate and Efficient Welding Process Simulation. Journal of Manufacturing and Materials Processing. 2023; 7(6):206. https://doi.org/10.3390/jmmp7060206
Chicago/Turabian StyleHuang, Hui, and Hidekazu Murakawa. 2023. "A Selective Integration-Based Adaptive Mesh Refinement Approach for Accurate and Efficient Welding Process Simulation" Journal of Manufacturing and Materials Processing 7, no. 6: 206. https://doi.org/10.3390/jmmp7060206