Article

Accelerated In Situ Inspection of Release Coating and Tool Surface Condition in Composites Manufacturing Using Global Mapping, Sparse Sensing, and Machine Learning

1
Materials Science & Engineering Department, University of Washington, Seattle, WA 98195, USA
2
Applied Mathematics Department, University of Washington, Seattle, WA 98195, USA
*
Author to whom correspondence should be addressed.
J. Manuf. Mater. Process. 2023, 7(3), 81; https://doi.org/10.3390/jmmp7030081
Submission received: 5 April 2023 / Revised: 22 April 2023 / Accepted: 22 April 2023 / Published: 24 April 2023

Abstract

:
The interfacial adhesion, friction, and resulting tool-part interaction during composites manufacturing contribute to the formation of residual stresses and process-induced deformations (PIDs). Tool-part interaction and PIDs are highly sensitive to processing variabilities, one of which is the aging of the release coating and the surface condition of production tools. Unfortunately, due to a lack of available tool inspection methods, manufacturers often attempt to mitigate the aging of release coating based on know-how, leading to cost-deficient tool preparation schedules, lower end-part quality, and in some cases, higher levels of PIDs. This paper presents an in-situ inspection method to evaluate the physicochemical properties of release coating and the surface condition of large production tools by utilizing global mapping, sparse sensing, and machine learning (ML). ML methods are used in conjunction with multiple automated measurement techniques to quickly identify the condition of release coating or contamination on production tool surfaces in manufacturing environments. Results in this paper demonstrate that during autoclave processing, aerospace-grade release coatings undergo significant chemical changes, but may remain highly abhesive for more than twenty autoclave processing cycles. Using the proposed novel inspection technology, dry ice blasting (DIB) is also demonstrated to be an effective method for non-abrasively removing cured resin contamination and release coating from a tool surface. Overall, this paper demonstrates how the proposed inspection method can be integrated into a manufacturing process for automatic surface inspection of large tools to improve production efficiency and potentially mitigate PIDs in composites manufacturing.

1. Introduction

For decades, fiber-reinforced polymer composites have served as transformative materials in many industries, including aerospace, due to their exceptionally high specific strengths and stiffnesses. However, despite significant advances in composites manufacturing technologies and processing capabilities, a multitude of production challenges remain outstanding. One such challenge is mitigating the formation of residual stresses and consequent process-induced deformations (PIDs) in composites [1,2,3,4,5,6]. During processing, a mismatch of free strains (i.e., thermal-induced and cure-induced strains) between the reinforcing fibers and polymer matrix, separate layers within a laminated composite, and the tool and part, lead to the formation of residual stresses and PIDs [1]. In addition, the interfacial physicochemical bonding (i.e., adhesion) and/or friction between a tool and composite part during processing (i.e., tool-part interaction) also significantly contribute to residual stress formations [7,8,9,10,11,12,13]. Typically, production tools (i.e., molds) are intermittently treated with release coatings to reduce the tool-part interaction and resulting residual stresses and PIDs. Release coatings also facilitate the demolding of cured parts after processing [14,15].
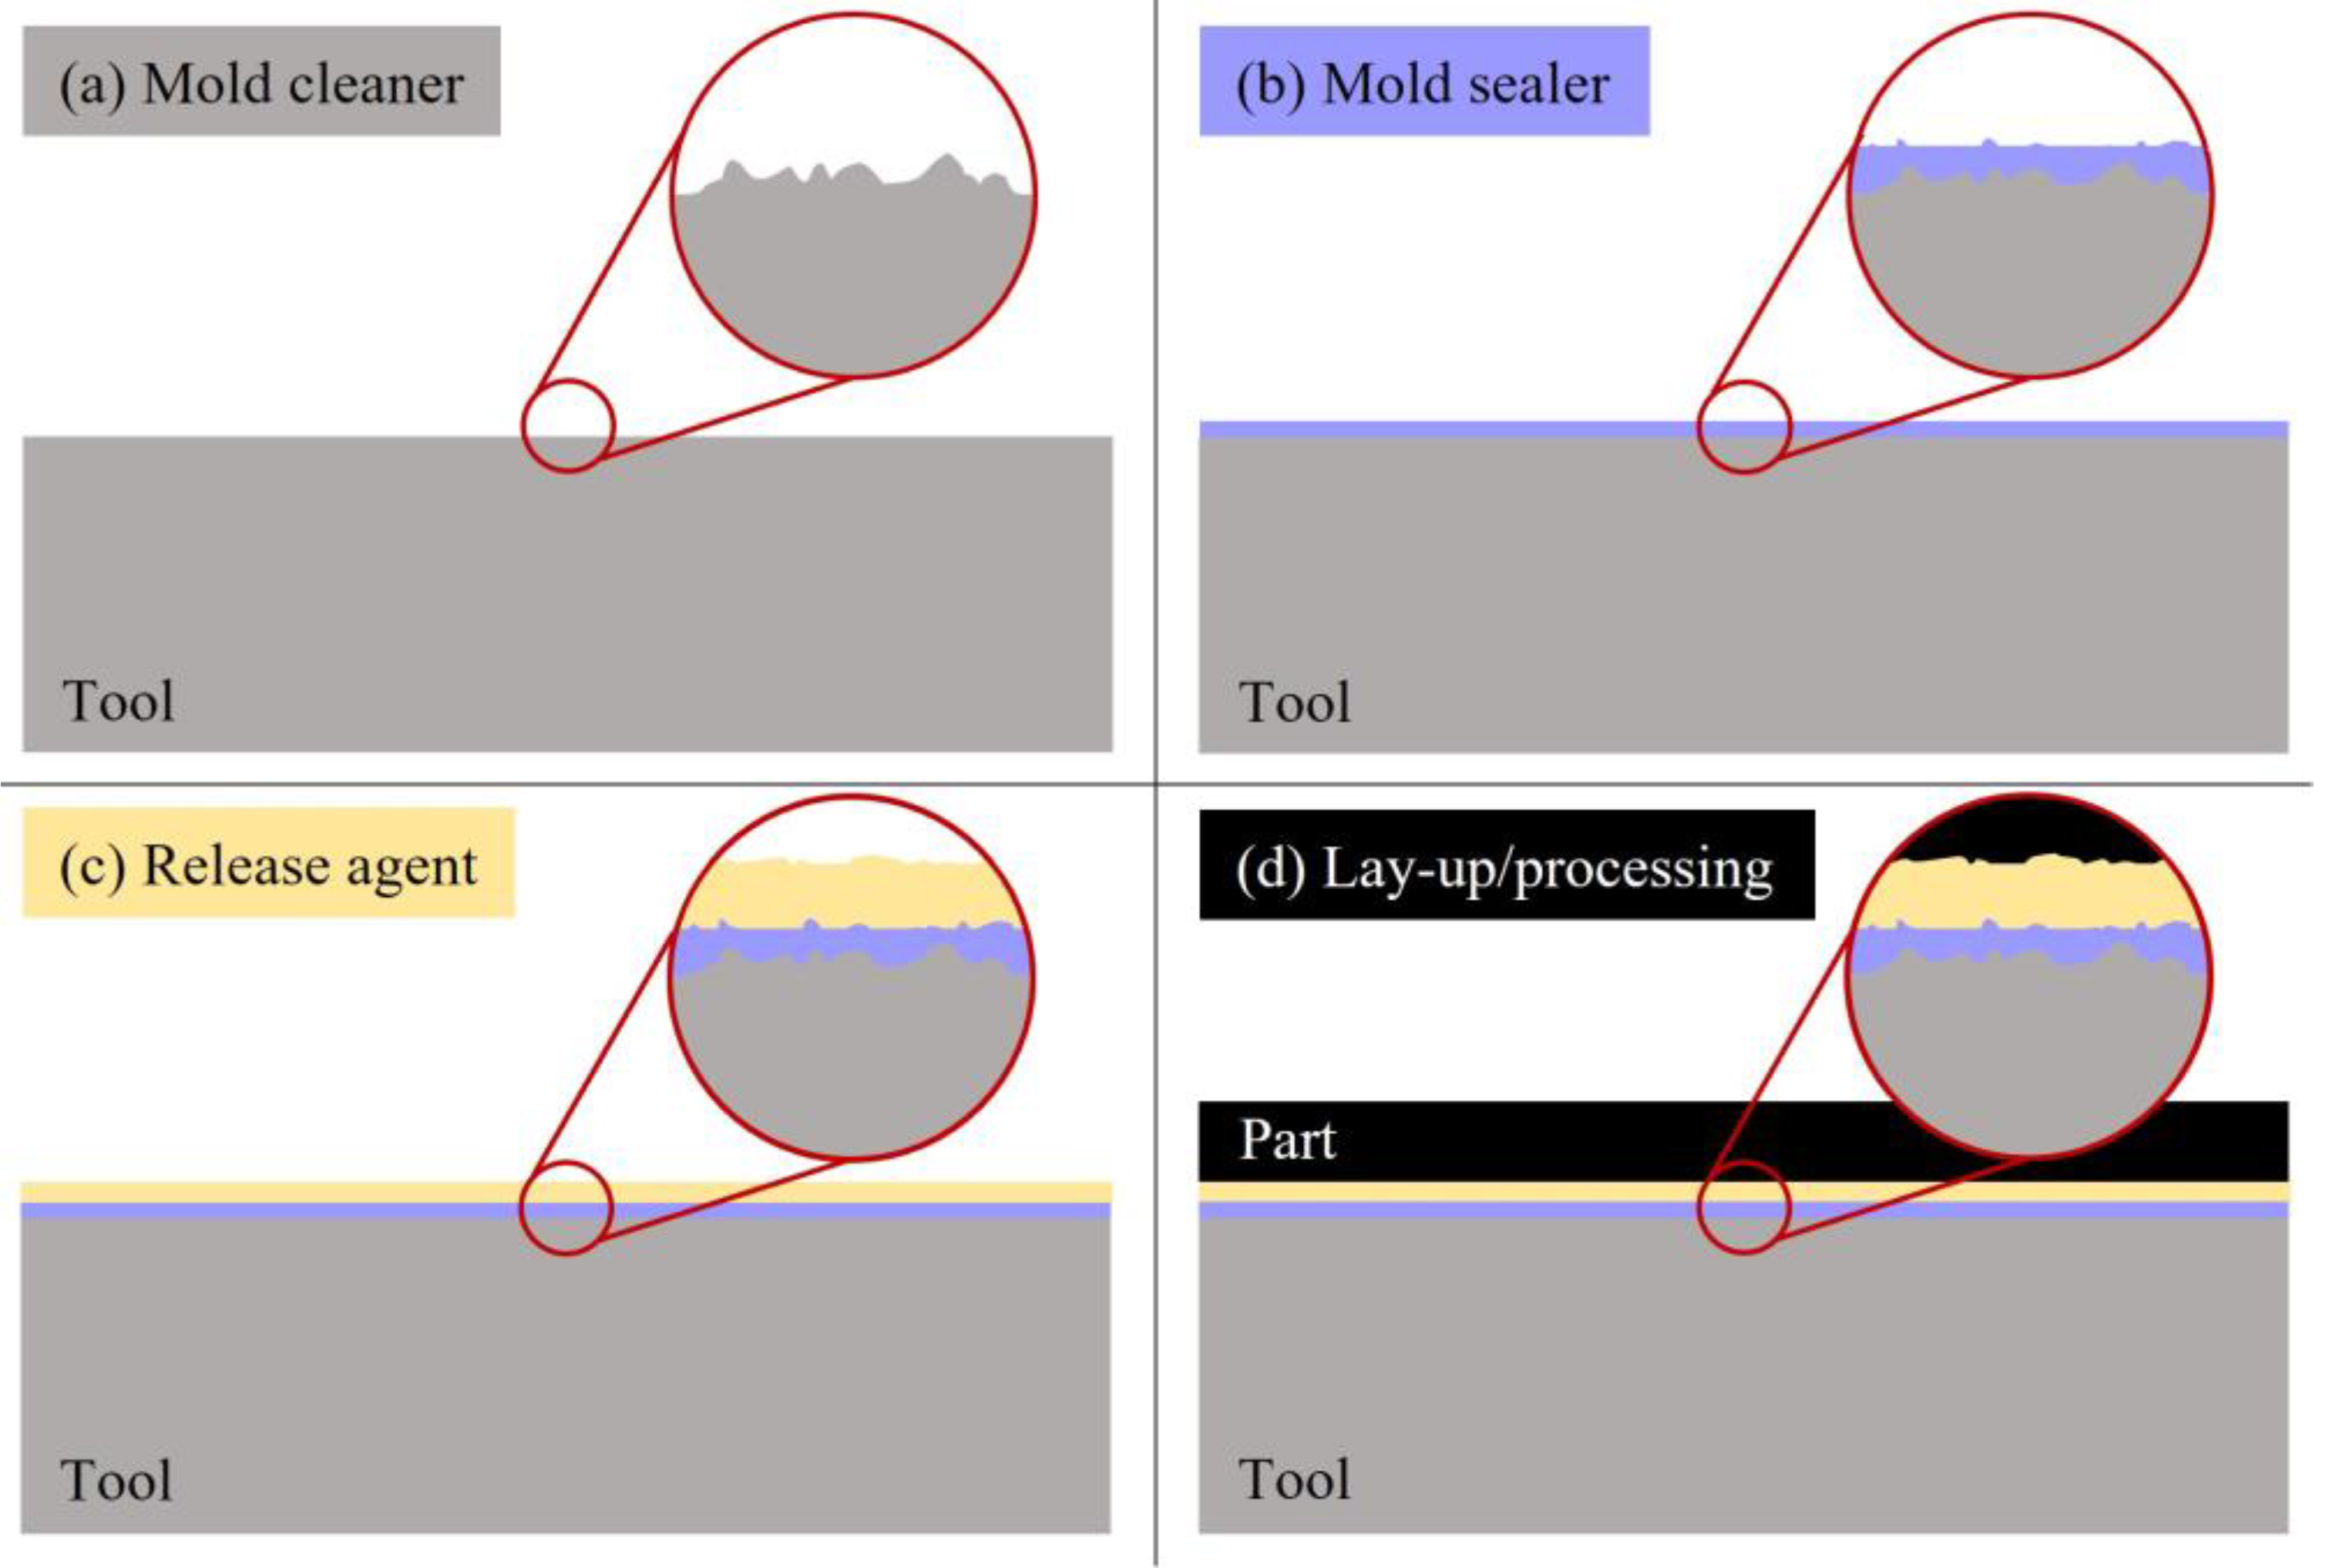
Aerospace manufacturers typically use a three-step process to prepare tool surfaces with release coatings. First, the tool is treated with solvent-based mold cleaner to remove any residue from previous processing/handling and create a clean lay-up surface for the uncured composite material (Figure 1a). Tooling for high-performance aerostructures is typically made from a durable metallic material with a low coefficient of thermal expansion (CTE), such as Invar, to minimize tool thermal expansion/shrinkage during processing. Depending on the severity of residue build-up on the tool surface from previous usages, manufacturers may also use abrasive cleaning methods (e.g., coarse pads) or non-abrasive industrial methods (e.g., dry-ice blasting) to remove residues before continuing with tool preparation. However, abrasive methods may roughen the tool surface and consequently further promote tool-part interaction in subsequent cycles. The next step of tool preparation is to apply a mold sealer directly on the cleaned tool surface to fill micro-cavities, cover any scratches, and prevent mechanical interlocking (i.e., physical bonding) between the tool and part (Figure 1b). Afterward, several layers of release agent (RA) are applied on top of the sealed surface to form a low-energy barrier and prevent the formation of strong adhesive bonds (Figure 1c) [14]. The combination of mold sealer and RA creates an abhesive (i.e., non-adhesive) and impermeable release coating between the tool and part during lay-up/processing (Figure 1d).
The aerospace industry generally uses semi-permanent silicone-based release coatings due to their low adhesion (i.e., high abhesion) and high thermochemical stabilities. For example, Loctite® Frekote® B-15TM mold sealer [16] and 710-NCTM release agent [17] are two popular silicone release products used by aerospace manufacturers. Polydimethylsiloxane (PDMS) acts as the functioning silicone in both Frekote components, which allows for chemical inter-compatibility and excellent abhesive properties (i.e., low surface free energy) [14]. These products are either sprayed, wiped, rolled, or brushed onto tool surfaces as liquids and cured through an evaporation reaction to form low-energy coating layers on the tool surface.
As the thermoset composite undergoes a cross-linking reaction, some silicone molecules in the release coating transfer from the tool to the part’s surface and become physically and chemically integrated into its resin network [15,18]. Upon demolding after the cure cycle is completed, these molecules remain on the cured part’s surface as contaminations. The concentration of silicone contamination on cured composite parts may exist in the range of 5–20 at% of silicone, depending on the age and type of release coating applied to the tool during production [15].
The tool-to-part contaminating silicone transfer has been demonstrated in recent years by Blass and Dilger [18] for a similar release coating as the Frekote system. In their study, the authors performed pull-off testing to measure detachment energies and quantify tool surface adhesive properties (i.e., demoldabilities) as functions of release coating layers and processing cycles (i.e., age). The authors reported an increase in tool detachment energy after each processing cycle if no additional release coating was applied to the tool after the first cycle. Furthermore, tools initially covered in more release coating layers showed lower adhesion than those prepared with fewer layers, regardless of the number of processing cycles the tools underwent. The measured tool adhesion trends were then validated using Fourier-transform infrared spectroscopy (FTIR) on cured composite parts fabricated on the same tools used for pull-off tests. The authors verified that each production cycle and transfer of silicone molecules from the tool to the part decreases the amount of remaining coating layer and, thus, degrades the abhesiveness of the tool surface.
In addition to the transfer of silicone molecules, while the resin is still in its viscous liquid stage [2] during the early steps of processing, high autoclave temperatures and pressures may force the resin to bleed out from the composite onto the tool. As curing progresses, this resin chemically and/or physically bonds to micro-cavities on the tool surface and cures as contamination. Without tool cleaning or recoating steps, each successive processing cycle thus results in a further reduction in the coating thickness and promotion of tool surface contamination. This resultant change in physical and chemical tool surface properties due to processing can be considered the “aging” of the release coating. The aging of the release coating may strongly influence tool-part adhesion/interaction and resulting residual stresses and PIDs in composites.
To maintain effective tool-part abhesion, standard practice in the aerospace industry relies on spot cleaning of contaminations and intermittent reapplications of fresh RA layers on top of the aged coating between processing cycles. In industrial settings, RA reapplications and tool surface cleaning schedules are often driven by tacit and know-how knowledge. This approach, unfortunately, often leads to an unnecessarily high frequency of RA reapplications in process specifications. Overapplying RA layers is not only costly and production deficient, but may also affect the final adhesive bonding quality of composite parts during the assembly of aerostructures [15,18,19,20]. Conversely, insufficient RA reapplications during production may lead to other costly problems, such as excessive PIDs or non-demoldable parts after processing. Another approach to mitigate RA aging is to completely clean the tool using methods such as abrasive cleaning, solvent cleaning, or dry ice blasting (DIB) [21,22], then retreating it with fresh layers of mold sealer and RA. However, this method is particularly disruptive to the manufacturing workflow and is therefore only used when tools are highly contaminated and in need of thorough cleaning.
Currently, there exists an evident lack of a robust yet fast, non-destructive inspection method capable of evaluating the physicochemical properties of release coating and tool surface condition without disrupting the composites manufacturing workflow. This is partially due to the limitations of portable analysis equipment available for in-production tool surface inspections. Unfortunately, measurements gained from portable industrial equipment often suffer in precision compared with results obtained from scientific-grade laboratory instruments due to challenges in calibration, low-fidelity sampling methods and resolutions, and overall equipment capabilities [23]. As a result, portable analysis equipment may provide noisy and/or false data that are difficult for manufacturers to obtain and interpret quickly in an industrial setting. Thus, through conventional usage, portable analysis equipment may offer insignificant improvements over current manual inspection methods such as tape pull-off [21].
Fortunately, powerful statistical tools such as machine learning (ML) and data-driven modeling may be used to systematically process and transform low-fidelity data into high-quality and interpretable information [24]. For example, the singular value decomposition (SVD) [25], principal component analysis (PCA) [26], and linear discriminant analysis (LDA) [27] are some widely utilized tools for decomposing high-dimensional data (e.g., images) and extracting its most statistically defining factors. These factors may then be exploited to build probabilistic ML models, such as maximum likelihood classification (MLC) [28,29] or Gaussian process regression (GPR) [30,31], for real-time predictive evaluations during manufacturing. Furthermore, such data-driven tools may be excellent candidates for establishing correlations between datasets of sparse low-fidelity portable measurements and high-fidelity laboratory measurements.
This paper presents a novel ML-based inspection method for in-production physicochemical evaluation of release coating and tool surface condition during composites manufacturing. By leveraging digital imaging for fast global mapping, and contact angle goniometry (i.e., wettability) and Fourier-transform infrared spectroscopy (FTIR) for targeted sparse physicochemical evaluation, surfaces of large production tools can be analyzed quickly without disrupting the manufacturing workflow. During an inspection using the multi-faceted technique, ML methods are utilized to extract and analyze scientific-grade information from relatively low-quality portable measurements. This data-driven enhancement is achieved by establishing probabilistic ML correlations between portable and laboratory measurements. The information generated during the ML-based assessment can allow manufacturing personnel to make more informed decisions on whether to conduct further inspections, clean a tool, reapply RA, or continue production. The results in this paper demonstrate the novel inspection technology’s potential to identify and evaluate aged release coating, contamination, and a tool’s cleaning history in operational conditions. As a result, the ML-based technique can be utilized to understand the aging of release coatings, reduce untimely RA reapplications, improve the efficiency of tool preparation, and potentially mitigate PIDs in aerospace composites manufacturing.

2. Materials and Methods

2.1. Materials

The release coating used in this study consisted of two aerospace-grade products: Loctite® Frekote® B-15TM mold sealer and 710-NCTM release agent. The exact formulations of the Frekote products are proprietary, but the basic information is listed on publicly available datasheets [16,17]. After the release coating components are applied on tools, most of the carrier and solvent evaporate, while the silicones and hydrocarbons remain on the lay-up surface.
The composite material used in this study was Toray T800S/3900-2B UD prepreg with a resin content of 35% by weight [32]. The product 3900-2B is a toughened aerospace-grade epoxy resin, while T800S is an intermediate-modulus and high-strength carbon fiber. In addition to epoxy resin, the prepreg’s surface is partially covered with micro-spherical thermoplastic tougheners. In recent decades, the T800/3900-2 system has been used as a primary structural material on major aircraft such as the Boeing 787.

2.2. Experimental Methods

The overall goal of the experimental procedure was to develop an industrial-quality dataset in parallel with a laboratory-quality dataset to represent the physicochemical properties of release-coated tool surfaces during production. To achieve this goal, first, the in-process behavior of Frekote 710-NC and B-15 release coating products were investigated using laser scanning digital microscopy. Samples were prepared by cutting 3 flat 25 mm (w) × 25 mm (l) square tools from a 0.25 mm (t) Invar sheet. Then, one tool was treated with two layers of B-15 mold sealer, one tool was treated with two layers of B-15 mold sealer and three layers of 710-NC RA, and one tool was left untreated. Release coating products were applied to the Invar tools using a lint-free cotton wiping cloth, following recommendations on the products’ datasheets [16,17]. After all release coats were sufficiently cured, an Olympus OLS4100 laser scanning digital microscope was used to generate three-dimensional absorbance micrographs of the different tool surface conditions. Next, the Invar coupon prepared with two coats of B-15 and three coats of 710-NC was used as a layup surface for an autoclave processing cycle of a one-ply T800S/3900-2B part. Standard vacuum bagging procedures were used for the cycle and the laminate was cured according to the manufacturer’s recommended cure cycle (MRCC) [32]. The temperature cycle consisted of a heating ramp from room temperature to 180 °C at 2 °C/min, a temperature hold at 180 °C for 120 min, then a cool down back to room temperature. A combined autoclave and vacuum pressure of approximately 0.7 MPa (7 atm) was applied throughout processing. After processing, the cured laminate was demolded from the tool and the post-processing tool surface was analyzed using the laser scanning digital microscope. The cured laminate’s tool-side surface was also imaged using the OLS4100 microscope.
After investigating the processing behaviors of B-15 and 710-NC, a multi-component testing campaign was conducted to build an industrial-quality dataset in parallel with a laboratory-quality dataset to represent the physicochemical properties of release-coated tool surfaces during successive production cycles. The campaign consisted of tool preparations, autoclave processing cycles, dry ice blasting (DIB) tool cleaning, and production and laboratory tool inspections. The methodology for each of these experimental components is described in the following subsections.

2.2.1. Tool Preparation

A total of 2 flat Invar 36® plates with approximate dimensions of 3 mm (t) × 300 mm (w) × 600 mm (l) were used as production tools. In addition, 12 flat laboratory-scale (i.e., coupon-sized) tools were made by cutting 25 mm (w) × 25 mm (l) square sections from a 0.25 mm (t) Invar sheet. Since flat geometries were chosen for the production and lab-scale tools, the effects of geometry transition points (e.g., sharp corners) on aging were neglected in this study. The Invar plates and lab-scale tools had similar roughness grades of N3 and N2 (ISO 1302 [33]), with Ra values of approximately 0.10 μm and 0.08 μm, respectively. About three-fourths of each production tool was used as a lay-up surface during autoclave cure cycles, while the other one-fourth was used to support lab-scale tools during processing. The production and laboratory-scale tools were prepared as mold surfaces for autoclave composites processing cycles using the following procedure:
Step 1: Production and lab-scale tools were cleaned with Loctite® Frekote® PMCTM mold cleaner and a lint-free cotton wiping cloth to remove any surface residue from previous cutting or handling.
Step 2: A total of 2 layers of B-15 mold sealer were applied to the lay-up surfaces of each production and lab-scale tool using a lint-free cotton wiping cloth, allowing 30 min between coats and after the final coat. Then, all the tools were placed in a convection oven for 60 min at 95 °C to accelerate the curing process as recommended on the product’s datasheet [16].
Step 3: The lay-up area of each production tool was divided into three sections. The different sections were prepared with either one, three, or five layers of 710-NC RA. A lint-free cotton wiping cloth was used to apply the RA layers, allowing 15 min between coats. The lab-scale tools were similarly prepared with either one, three, or five layers of RA using the same technique. Four lab-scale tools were treated with one layer, four were treated with three layers, and the other four were treated with five layers of RA. After all RA layers were sufficiently cured, two lab-scale tools with each surface condition (i.e., one, three, and five layers of RA) were adhered to each production tool’s unsealed section using Flashbreaker® tape until lay-up and autoclave processing were conducted, as described in the following subsection.

2.2.2. Autoclave Processing

Step 4: In this step, 1 ply of T800S/3900-2B UD prepreg with nominal dimensions of 250 mm (w) × 400 mm (l) was laid up to cover the release-coated areas on each production tool surface. Then, 1 20 mm (w) × 20 mm (l) ply of UD prepreg was laid up on each lab-scale tool. Since single-ply composite parts were chosen for all the production and lab-scale processing cycles, the effects of part thickness on aging were neglected in this study.
Step 5: Each set of production and lab-scale tools was covered with one sheet of fluorinated ethylene propylene (FEP) release film, followed by one layer of breather cloth. The tools and lay-ups were placed and sealed in separate vacuum envelope bags (produced by Torr Technologies, Auburn, WA, USA), loaded into an autoclave, and subjected to the MRCC [32].
Step 6: Once the cure cycle was complete, the envelope bags were removed from the autoclave and all composite parts were demolded from the production and lab-scale tools. Then, the lab-scale tools were stored in sealed bags until the next processing cycle or inspection phase was conducted.
Step 7: Steps 4–6 were repeated before each round of inspection for a total of 20 processing cycles. Prior to composite lay up (i.e., Step 4), each tool was wiped with a dry lint-free cotton cloth to remove any surface residue from previous usage. One set of production and lab-scale tools were treated with one fresh layer of RA every three cycles. The other tools underwent twenty autoclave processing cycles without any RA reapplications. This approach was used to investigate the effects of RA reapplications on the aging process.

2.2.3. Dry Ice Blasting (DIB) Tool Cleaning

After twenty autoclave processing cycles, the surfaces of both production tools were dry ice blasted using a ColdJet® Aero2 Particle Control SystemTM (PCS®) 60 [34]. The PCS 60 blasts recycled solid carbon dioxide (CO2) pellets at supersonic speeds, causing them to sublimate upon impact with a solid surface and lift any contaminates off the substrate. Aerospace manufacturers use the ColdJet system to clean various materials for tooling, maintenance, surface preparation, and other production purposes [34]. The PCS 60 allows users to fine-tune blasting parameters and machine settings for each unique cleaning application. In this study, a feed rate of 1.0 lb/min, blast pressure of 100 psi, and applicator size of 1” was chosen for tool cleaning based on recommendations provided by a ColdJet technician.

2.2.4. Production Tool Inspections

Production tool surfaces were inspected after each autoclave cycle for the first five cycles, then after every five cycles through the remainder of the campaign. An additional inspection was conducted on each tool after dry ice blasting (DIB). During each inspection, the portable equipment was used to generate a dataset of low-fidelity (i.e., industrial-quality) physicochemical measurements of release coating as a function of RA layers, ages, reapplications, and DIB cleanings. Production-scale inspections consisted of wide-range color profilometry measurements (i.e., global imaging) with a compact camera (produced by Thorlabs, Newton, NJ, USA), sparse wettability measurements with a compact digital microscope, and sparse surface chemistry measurements with an Agilent 4100 ExoScan Handheld FTIR Spectrometer. The three portable analysis devices were integrated into a custom-built mechanical gantry system (Figure 2), allowing for three-dimensional portability over the entire tool surface area.
The first facet of each production-scale inspection was to collect a top-down RGB image of the tool surface using the compact camera. The camera was mounted at a fixed position in the gantry system, allowing it to capture a large surface area. One global image of each production tool was captured during each inspection. Next, wettability tests were performed using the compact digital microscope to capture side-view images of deionized (DI) water droplets on each production tool surface section treated with either one, three, or five layers of RA during tool preparation. DI water droplets with approximate volumes of 50 μL were manually dispensed in different areas on the tool surface using a pipette. Side-view images of the droplets were then captured immediately after solid–liquid contact between each droplet and the tool surface. Since the portable inspection setup utilized a manual dispensing system, this method was only sufficient for analyzing polar liquids with relatively low sensitivity to drop size, such as DI water [35]. However, a complete evaluation of surface free energy (SFE), one of the capabilities of the proposed inspection method, requires dispensing two different liquids on a solid surface—one liquid being dominantly polar and the other primarily dispersive. Therefore, the use of highly controlled laboratory equipment was necessary for complete SFE characterization, as described in the following subsection. The last step of each production tool inspection was performing surface chemistry measurements using the Handheld FTIR Spectrometer on the basis of diffuse reflectance. Three IR-absorbance spectra were scanned in different areas on each tool surface section in a spectral range of 500–4000 cm−1.

2.2.5. Laboratory Tool Inspections

Lab-scale tools were inspected in parallel intervals as production tools: after each cycle for the first five cycles, then after every five cycles until the campaign’s conclusion. Laboratory instruments were utilized to generate a high-fidelity dataset of physicochemical measurements on the small-scale tool surfaces containing similar conditions as the production tools. The first step of the laboratory assessments was performing sparse wettability measurements with an AST Optima Video Contact Angle (VCA) System on one-half of the lab-scale tools. The AST Optima was used to analyze a polar liquid (i.e., DI water) for comparison with portable results and a dispersive liquid to be used for SFE calculations. A total of 51 μL droplets of DI water and diiodomethane (DIM) (i.e., the dispersive component) were dispensed on the tool surfaces using an automated syringe system. Side-view images of each droplet were automatically captured immediately after solid–liquid contact using the VCA System. Then, sparse surface chemistry measurements were performed on the other half of the lab-scale tools using a Bruker Vertex 70 FTIR Spectrometer on the basis of attenuated total reflectance (ATR). Three IR-absorbance spectra were scanned on each laboratory tool in a spectral range of 500–4000 cm−1. Note that high-fidelity laboratory color profilometry measurements were not conducted and were not necessary for the proposed ML-based inspection method.

2.3. Accelerated In Situ Inspection

After the experimental campaign, probabilistic ML models were trained using the low-fidelity production and high-fidelity laboratory datasets. The workflow employed to build and train the ML models, designated as “pre-production training”, is schematically shown in Figure 3a. Unique ML model types with discrete purposes were utilized for each of the three inspection facets (i.e., global mapping, sparse SFE, and sparse surface chemistry) based on the data types generated. The operational performance of the ML models was then evaluated in an “in-production testing” phase (Figure 3b). Details of how the ML models were built, trained, and assessed are described in the following subsections.

2.3.1. Pre-Production Training

The first component of pre-production training was constructing a supervised maximum likelihood classification (MLC) model [36] using the low-fidelity global imaging dataset. Supervised MLC is a probabilistic method widely utilized for image analysis, where each pixel within an image is assigned to a class based on manually specified features [28]. The MLC model in this study was built using various functions within MATLAB [37]. The overall purpose of the MLC model was to identify target areas on a tool surface for sparse evaluations to be conducted and reduce the number of local measurements performed during manufacturing (i.e., sparse measurement optimization).
The first step in creating the MLC model was to extract representative information (i.e., features) from the low-fidelity top-down tool surface images by decomposing each image into a three-dimensional matrix of pixelated RGB values. To accomplish this first step, each image was read using MATLAB’s ‘imread’ function, then converted to a matrix using ‘reshape’. Each matrix was then projected into a new coordinate system by normalizing RGB values to a range of zero to one, then mapping the red channel to the x-axis, the green channel to the y-axis, and the blue channel to the z-axis. Next, all the RGB matrices were combined into a single matrix using the ‘cat’ function. Then, singular value decomposition (SVD) [25] was performed on the combined matrix using the ‘svd’ function to obtain the singular values and right singular vectors. After obtaining these values, principal component analysis (PCA) [26] was applied by multiplying the combined matrix by the right singular vectors, then multiplying the first three principal components by the corresponding singular values to reconstruct the RGB matrix with reduced dimensionality. Next, pixels within the reconstructed matrix were used to prepare a labeled dataset of pixel RGB values, where each pixel was labeled as one of three categories: abhesive release coating, aged release coating, or resin contamination. The labeled pixel RGB values were then combined into a single dataset and a linear discriminant analysis (LDA) classifier was trained using the ‘fitcdiscr’ function [27,36]. Through this process, an MLC model was trained to learn the relationship between each pixel’s features and its assigned class. Finally, the final MLC model could self-identify color abnormalities, classify surface conditions, and provide target areas for sparse evaluations from inputted global mapping images.
The low- and high-fidelity sparse wettability and chemistry measurements were used to train Gaussian Process Regression (GPR) models [30,31]. The GPR models were trained using the scikit-learn machine learning library within Python [38,39]. GPR models are built with respect to a set of data points, most often referred to as “observation data” [40]. GPR is a probabilistic, rather than discrete, method to find and model mean response functions from observation data. This method can be used to predict outputs from specified inputs quickly while providing confidence level bounds to the predictions. The GPR training process includes selecting a kernel matrix to describe the covariance function, or correlation, between data points [31]. In this study, the radial basis function (RBF) was chosen for the kernel [31,40]. RBF is widely utilized for GPR fitting and assumes strong correlations between adjacent data points, while dependency is exponentially lowered for scattered data. The GPR models were designed to evaluate physicochemical tool surface properties within the target area identified during global mapping.
The GPR model for local SFE evaluation was constructed by first extracting contact angles from side-view wettability images on production and laboratory-scale tools using ImageJ® processing software [41]. The width-to-height aspect ratios of DI water droplets on production tool surfaces were also extracted using ImageJ. During feature extraction, it was found that DI water contact angles generated using the portable setup (Figure 2) were consistently underapproximated by an average of 7.5%. These effects were likely due to the larger droplets dispensed using manual pipetting [35]. Therefore, a scaling factor of 1.075 was applied to all portable DI water contact angles to connect measurements to laboratory results. Next, laboratory-generated DIM contact angles were used in conjunction with the scaled DI water contact angles to calculate SFE using the Owens–Wendt equation [42]:
( γ S d γ l d ) 0.5 + ( γ S p γ l p ) 0.5 = 0.5 γ l ( 1 + c o s θ )
where γ S d is the solid surface’s dispersive component of SFE, γ S p is the solid surface’s polar component of SFE, γ l d is the dispensed liquid’s dispersive tension, γ l p is the dispensed liquid’s polar tension, γ l is the dispensed liquid’s overall tension equal to the sum of its dispersive and polar components, and θ is the dispensed liquid’s contact angle immediately after solid–liquid contact with the solid surface. The dispersive and polar tensions of DI water were assumed to be 22.1 dyne/cm and 50.7 dyne/cm, respectively. The dispersive and polar tensions of DIM were assumed to be 48.5 dyne/cm and 2.3 dyne/cm, respectively [42]. From the known liquid tension properties and measured contact angles from two liquids, a system of two equations can be established, then γ S d and γ S p can be solved. Finally, the total SFE of the solid surface can be calculated by summing γ S d and γ S p together.
After calculating SFE, a GPR model was trained with respect to portable (i.e., unscaled) DI water contact angles, width-to-height droplet aspect ratios, and SFE calculations. Using the procedure described above, the GPR model could quickly predict local SFE in a target area from low-fidelity contact angles and aspect ratios. Therefore, high-fidelity contact angle measurements would not be necessary to utilize the GPR model during manufacturing.
The GPR model for local surface chemistry evaluation was constructed by first normalizing the portable and laboratory IR-absorbance spectra so the onset of each major peak corresponded to 0% absorbance. Then, the 1020 cm−1 absorbance peak intensity, corresponding to the Si-O-Si stretching in a silicone functional group (i.e., PDMS) [14,18], was extracted from each spectrum using OriginPro® graphing and analysis software [43]. During feature extraction, it was found that the Handheld FTIR Spectrometer significantly overestimated the 1020 cm−1 peak intensity compared with the laboratory Bruker Vertex 70 for the first 5 tool inspections. However, after five cycles, the portable and laboratory equipment provided very similar measurements. The physicochemical phenomena responsible for the IR-absorbance mismatches will be explained later in this paper. Since portable and laboratory mismatches were not consistent throughout the campaign, applying a constant scaling factor to portable measurements was not appropriate. Instead, two separate GPR models were trained: one for the portable data set and one for the laboratory data set. Both models were trained with respect to known process variables (i.e., release coating age and the number of RA layers) and 1020 cm−1 absorbance peak intensities. During manufacturing, the portable and laboratory GPR models were designed to be cross-referenced to predict tool surface history based on low-fidelity IR-absorbance measurements. Once more, high-fidelity FTIR measurements would not be necessary to utilize the GPR model during manufacturing.

2.3.2. In-Production Testing

In-production testing consisted of validating the performance of the gantry inspection system (Figure 2) and ML models by conducting tool inspections in operational conditions. One inspection was performed on the production tool that received no RA reapplications throughout the experimental campaign. This inspection was conducted after the tool’s twentieth autoclave cycle and before dry ice blasting to assess the overall performance of the proposed inspection method in identifying and evaluating aged release coating and contamination. A second inspection was performed on the production tool that received one RA reapplication every three cycles. This inspection was conducted after the twenty processing cycles and after dry ice blasting to evaluate the performance of the cleaning technique in removing release coating from a tool surface. Each in-production test followed the procedure outlined below and in Figure 3b:
First, a global map of the tool surface was captured using the compact camera. The digital image was then inputted into the MLC model, where any color-abnormal regions were identified as target areas for sparse measurements and classified as abhesive release coating, aged release coating, or resin contamination. Next, the compact microscope and Handheld FTIR spectrometer were transported to each target area, and low-fidelity sparse wettability and surface chemistry measurements were performed. For SFE measurements, a total of 150 DI water droplets were manually dispensed within the target area using a pipette. A large number of droplets was chosen for in-production testing to evaluate variabilities in the surface conditions and manual dispensing process. The number of droplets was equally divided between each surface condition classified during global mapping—50 on abhesive release coating, 50 on aged release coating, and 50 droplets on resin contamination. Next, the handheld FTIR spectrometer was deployed to take three IR-absorbance spectra on the surface condition identified as aged release coating during global mapping. The spectral information was inputted into its respective GPR model, and the tool surface history was predicted. During the inspection, data were interpreted, and manufacturing decisions to clean the tool, reapply RA, or continue production were discussed.

3. Results and Discussion

Figure 4a–c show three-dimensional micrographs of pre-production Invar tools containing no release coating (i.e., untreated), treated with B-15 mold sealer, and treated with B-15 mold sealer and 710-NC release agent, respectively. The images in the figure demonstrate that as mold sealer and release agent are applied to tool surfaces, the products form agglomerations (i.e., bumps) rather than a smooth layer. This phenomenon occurs due to the low surface free energy (SFE) properties of B-15 and 710-NC [35]. Figure 4d shows the fully release-coated tool surface after autoclave processing, illustrating that elevated pressures and temperatures (e.g., 7 atm pressure and 180 °C), which were well above the glass transition temperature (Tg) of PDMS (i.e., approximately −130 °C [14]), caused the Frekote agglomerations to behave rubbery, and thus flow and smear over the tool surface. This response created a relatively smooth barrier between the tool and the part during processing. Finally, Figure 4e demonstrates that autoclave conditions also caused some silicone molecules in the release coating to transfer from the tool and contaminate the composite part’s surface.
As previously mentioned, after laser microscopy tests, the experimental campaign consisted of conducting twenty autoclave composites processing cycles, periodic tool preparations and inspections, and a final cleaning using dry ice blasting (DIB) on two flat Invar production tools. In addition, one tool was subjected to one RA reapplication every three cycles, while the other underwent all twenty cycles without receiving any touch-ups. Throughout the twenty-cycle campaign, both production tool surfaces underwent significant chemical changes but remained highly abhesive for nineteen of the twenty processing cycles. Upon demolding after the twentieth cycle, the production tool which received no RA reapplications revealed significant aging effects. These effects caused an apparent reduction in tool-part abhesion after processing and hence difficulties in demolding the part. Conversely, the tool subjected to periodic RA reapplications showed negligible aging effects after twenty rounds of autoclave processing. These results indicate that reapplying one fresh layer of Frekote RA after every three processing cycles mitigates aging effects in the coating.
The remainder of this section focuses on results generated during the two in-production testing inspections. Results from each of the three inspection facets of global mapping, sparse surface free energy evaluation, and sparse surface chemistry are presented. The results reported in this section are meant to demonstrate the inspection technology’s potential to identify and evaluate aged release coating, contamination, and the effectiveness of DIB cleaning in operational conditions. Discussions will also provide insight into the physicochemical aging behavior of release coating during composites manufacturing.

3.1. Global Mapping

Figure 5a shows a global image of the production tool surface after undergoing twenty autoclave processing cycles without receiving any RA reapplications. The plot’s x- and y-axes correspond to coordinates on the tool surface in units of pixels. The image demonstrates resin bleeding from the composite prepreg to the tool’s edges, creating a visible contaminated border on the tool. The thickness and surface area of resin contamination increased with each processing cycle and consequently decreased the area of exposed release coating on the tool surface. If production tools are not cleaned regularly, contamination can continue to spread into the lay-up surface and have detrimental effects on tool-part abhesion, end-part quality, and PIDs. Throughout the twenty autoclave processing cycles, the contamination border remained outside the lay-up dimensions of the composite parts. Therefore, the significant decrease in tool abhesion after twenty cycles was likely due to aging within the lay-up boundaries rather than from the contaminated border. The remainder of the inspection was thus conducted within the tool’s lay-up boundaries.
The area surrounded by the green box in Figure 5a outlines a color-abnormal zone on the tool surface. This enclosed area was self-identified by the MLC model and is enlarged in Figure 5b for a clearer view. After twenty autoclave cycles, the tool’s lay-up surface was mainly covered by an opaque, abhesive release coating. However, the tool section that was initially treated with only one layer of RA contained light and dark patches on its surface. Light patches corresponded to resin contamination, while dark patches were aged release coating (verified using handheld FTIR and discussed later). A lack of contamination and aging in other sections indicates that applying more RA layers prior to processing creates a more durable coating barrier between the tool and part. In other words, the number of RA layers may directly affect the rate of aging on a tool surface.
Figure 5c shows the identified target area after being transformed by the MLC model. Pixels within the target area were automatically classified into three categories: aged release coating (red), abhesive release coating (black), or resin contamination (yellow). In addition to providing a visual of the target zone, plots similar to Figure 5c may be utilized in a production environment to quantify the spatial coordinates, distribution, and percent area of aged release coating or resin contamination on a tool surface. During an inspection, these values could then be used as go/no-go (i.e., pass/fail) criteria. For example, if no color-abnormal areas are identified using the MLC model, the tool surface would likely meet specifications, and production could continue without further disruptions. Adversely, the detection of any significant color abnormalities should inform a manufacturer to further evaluate the tool surface using sparse measurements.
Figure 6a illustrates a scenario where no aged release coating or resin contamination was detected on the tool surface that underwent periodic RA reapplications. Although there are evident color variations in the image, these were only circumstances of poorly controlled lighting and/or visual reflections during global mapping. Since the MLC model was trained to account for these in-production variations, no abnormalities or target areas for sparse measurements were detected. Although this information should inform a manufacturer to continue production, the tool surface shown in Figure 6a was cleaned using DIB for investigative purposes. Figure 6b shows the tool surface after DIB cleaning using the ColdJet Aero2 PCS 60 system. The image demonstrates the machine’s ability to remove a cured resin contamination border from a tool surface. Furthermore, a lack of any scratches on the tool surface after DIB cleaning reinforces the non-abrasive benefits of the method. Although the proficiency of DIB for contamination removal is clearly shown in Figure 6, the method’s effects on release coating are difficult to interpret from the images. Hence, sparse measurements were necessary to fully characterize the effectiveness of DIB as an industrial tool cleaning method.

3.2. Sparse Surface Free Energy Evaluation

Figure 7 shows side-view images of DI water droplets immediately after solid–liquid contact with (a) abhesive release coating, (b) aged release coating, (c) resin contamination, and (d) the production tool surface after DIB cleaning. The images in the figure were captured using the low-fidelity portable digital microscope. The top half of each image shows the droplet resting on the various tool surface conditions, while the bottom half shows the droplet’s reflection in the Invar tool. When dispensed on different surface conditions, DI water droplets formed unique contact angles and distinct spherical shapes. Droplets applied to abhesive release coating exhibited the largest contact angles and lowest width-to-height aspect ratios (i.e., spreading). Conversely, droplets dispensed on resin contamination yielded the lowest contact angles and highest aspect ratios. The contact angle and shape of the liquid droplet result from intermolecular adhesive interactions at the solid–liquid interface due to SFE effects and internal cohesive forces in the liquid [35,44]. Since liquid properties of DI water remained constant throughout the inspection procedure, each droplet’s unique contact angle and shape must have been due to SFE effects. Therefore, Figure 7 demonstrates that even without performing robust calculations, the portable technique was able to identify distinct qualitative differences in SFE between abhesive release coating, aged release coating, and resin contamination.
Since all areas on the periodically retreated tool surface were classified as abhesive release coating prior to DIB, the effects of the cleaning method on SFE properties may be qualitatively seen by comparing Figure 7a,d. The two figures demonstrate that a DI water droplet formed a smaller contact angle and a larger aspect ratio with the tool surface after DIB cleaning. This suggests that the DIB method may have successfully removed release coating from the tool surface and exposed the underlying Invar. Although it is difficult to make further conclusions from the images, the SFE properties of aged release coating and the tool surface after DIB cleaning also appear to be qualitatively similar.
Figure 8 shows a GPR model for predicting SFE from a DI water droplet contact angle and aspect ratio on a tool surface. Red points in the plot represent test data collected using the portable analysis equipment in the target area identified during global mapping. A mean response surface, also shown in red, was fitted to the test data using GPR. The upper and lower 95% confidence intervals of the GPR predictions are also shown in the plot as grey surfaces. The confidence bounds converge with the mean response surface in areas containing many adjacent data points, while the surfaces diverge as they move further away from test data. SFE measurements of the tool surface after DIB cleaning are also shown as blue points and labeled as Post-DIB data in Figure 8 for illustrative purposes.
The SFEs of abhesive release coating areas were measured over an approximate range of 11–13 mJ/m2. These exceptionally low values correspond well to results previously measured using laboratory-quality equipment and reported in the literature by Critchlow et al. (i.e., 10.7–20.4 mJ/m2) [14]. Furthermore, the low SFE range indicates the majority of the target area and tool surface remained highly abhesive after undergoing twenty processing cycles without any RA reapplications. Aged release coating and resin contamination SFEs were measured over approximate ranges of 28–30 mJ/m2 and 38–53 mJ/m2, respectively. Surface patches containing these higher SFE values were likely the cause of decreased tool abhesion properties after the twentieth autoclave cycle. The largest SFE values measured on resin indicate that contamination would have more detrimental effects on tool-part interaction and PIDs than aged release coating. The largest scatter in contamination measurements was likely due to a combination of uncontrolled DI water dispensing and the non-uniform macro-roughness of cured resin on the tool surface [35,45]. After DIB cleaning, SFEs of 28–30 mJ/m2 were measured on the tool surface. These intermediate values reinforce the ColdJet machine’s ability to remove release coating from a tool surface.
In an industrial setting, the GPR model in Figure 8 may be utilized as a quick method to classify surface conditions or predict tool SFEs for inspection criteria. For example, high measured values of SFE (e.g., 30–50 mJ/m2) should inform the manufacturer to clean the tool using DIB and reapply RA before continuing with the next cure cycle. On the other hand, if intermediate SFE values are predicted using the GPR model (e.g., 15–25 mJ/m2), further chemical analysis may be necessary to fully evaluate the tool surface.

3.3. Sparse Surface Chemistry Evaluation

Figure 9 compares IR-absorbance spectra of fresh release coating with release coating that underwent ten autoclave processing cycles. The portable spectra in the plots were taken within the tool’s target area using the Agilent 4100 ExoScan Handheld FTIR Spectrometer. Laboratory spectra were measured on coupon-sized tools with the Bruker Vertex 70 FTIR Spectrometer. This figure illustrates how fresh and aged release coatings exhibit different chemical characteristics, and how portable analysis results may differ from measurements obtained through laboratory instruments under certain circumstances. Fresh and aged release coatings exhibit similar general peaks at wavenumbers of 3020 cm−1, 2920 cm−1, 2850 cm−1, 1470 cm−1, 1260 cm−1, 1090 cm−1, 1020 cm−1, and 780 cm−1. The four peaks at 780 cm−1, 1020 cm−1, 1090 cm−1, and 1260 cm−1 are characteristic of silicone materials—specifically, a PDMS polymer network. The peak at 780 cm−1 represents Si-CH3 bond stretching. The peaks at 1020 cm−1 and 1090 cm−1 represent the asymmetric stretching of Si-O-Si bonds. The peak at 1260 cm−1 is characteristic of the symmetrical deformation of the C-H bond in the Si-(CH3)2 groups (i.e., Si-CH3 bending). There is also a weaker peak at 1470 cm−1 and a strong cluster around 3020 cm−1, representing C-H scissoring and asymmetric C-H stretching, respectively [14,18,23].
Although the fresh and aged spectra contain IR-peaks at similar wavenumbers, Figure 9 also demonstrates distinct chemical differences between the two surface conditions. For example, according to laboratory measurements, all of the peaks within the silicone regime underwent an approximate two-fold intensity increase during the first ten autoclave cycles. These chemical changes were likely due to the tool becoming “conditioned” to the release coating, which is a consequence of using a new and freshly coated tool. During a production tool’s first few processing cycles, external temperatures and pressures cause non-silicone components to flash off or transfer to the part, while silicone components are “baked” into the mold [17]. These conditioning mechanisms cause variations in the release coating’s chemical composition (i.e., silicone levels), which are captured in the laboratory IR-absorbance spectra of Figure 9. After the tool becomes conditioned, the properties of release coating are considered “locked-in” and remain stable until considerable aging effects cause silicone levels and tool abhesion to decline.
As previously mentioned, measurements gained from portable equipment often suffer in precision compared with results obtained from scientific-grade laboratory instruments due to differences in sampling methods and overall equipment capabilities. This lack of precision is demonstrated by significant mismatches between portable and laboratory spectra in Figure 9. For fresh release coating, all silicone peaks in the portable spectrum are approximately five times larger than the precise laboratory measurements. In a production environment, an inaccurate measurement such as this could result in false-positive or false-negative tool surface evaluations. Fortunately, the portable silicone regime becomes similar to laboratory measurements once the tool becomes conditioned and properties are locked in. These results suggest that portable FTIR equipment may be faulty prior to tool conditioning but is a more reliable instrument after silicone levels stabilize.
Figure 10 shows a GPR model for predicting the tool surface history, including the number of RA layers and processing cycles, with respect to the 1020 cm−1 absorbance peak intensity. Red points in the plot were measured throughout the testing campaign in different areas on the production tool using the portable FTIR. A mean response surface, shown in green, was fitted to the data using GPR with an accuracy of 86%. The blue surface in the plot represents the mean behavior of laboratory measurements throughout the campaign and is meant to be used as a qualitative comparison with portable results. The 1020 cm−1 peak was chosen for the model to quantify silicone levels on the tool surface as a function of RA layers and processing cycles. The portable and laboratory response surfaces show large differences over the first five autoclave cycles for all surface conditions due to the tool becoming conditioned to release coating. Measuring an unusually high 1020 cm−1 absorbance in a production environment could be an indication of an unconditioned tool. Collecting accurate information from portable equipment prior to conditioning would then require the manufacturer to enhance the accuracy of the portable measurement by calculating a scaling factor equal to the laboratory peak intensity divided by its portable counterpart. However, calculating a scaling factor would require the tool surface history to be known by the manufacturer, including the number of RA layers and processing cycles.
After reaching the five-cycle mark, the portable and laboratory absorbances plateaued and remained relatively constant through the remainder of the testing campaign. The portable response surface remained within approximately 10% of laboratory results between the 5th and 20th cycles. This consistent accuracy demonstrates the portable equipment’s ability to effectively evaluate the surface chemistry of the release coating after conditioning occurs. Hence, portable results do not necessarily have to be connected to laboratory measurements for accurate characterization of the release coating. Using a scaling factor after conditioning occurs would still increase the fidelity of portable measurements but may not be an essential technique during inspections. Portable FTIR results from one aged patch and three areas on the tool surface after DIB cleaning (blue points) are also shown in Figure 10. Both aged and DIB-cleaned spots contained near-zero 1020 cm−1 absorbances, with silicone levels slightly lower for the cleaned surface. These low-absorbance measurements indicate a lack of silicone on both surface conditions and validate the ColdJet equipment as an effective method for removing release coating (silicone) from a tool surface. Furthermore, the plot in Figure 10 validates the ability of the portable FTIR device to identify sufficiently aged release coating on a tool surface. In a manufacturing environment, low silicone levels should inform the manufacturer to reapply RA on top of the aged coating before continuing with the next cure cycle.

4. Summary and Conclusions

The objective of this study was to develop a non-destructive and portable method for the in-production evaluation of tool surface condition during composites manufacturing. A novel technology was developed to achieve this goal by integrating portable analysis equipment into a mechanical gantry system. Each portable device was used in conjunction with ML and data-driven modeling techniques to extract scientific-grade and interpretable information from relatively low-quality measurements. In a composites manufacturing environment, the multi-faceted technique may be used to inspect the surface of a large production tool by following the procedure outlined below:
First, a compact digital camera captures a wide-view image (i.e., global map) of the tool surface. Then, the global map is decomposed using a maximum likelihood classification (MLC) model, where any color-abnormal regions are identified on the tool surface. The color-abnormal regions are also classified as the abhesive release coating, the aged release coating, or resin contamination by the MLC model and are used as target areas for sparse measurements in the following inspection steps. A lack of aged release coating or resin contamination identified on the tool surface would inform manufacturers that additional sparse measurements, tool cleanings, or reapplications of release coating are likely unnecessary to protect the tool from damage in the next processing cycle, and would thus only reduce production efficiency. However, for processes with long cycle times and costs (e.g., autoclave), reapplying release coating at this stage can be used as a conservative and cost-effective method to reduce risks of tooling damage in future processing cycles to near zero. If color-abnormal regions are identified, the next inspection step is transporting a portable microscope to the target area and performing sparse wettability measurements by dispensing DI water and capturing side-view images of the droplets on the tool surface. The surface free energy (SFE) within the target area is then predicted using a Gaussian process regression (GPR) model that requires contact angle and width-to-height aspect ratio measurements of the DI water droplets as inputs. High measured values of SFE (e.g., 30–50 mJ/m2) should inform the manufacturer to clean the tool and reapply RA before continuing with the next cure cycle. On the other hand, if intermediate SFE values are predicted using the GPR model (e.g., 15–25 mJ/m2), further chemical analysis may be necessary to evaluate the tool surface fully. The last inspection step is using a portable FTIR spectrometer to perform sparse surface chemistry measurements within the target area. Spectral information gathered through FTIR is then inputted into another GPR model, where the tool surface history, including the number of release coating layers and the coating’s age, may be predicted from compositional silicone levels. If low silicone levels are detected, the manufacturer should reapply release coating before continuing with production.
By following the previously described procedures, the in situ inspection method provides a reliable and efficient way to evaluate tool surface conditions, with high accuracy and a low cost of implementation. Additionally, the cost of equipment and materials used in the system is relatively low, since the technology consists entirely of portable or handheld devices, making it a cost-effective solution. The relatively inexpensive digital equipment used in the inspection system allows for prompt troubleshooting, maintenance, repair, or replacement of devices. In terms of overall effectiveness, our method has been demonstrated to be capable of evaluating tool surfaces across a wide range of conditions (e.g., age of release coating, tool cleaning schedule), making it a versatile option. By combining multiple measurement techniques, the presented in situ inspection method is more effective than other methods that are currently used and rely on a single technique based on know-how. Overall, our method provides a reliable and efficient way to evaluate tool surface conditions, with high accuracy and a low cost of implementation.
During the development of the accelerated inspection method, an extensive testing campaign was conducted to investigate the physicochemical aging process of release coating during composites manufacturing. In addition, the effectiveness of dry ice blasting (DIB) as an industrial cleaning method was also investigated. The main conclusions regarding the aging of release coating and DIB cleaning are as follows:
Treating a tool with two layers of Frekote mold sealer and several layers of release agent prior to processing creates a low-energy release coating. During processing, release coatings undergo significant chemical changes but may remain highly abhesive for more than twenty autoclave processing cycles of flat composite parts. Chemical changes in the release coating are especially prevalent during a new and freshly coated production tool’s first few processing cycles. External temperatures and pressures cause non-silicone components to flash off or transfer to the part, while silicone components are “baked” into the mold. These processes may be referred to as the tool becoming “conditioned” to the release coating. After the tool becomes conditioned, the properties of release coating are considered “locked-in” and remain stable until considerable aging effects cause silicone levels and tool abhesion to decline. The number of release agent layers applied to a tool impacts the coating’s effective lifespan. Periodic reapplications of release agent can be used to mitigate aging effects and maintain effective tool abhesion. However, frequent reapplications are unnecessary and may only disrupt the flow of manufacturing in an industrial setting.
Dry ice blasting (DIB) using the ColdJet® Aero2 Particle Control SystemTM (PCS®) 60 is an effective method for non-abrasively removing cured resin contamination and release coating from a tool surface. By using a feed rate of 1.0 lb/min, blast pressure of 100 psi, and applicator size of 1” for DIB cleaning, silicone-based release coatings can be efficiently removed from tool surfaces.

Author Contributions

Conceptualization, N.Z.; methodology, C.S. and N.Z.; software, S.L.; validation, C.S.; formal analysis, C.S. and S.L.; investigation, C.S., K.B. and V.H.; resources, A.G.; data curation, C.S.; writing—original draft preparation, C.S.; writing—review and editing, C.S. and N.Z.; visualization, C.S. and S.L.; supervision, A.G. and N.Z.; project administration, N.Z.; funding acquisition, N.Z. All authors have read and agreed to the published version of the manuscript.

Funding

This research was funded by The Joint Center for Aerospace Technology Innovation (JCATI) and Toray Composite Materials America, Inc.

Data Availability Statement

The data presented in this study are available on request from the corresponding author.

Acknowledgments

The authors would like to acknowledge in-kind support from The Boeing Company, Henkel AG & Co. KGaA, and Cold Jet.

Conflicts of Interest

The authors declare no conflict of interest.

Abbreviations

The following abbreviations are used in this manuscript:
PIDsProcess-induced deformations
CTECoefficient of thermal expansion
RARelease agent
PDMSPolydimethylsiloxane
TgGlass transition temperature
FTIRFourier-transform infrared spectroscopy
DIBDry ice blasting
MLMachine learning
SVDSingular value decomposition
PCAPrincipal component analysis
LDALinear discriminant analysis
MLCMaximum likelihood classification
GPRGaussian process regression
FEPFluorinated ethylene propylene
MRCCManufacturer’s recommended cure cycle
PCSParticle control system
DIDeionized
SFESurface free energy
VCAVideo contact angle
DIMDiiodomethane
ATRAttenuated total reflectance
RBFRadial basis function

References

  1. Zobeiry, N.; Poursartip, A. The Origins of Residual Stress and Its Evaluation in Composite Materials. In Structural Integrity and Durability of Advanced Composites: Innovative Modelling Methods and Intelligent Design; Woodhead Publishing: Cambridge, UK, 2015; pp. 43–72. ISBN 9780081001387. [Google Scholar]
  2. Zobeiry, N.; Forghani, A.; Li, C.; Gordnian, K.; Thorpe, R.; Vaziri, R.; Fernlund, G.; Poursartip, A. Multiscale Characterization and Representation of Composite Materials during Processing. Philos. Trans. R. Soc. A Math. Phys. Eng. Sci. 2016, 374, 20150278. [Google Scholar] [CrossRef] [PubMed]
  3. Fernlund, G.; Mobuchon, C.; Zobeiry, N. 2.3 Autoclave Processing. In Comprehensive Composite Materials II; Elsevier: Amsterdam, The Netherlands, 2018; pp. 42–62. ISBN 9780081005330. [Google Scholar]
  4. Li, C.; Zobeiry, N.; Keil, K.; Chatterjee, S.; Poursartip, A. Advances in the Characterization of Residual Stress in Composite Structures. In Proceedings of the SAMPE 2014—SEATTLE, Seattle, WA, USA, 2–5 June 2014. [Google Scholar]
  5. Zappino, E.; Zobeiry, N.; Petrolo, M.; Vaziri, R.; Carrera, E.; Poursartip, A. Analysis of Process-Induced Deformations and Residual Stresses in Curved Composite Parts Considering Transverse Shear Stress and Thickness Stretching. Compos. Struct. 2020, 241, 112057. [Google Scholar] [CrossRef]
  6. Albert, C.; Fernlund, G. Spring-in and Warpage of Angled Composite Laminates. Compos. Sci. Technol. 2002, 62, 1895–1912. [Google Scholar] [CrossRef]
  7. Twigg, G.; Poursartip, A.; Fernlund, G. Tool–Part Interaction in Composites Processing. Part I: Experimental Investigation and Analytical Model. Compos. Part A Appl. Sci. Manuf. 2004, 35, 121–133. [Google Scholar] [CrossRef]
  8. Twigg, G.; Poursartip, A.; Fernlund, G. Tool–Part Interaction in Composites Processing. Part II: Numerical Modelling. Compos. Part A Appl. Sci. Manuf. 2004, 35, 135–141. [Google Scholar] [CrossRef]
  9. Schoenholz, C.; Slade, D.; Zappino, E.; Petrolo, M.; Zobeiry, N. Representation, Characterization and Simulation of Tool-Part Interaction and Its Effects on Process-Induced Deformations in Composites. In Proceedings of the American Society for Composites—Thirty-Sixth Technical Conference on Composite Materials; DEStech Publications: Lancaster, PA, USA, 2021; pp. 1204–1216. [Google Scholar]
  10. Potter, K.D.; Campbell, M.; Langer, C.; Wisnom, M.R. The Generation of Geometrical Deformations Due to Tool/Part Interaction in the Manufacture of Composite Components. Compos. Part A Appl. Sci. Manuf. 2005, 36, 301–308. [Google Scholar] [CrossRef]
  11. Twigg, G.; Poursartip, A.; Fernlund, G. An Experimental Method for Quantifying Tool–Part Shear Interaction during Composites Processing. Compos. Sci. Technol. 2003, 63, 1985–2002. [Google Scholar] [CrossRef]
  12. Ersoy, N.; Potter, K.; Wisnom, M.R.; Clegg, M.J. An Experimental Method to Study the Frictional Processes during Composites Manufacturing. Compos. Part A Appl. Sci. Manuf. 2005, 36, 1536–1544. [Google Scholar] [CrossRef]
  13. Kaushik, V.; Raghavan, J. Experimental Study of Tool–Part Interaction during Autoclave Processing of Thermoset Polymer Composite Structures. Compos. Part A Appl. Sci. Manuf. 2010, 41, 1210–1218. [Google Scholar] [CrossRef]
  14. Critchlow, G.W.; Litchfield, R.E.; Sutherland, I.; Grandy, D.B.; Wilson, S. A Review and Comparative Study of Release Coatings for Optimised Abhesion in Resin Transfer Moulding Applications. Int. J. Adhes. Adhes. 2006, 26, 577–599. [Google Scholar] [CrossRef]
  15. Markatos, D.N.; Tserpes, K.I.; Rau, E.; Markus, S.; Ehrhart, B.; Pantelakis, S. The Effects of Manufacturing-Induced and in-Service Related Bonding Quality Reduction on the Mode-I Fracture Toughness of Composite Bonded Joints for Aeronautical Use. Compos. B Eng. 2013, 45, 556–564. [Google Scholar] [CrossRef]
  16. LOCTITE FREKOTE B-15—Mold Sealer—Henkel Adhesives. Available online: https://www.henkel-adhesives.com/us/en/product/mold-release-agents/loctite_frekote_b15.html (accessed on 1 September 2022).
  17. LOCTITE FREKOTE 710NC—Release Agent—Henkel Adhesives. Available online: https://www.pccomposites.com/product/frekote-710nc/ (accessed on 1 September 2022).
  18. Blass, D.; Dilger, K. CFRP-Part Quality as the Result of Release Agent Application—Demoldability, Contamination Level, Bondability. In Proceedings of the Procedia CIRP; Elsevier: Amsterdam, The Netherlands, 2017; Volume 66, pp. 33–38. [Google Scholar]
  19. Parker, B.M.; Waghorne, R.M. Surface Pretreatment of Carbon Fibre-Reinforced Composites for Adhesive Bonding. Composites 1982, 13, 280–288. [Google Scholar] [CrossRef]
  20. Jeenjitkaew, C.; Luklinska, Z.; Guild, F. Morphology and Surface Chemistry of Kissing Bonds in Adhesive Joints Produced by Surface Contamination. Int. J. Adhes. Adhes. 2010, 30, 643–653. [Google Scholar] [CrossRef]
  21. Goss, B. The Effective Use of Mould Release Agents. Reinf. Plast. 2004, 48, 24–26. [Google Scholar] [CrossRef]
  22. Máša, V.; Horňák, D.; Petrilák, D. Industrial Use of Dry Ice Blasting in Surface Cleaning. J. Clean. Prod. 2021, 329, 129630. [Google Scholar] [CrossRef]
  23. Tracey, A.; Flinn, B. Infrared Spectroscopy: A Potential in Process Quality Assurance Method for Composite Bonding Surface Preparation. In Proceedings of the 44th ISTC, Charleston, SC, USA, 22–25 October 2012. [Google Scholar]
  24. Brunton, S.L.; Kutz, J.N. Data-Driven Science and Engineering: Machine Learning, Dynamical Systems; Cambridge University Press: Cambridge, UK, 2022. [Google Scholar]
  25. Golub, G.; Kahan, W. Calculating the Singular Values and Pseudo-Inverse of a Matrix. J. Soc. Ind. Appl. Math. Ser. B Numer. Anal. 2006, 2, 205–224. [Google Scholar] [CrossRef]
  26. Jolliffe, I. Principal Component Analysis. In Encyclopedia of Statistics in Behavioral Science; Everitt, B.S., Howell, D.C., Eds.; John Wiley & Sons, Ltd.: Hoboken, NJ, USA, 2005. [Google Scholar] [CrossRef]
  27. Tharwat, A.; Gaber, T.; Ibrahim, A.; Hassanien, A.E. Linear Discriminant Analysis: A Detailed Tutorial. AI Commun. 2017, 30, 169–190. [Google Scholar] [CrossRef]
  28. Sisodia, P.S.; Tiwari, V.; Kumar, A. Analysis of Supervised Maximum Likelihood Classification for Remote Sensing Image. In Proceedings of the International Conference on Recent Advances and Innovations in Engineering, ICRAIE 2014, Jaipur, India, 9–11 May 2014. [Google Scholar] [CrossRef]
  29. Bolstad, P.; Lillesand, T.M. Rapid Maximum Likelihood Classification. Photogramm. Eng. Remote Sens. 1991, 57, 67–74. [Google Scholar]
  30. Rasmussen, C.E. Gaussian Processes in Machine Learning. Lecture Notes in Computer Science (including subseries Lecture Notes in Artificial Intelligence and Lecture Notes in Bioinformatics): Preface. Lect. Notes Comput. Sci. 2004, 3176, 63–71. [Google Scholar] [CrossRef]
  31. Schulz, E.; Speekenbrink, M.; Krause, A. A Tutorial on Gaussian Process Regression: Modelling, Exploring, and Exploiting Functions. J. Math. Psychol. 2018, 85, 1–16. [Google Scholar] [CrossRef]
  32. 3900 Prepreg System. Toray Composite Materials America, Inc. Available online: https://www.toraycma.com/3900-prepreg-system/ (accessed on 1 September 2022).
  33. ISO 1302:2002; Geometrical Product Specifications (GPS)—Indication of Surface Texture in Technical Product Documentation. ISO: Geneva, Switzerland, 2002. Available online: https://www.iso.org/standard/28089.html (accessed on 28 September 2022).
  34. Aero2 PCS 60—Precision & Versatile Dry Ice Blasting Machine—Cold Jet. Available online: https://www.coldjet.com/our-equipment/dry-ice-blasting-equipment/aero2-series/aero2-pcs-60/ (accessed on 6 October 2022).
  35. de Gennes, P.-G.; Brochard-Wyart, F.; Quéré, D. Capillarity and Wetting Phenomena; Springer: New York, NY, USA, 2004. [Google Scholar]
  36. Carr, D.; Shine, J.A.; Carr, D.B. A Comparison of Classification Methods for Large Imagery Data Sets. In Proceedings of the 2002 Joint Statistical Meetings—Statistical Computing Section, New York, NY, USA, 6 August 2002; pp. 3205–3207. [Google Scholar]
  37. The Math Works, Inc. MATLAB. Version R2021a; Computer Software; The Math Works, Inc.: Natick, MA, USA, 2020. [Google Scholar]
  38. van Rossum, G.; Drake, L.F. Python 3 Reference Manual; CreateSpace: Scotts Valley, CA, USA, 2021. [Google Scholar]
  39. Pedregosa, F.; Varoquaux, G.; Gramfort, A.; Michel, V.; Thirion, B.; Grisel, O.; Blondel, M.; Prettenhofer, P.; Weiss, R.; Dubourg, V.; et al. Scikit-Learn: Machine Learning in Python. J. Mach. Learn. Res. 2011, 12, 2825–2830. [Google Scholar]
  40. Freed, Y.; Salviato, M.; Zobeiry, N. Implementation of a Probabilistic Machine Learning Strategy for Failure Predictions of Adhesively Bonded Joints Using Cohesive Zone Modeling. Int. J. Adhes. Adhes. 2022, 118, 103226. [Google Scholar] [CrossRef]
  41. Rasband, W.S. ImageJ. Available online: https://imagej.nih.gov/ij/ (accessed on 8 September 2022).
  42. Owens, D.K.; Wendt, R.C. Estimation of the Surface Free Energy of Polymers. J. Appl. Polym. Sci. 1969, 13, 1741–1747. [Google Scholar] [CrossRef]
  43. OriginPro, Version 2022; OriginLab Corporation: Northampton, MA, USA, 2022.
  44. Zisman, W. Adhesion and Cohesion; Elsevier: Amsterdam, The Netherlands, 1962; p. 176. [Google Scholar]
  45. Wenzel, R.N. Surface Roughness and Contact Angle. J. Phys. Colloid Chem. 1949, 53, 1466–1467. [Google Scholar] [CrossRef]
Figure 1. Standard steps of tool preparation in composites manufacturing: (a) remove residue and create a clean tool surface with mold cleaner, (b) cover surface pores and scratches with mold sealer, (c) minimize tool surface free energy with release agent, and (d) lay-up uncured composite material on the prepared tool.
Jmmp 07 00081 g001
Figure 2. Custom inspection platform for release coating and tool surface evaluation during composites manufacturing. The setup consists of three portable analysis devices integrated into a mechanical gantry system. Each instrument is used in conjunction with machine learning techniques to provide a data-driven tool surface inspection in operational conditions.
Jmmp 07 00081 g002
Figure 3. Schematic overview of the proposed accelerated in situ inspection method of release coating and tool surface condition during composites manufacturing. (a) Pre-production ML models are trained for automatic global image classification (MLC) and low- to high-fidelity sparse measurement correlation (GPR). (b) ML models are referenced in production for sparse measurement optimization and tool surface evaluation. Note that high-fidelity measurements are never needed during production.
Jmmp 07 00081 g003
Figure 4. Digital micrographs showing the behavior of Loctite Frekote B-15 mold sealer and 710-NC release agent during tool preparation and composites processing: (ac) mold sealer and release agent form micro-agglomerations on the tool surface, (d) release coating agglomerations smear during processing due to applied pressure and temperature, and (e) release coating molecules transfer from the tool and contaminate the composite part.
Jmmp 07 00081 g004
Figure 5. (a) Invar tool surface after undergoing twenty autoclave processing cycles without receiving any RA reapplications. Most of the tool surface remains covered with abhesive release coating (opaque) but also contains color-abnormal regions with patches of resin contamination (light) and aged release coating (dark). (b) Enlarged color-abnormal region self-identified by the MLC model to be used later as a target area for sparse evaluations. (c) The target area after pixel classification by the MLC model.
Jmmp 07 00081 g005
Figure 6. Tool surface treated with release coating (a) before and (b) after ColdJet dry ice blasting. The resin contamination border was easily removed using the ColdJet system without damaging the tool surface.
Jmmp 07 00081 g006
Figure 7. DI water droplets immediately after solid–liquid contact with (a) abhesive release coating, (b) aged release coating, (c) resin contamination, and (d) an Invar tool surface after dry ice blasting.
Jmmp 07 00081 g007
Figure 8. Gaussian process regression (GPR) model for predicting surface free energy from the contact angle and aspect ratio of a DI water droplet dispensed on a tool surface. The model can also be used to classify surface conditions (e.g., resin contamination, aged release coating, abhesive release coating) or evaluate a tool’s surface properties after dry ice blasting (e.g., post-DIB data).
Jmmp 07 00081 g008
Figure 9. IR–absorbance spectra illustrating chemical differences between fresh and aged release coatings. The plot also demonstrates how portable analysis results may significantly differ from measurements obtained using laboratory instruments for an unconditioned tool surface.
Jmmp 07 00081 g009
Figure 10. GPR model of 1020 cm−1 absorbance peak intensity in Frekote release coating versus the number of RA layers and processing cycles. The model can be used to predict the surface history or silicone levels on a production tool using portable FTIR measurements.
Jmmp 07 00081 g010
Disclaimer/Publisher’s Note: The statements, opinions and data contained in all publications are solely those of the individual author(s) and contributor(s) and not of MDPI and/or the editor(s). MDPI and/or the editor(s) disclaim responsibility for any injury to people or property resulting from any ideas, methods, instructions or products referred to in the content.

