
Lamellar Spacing Modelling for LPBF Aluminum Parts


1
TECNALIA, Basque Research and Technology Alliance (BRTA), Mikeletegi Pasealekua, 2, E-20009 Donostia-San Sebastián, Spain
2
IMH, Azkue Auzoa 1, E-20870 Elgoibar, Spain
3
Mechanical Engineering Department, Engineering School of Gipuzkoa, University of the Basque Country UPV/EHU, Plaza de Europa, 1, E-20018 Donostia-San Sebastián, Spain
*
Author to whom correspondence should be addressed.
J. Manuf. Mater. Process. 2022, 6(6), 164; https://doi.org/10.3390/jmmp6060164
Submission received: 18 November 2022
/
Revised: 7 December 2022
/
Accepted: 15 December 2022
/
Published: 17 December 2022
Abstract
:The high cooling rates reached during metal additive manufacturing (MAM) generate microstructures very different from those obtained by other conventional manufacturing methods. Therefore, research about the modeling of this type of microstructure is of great interest to the MAM community. In this work, the prediction of the lamellar spacing of an AlSi10Mg sample manufactured by laser powder bed fusion (LPBF), is presented. A multiscale approach is used, combining a CALPHAD (Computer Coupling of Phase Diagrams and Thermochemistry) model to predict the material properties, with a macroscale model of the sample manufacturing and with a microscale model to predict the microstructure. The manufacturing and metallographic characterization of the sample is also included. The results prove that the multiscale strategy followed is a valid approximation to simulate this type of manufacturing process. In addition, it is shown that the use of a generic simulation software focused on metal casting processes can be useful in predicting the lamellar spacing of the microstructure manufactured by LPBF. Finally, the relationship between the cooling rate and the resulting lamellar spacing has been established for this AlSi10Mg under the specific manufacturing conditions considered.
1. Introduction
Additive manufacturing (AM) is a disruptive technology that makes it possible to manufacture geometries that are almost impossible to achieve by other manufacturing methods. This fact, together with its good adaptability to customized production and with the possibility of being integrated into intelligent production systems, makes AM an essential ingredient of Industry 4.0, where it may become a key technology [1]. Although there are still some doubts about its applicability in mass production, the utilization of AM in the industry is on the rise in different sectors such as aerospace, biomedical, automotive, etc. In fact, the overall AM market for metal and polymer systems was valued at 8.33 billion EUR in 2021 with a projected growth of compound annual growth rate (CAGR) of 18.2 % until 2026. Related to the metal AM (MAM) market alone, it was valued at 2.50 billion EUR in 2021 with an expected CAGR of 25.5% until 2026 [2].
The main types of processes used in MAM are powder bed fusion (PBF), direct energy deposition, material jetting, and binder jetting. Considering power bed fusion, the two main technologies of this group are laser powder bed fusion (LPBF), also known as selective laser melting (SLM), and electron beam melting (EBM). The LPBF, one of the most extended in this industry, basically consists of the deposition of a metallic powder layer on a platform and the selective melting of the powder by the laser. Once the layer has been selectively melted, the platform descends, and a new layer of metallic powder is deposited to be selectively melted; this process is repeated until the complete part is manufactured layer by layer [3].
An important constraint of MAM is related to the resultant microstructure of the manufactured part, as it is directly correlated with the material's mechanical performance. The high temperatures reached during the process, together with the extremely fast heating and cooling rates, may promote the appearance of certain microstructures, which are detrimental to the mechanical properties. For example, the fine microstructure that results from high cooling rates can be detrimental to crack propagation resistance in fatigue behavior [4].
In fact, currently, there are only a limited number of alloys that can be processed by MAM since the rest present a poor performance related to hot cracking and/or low mechanical properties [5,6,7,8,9]. Therefore, microstructure prediction is a very useful tool not only to support the process parameter’s optimization but also to help in the development of new alloys more suitable to be used in this manufacturing process.
Several authors have studied different approaches for the modeling of the LPBF. For example, Bidare et al. study the interaction between the laser beam and the powder bed by means of FEM analysis, including the dynamics of the gas and plasma phases for stainless steel 316 L [10]. Acharya et al. developed a model combining a CFD model with a phase-field model to predict the microstructure of the Inconel 718 [11]. Zhang et al. use a 3-D heat transfer finite element model for predicting melt pool dimensions in the LPBF of stainless steel 17-4PH [12]. Denlinger et al. model the thermal behavior of the Inconel 718 during the LPBF manufacturing by means of a 3D Lagrangian transient thermal analysis [13]. There are also works devoted to the particular case of aluminum alloys, although the number is lower. For example, Azizi et al. studied the LPBF of AlSi by means of a phase-field formulation [14], and Rehman et al. studied the spatter formation and splashing-induced defects in AlSi10Mg LPBF [15]. Many others have also made interesting contributions [16,17,18,19,20,21,22].
The motivation of the present work is to contribute to the LPBF modeling by presenting an alternative approach to tackle this type of simulation. In addition, the experimental results by themselves are also an interesting contribution for other researchers interested in this type of manufacturing method.
The research hypothesis is the possibility of predicting the microstructure of an LPBF part through a multiscale and multi-software approach, being one of the software specifically developed for other types of metallic manufacturing processes, where cooling rates are very different from those experimented in LPBF. To validate this hypothesis, the manufacturing process simulation was carried out, combining three different models. One thermodynamic model, one model at the macroscale level representative of LPBF manufacturing, and one model at the microscale level focused on the microstructure evolution. The models have been adjusted, taking as a reference the metallographic study of experimentally manufactured samples.
The main novelty of the approach is the multiscale modeling: the software used to predict the microstructure was not developed for the LPBF microstructures. This approach may be useful for those researchers that have not available specific software tools for this manufacturing process but are interested in their modeling. The work contribution is intended to provide an alternative approach to this type of modeling rather than closing a specific research gap in this topic.
2. Materials and Methods
In order to be able to validate the simulation models developed in this work, sample parts have been manufactured and characterized to evaluate their microstructure experimentally.
The alloy studied is the AlSi10Mg. Its chemical composition has been analyzed by optical emission spectrometry, obtaining the composition shown in Table 1.
2.1. Samples Manufacturing
The sample parts were built using a Samylabs ALBA300 machine (Figure 1), which has a fiber laser with a maximum power output of 250 W and 1080 nm wavelength. The laser spot focalized in the substrate corresponds to a diameter of 71 μm (1/e2 method).
The build chamber was filled with argon (purity level 99.999%) before operation and a constant shielding gas flow was used during the build for spatter removal following [23]. The oxygen content in the build chamber was maintained below 0.43 vol% (4300 ppm) during the process following [24,25].
The samples were built directly on EN AW-5083 aluminum substrate without preheating because the equipment in which the experiment was carried out does not have a substrate heater. The 20 mm thick substrate plate functioned as a heatsink to allow heat to be conducted away from the samples.
The manufacturing path was generated by SamyStudio 5.1 software using a powder layer thickness of 25 µm. Different parameters were set for the core and the edge of the part to improve part density and surface quality (Figure 2). The core was built by a bidirectional meander hatching pattern with 67 degrees clockwise turn between layers. The edge of the part was built by a single contour path.
The core parameters used for the manufacturing of the samples were 800 mm/s scanning speed, continuous 250 W laser power and 0.15 mm hatch width. These process parameter values were set by the previous Box–Behnken Design of Experiments analysis optimized for minimizing porosity. More information about Box-Behnken Design of Experiments can be found at [26]. The contour path was built by 800 mm/s scanning speed, continuous 200 W laser power and 0.07 mm contour distance, which were determined based on previous works.
The sample geometry was designed in order to avoid additional support structures, to rule out any effect they might have on the finished part, and to facilitate the manual removal of parts from the substrate (Figure 3).
2.2. Metallographic Characterization
Metallographic samples were prepared in three different planes (Figure 4) to check the relationship of microstructure–direction, assuming that the components manufactured by LPBF show a high anisotropic temperature dependence.
Samples were prepared according to the classical method [27]: resin embedded, polished, and etched (2 mL of HF, 3 mL of HCl, 5 mL of HNO3, and 190 mL of water). The observation of microstructures was performed by means of light (bright and dark fields) and electronic microscopy.
2.3. Modeling
A multiscale approach has been used to model the microstructure evolution. First, the thermo-physical material properties have been calculated based on the alloy's chemical composition. Next, the sample manufacturing process has been simulated by means of a macroscale simulation, taking into account the previously calculated material properties. Afterwards, the temperature profiles obtained as a result of the macroscale modeling have been used to define boundary conditions that, applied to the microstructure evolution model, produce equivalent cooling rates in the material (see Figure 5).
2.3.1. Thermo–Physical Material Properties Calculation
Material properties have been calculated by a CALPHAD (Computer Coupling of Phase Diagrams and Thermochemistry) based modeling.
The CALPHAD methodology is based on computational thermodynamics models, which use experimental information collected for binary and ternary subsystems to extrapolate the properties of higher order alloys (multicomponent systems), predicting aspects like the phases or some thermo-physical properties, such as, for example, the density or the enthalpy among others [28].
In this case, commercial CALPHAD software [29] has been used to calculate the material properties of the alloy. A microsegregation model known as back diffusion has been used to predict the material properties, assuming a cooling rate according to values found in the bibliography for the LPBF process (750 ×·103 K/s) [30] and the chemical composition previously measured (Table 1). The back diffusion model [31] can be considered a balance between the well-known lever rule model (which considers a complete mixing of the solute in the solid, that is a very good diffusion) [32] and the Scheil model (which assumes no diffusion at all in the solid phase) [33]. The solid fraction curve has been obtained together with the density, the thermal conductivity, and the enthalpy, all of them temperature-dependent (Figure 6).
The software used to model the LPBF process is not able to work with temperature-dependent properties, therefore, considering the fast solidification rates and the punctual heat source, the average value at solid state has been used for the density and the thermal conductivity. The temperature corresponding to 50% of the solid fraction has been assumed as the melting point. Another restraint of the software is the requirement to use the specific heat value instead of the enthalpy value . Therefore, the specific heat curve has been calculated from the enthalpy curve at solid-state, following Equation (1), where represents the temperature, and its average value has been used in the simulation.
2.3.2. Sample Manufacturing Modeling
The sample manufacturing has been modeled by means of commercial software specifically developed for the LPBF simulation [34]. The sample geometry is a small cube with a pyramidal support whose dimensions can be seen in Figure 7 (left).
The manufacturing process has been modeled considering the experimental conditions previously detailed in Section 2.1. The model includes the powder layers deposition and the heat transfer phenomena, including the powder fusion by the laser and the cooling.
Referring to the boundary conditions, the convection coefficient has been fixed to a value equivalent to natural convection (12.7 W/m2K). The power absorption is included as a percentage, and it has been fixed at 11%. The process conditions correspond to those used during the part manufacturing (Table 2).
The main phenomenon considered in the simulation is heat transfer, therefore, the main equation solved is the heat transfer equation shown in (2).
The model is solved by the finite element method. Although our interest is focused on the thermal behavior during the LPBF manufacturing, the thermo-mechanical solver has been used due to its better stability when compared with the stability of the thermal solver alone, included in the software. In fact, using the thermal software alone, convergence problems were experienced that prevented its use in this case.
Referring to the material properties, the melting point, the density, the thermal conductivity, and the specific heat values previously calculated have been used (Table 3). The emissivity value corresponds to the default value included in the software database for this alloy. For the mechanical properties (Young’s modulus, Poisson ratio, etc.), the default values included in the database for this alloy have been used.
The geometry has been discretized by a regular mesh formed by voxel elements with 0.25 mm side (Figure 7 right); this size is 10 times bigger than the powder layer thickness, but it has not been possible to employ smaller elements due to software limitations.
The temperature–time curve of every node has been extracted and processed to obtain the solidification cooling rate (SCR), which has been calculated following Equation (3), where represents temperatures expressed in K and represent times expressed in seconds. The SCR is expressed in K/s.
The SCR distribution in the manufactured part has been analyzed by applying clustering techniques. More precisely, a KMeans algorithm has been used to classify the cooling rates in 5 different clusters. KMeans is a classification algorithm that clusters the data by trying to separate the samples in groups of equal variance, minimizing a criterion known as the inertia or within-cluster sum-of-squares [35].
2.3.3. Microstructure Prediction
The final objective is to predict the lamellar spacing of the microstructure. Considering that the magnitude order expected for the lamellar spacing is microns, a reduced model based on a representative volume element (RVE) has been used to equilibrate the use of a mesh smooth enough with a reasonable calculation time.
The RVE used is a cube 0.25 mm side, whose height is equivalent to 10 powder layers (0.025 mm/layer). It has been drawn and discretized by a finite element mesh formed by tetrahedral elements 0.025 mm side, giving a mesh formed by 1479 nodes and 6786 elements (Figure 8 left).
Commercial software specifically developed for metal casting simulations [36] has been used to predict the microstructure. As a consequence, some assumptions must be made in order to set up the case to be representative of the LPBF process. The idea is to reproduce only the solidification process. For this reason, the initial temperature of the alloy has been fixed, equal to liquidus temperature (585 °C), and a heat extraction boundary condition has been applied to the top surface of the RVE (Figure 8 right).
The heat extraction boundary condition has been adjusted to produce an SCR in the RVE similar to the values predicted in the LPBF process simulation, following equation (4). Considering a volume equal to , an average value in the solidification range for the density and the specific heat and a SCR equal to (see Section 3), a value equal to is obtained.
The main governing equations of the physics involved in alloy cooling and solidification, for this case, are the heat transfer Equation (2) and the nucleation and growth of the grains. The software solves the nucleation and growth of the grains following Equations (5) and (6) proposed by Oldfield [37], where is the number of nuclei, and are the nucleation constants, is the temperature, is the growth, and is the growth coefficient.
Material properties were calculated by the CALPHAD method previously mentioned, but the values of the nucleation and growth constants must be adjusted depending on the alloy, the cooling rate, the metal treatment, etc. In this case, an optimization algorithm has been used to adjust them.
The model adjustment can be considered an optimization problem, where the objective is to minimize the differences between the values predicted by the simulation and the reference values measured experimentally. This is achieved modifying the values assigned to the variables to be correlated (in this case, the nucleation and growth constants) until the value predicted (in this case, the lamellar spacing) matches the values measured experimentally. This minimization can be made by manually modifying the values assigned to the variables [38,39,40,41] or by means of optimization algorithms. Several authors have explored the use of different types of optimization algorithms for model adjustments [42,43,44,45,46,47,48] in different fields. In this case, the NEWUOA algorithm included in the Python Parallel Global Multiobjective Optimizer [49] was used to perform the adjustment. NEWUOA is a deterministic local optimization algorithm developed by M.F.D. Powell is well known for his work in numerical analysis, especially in optimization [50].
3. Results and Discussion
3.1. Metalographycal Characterization
The microstructure in planes YZ and XZ, as defined in Figure 4, shows a structure very similar to those obtained in a typical welding process. The different weld seams can be observed in Figure 9.
In the plane XY, a different pattern can be observed (Figure 10). This is more related to the welding path along the laser beam movement on the upper surface of the sample (diagonally interlaced).
To have a closer view of the microstructure, samples were observed in a scanning electron microscope. The images (Figure 11) showed a needle-like structure (eutectic type) quite typical in fast-cooled metals. These needles appear finer in the core of the weld seam and slightly coarser in the border of adjacent seams.
The interlamellar spacing of the needles was measured in different regions of the sample in the weld seam. The measurement was performed using image analysis software. The mean value obtained for this interlamellar spacing is 0.71 microns (710 nm).
Assuming a behavior similar to those of the needle-like structures (as for example martensite, or perlite), this spacing could be inversely related to the mechanical strength of the material. That is, the smaller the lamellar space, the higher the mechanical strength.
3.2. Sample Manufacturing Simulation
3.3. Microstructure Modeling
A preliminary estimation of the nucleation and growth parameters has been made by obtaining an average lamellar spacing estimation equal to . This value gives an error of only 2.5% compared with the measured experimentally. In any case, the model has been adjusted by means of the optimization algorithm, improving its accuracy. The algorithm has reduced the average error to 3.01·× 10−5, as can be seen in Figure 14. The values finally assigned for the nucleation parameters are shown in Table 4.
The values obtained for nodes near the RVE top surface present some dispersion due to their proximity to the extreme boundary condition applied. Therefore, these three nodes have been removed from the results.
Figure 15 shows the relationship between the nodes' location and the cooling rates reached in them and between the nodes' location and the lamellar spacing predicted.
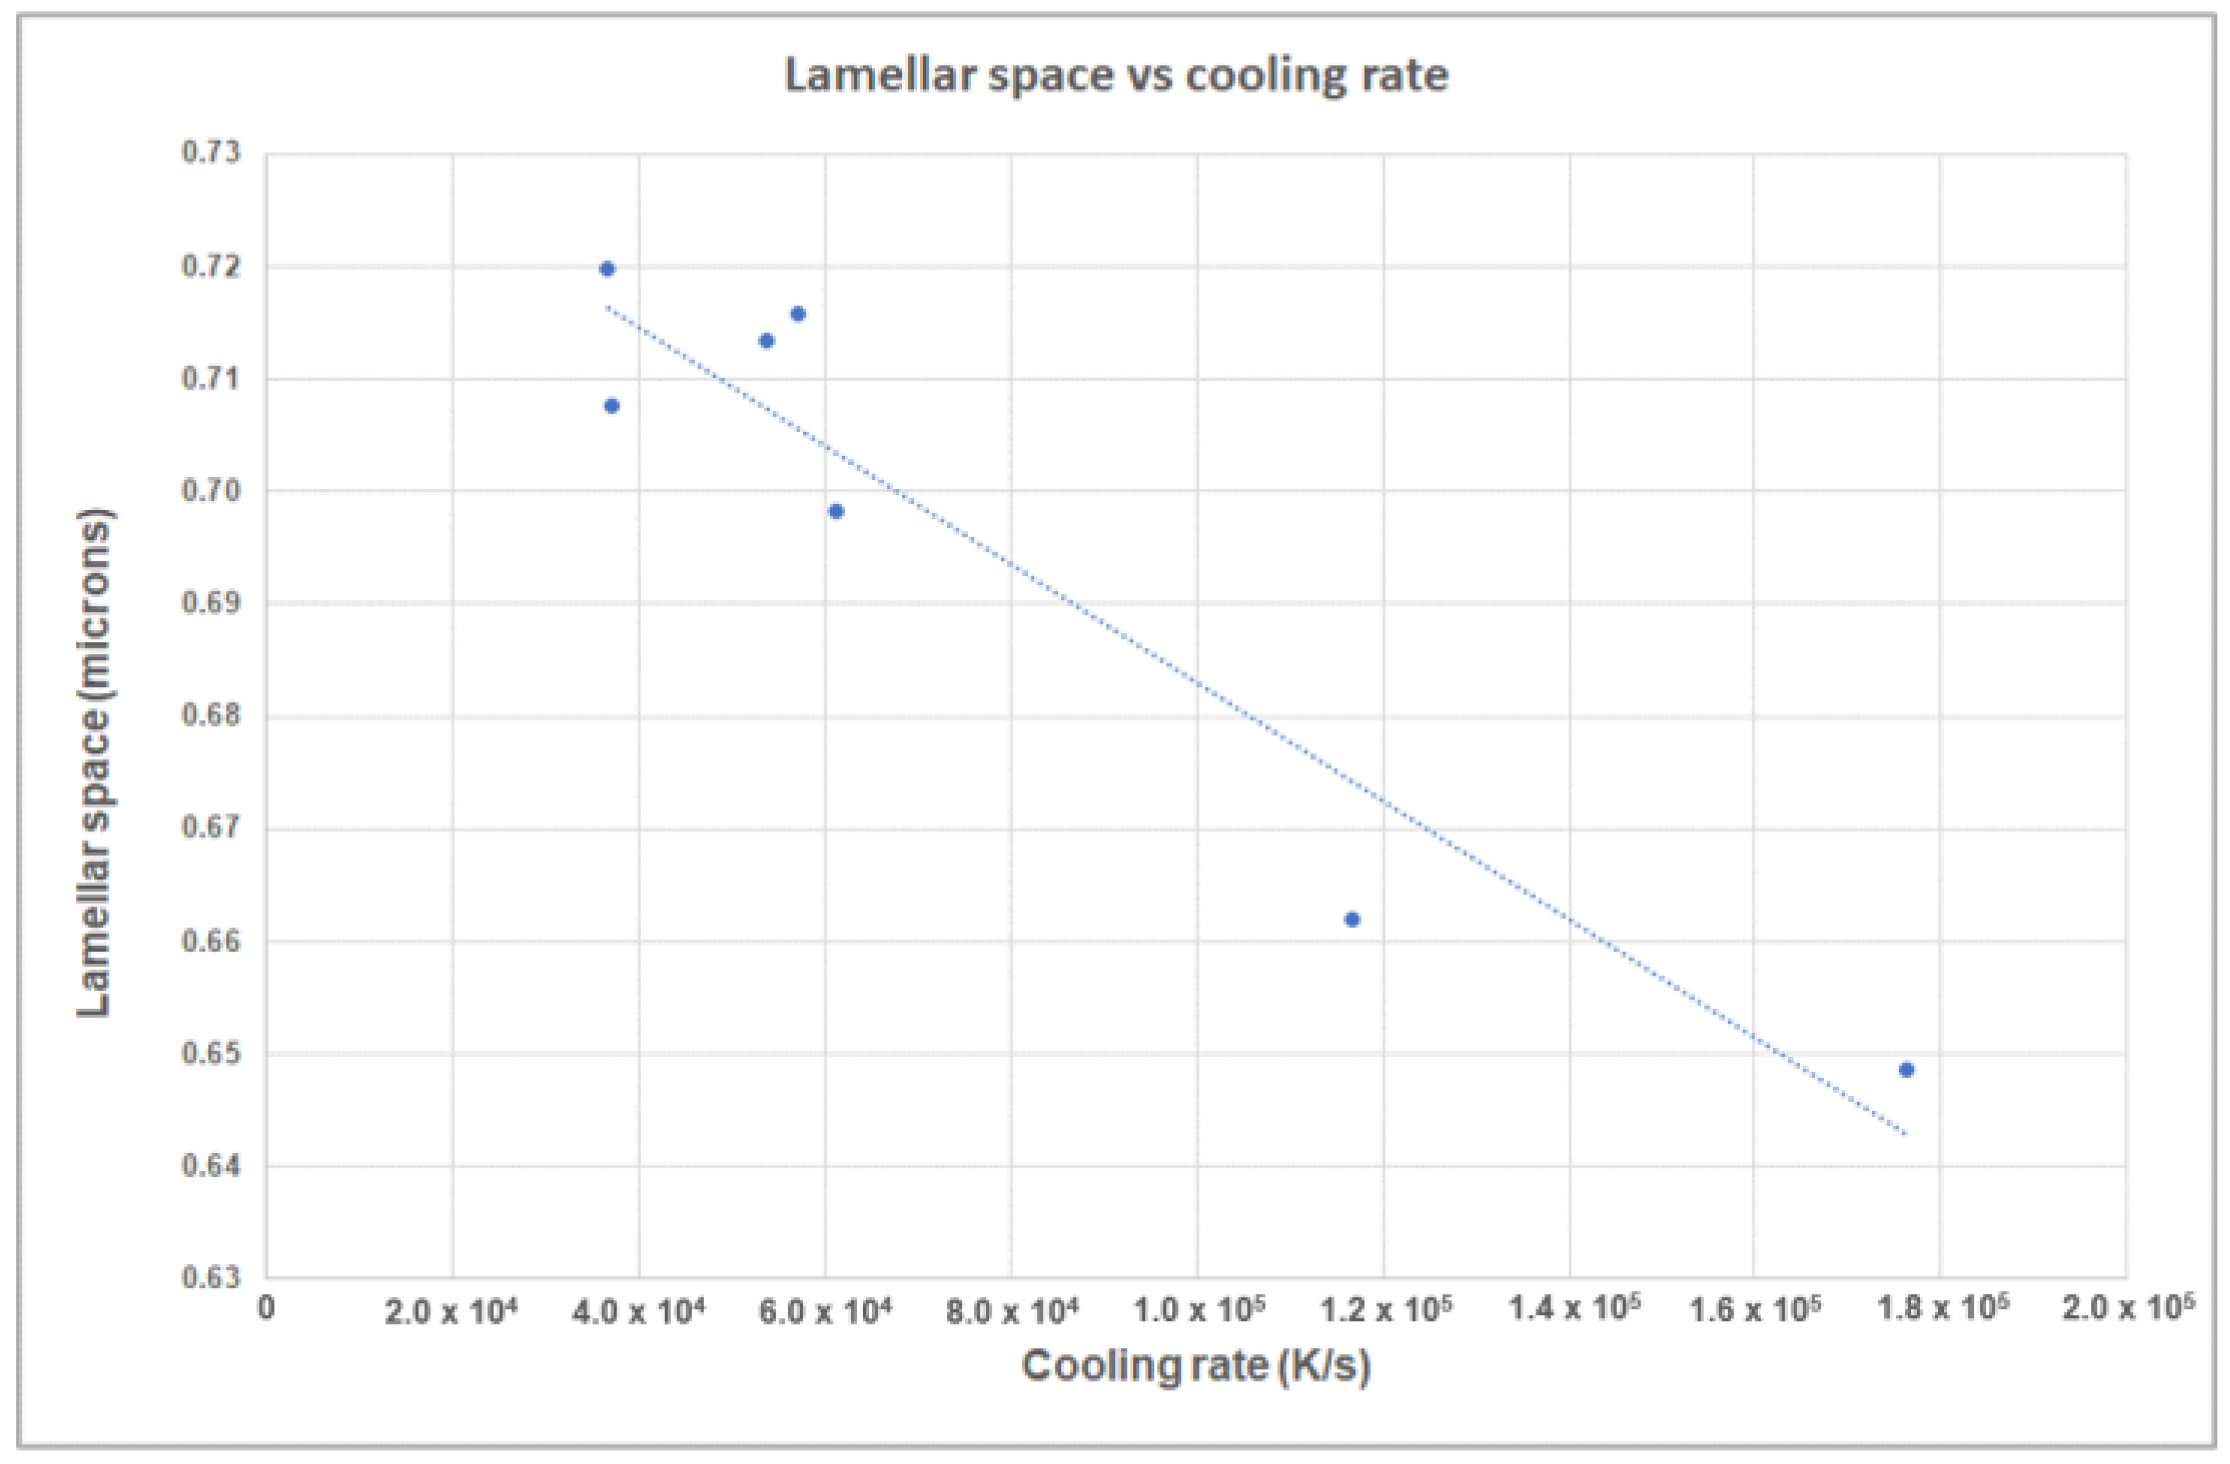
Figure 16 shows the relationship between the cooling rate and the lamellar spacing.
These results show that a multiscale approach combining the CALPHAD modeling, the macroscale modeling of the sample manufacturing by LPBF, and the microscale modeling of the microstructure evolution is a valid approximation to predict the lamellar spacing of the sample manufactured by LPBF.
This approach may be useful for those researchers that have not available specific software tools specifically written for this manufacturing process but are interested in its modeling.
4. Conclusions
The LPBF manufacturing of the AlSi10Mg under the studied process conditions (800 mm/s scanning speed, continuous 250 W laser power, and 0.15 mm hatch width) shows a structure very similar to those obtained in a typical welding process, where different weld seams are observed.
Under these process conditions, the manufacturing has produced a very fine needle-like microstructure with lamellar spacing values of about . For the conditions studied, it has been possible to produce crack-free parts without using preheating.
A generic simulation software specifically developed for metal casting processes can be used to predict the lamellar spacing of the microstructure manufactured by LPBF.
The values adjusted for the nucleation parameters (nucleation constants: ; and the growth coefficient = ) have shown to be appropriate to predict the lamellar spacing value of the manufactured sample by LPBF.
The multiscale approach followed combining the CALPHAD modeling, the macroscale modeling of the sample manufacturing by LPBF, and the microscale modeling of the lamellar spacing has been proved as a valid approximation to predict the lamellar spacing of the sample manufactured by LPBF.
This approach may be useful for those researchers that have not available specific software tools for this manufacturing process but are interested in their modeling.
The relationship between the cooling rate reached and the resulting lamellar spacing has been established for this type of alloy (AlSi10Mg) and the manufacturing conditions considered.
Author Contributions
Conceptualization, E.A.; methodology, E.A., J.C.G., M.A. and X.C.; validation, E.A., J.C.G., M.A. and X.C.; writing E.A., J.C.G., M.A. and I.G.; funding acquisition, E.A., J.C.G., M.A., X.C. and I.G. All authors have read and agreed to the published version of the manuscript.
Funding
This work was supported by the ICME project, which has received funding from the Basque Government under the ELKARTEK Program (KK-2021/00022).
Data Availability Statement
Not applicable.
Conflicts of Interest
The authors declare no conflict of interest.
References
- Dilberoglu, U.M.; Gharehpapagh, B.; Yaman, U.; Dolen, M. The Role of Additive Manufacturing in the Era of Industry 4.0. Procedia Manuf. 2017, 11, 545–554. [Google Scholar] [CrossRef]
- AMPOWER. AMPOWER REPORT 2022; AMPOWER: Hamburg, Germany, 2022. [Google Scholar]
- Yap, C.Y.; Chua, C.K.; Dong, Z.L.; Liu, Z.H.; Zhang, D.Q.; Loh, L.E.; Sing, S.L. Review of Selective Laser Melting: Materials and Applications. Appl. Phys. Rev. 2015, 2, 041101. [Google Scholar] [CrossRef]
- Michi, R.A.; Plotkowski, A.; Shyam, A.; Dehoff, R.R.; Babu, S.S. Towards High-Temperature Applications of Aluminium Alloys Enabled by Additive Manufacturing. Int. Mater. Rev. 2022, 67, 298–345. [Google Scholar] [CrossRef]
- Jia, Q.; Rometsch, P.; Cao, S.; Zhang, K.; Wu, X. Towards a High Strength Aluminium Alloy Development Methodology for Selective Laser Melting. Mater. Des. 2019, 174, 107775. [Google Scholar] [CrossRef]
- Mertens, A.; Delahaye, J.; Dedry, O.; Vertruyen, B.; Tchuindjang, J.T.; Habraken, A.M. Microstructure and Properties of SLM AlSi10Mg: Understanding the Influence of the Local Thermal History. Procedia Manuf. 2020, 47, 1089–1095. [Google Scholar] [CrossRef]
- Rao, H.; Giet, S.; Yang, K.; Wu, X.; Davies, C.H.J. The Influence of Processing Parameters on Aluminium Alloy A357 Manufactured by Selective Laser Melting. Mater. Des. 2016, 109, 334–346. [Google Scholar] [CrossRef]
- Wang, P.; Li, H.C.; Prashanth, K.G.; Eckert, J.; Scudino, S. Selective Laser Melting of Al-Zn-Mg-Cu: Heat Treatment, Microstructure and Mechanical Properties. J. Alloy. Compd. 2017, 707, 287–290. [Google Scholar] [CrossRef]
- Olakanmi, E.O.; Cochrane, R.F.; Dalgarno, K.W. A Review on Selective Laser Sintering/Melting (SLS/SLM) of Aluminium Alloy Powders: Processing, Microstructure, and Properties. Prog. Mater. Sci. 2015, 74, 401–477. [Google Scholar] [CrossRef]
- Bidare, P.; Bitharas, I.; Ward, R.M.; Attallah, M.M.; Moore, A.J. Fluid and Particle Dynamics in Laser Powder Bed Fusion. Acta Mater. 2018, 142, 107–120. [Google Scholar] [CrossRef]
- Acharya, R.; Sharon, J.A.; Staroselsky, A. Prediction of Microstructure in Laser Powder Bed Fusion Process. Acta Mater. 2017, 124, 360–371. [Google Scholar] [CrossRef]
- Zhang, Z.; Huang, Y.; Kasinathan, A.R.; Shahabad, S.I.; Ali, U.; Mahmoodkhani, Y.; Toyserkani, E. 3-Dimensional Heat Transfer Modeling for Laser Powder-Bed Fusion Additive Manufacturing with Volumetric Heat Sources Based on Varied Thermal Conductivity and Absorptivity. Opt. Laser Technol. 2019, 109, 297–312. [Google Scholar] [CrossRef]
- Denlinger, E.R.; Jagdale, V.; Srinivasan, G.V.; El-Wardany, T.; Michaleris, P. Thermal Modeling of Inconel 718 Processed with Powder Bed Fusion and Experimental Validation Using in Situ Measurements. Addit. Manuf. 2016, 11, 7–15. [Google Scholar] [CrossRef]
- Azizi, H.; Ebrahimi, A.; Ofori-Opoku, N.; Greenwood, M.; Provatas, N.; Mohammadi, M. Characterizing the Microstructural Effect of Build Direction during Solidification of Laser-Powder Bed Fusion of Al-Si Alloys in the Dilute Limit: A Phase-Field Study. Acta Mater. 2021, 214, 116983. [Google Scholar] [CrossRef]
- Rehman, A.U.; Mahmood, M.A.; Ansari, P.; Pitir, F.; Salamci, M.U.; Popescu, A.C.; Mihailescu, I.N. Spatter Formation and Splashing Induced Defects in Laser-Based Powder Bed Fusion of AlSi10Mg Alloy: A Novel Hydrodynamics Modelling with Empirical Testing. Metals 2021, 11, 2023. [Google Scholar] [CrossRef]
- Gokcekaya, O.; Ishimoto, T.; Hibino, S.; Yasutomi, J.; Narushima, T.; Nakano, T. Unique Crystallographic Texture Formation in Inconel 718 by Laser Powder Bed Fusion and Its Effect on Mechanical Anisotropy. Acta Mater. 2021, 212, 116876. [Google Scholar] [CrossRef]
- Zhang, Y.; Jung, Y.G.; Zhang, J. Multiscale Modeling of Additively Manufactured Metals; Elsevier: Amsterdam, The Netherlands, 2020. [Google Scholar]
- Shao, W.; He, B.; Qiu, C.; Li, Z. Effect of Hatch Spacing and Laser Remelting on the Formation of Unique Crystallographic Texture of IN718 Superalloy Fabricated via Laser Powder Bed Fusion. Opt. Laser Technol. 2022, 156, 108609. [Google Scholar] [CrossRef]
- Foteinopoulos, P.; Papacharalampopoulos, A.; Stavropoulos, P. On Thermal Modeling of Additive Manufacturing Processes. CIRP J. Manuf. Sci. Technol. 2018, 20, 66–83. [Google Scholar] [CrossRef]
- Stavropoulos, P.; Foteinopoulos, P. Modelling of Additive Manufacturing Processes: A Review and Classification. Manuf. Rev. 2018, 5, 2. [Google Scholar] [CrossRef] [Green Version]
- Foteinopoulos, P.; Papacharalampopoulos, A.; Angelopoulos, K.; Stavropoulos, P. Development of a Simulation Approach for Laser Powder Bed Fusion Based on Scanning Strategy Selection. Int. J. Adv. Manuf. Technol. 2020, 108, 3085–3100. [Google Scholar] [CrossRef]
- Stavropoulos, P.; Foteinopoulos, P.; Papapacharalampopoulos, A. On the Impact of Additive Manufacturing Processes Complexity on Modelling. Appl. Sci. 2021, 11, 7743. [Google Scholar] [CrossRef]
- Fiedler, T.; Dörries, K.; Rösler, J. Selective Laser Melting of Al and AlSi10Mg: Parameter Study and Creep Experiments. Prog. Addit. Manuf. 2022, 7, 583–592. [Google Scholar] [CrossRef]
- Snopiński, P.; Woźniak, A.; Pagáč, M. Microstructural Evolution, Hardness, and Strengthening Mechanisms in SLM AlSi10Mg Alloy Subjected to Equal-Channel Angular Pressing (ECAP). Materials 2021, 14, 7598. [Google Scholar] [CrossRef] [PubMed]
- Aboulkhair, N.T.; Everitt, N.M.; Ashcroft, I.; Tuck, C. Reducing Porosity in AlSi10Mg Parts Processed by Selective Laser Melting. Addit. Manuf. 2014, 1–4, 77–86. [Google Scholar] [CrossRef]
- Lawson, J. Design and Analysis of Experiments with R; Texts in Statistical Science Series; CRC Press: New York, NY, USA, 2015; ISBN 978-1-4987-2848-5. [Google Scholar]
- ASTM E407-07(2015)E1; Standard Practice for Microetching Metals and Alloys. ASTM: West Conshohocken, PA, USA, 2015.
- Liu, Z.-K. First-Principles Calculations and CALPHAD Modeling of Thermodynamics. J. Phase Equilibria Diffus. 2009, 30, 517–534. [Google Scholar] [CrossRef]
- CompuTherm LLC. CompuTherm; CompuTherm LLC: Middleton, WI, USA.
- Majeed, M.; Khan, H.M.; Rasheed, I. Finite Element Analysis of Melt Pool Thermal Characteristics with Passing Laser in SLM Process. Optik 2019, 194, 163068. [Google Scholar] [CrossRef]
- Larouche, D. Computation of Solidification Paths in Multiphase Alloys with Back-Diffusion. Calphad 2007, 31, 490–504. [Google Scholar] [CrossRef]
- Bennett, L.H.; Carter, G.C. Enhanced Lever Rule for High-Precision Phase Diagram Determination. Met. Mater. Trans. B 1971, 2, 3079–3081. [Google Scholar] [CrossRef]
- Chen, S.-L.; Yang, Y.; Chen, S.-W.; Lu, X.-G.; Chang, Y.A. Solidification Simulation Using Scheil Model in Multicomponent Systems. J. Phase Equilibria Diffus. 2009, 30, 429–434. [Google Scholar] [CrossRef]
- Altair Inspire Print3D. Available online: https://www.altair.com.es/inspire-print3d/ (accessed on 1 December 2022).
- Pedregosa, F.; Varoquaux, G.; Gramfort, A.; Michel, V.; Thirion, B.; Grisel, O.; Blondel, M.; Müller, A.; Nothman, J.; Louppe, G.; et al. Scikit-learn: Machine Learning in Python. J. Mach. Learn. Res. 2011, 12, 2825–2830. [Google Scholar] [CrossRef]
- ESI Group. ProCAST. 2019. Available online: https://www.esi-group.com/products/casting (accessed on 1 December 2022).
- Oldfield, W. Freezing of Cast Irons. ASM Trans. 1966, 59, 945–959. [Google Scholar]
- Anglada, E.; Meléndez, A.; Vicario, I.; Arratibel, E.; Aguillo, I. Adjustment of a High Pressure Die Casting Simulation Model against Experimental Data. Procedia Eng. 2015, 132, 966–973. [Google Scholar] [CrossRef]
- Trinoga, M. Development of an Automated Thermal Model Correlation Tool. In Proceedings of the 28th European Space Thermal Analysis Workshop, Noordwijk, The Netherlands, 14–15 October 2014; pp. 201–212. [Google Scholar]
- Welch, J.W. Thermal Testing. In Spacecraft Thermal Control Handbook; Gilmore, D.G., Ed.; The Aerospace Press: El Segundo, CA, USA, 2002; pp. 713–758. ISBN 1-884989-11-X. [Google Scholar]
- Anglada, E.; Meléndez, A.; Maestro, L.; Dominguez, I. Adjustment of Numerical Simulation Model to the Investment Casting Process. Procedia Eng. 2013, 63, 75–83. [Google Scholar] [CrossRef] [Green Version]
- Anglada, E.; Garmendia, I. Correlation of Thermal Mathematical Models for Thermal Control of Space Vehicles by Means of Genetic Algorithms. Acta Astronaut. 2015, 108, 1–17. [Google Scholar] [CrossRef]
- Anglada, E.; Martinez-Jimenez, L.; Garmendia, I. Performance of Gradient-Based Solutions versus Genetic Algorithms in the Correlation of Thermal Mathematical Models of Spacecrafts. Int. J. Aerosp. Eng. 2017, 2017, 7683457. [Google Scholar] [CrossRef]
- Garmendia, I.; Anglada, E. Thermal Parameters Identification in the Correlation of Spacecraft Thermal Models against Thermal Test Results. Acta Astronaut. 2022, 191, 270–278. [Google Scholar] [CrossRef]
- Anglada, E.; Meléndez, A.; Obregón, A.; Villanueva, E.; Garmendia, I. Performance of Optimization Algorithms in the Model Fitting of the Multi-Scale Numerical Simulation of Ductile Iron Solidification. Metals 2020, 10, 1071. [Google Scholar] [CrossRef]
- Klement, J.; Anglada, E.; Garmendia, I. Advances in Automatic Thermal Model to Test Correlation in Space Industry. In Proceedings of the 46th International Conference on Environmental Systems, Lubbock, TX, USA, 10–14 July 2016; pp. 1–11. [Google Scholar]
- Torralbo, I.; Perez-Grande, I.; Sanz-Andrés, A.; Piqueras, J. Correlation of Thermal Mathematical Models to Test Data Using Jacobian Matrix Formulation. In Proceedings of the 48th International Conference on Environmental Systems iICES-2018, Alburquerque, NM, USA, 8–12 July 2018; Volume ICES-2018-, p. 11. [Google Scholar]
- Beck, T.; Bieler, A.; Thomas, N. Numerical Thermal Mathematical Model Correlation to Thermal Balance Test Using Adaptive Particle Swarm Optimization (APSO). Appl. Eng. 2012, 38, 168–174. [Google Scholar] [CrossRef]
- Biscani, F.; Izzo, D. A parallel global multiobjective framework for optimization: Pagmo. J. Open Source Software. 2020, 5(53), 2338. [Google Scholar] [CrossRef]
- Powell, M.J.D. The NEWUOA Software for Unconstrained Optimization with Derivatives. In Large-Scale Nonlinear Optimization; di Pillo, G., Roma, M., Eds.; Springer: New York, NY, USA, 2006; pp. 255–297. ISBN 978-0387-30063-4. [Google Scholar]
- Jägle, E.A.; Sheng, Z.; Wu, L.; Lu, L.; Risse, J.; Weisheit, A.; Raabe, D. Precipitation Reactions in Age-Hardenable Alloys During Laser Additive Manufacturing. JOM 2016, 68, 943–949. [Google Scholar] [CrossRef] [Green Version]
- Pauly, S.; Wang, P.; Kühn, U.; Kosiba, K. Experimental Determination of Cooling Rates in Selectively Laser-Melted Eutectic Al-33Cu. Addit Manuf. 2018, 22, 753–757. [Google Scholar] [CrossRef]
Figure 1.
Samylabs ALBA300 machine at IMH Campus.
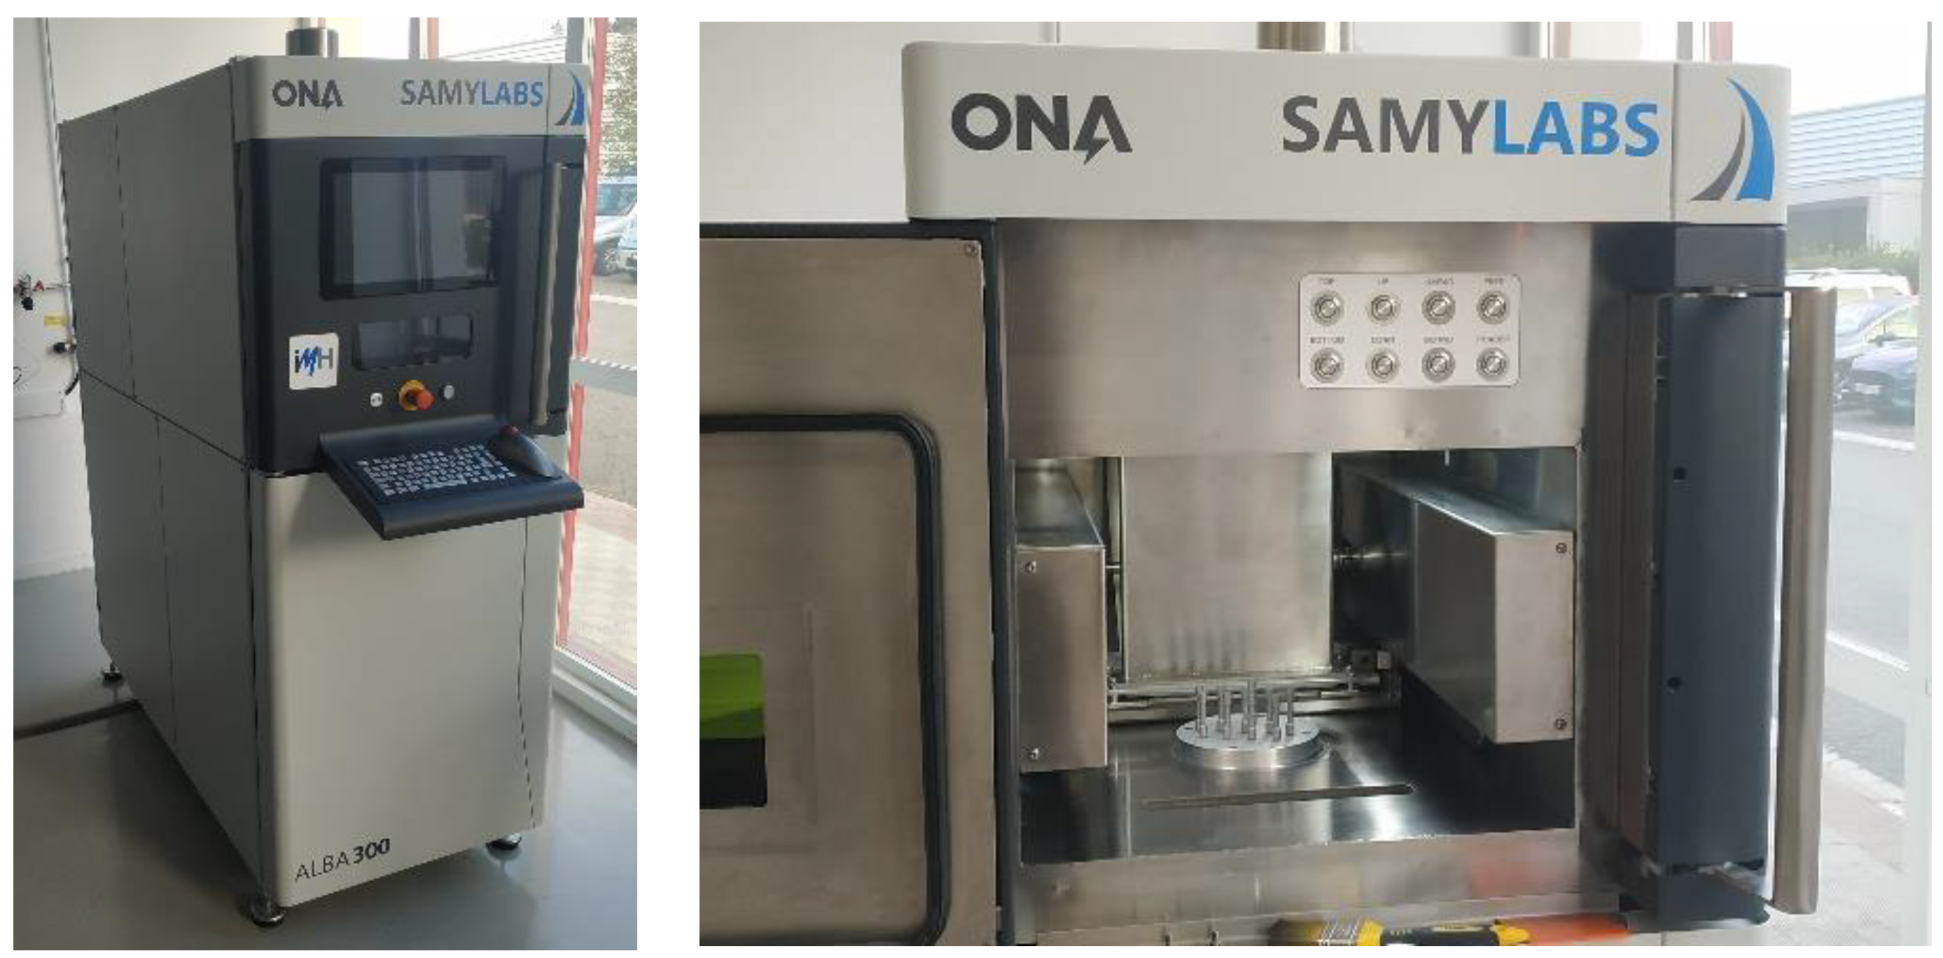
Figure 2.
Manufacturing path strategy: layer path and part path.

Figure 3.
Manufactured samples for metallographic characterization.
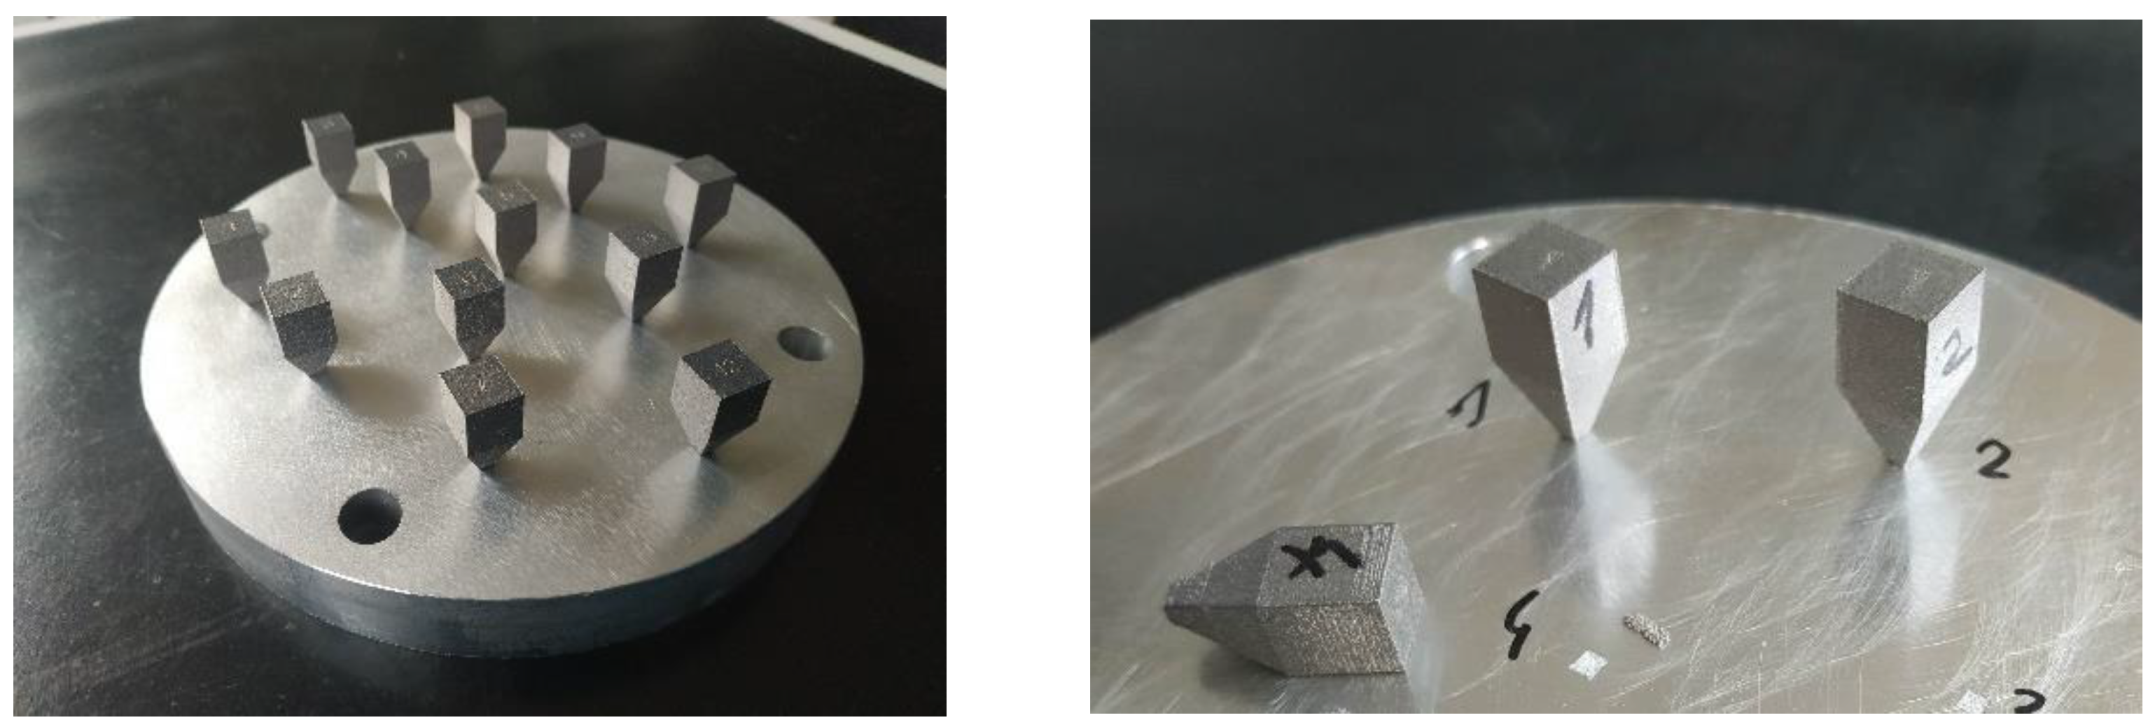
Figure 4.
Cutting planes to carry out the microstructure inspection.
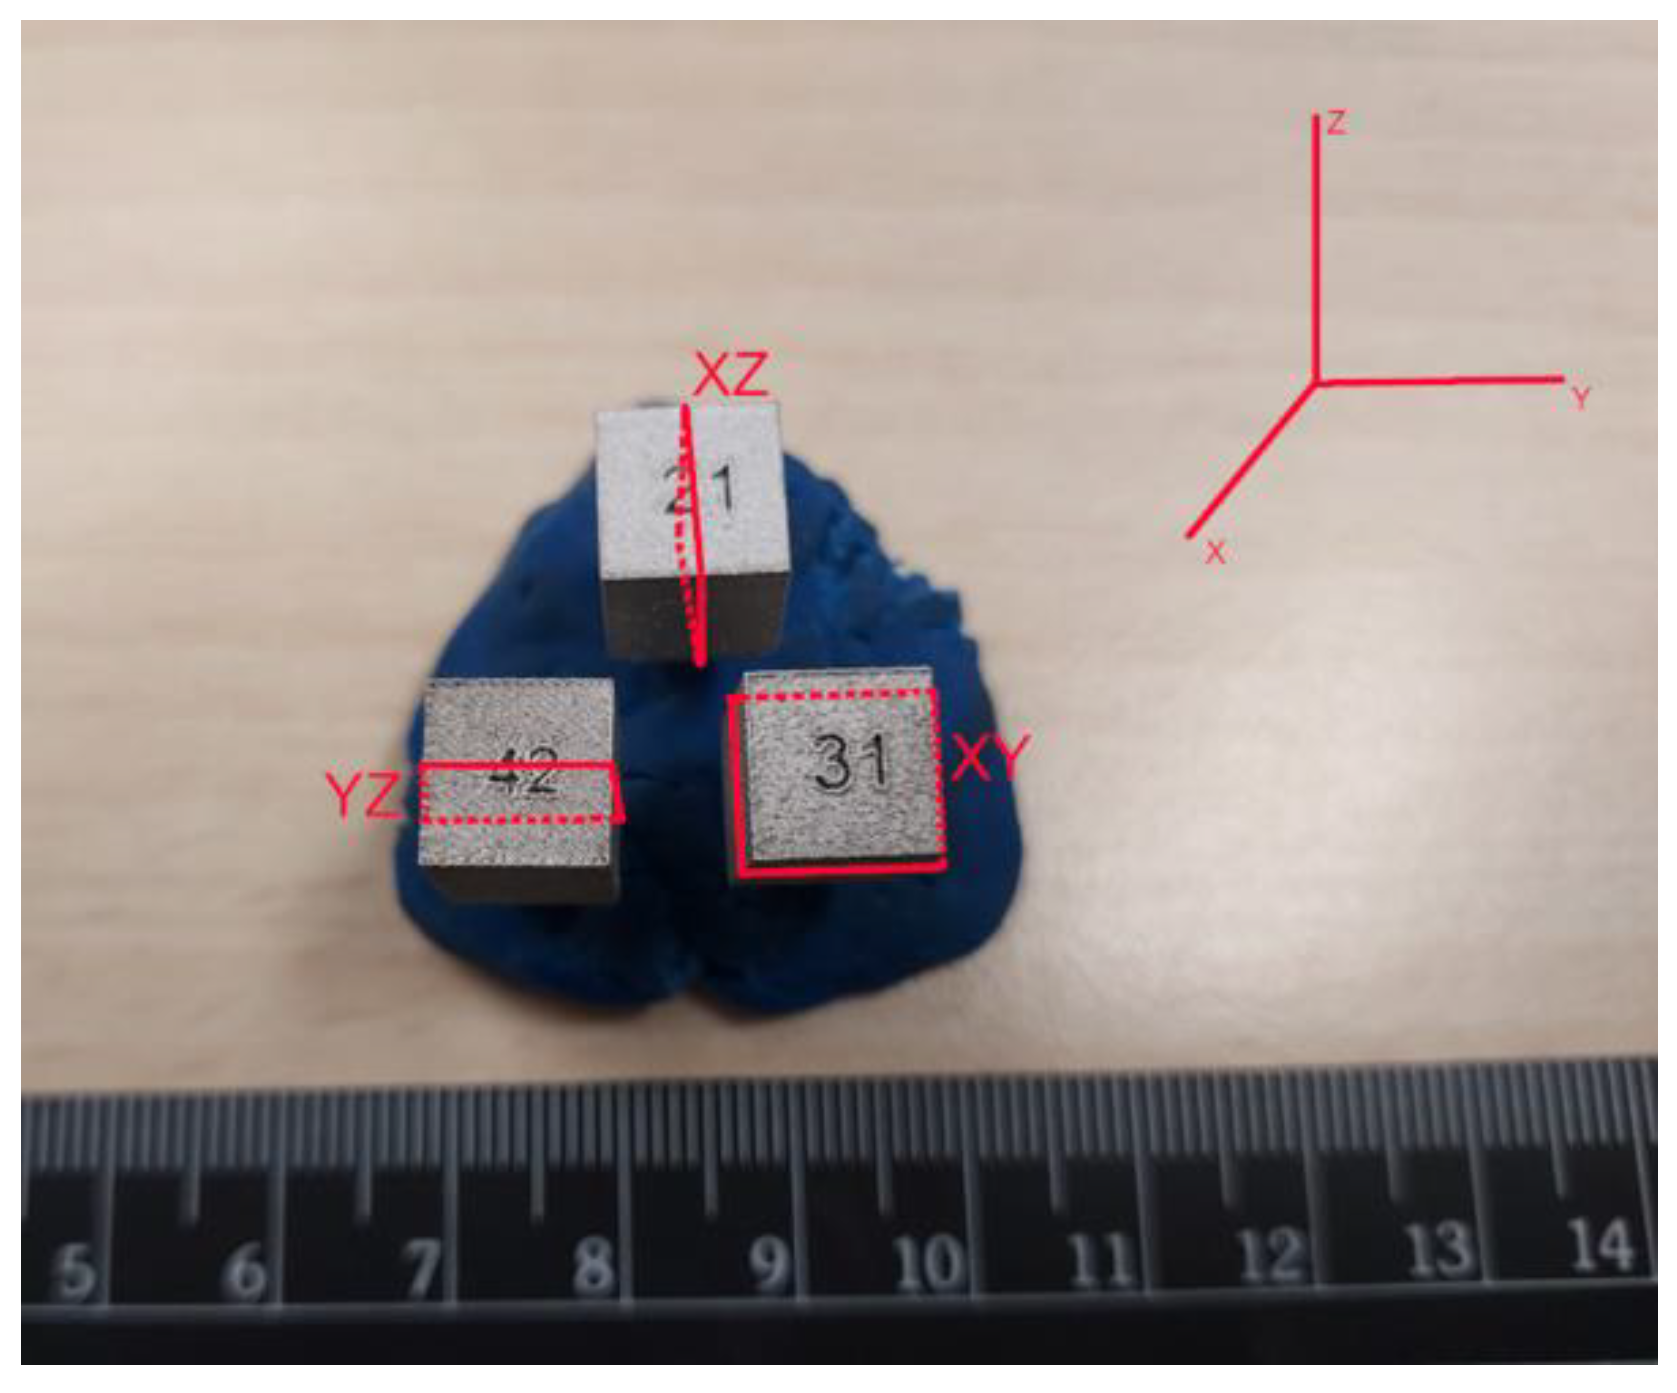
Figure 5.
Flow chart of the multiscale models' connection.

Figure 6.
Thermo-physical properties obtained.
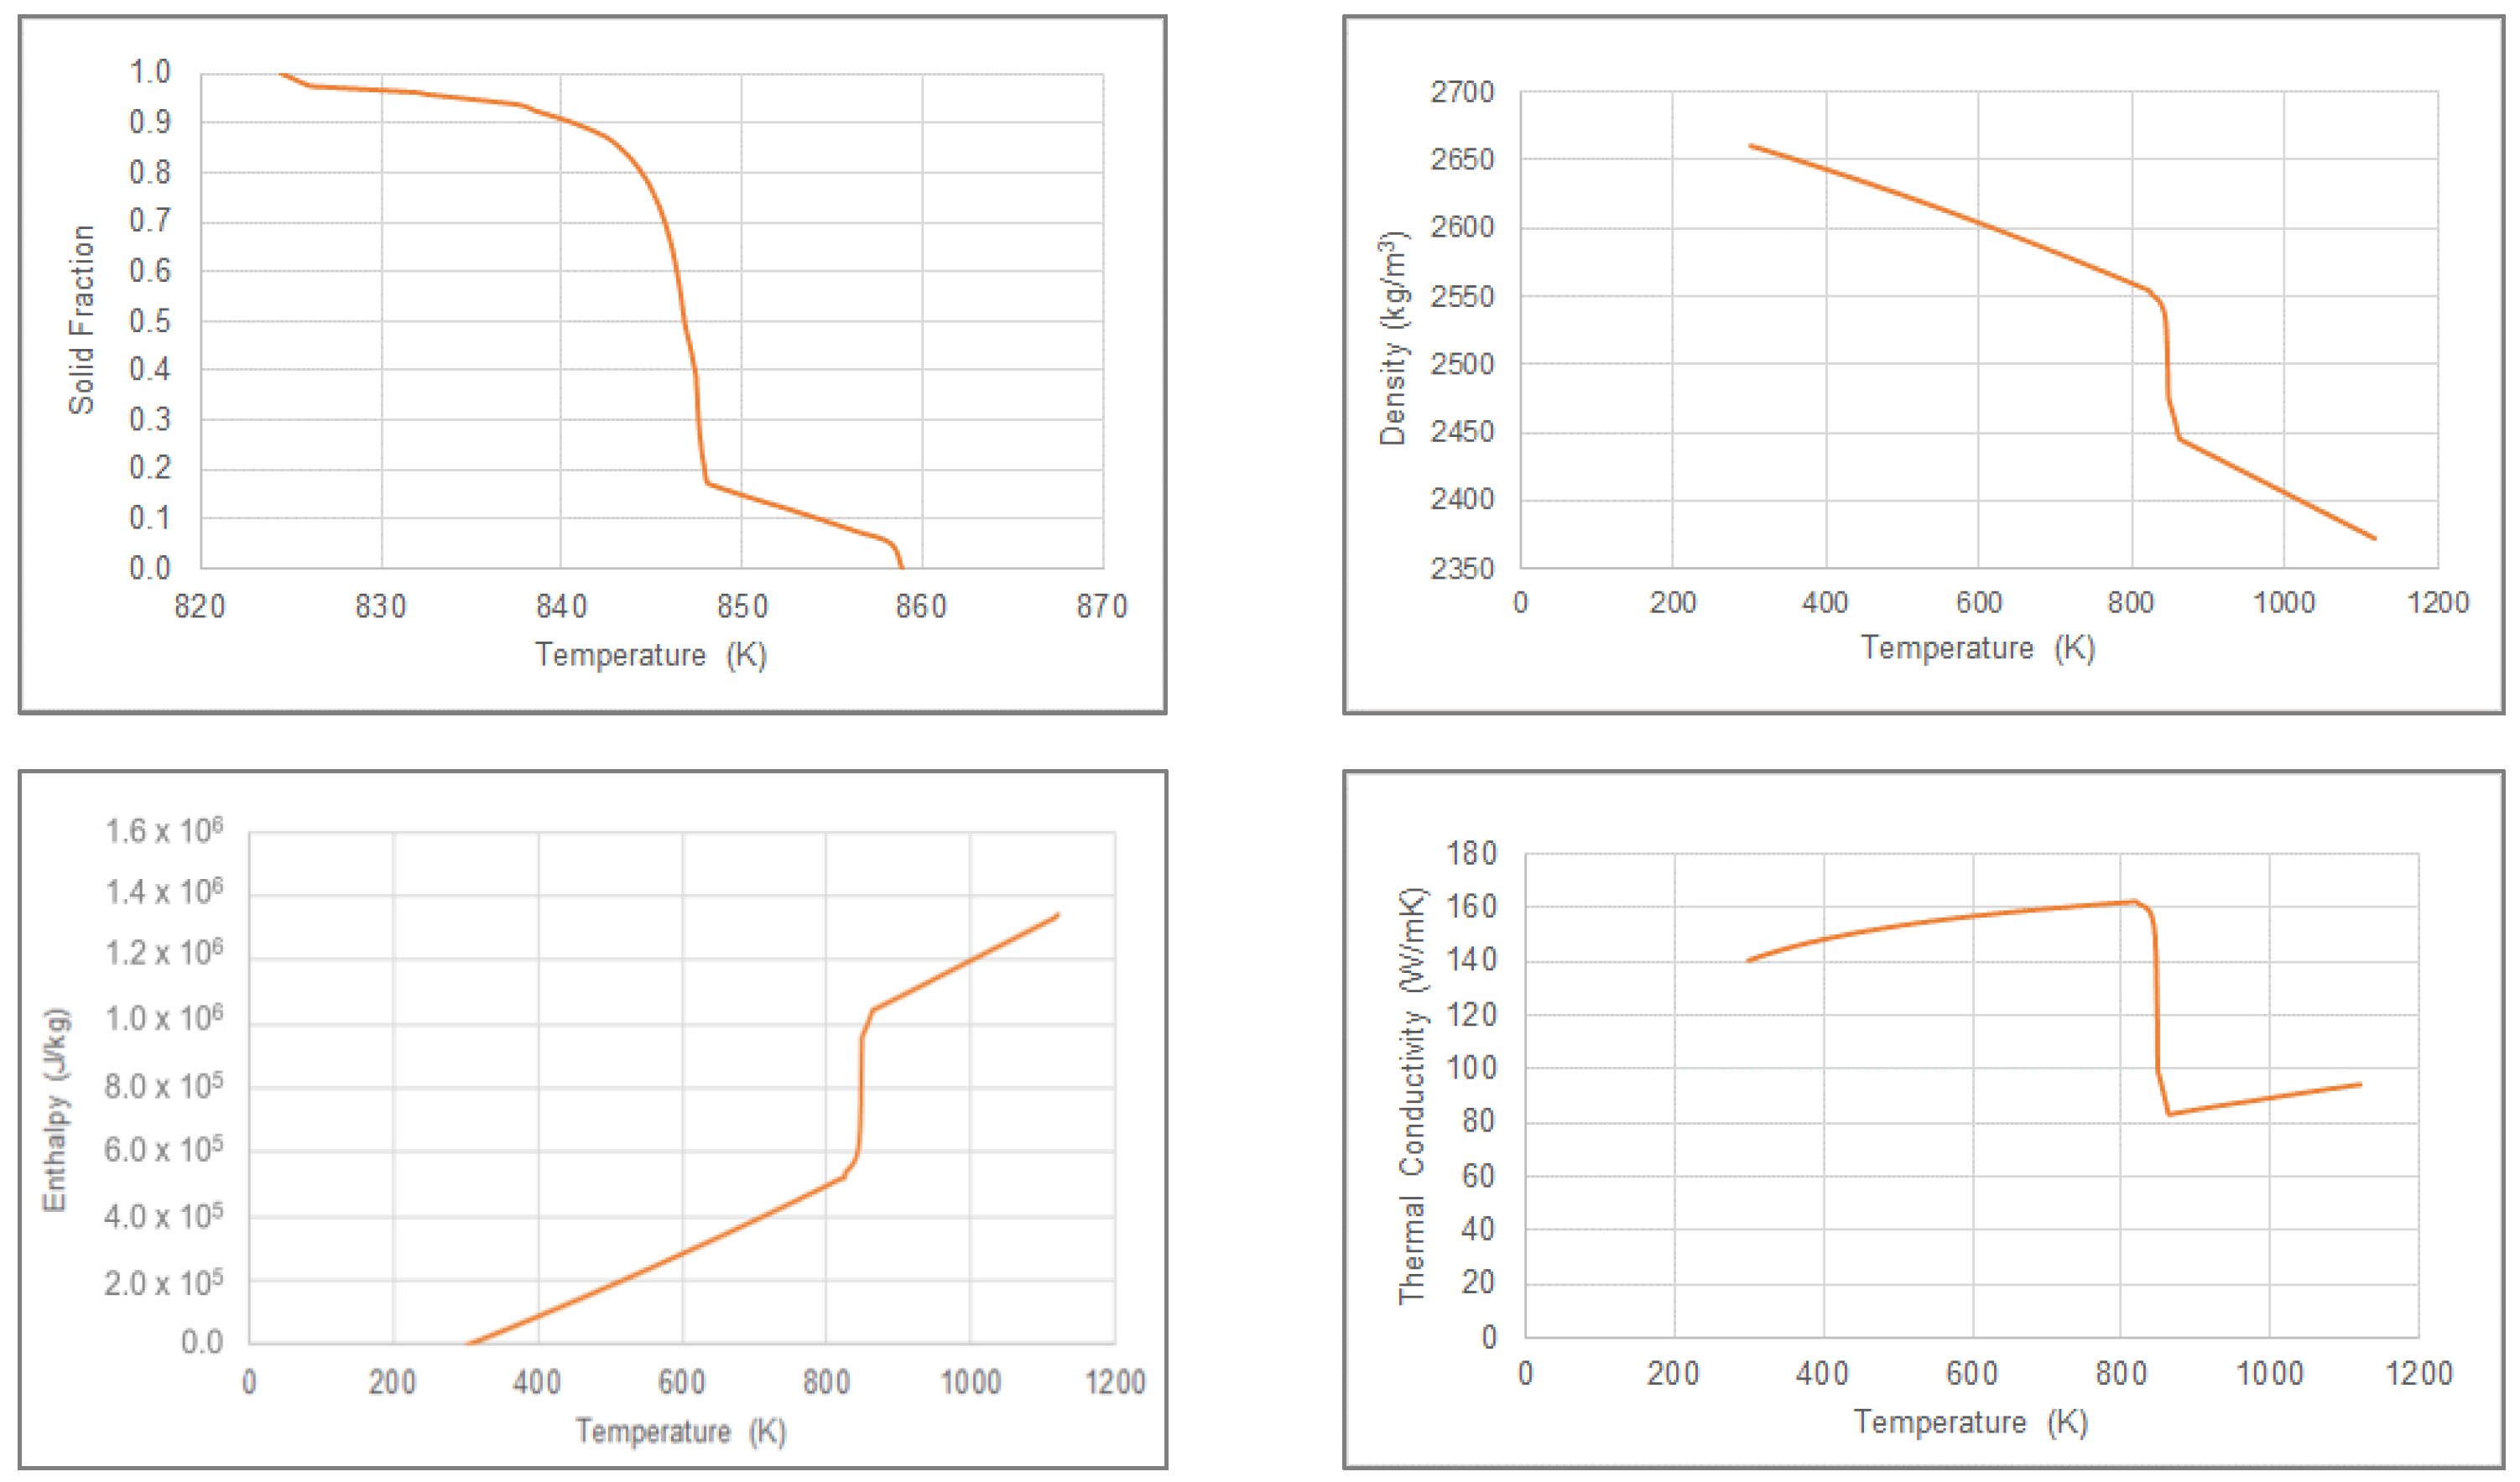
Figure 7.
Sample geometry (left), mesh (right).

Figure 8.
RVE model (left). Heat extraction condition (right).

Figure 9.
Microstructure on the XZ (left) and YZ (right) planes (×100).
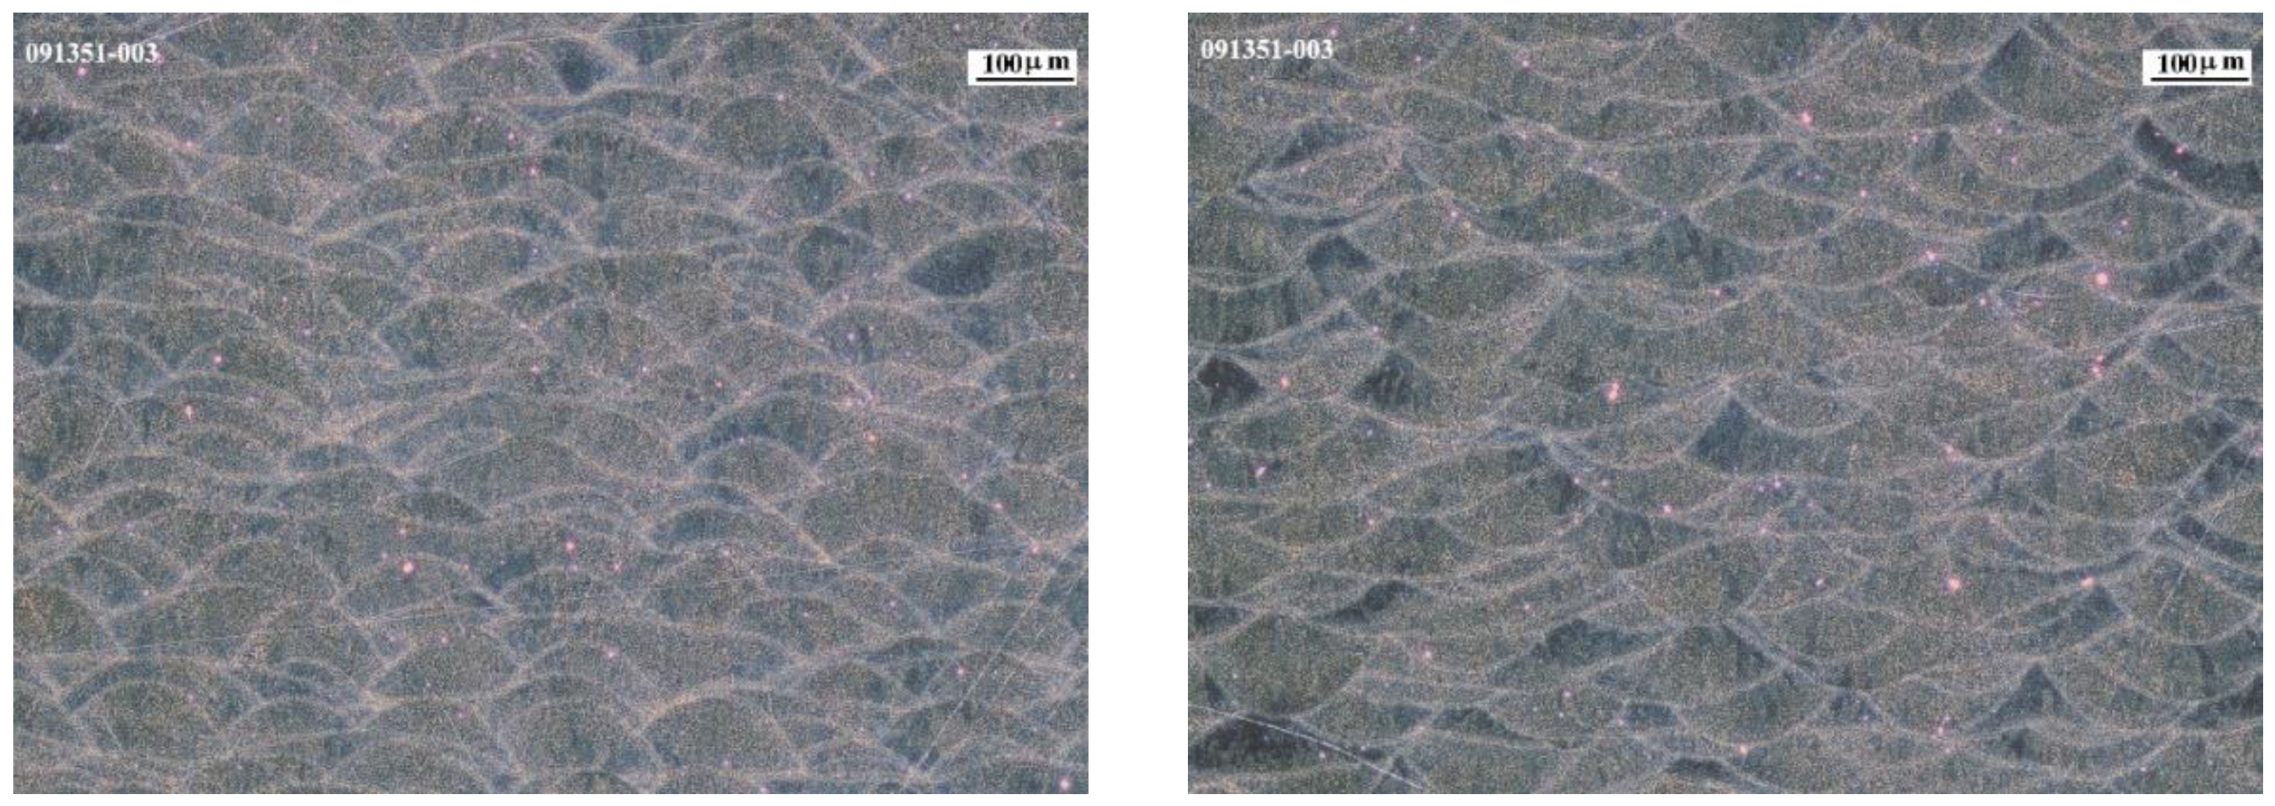
Figure 10.
Microstructure on the XY plane ×50 (left), ×100 (right).
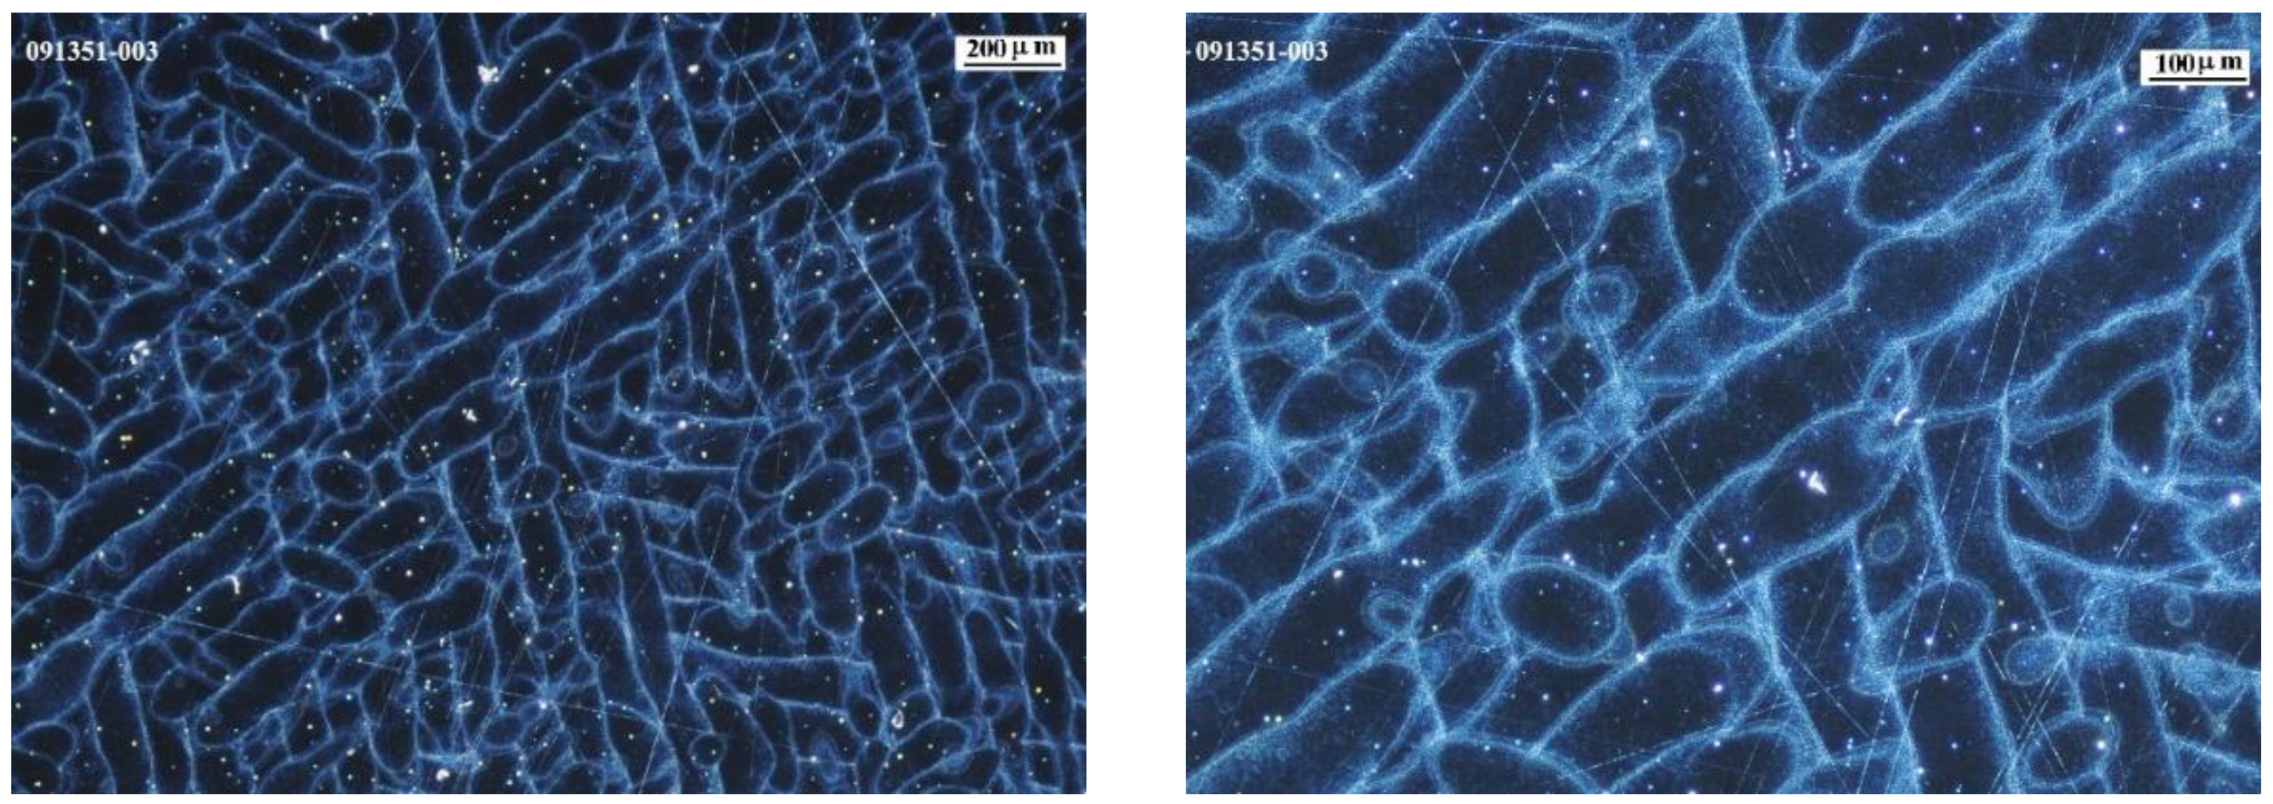
Figure 11.
Microstructure on the XY plane ×1000 (left), ×5000 (right).
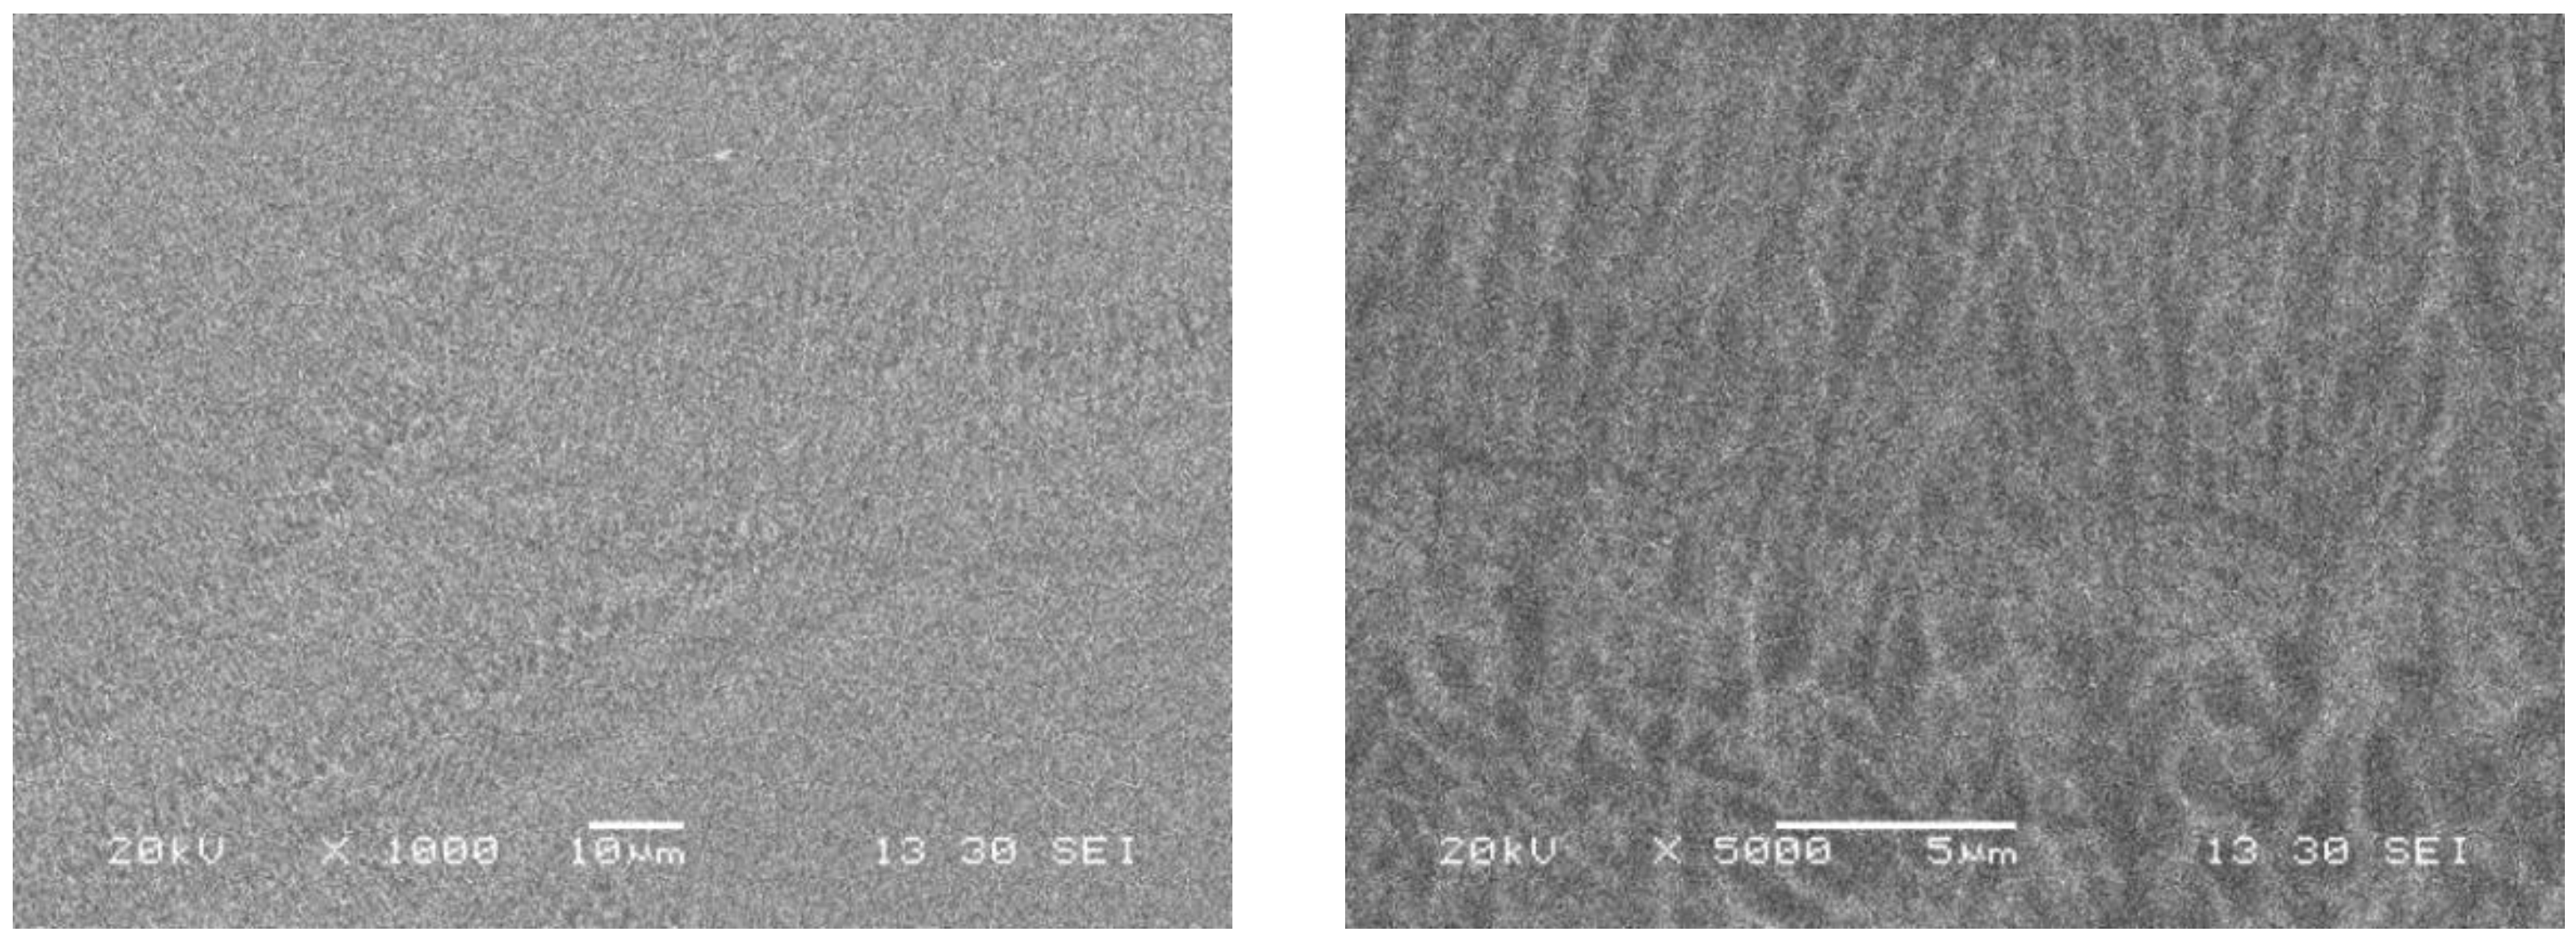
Figure 12.
Solidification cooling rates distribution along the part.
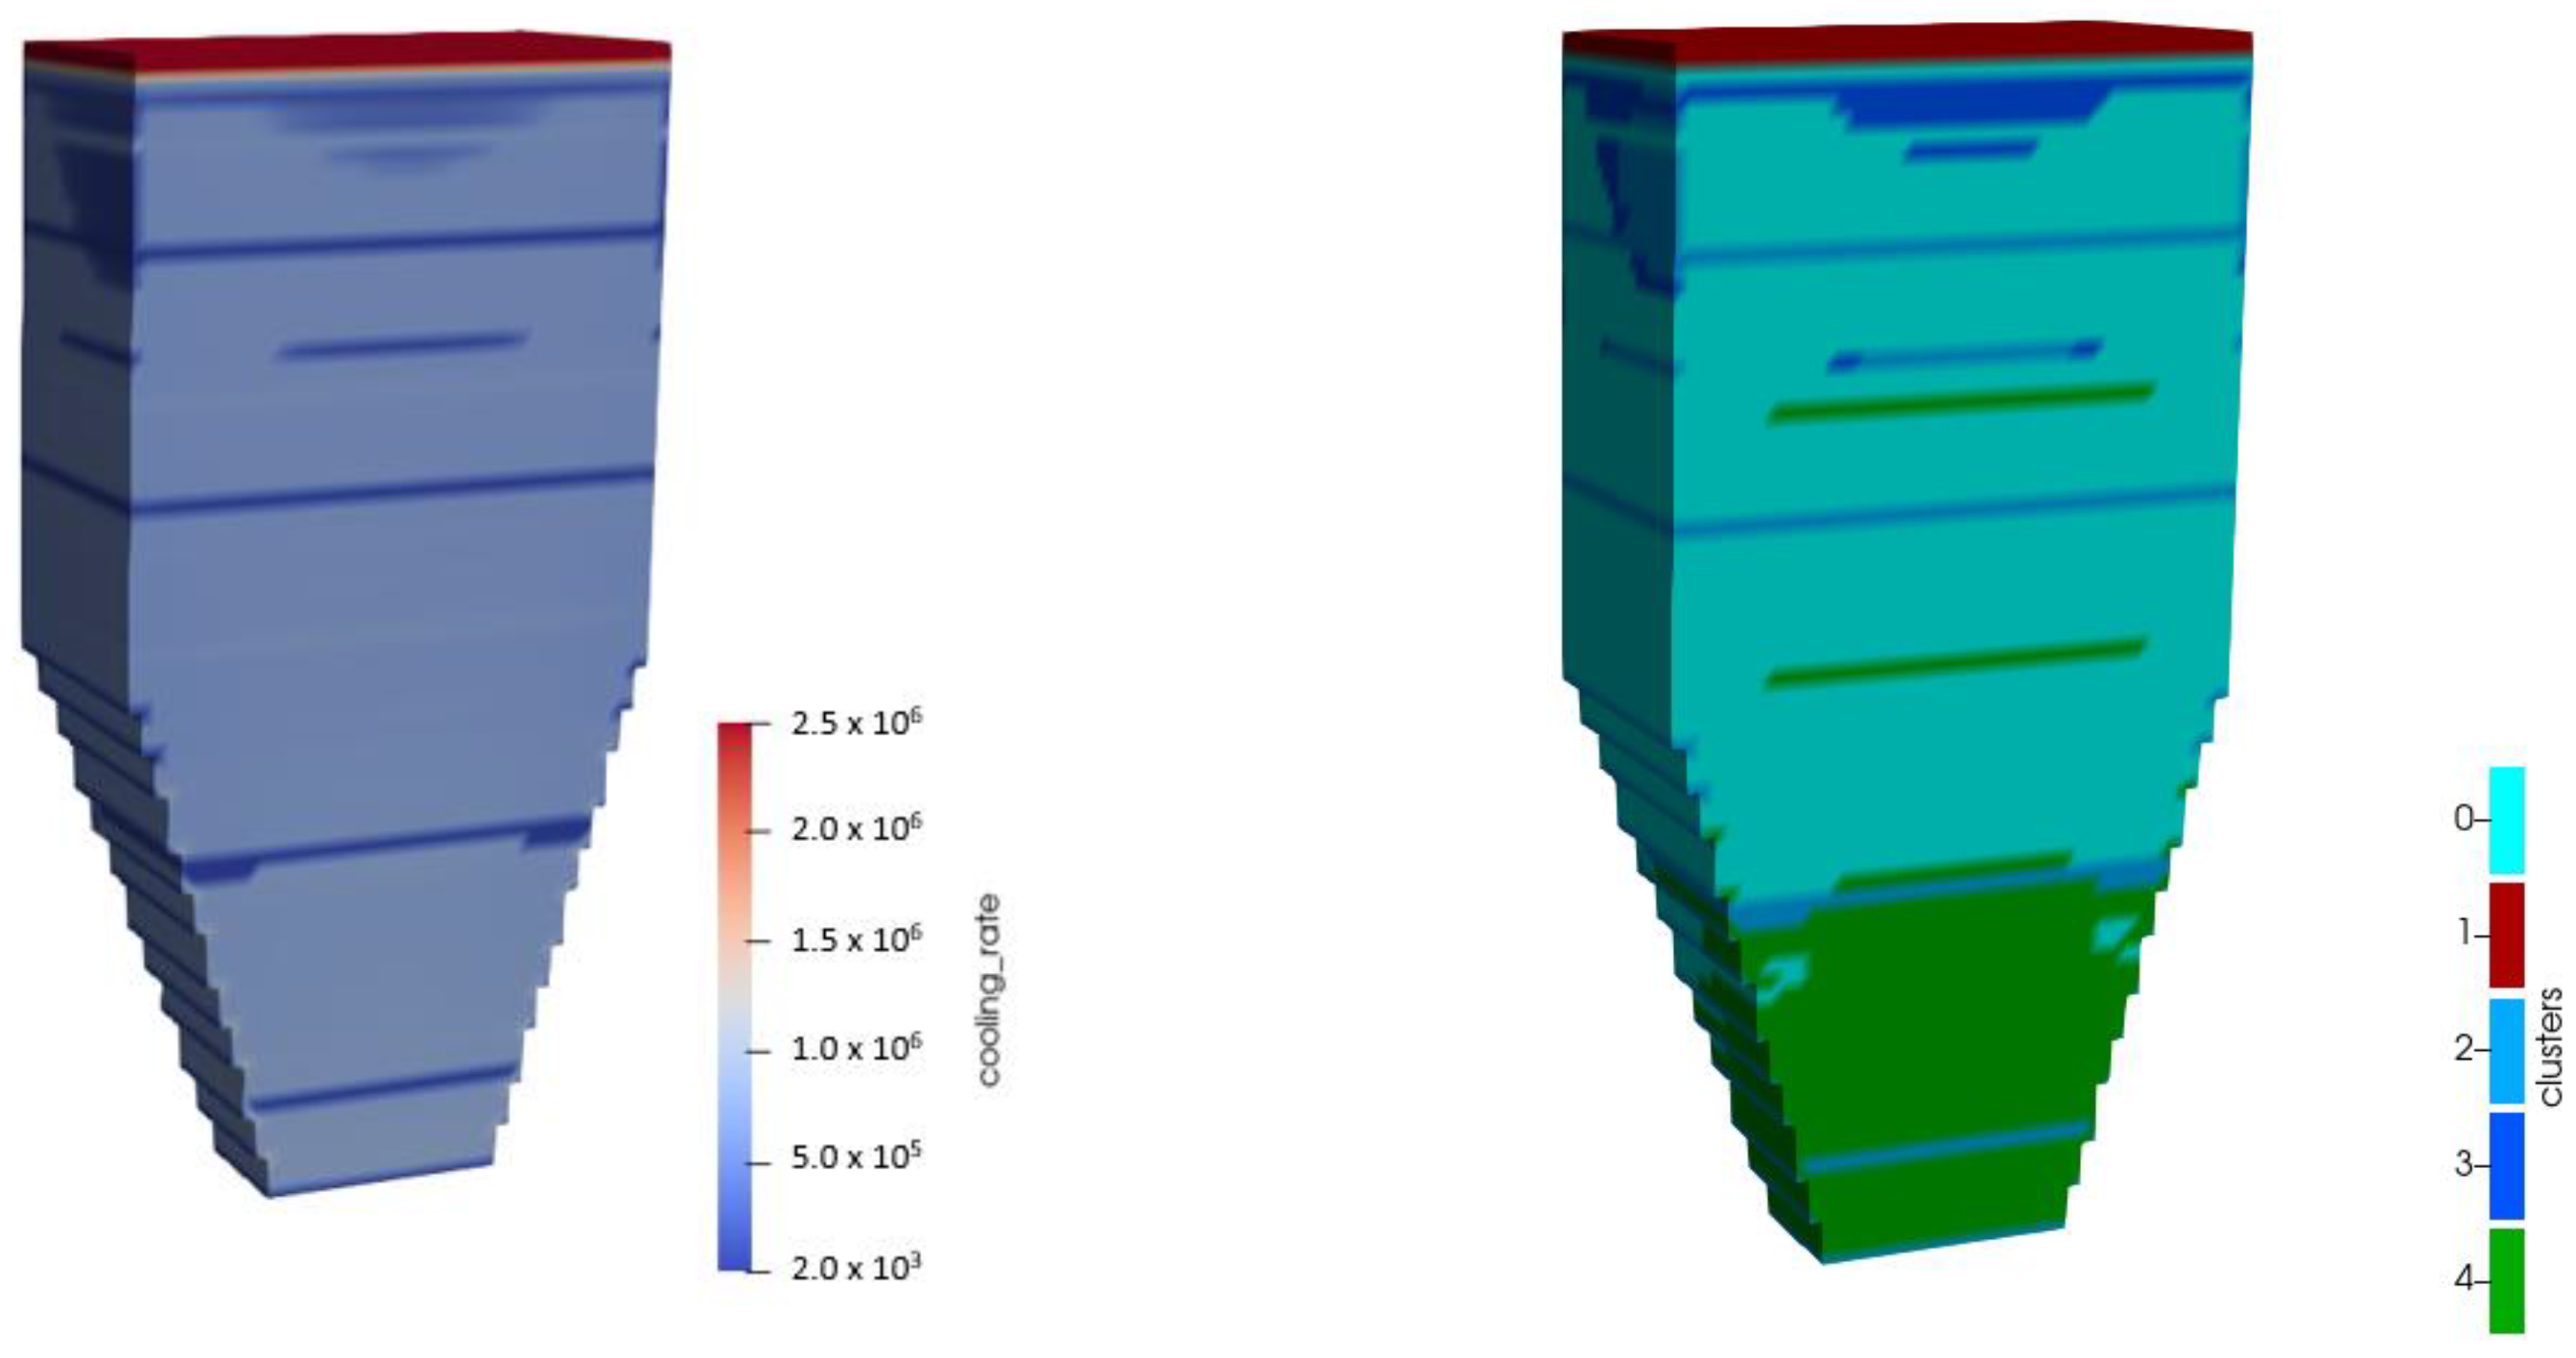
Figure 13.
Solidification cooling rate values in different areas of the part.
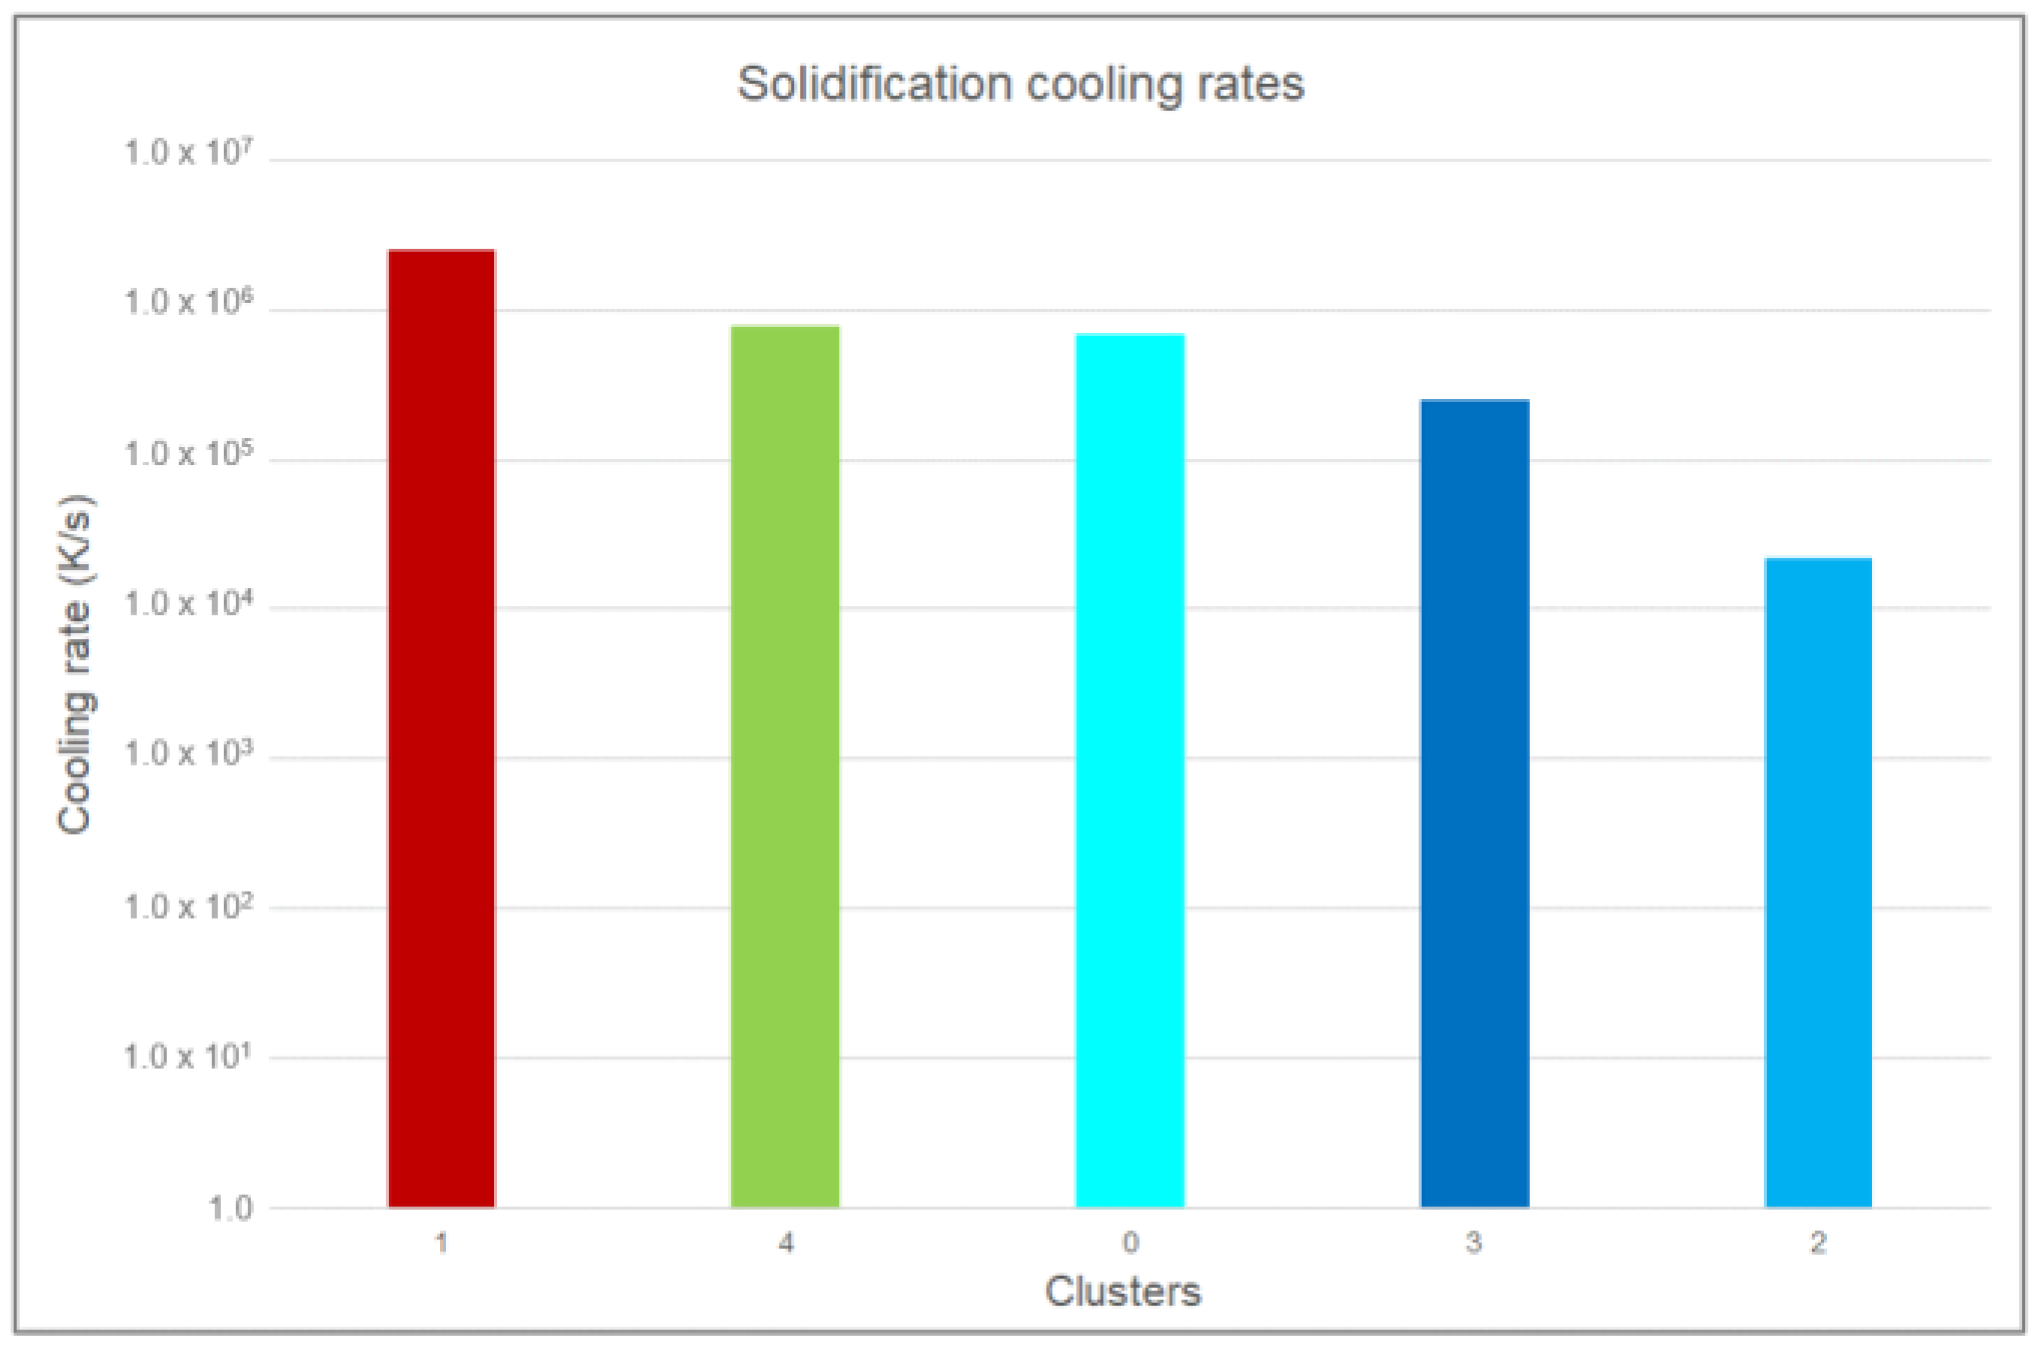
Figure 14.
Evolution of the optimization process.
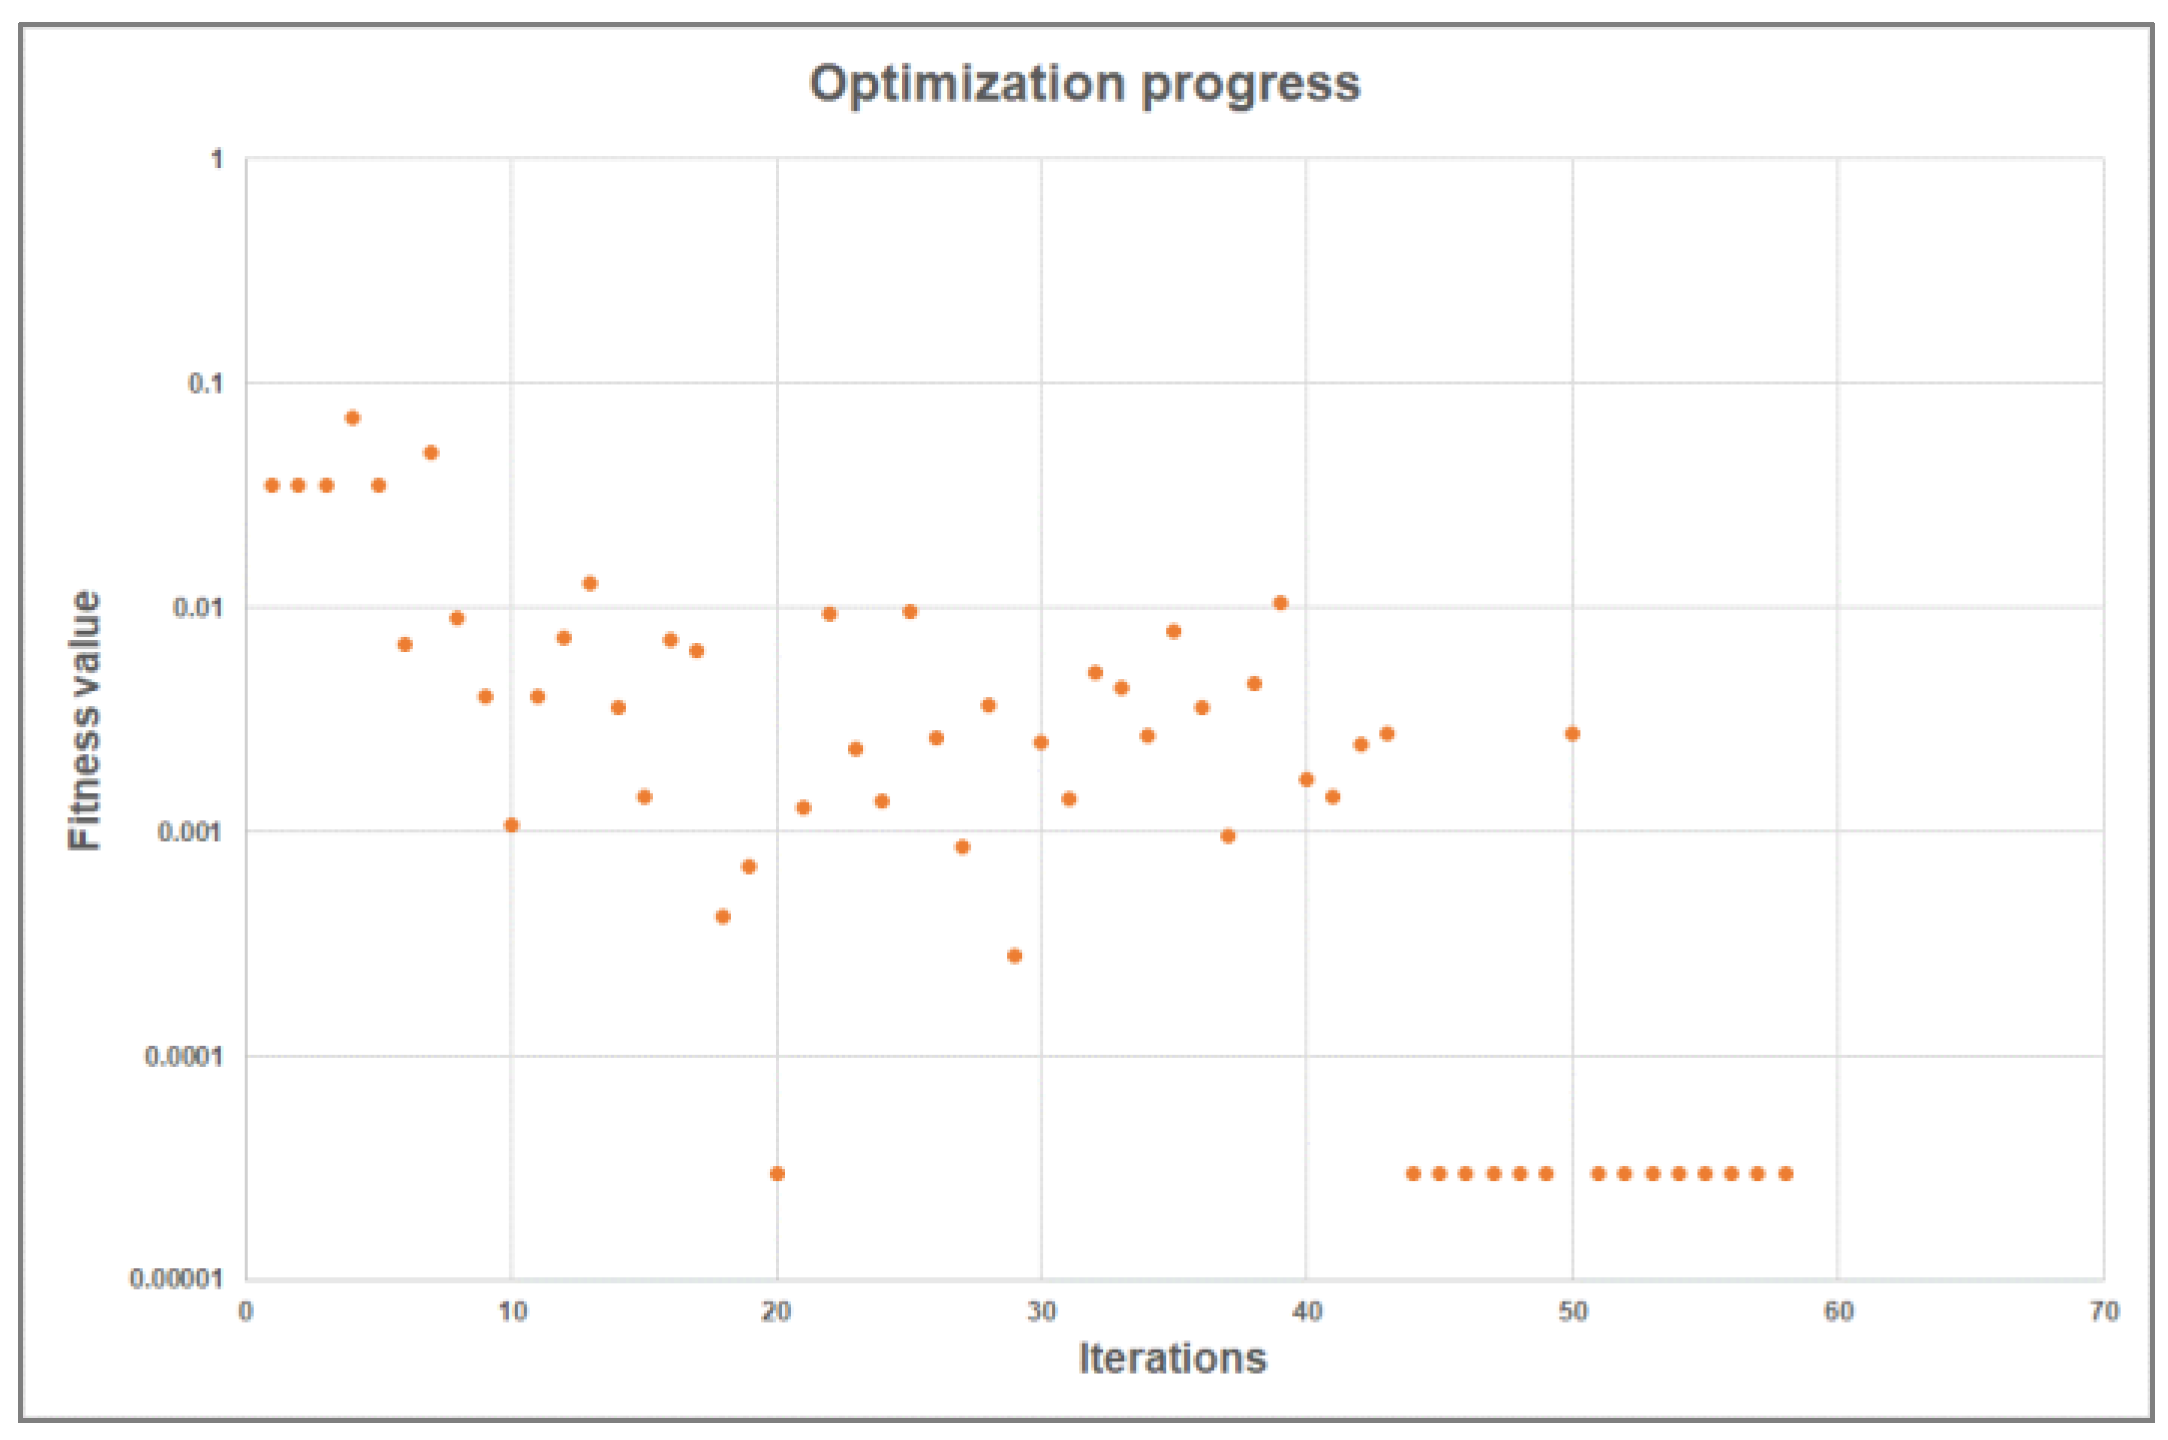
Figure 15.
Cooling rate (left) and lamellar spacing (right) vs. nodes location.
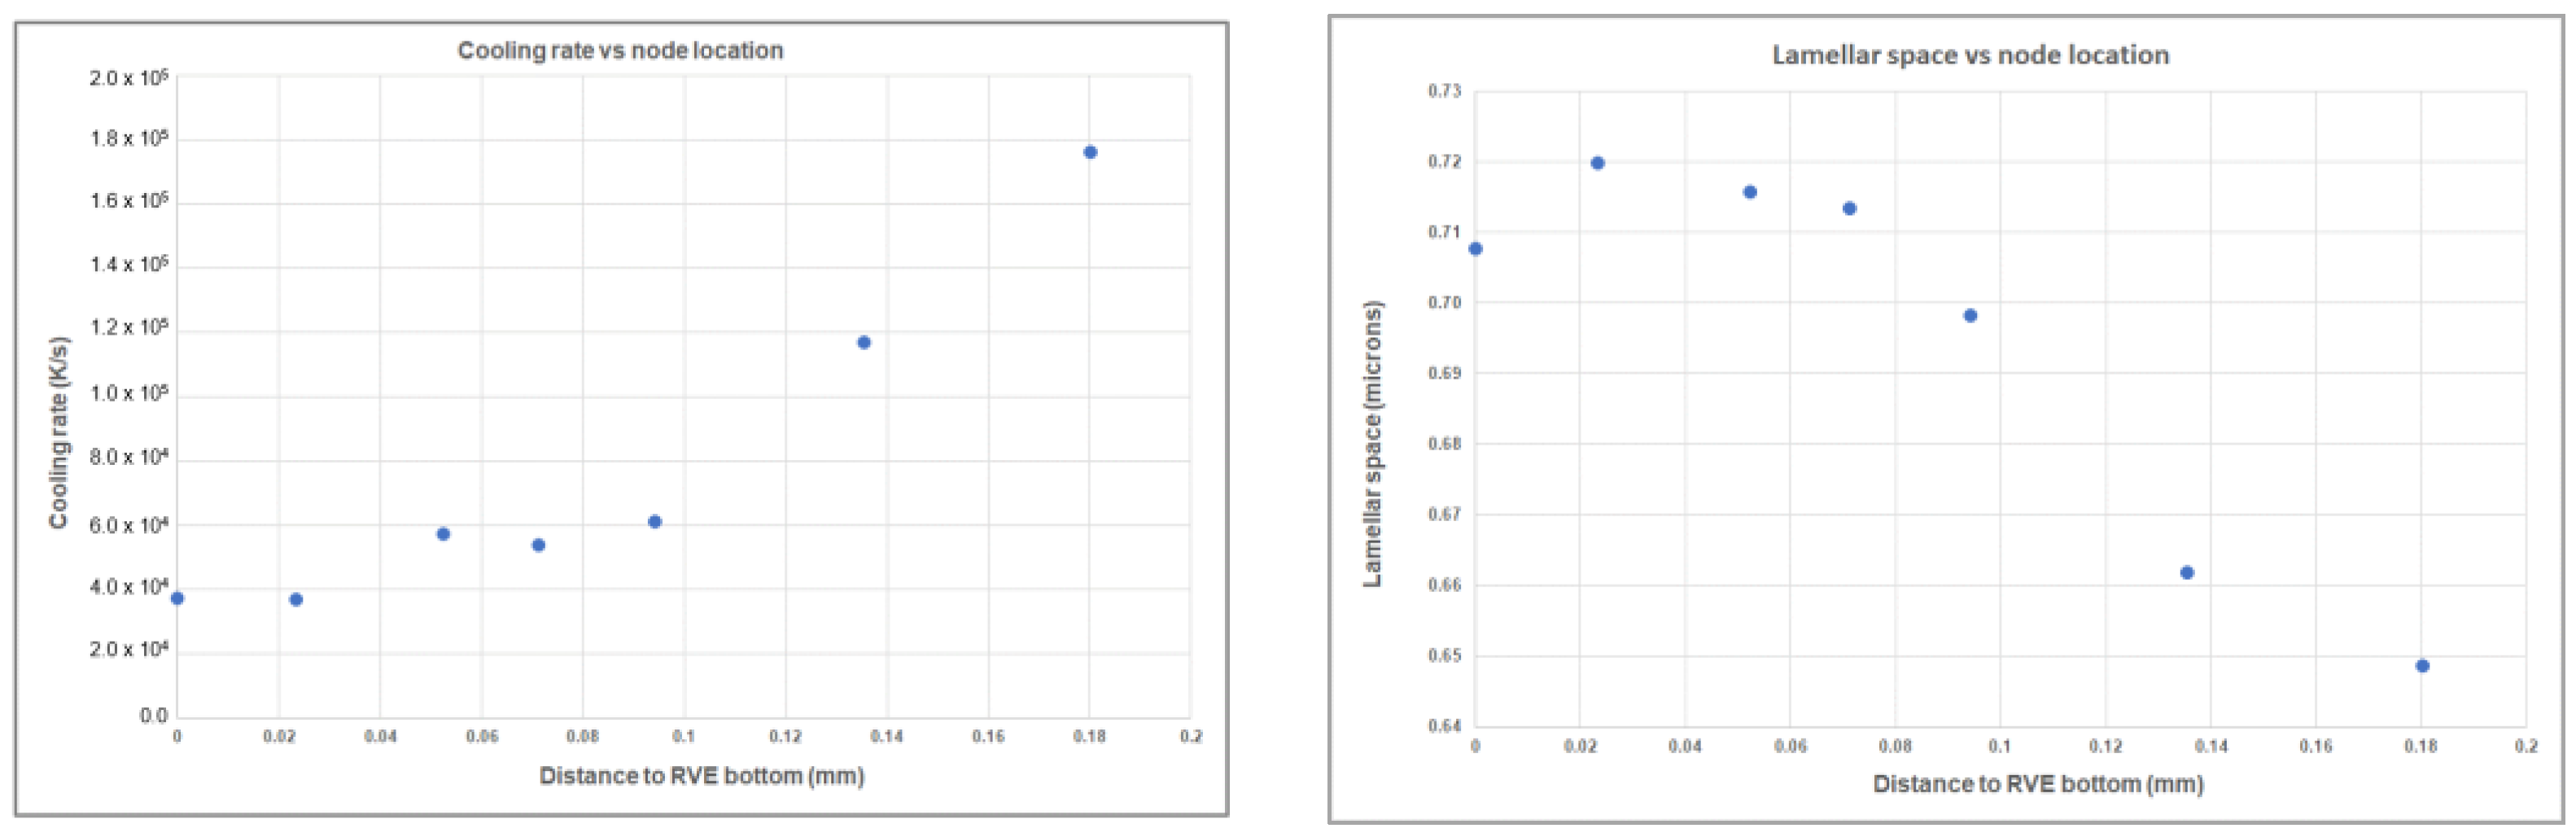
Figure 16.
Lamellar spacing vs. Cooling rate.

Table 1.
Alloy chemical composition.
| Al | Si | Fe | Zn | Mg | Cu | Ti | Mn | Ni |
|---|---|---|---|---|---|---|---|---|
| Base | 10.7 | 0.21 | <0.01 | 0.26 | <0.01 | 0.02 | <0.01 | <0.01 |
Table 2.
Process parameters.
| Hatch Space (mm) | Laser Diameter (mm) | Velocity (mm/s) | Laser Power (W) | Powder Layer Thickness (mm) |
|---|---|---|---|---|
| 0.15 | 0.071 | 800 | 200 | 0.025 |
Table 3.
Material properties.
| Density (kg/m3) | Specific Heat (J/kgK) | Conductivity (W/mK) | Melting Point (K) | Emissivity |
|---|---|---|---|---|
| 2608.79 | 1005.11 | 151.55 | 846.82 | 0.18 |
Table 4.
Nucleation parameters.
| 3.08 × 10⁹ | 7.50 | 25.44 |
Publisher’s Note: MDPI stays neutral with regard to jurisdictional claims in published maps and institutional affiliations. |
© 2022 by the authors. Licensee MDPI, Basel, Switzerland. This article is an open access article distributed under the terms and conditions of the Creative Commons Attribution (CC BY) license (https://creativecommons.org/licenses/by/4.0/).
Share and Cite
MDPI and ACS Style
Anglada, E.; García, J.C.; Arrue, M.; Cearsolo, X.; Garmendia, I. Lamellar Spacing Modelling for LPBF Aluminum Parts. J. Manuf. Mater. Process. 2022, 6, 164. https://doi.org/10.3390/jmmp6060164
AMA Style
Anglada E, García JC, Arrue M, Cearsolo X, Garmendia I. Lamellar Spacing Modelling for LPBF Aluminum Parts. Journal of Manufacturing and Materials Processing. 2022; 6(6):164. https://doi.org/10.3390/jmmp6060164
Chicago/Turabian StyleAnglada, Eva, José Carlos García, Mario Arrue, Xabier Cearsolo, and Iñaki Garmendia. 2022. "Lamellar Spacing Modelling for LPBF Aluminum Parts" Journal of Manufacturing and Materials Processing 6, no. 6: 164. https://doi.org/10.3390/jmmp6060164