Article

Laser Powder Bed Fusion Tool Repair: Statistical Analysis of 1.2343/H11 Tool Steel Process Parameters and Microstructural Analysis of the Repair Interface

by
Sandra Megahed
1,*,
Raphael Koch
2 and
Johannes Henrich Schleifenbaum
1
1
Digital Additive Production (DAP), RWTH Aachen University, Campus Boulevard 73, 52074 Aachen, Germany
2
Ford Research & Innovation Center Aachen, Süsterfeldstr. 200, 52072 Aachen, Germany
*
Author to whom correspondence should be addressed.
J. Manuf. Mater. Process. 2022, 6(6), 139; https://doi.org/10.3390/jmmp6060139
Submission received: 7 October 2022 / Revised: 30 October 2022 / Accepted: 5 November 2022 / Published: 11 November 2022

Abstract

:
High pressure die casting (HPDC) tools undergo several repairs during their life cycle. Traditional repair methods (e.g., welding) cannot always be applied on damaged tools, necessitating complete replacement. Usually, direct energy deposition (DED) is considered and applied to repair tools. In this study, the potential of laser powder bed fusion (LPBF) for HPDC tool repair is investigated. LPBF of the hot work tool steel 1.2343/H11 normally requires preheating temperatures above 200 °C to overcome cracking. Therefore, a process window for the crack-susceptible hot work tool steel 1.2343/H11 with no preheating was developed to avoid preheating an entire preform. Laser power, hatch distance, and scan speed are varied to maximize relative density. Since the correlation of LPBF process parameters and resulting build quality is not fully understood yet, the relationship between process parameters and surface roughness is statistically determined. The identification of suitable process parameters with no preheating allowed crack-free processing of 1.2343/H11 tool steel via LPBF in this study. The LPBF repair of a volume of ~2000 cm3 was successfully carried out and microstructurally and mechanically characterized. A special focus lays on the interface between the worn HPDC tool and additive reconstruction, since it must withstand the mechanical and thermal loads during the HPDC process.

Graphical Abstract

1. Introduction

Additive manufacturing is a technology that creates objects on the basis of a 3D CAD geometry in a layer-by-layer fashion [1,2,3]. Components manufactured via laser powder bed fusion (LPBF) are near-net-shape components, implying a minimal amount of post-processing required to achieve the desired final geometry. This results in reduced material waste. LPBF allows for increased design freedom, enabling the manufacture of complex geometries which would be challenging to produce with conventional technologies [4,5]. LPBF challenges include distortion and curling (rolling up of the edges during build), sagging (sinking of the overhanging layer into the powder bed), sintering of powder particles to component surfaces, powder bed quality, and residual stresses [6,7]. These effects can lead to increased post-processing, unreproducible mechanical properties, or even impairment of component functionality [8,9]. Even though components with the required quality can be manufactured with LPBF, experimentally secured process parameters do not exist [10]. The large number of process parameters (more than 100 [11]), as well as varying thermal conditions, make repeatable manufacturing quality challenging.
When considering internal channels, the use of support structures may be required for LPBF depending on the angle of the overhanging structure [8,12]. Overhangs were studied by Wang et al., among others [13,14,15,16]. A larger overhang length leads to increased sagging and curling. Sagging and curling negatively affects dimensional accuracy of channel structures [13]. According to Wang et al. [13], overhang angles larger than 40° can be reliably built without supports, which agrees with other studies found in the literature [8,17]. Angles of θ ≥ 45° should be manufactured with high energy input, while angles of θ < 45° should be manufactured with low energy input [17]. This is due to the differing heat dissipation capacity of solid-supported zones compared to that of powder-supported zones [13,17]. The heat dissipation capacity in powder-supported zones can be more than 100 times smaller compared to solid supported ones and depends on the relative density of the powder and the contact size [18,19].
High pressure die casting (HPDC) tools must be repaired several times during their life cycle, due to thermal fatigue, erosion, adhesion of casting material, and corrosion [20,21,22]. Repeated heating and cooling cycles during the HPDC process cause crack initiation [22]. Traditional repair methods (e.g., welding) cannot always be applied on damaged tools since dimensional accuracy standards are no longer met, necessitating complete replacement [22]. Repairing tools is economically preferred and can double the lifetime of a tool [22].
Tool inserts are mostly made of 1.2709 grade steel, since it is readily weldable [7,9]. In contrast, using hot work tool steel 1.2343/H11 tool steel or 1.2344 is preferred due to the higher thermal conductivity and better wear and corrosion resistance. The high carbon content reduces the weldability of 1.2343/H11 tool steel, making it difficult to process using LPBF [23]. Compared to 1.2344, 1.2343/H11 tool steel has not been as thoroughly researched for LPBF [24]. To mitigate crack susceptibility, the substrate is usually preheated to reduce thermal gradients, thereby reducing crack susceptibility [9]. Preheating temperatures over 200 °C is necessary for reproducible crack-free manufacturing. These preheating temperatures cannot be readily reached by all commercial LPBF machines.
Additive repairs are mostly carried out using direct energy deposition (DLD) [25,26,27]. However, DLD does not allow for increased functionality such as cooling channels, which could prolong the lifetime of a HPDC tool. LPBF allows for increased functionality, however repairing tools with LPBF is challenging due the need for support structures [26] and the difficulty in positioning. If the process window includes preheating, as it usually does when considering 1.2343/H11 tool steel, the preheating of an entire preform also poses a challenge. Therefore, LPBF is not as thoroughly researched for tool repairs compared to DLD.
In this study, process parameters are varied to manufacture crack-free 1.2343/H11 tool steel components via LPBF without preheating. Developing a process window for 1.2343/H11 tool steel without preheating allows the processing of this tool steel on all available LPBF machines. For comparison, process parameters with preheating are also investigated. The correlation between process parameters and surface roughness is statistically determined. Once suitable process parameters without preheating are identified, a worn 1.2343 tool is repaired by LPBF. The LPBF repair consists of a volume of roughly 2000 cm3, which is not readily found in literature. The interface between additive repair and worn tool is analyzed in terms of geometric compliance, microstructure, and mechanical properties.

2. Materials and Methods
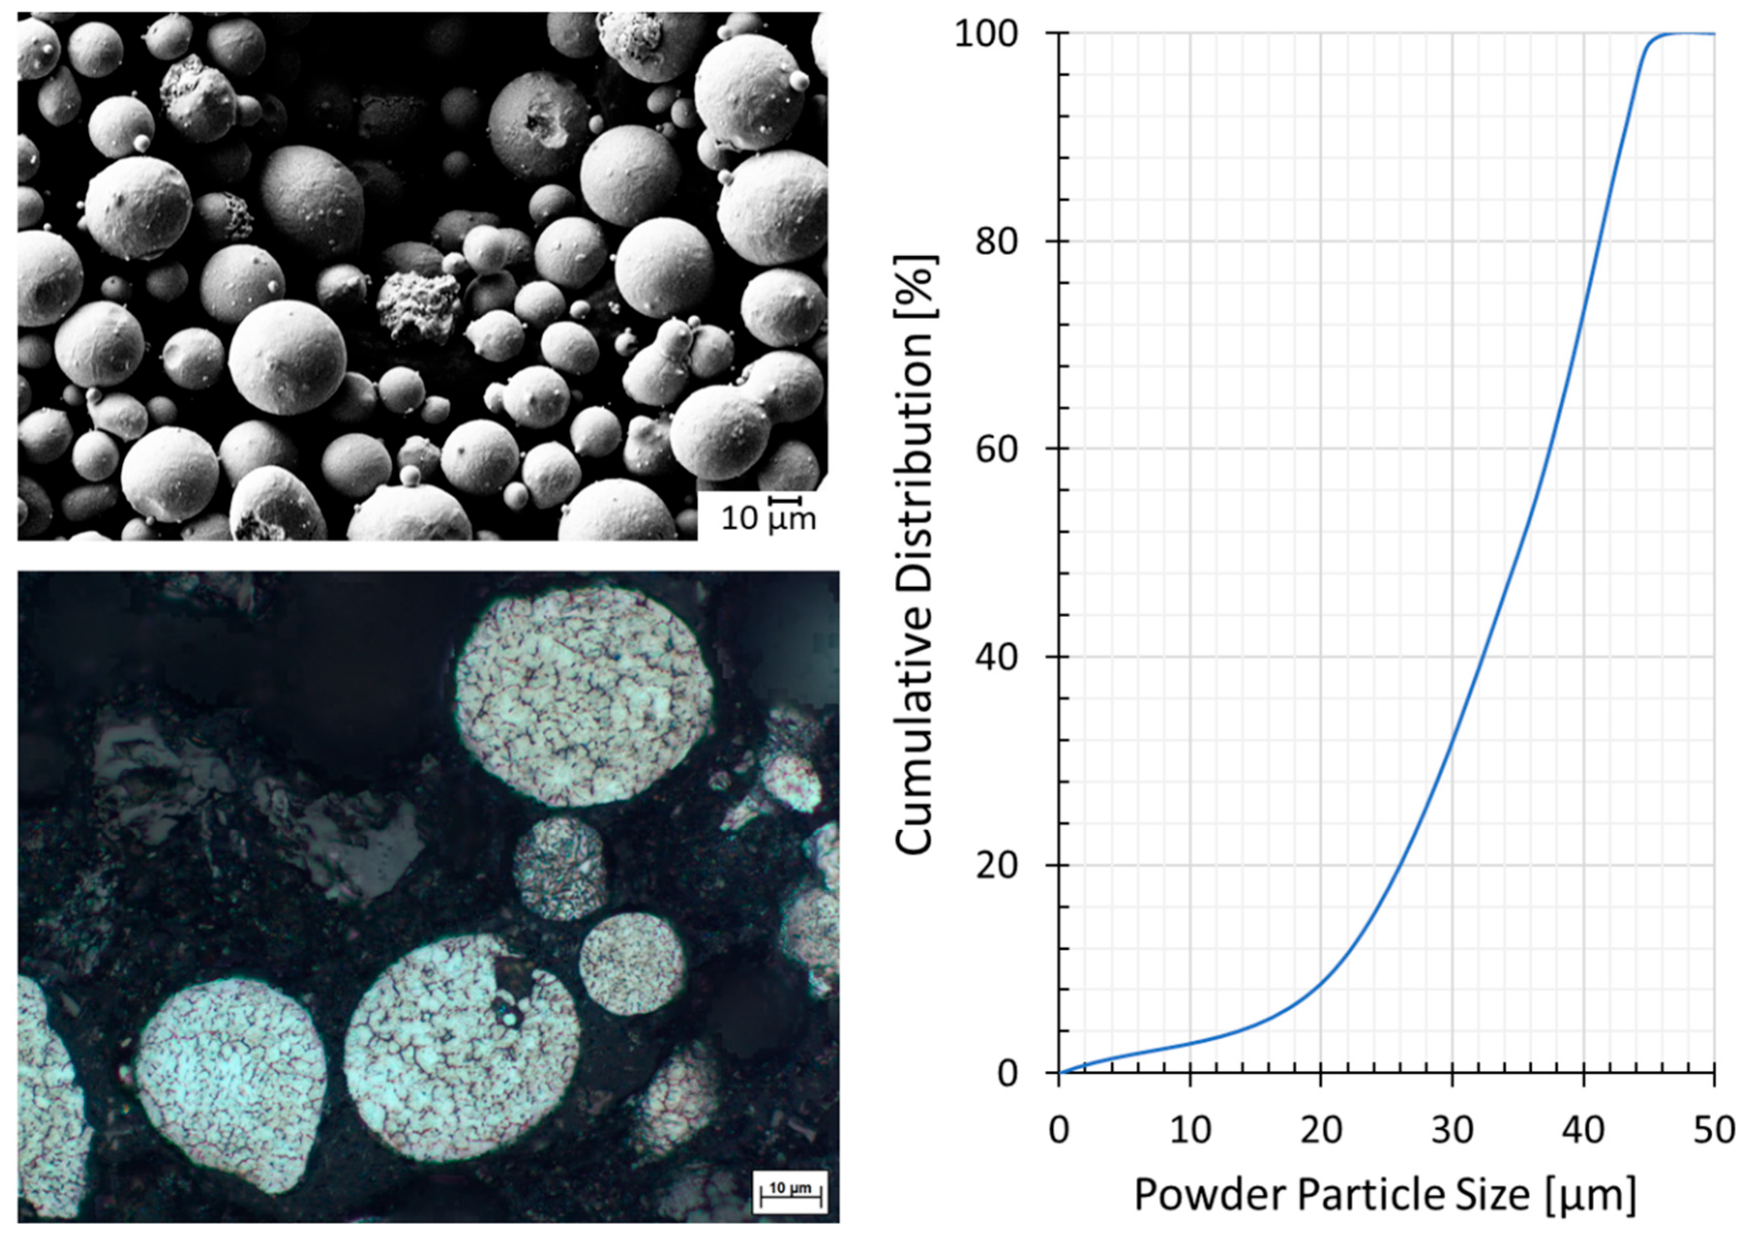
2.1. Materials

The material of choice in this study is hot working tool steel 1.2343/H11 tool steel. The gas-atomized powder of 15–45 µm was supplied by Thyssenkrupp GmbH. The composition of the powder used is shown in Table 1. A powder analysis was carried out using Retsch Camsizer X2 to quantitively analyze the powder particle size distribution (PSD). Images of the powder were taken using a Zeiss scanning electron microscope (SEM). Double-sided tape was used to take three-dimensional images of powder. Cross-sections were also prepared. For that purpose, powder was embedded in bakelite, ground, polished, and etched with 10% NaOH. As can be seen from Figure 1, the powder is spherical with limited porosity and satellites. A PSD is also shown in Figure 1.

2.2. LPBF Manufacturing

Samples were manufactured using an ACONITY MINI. This machine allows access to all relevant process parameters [28], namely laser power, hatch distance, scan speed, layer thickness, and preheating temperatures up to 800 °C.
The scanning strategy used is 90° alternating stripes. A constant laser beam diameter of 75 µm is used. Scan speed, laser power, and hatch spacing are varied to achieve volume energy densities between 16–198 J/mm3.
The sample geometries include:
  • 120 cubes (10 × 10 × 10 mm3) for relative density and microstructure analysis.
  • 6 B4 × 20 tensile samples. Three of those samples were tested in as-built condition, the remaining three samples were sand blasted prior to tensile testing.
  • 12 cylinders (   8   mm × 55   mm ) for tensile testing, which are subsequently machined into B4 × 20 tensile samples.
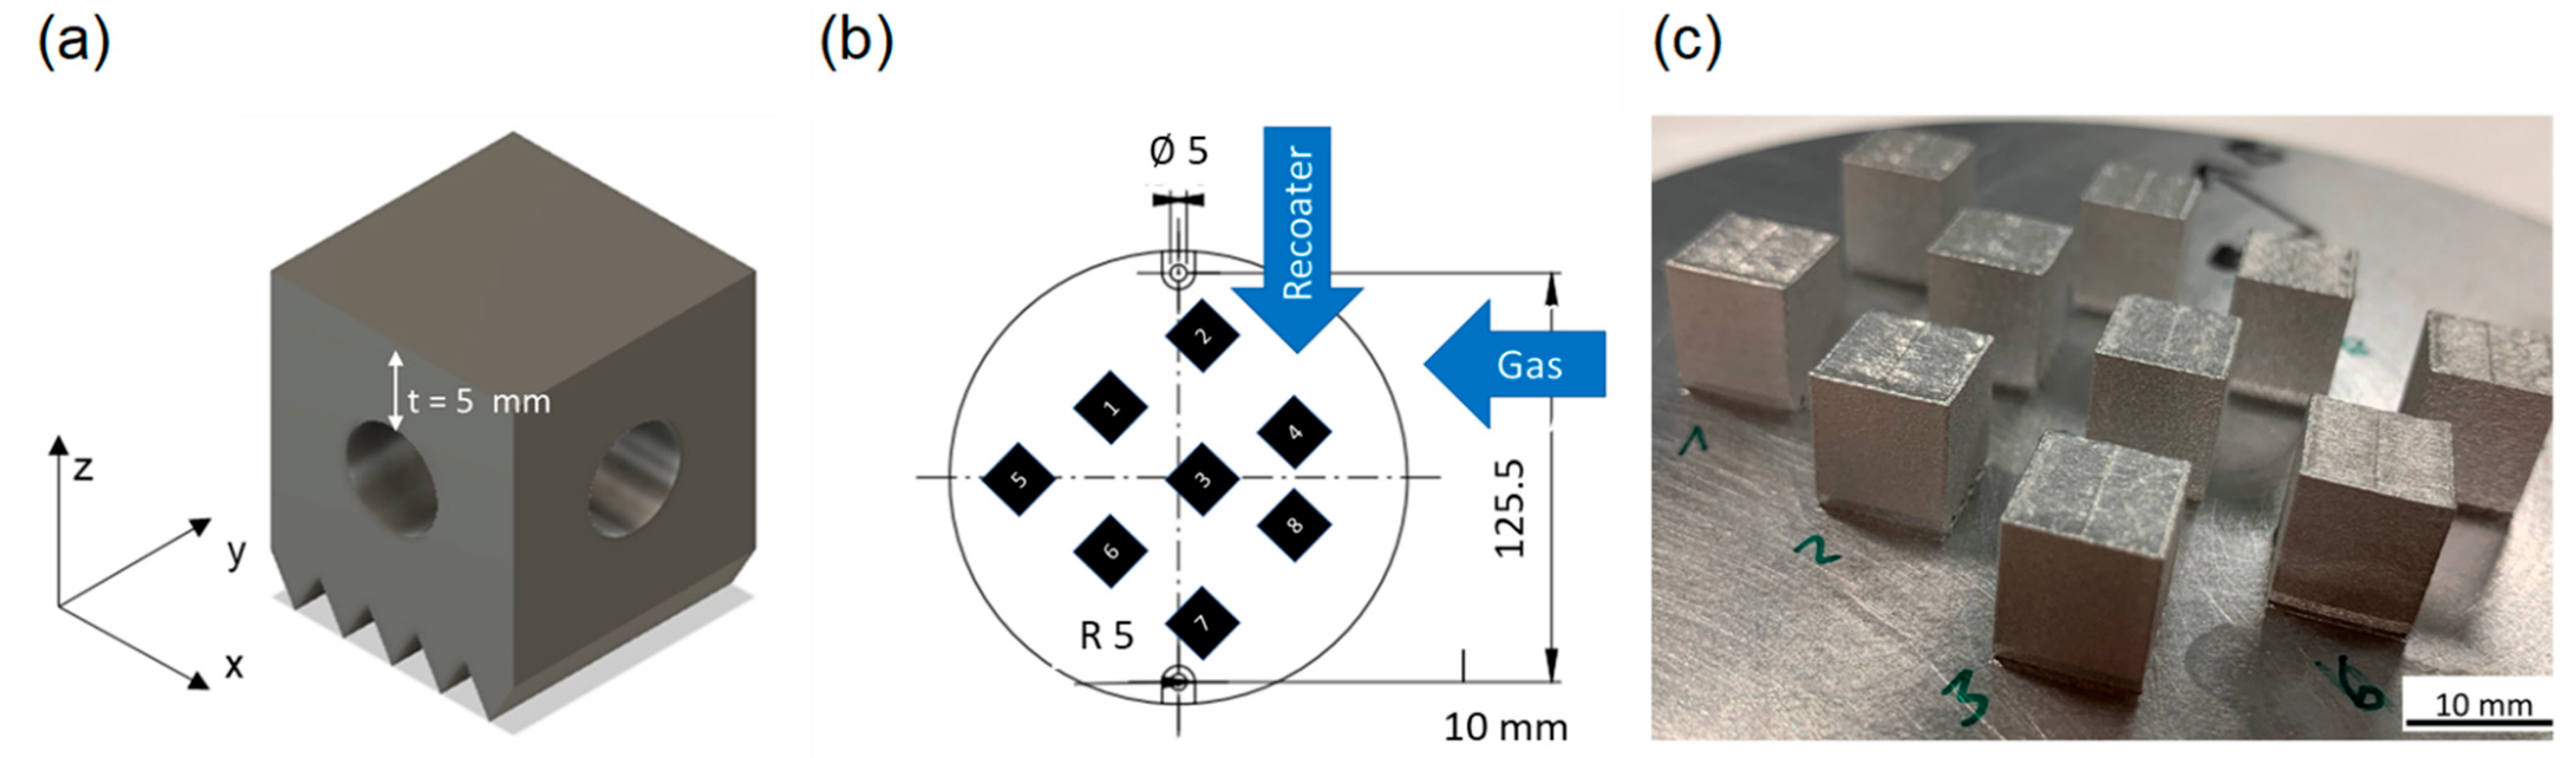
  • 18 cubes with circular channels (see Figure 2). The edge length of the cube is 16 mm, the channel diameter of the surface-centered channel structures is 6 mm. The sample geometry was chosen according to the results of Thomas [8]; a wall thickness (t) of 5 mm reduces the risk of sample damage when removing the test geometries [8]. Furthermore, a channel diameter of 6 mm reduces the probability that the powder within the channel structure will be sintered by the energy input.

2.3. Relative Density

For the analysis of relative density, samples were hot-mounted in bakelite, ground, and polished. Relative density was measured using a Keyence VHX7000 microscope. Using 100× magnification, images of the entire surface were taken and stitched together. The built-in Keyence software distinguishes pores and solid material according to changes in contrast. The crack density was determined using ImageJ open software. Defects with a sphericity of 0.7 are defined as a pore, and defects with a sphericity below 0.7 are defined as a crack.

2.4. Microstructure

For the analysis of the microstructure, samples were etched using 10% NaOH solution for up to 15 seconds. A Zeiss SEM was used for the microstructural analysis.

2.5. Tensile Testing

Tensile tests were carried out according to DIN EN ISO 6892-1:2009. A Zwick Roell testing system was used. Samples were tested at room temperature. After the tensile test, a stress–strain diagram with all data could be extracted. The tensile samples are differentiated according to their surface quality: as-built, sand blasted, and machined. For sandblasting 100 µm, 200 µm glass beads, and a pressure of 6 bar were used.

2.6. Support Free Channel

The cubes with internal channels were sectioned, ground, and polished. The dimensions of the cube channels are determined by measuring the wall thickness (t) using a Keyence VHX7000. The nominal wall thickness is 5 mm (compare Figure 2a). The measured dimension is compared to the nominal value. A deviation from the wall thickness indicates that the channel structure does not correspond to the desired shape.

2.7. Surface Roughness
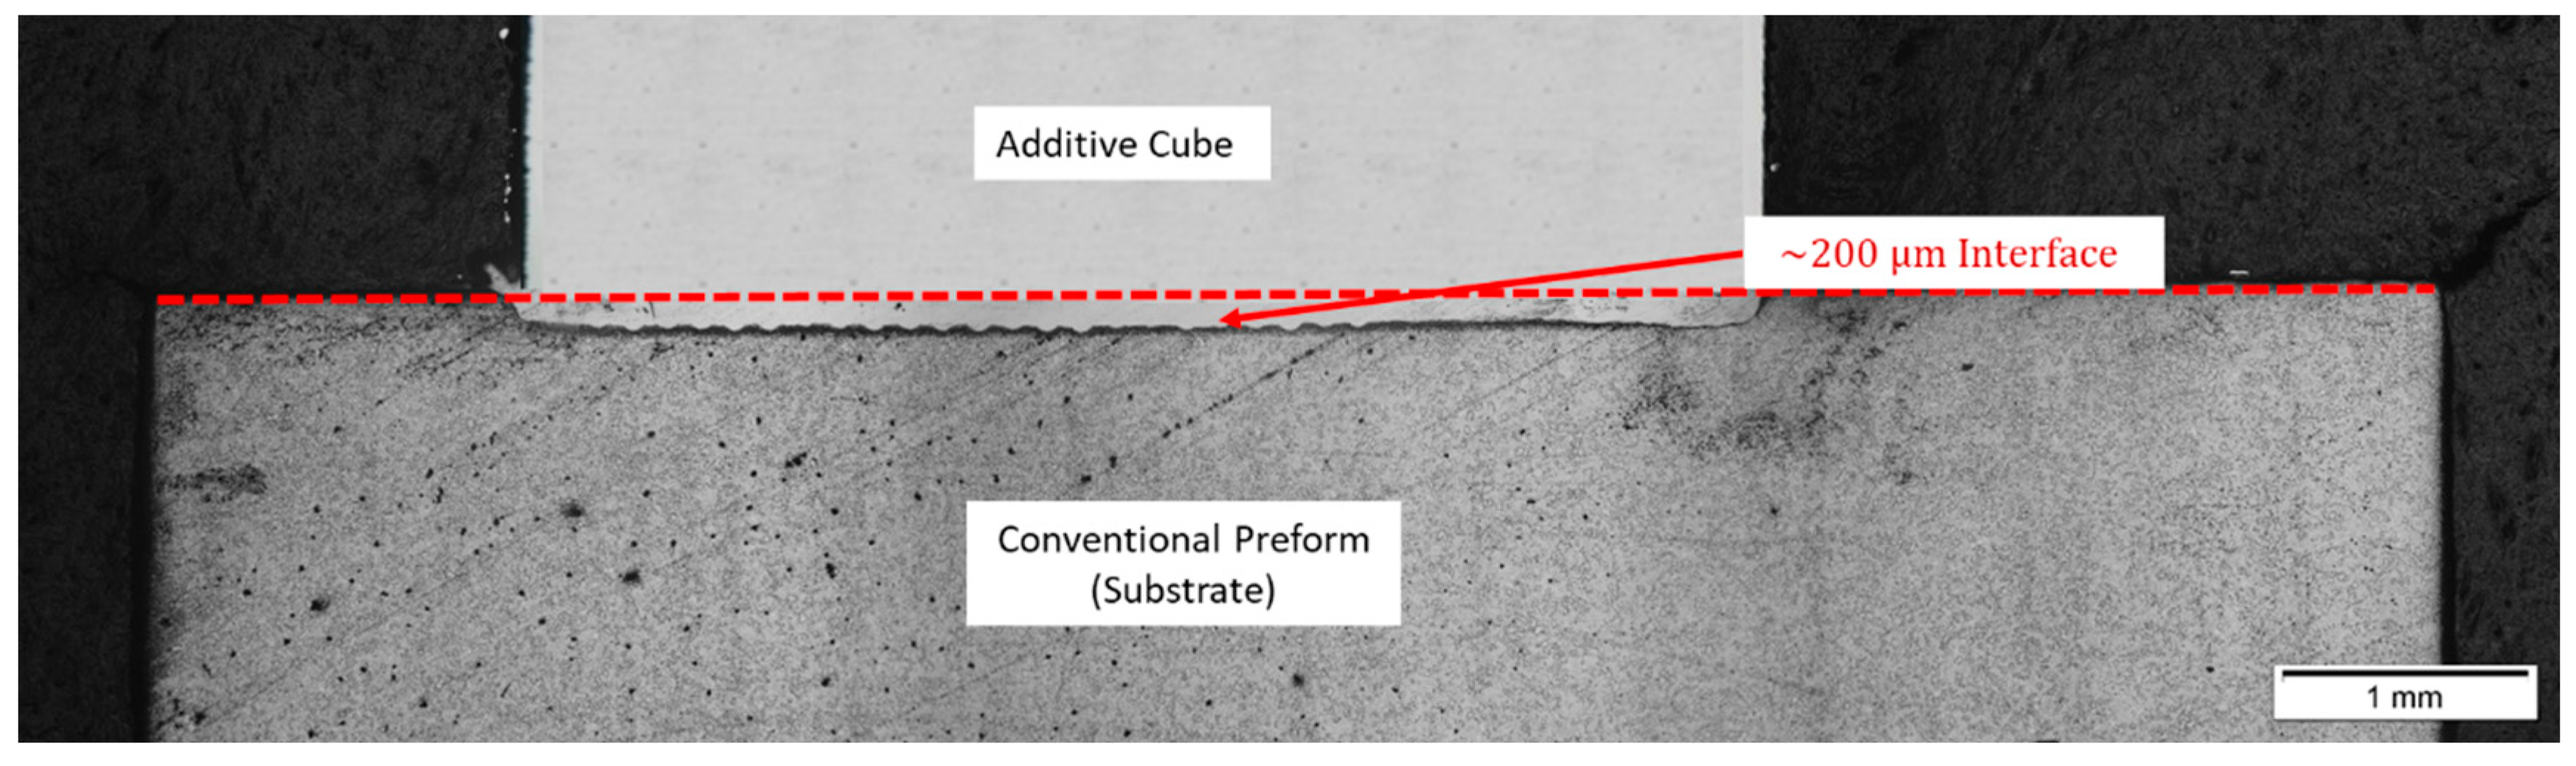
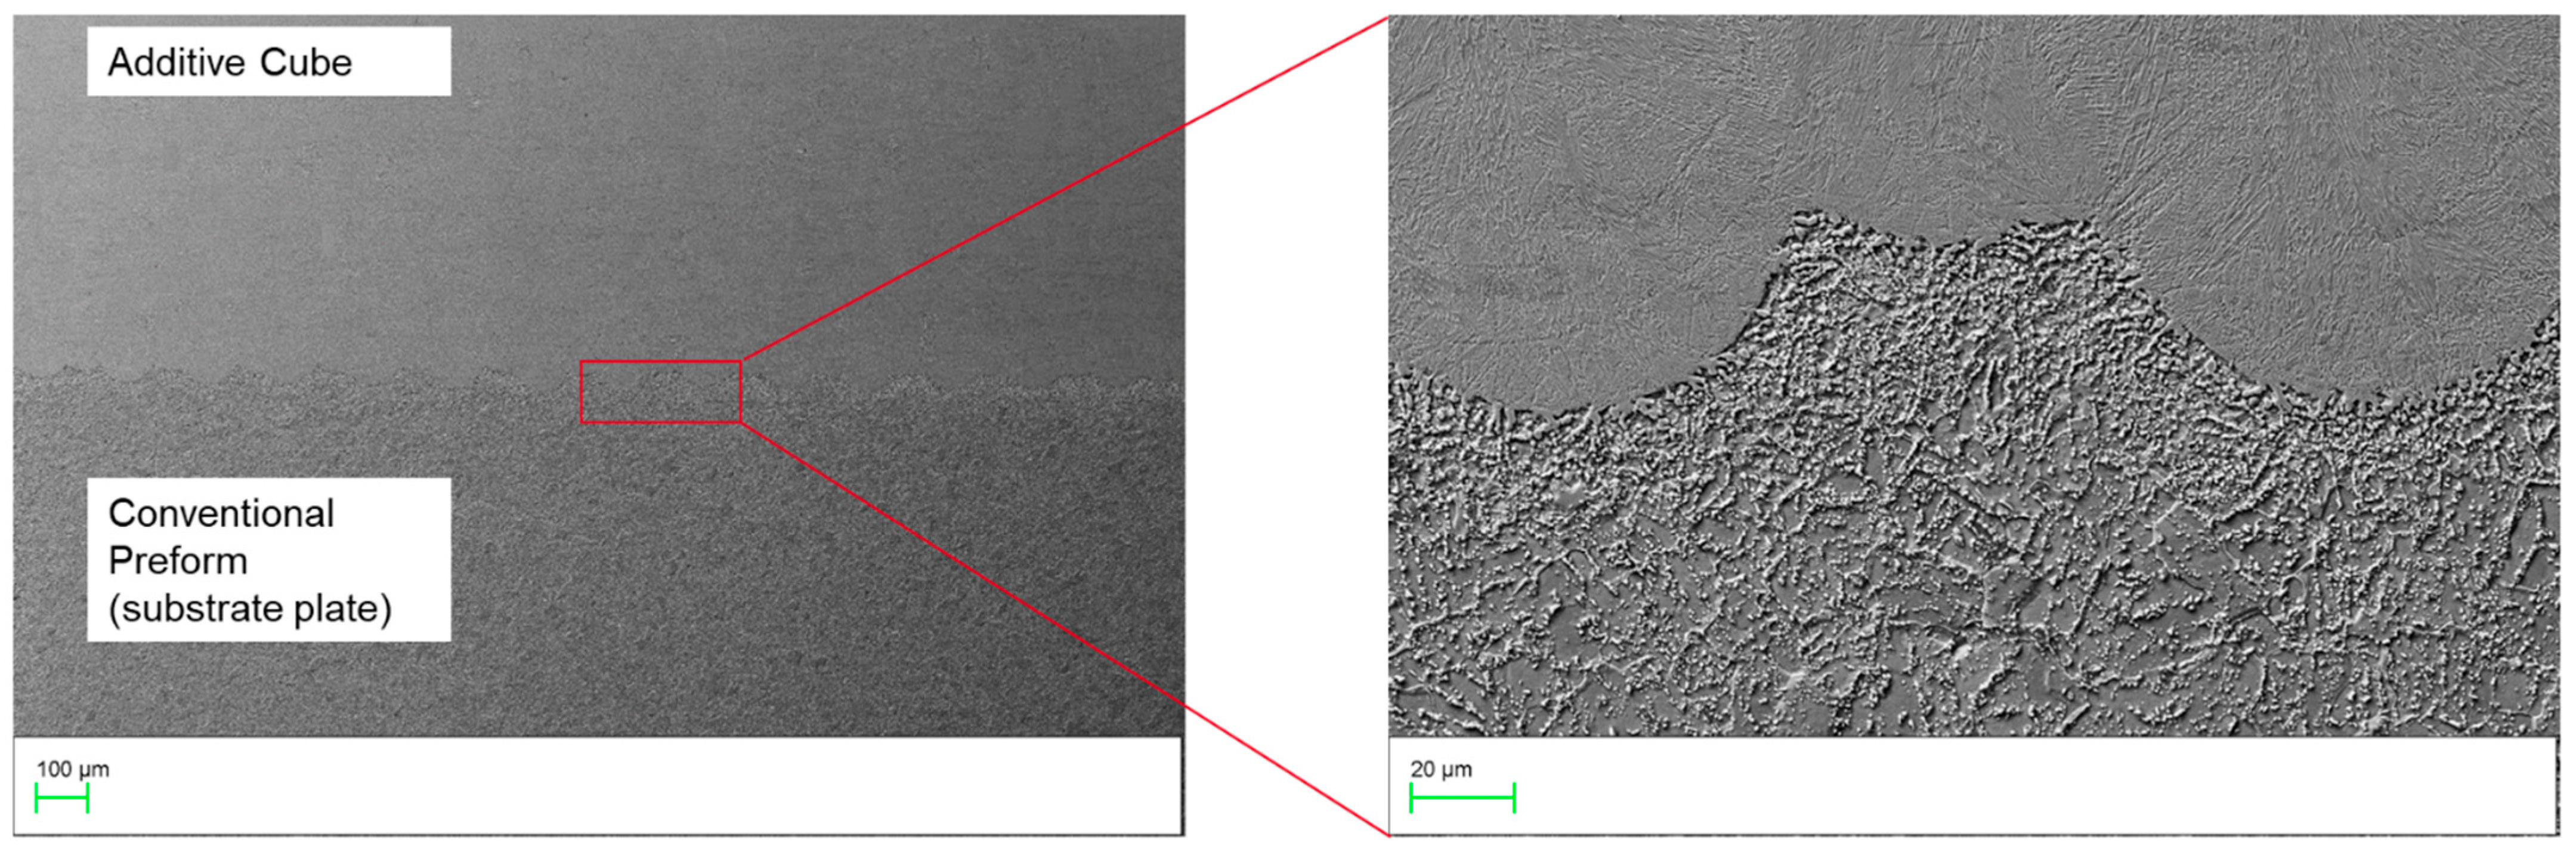
The surface roughness is measured on the outer cube walls as well as inside the cube channels (channel floor and ceiling) using a Keyence VHX7000 microscope. By creating a Z-stack, a 3D model of the surface was obtained on which surface roughness can be measured. To determine the effect of LPBF process parameter on surface roughness, a statistical effect analysis was carried out.

2.8. Tool Repair

For the tool repair, a worn 1.2343 tool preform was used as the base material. The worn top of the tool was removed via electron discharge machining (EDM). The prepared preform was fixed onto the middle of a substrate plate by a screw. Using a guide laser pointer, the additive repair was positioned manually. To ensure sufficient bonding between additive repair and preform, the first layer was melted twice.
After the LPBF tool repair, a 3D GOM scan was taken to ensure geometrical compliance. A hardness map from substrate, interface, and additive reconstruction was measured. HRC hardness was measured using a Qness 30A+ micro hardness tester. Hardness was measured along the build direction in the middle of the sample. A mean of three measurements per location was calculated.

3. Results

3.1. Relative Density and Microstructure

Since 1.2343 is a crack-susceptible tool steel, process parameters with and without preheating were tested. To identify the process window for 1.2343/H11 tool steel, a design of experiments (DoE) for no preheating, 300 °C, 400 °C, and 500 °C preheating was developed. The volume energy densities varied from 16 to 198 J/mm3. The achieved relative densities are shown in Figure 3. It can be seen that energy densities below 50 J/mm3 and above 150 J/mm3 show low relative densities. This holds true for no preheating and for all preheating temperatures. The highest relative densities are seen in the range of 50–150 J/mm3. The effect preheating has on the crack density can be seen in Figure 4. As can be seen, preheating only has a limited effect on reducing the crack density when comparing to no preheating. Only 400 °C preheating consistently reduces crack density in comparison to no preheating. Since the chosen preheating temperatures (300 °C, 400 °C, and 500 °C) can mostly be realized on laboratory machines, the samples manufactured without preheating are of particular interest. A cross-section of a sample manufactured with an EV of 69.93 J/mm3, no preheating, and a relative density of 99.99% is shown in Figure 5a. As can be seen, there is no porosity and no cracks. Figure 5b shows the microstructure in build direction of the sample. Even at high resolution and higher magnification, cracks cannot be identified. In Figure 5b, mostly columnar grains can be seen. Some equiaxed grains can be seen between columnar grains. The grains are oriented in build direction.

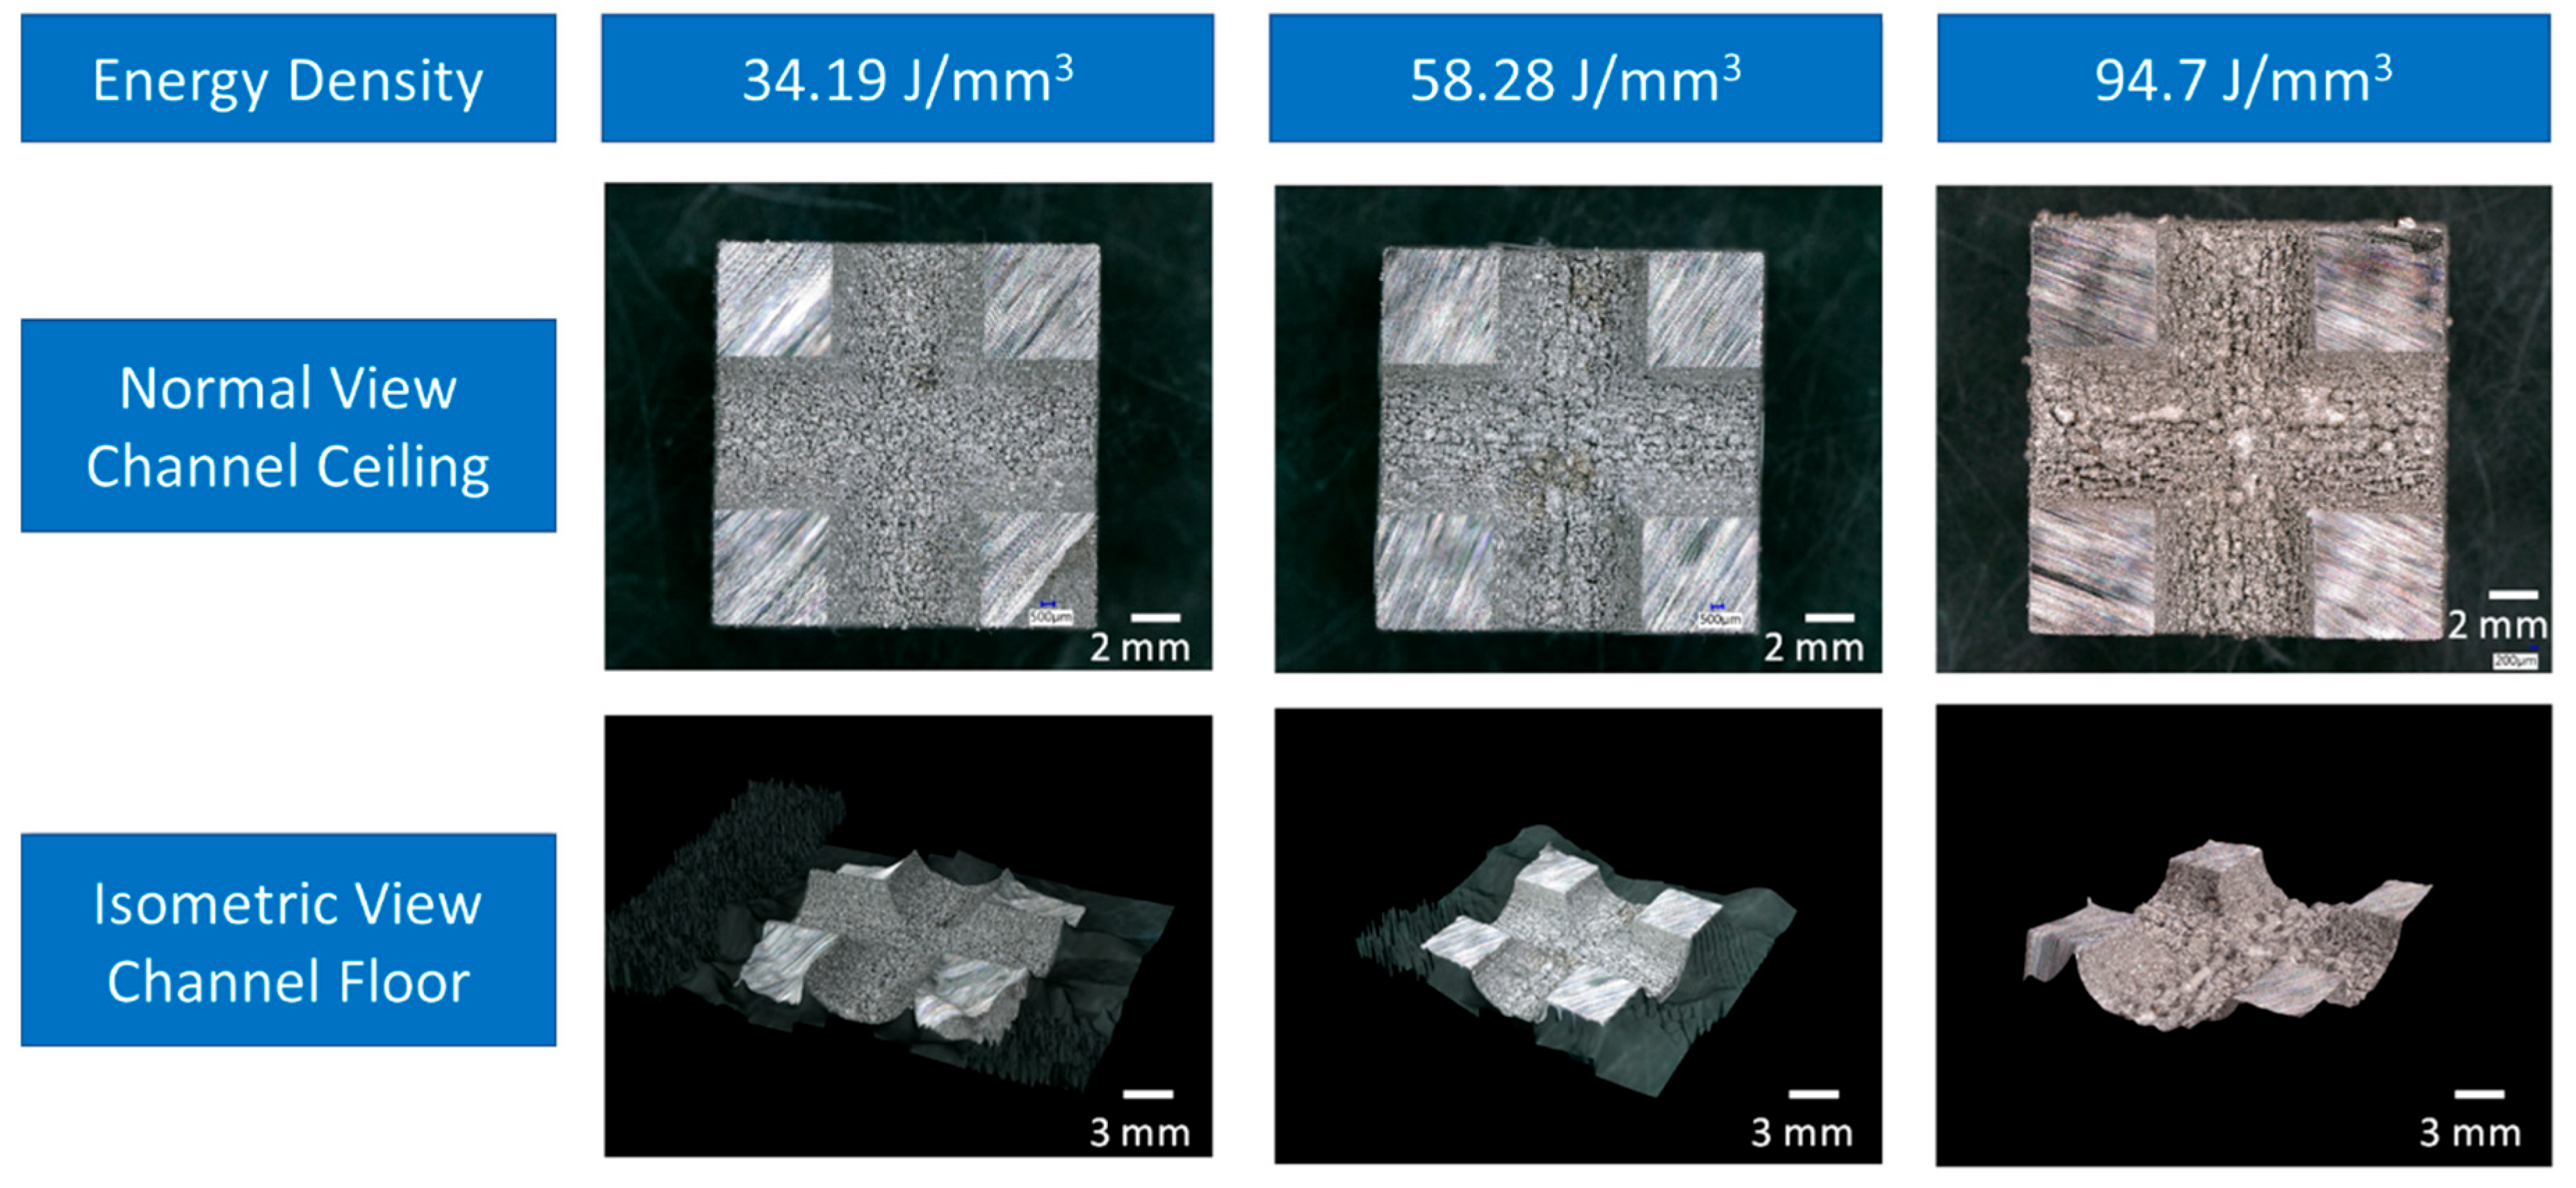
3.2. Surface Roughness

Figure 6 shows the average of three roughness measurements per energy density of the outer cube walls in build direction. A quality improvement in outer surface roughness at an energy density between 45 J/mm³ and 70 J/mm³ was observed. Energy densities below 45 J/mm3 and above 70 J/mm3 lead to increased roughness. The energy density required for improved surface roughness (45–70 J/mm3) overlaps with the energy density required to achieve a high relative density (50–150 J/mm3, see Figure 3).
Table 2 shows the average roughness values of the surfaces within the internal channels out of three measurements. Samples with low energy density 34.19 J/mm3, medium energy density 58.28 J/mm3, and high energy density 94.7 J/mm3 were examined. When considering the roughness for the channel floor, the lowest roughness is achieved with medium energy density. The roughness for channel ceiling and channel floor of low and high energy densities are similar.
The highest measured value of the cube wall thickness is 5401 µm (nominal 5000 µm) manufactured with 34.19 J/mm3, which lies outside the energy density range required for a high relative cube density (50–150 J/mm3, see Figure 3). The lowest wall thickness measured is 3659 µm (nominal 5000 µm) manufactured with 94.7 J/mm3, which lies within the energy density range required for a high relative cube density (50–150 J/mm3, see Figure 3). These measurements show a decrease in cube wall thickness with an increase in energy density. Figure 7 shows a linear reduction in channel diameter with increased energy density. The corresponding channel cross-sections can be seen in Figure 8.
In Figure 8, a clear qualitative distinction between the samples can be seen in channel ceiling morphology. Sample 94.7 J/mm³, which was produced with the highest energy density, shows the coarsest macrostructure with many larger sintering points. In contrast, sample 58.28 J/mm³ (medium energy density) shows a lower number of sintered particles. The surface image of sample 34.19 J/mm³ (low energy density) shows the finest surface structure (also confirmed by Table 2).

3.3. Tensile Properties

The tensile properties are shown in Figure 9. Each stress–strain curve is a mean of three measurements. The bump in the stress strain curves is caused by a change in strain rate. The strain rate was carried out as stated in DIN EN ISO 6892-1:2009. The as-built samples show the highest tensile strength (1808 MPa), followed by sand blasted (1719 MPa) and machined (1672 MPa). There is an 8.13% difference in tensile strengths. In terms of strain, machined and as-built samples show similar results.

3.4. Tool Repair

The additive cube and the conventional preform are both made out of 1.2343/H11 tool steel. Figure 10 shows a cross-section of a repaired sample. As shown in Figure 10, the interface (overlap between additive cube and substrate) is ~200 µm thick. When considering the microstructure (see Figure 11), additive repair and conventional preform can clearly be differentiated. The microstructure of the additive half is much finer. The microstructure of the conventional preform is coarser with large precipitates. The hardness map from conventional preform, interface, and additive repair is shown in Figure 12. It can be seen that the additive repair shows the highest hardness with 56 HRC, the interface 47 HRC, and the conventional 20 HRC.
The interface of the tool repair is seen in Figure 13a. The positioning of the preform is characterized by a 3D GOM Scan, shown in Figure 13b. The GOM Scan shows a geometrical compliance at the interface in the range of +1 mm to −1 mm.

4. Discussion

Figure 3 shows that the highest relative densities are achieved between 50–150 J/mm3. Lower energy densities do not supply enough energy to fully melt the powder leading to lack of fusion [29]. Higher energy densities induce too much energy, leading to keyholing [29].
Preheating only shows a limiting effect on reducing crack density. Similar crack densities are shown in Figure 4 for no preheating, 300 °C, and 500 °C. Only 400 °C preheating was able to consistently reduce crack density. Reducing temperature gradients during the LPBF process is therefore a limited means to manufacture crack sensitive materials, indicating that the chemical composition is the key cause [30] and opportunity to reduce crack susceptibility. Preheating thus increases the number of process parameters during process window development, since the cool down after the LPBF process must also be considered [31,32]. Hot cracking occurs during solidification when dendrites shrink and liquid cannot refill the space. According to Clyne et al. [33], there are two time periods where materials are prone to hot cracking during solidification:
  • Liquid volume fraction between 0.1–0.01
  • Liquid volume fraction between 0.6–0.1
While the process window is sensitive to small changes in energy density with regards to crack density (see Figure 4), a balance between the two times proposed by Clyne et al. [33] was identified when an EV of 69.93 J/mm3 and no preheating or preheating of 400 °C was used to manufacture 1.2343/H11 tool steel with LPBF. According to Gor et al. the most influential parameters to increase relative density are laser power, scan speed, and layer thickness [34].
Similar to the microstructure shown in Figure 5, the microstructure of the additive repair consists mostly of columnar grains oriented in build orientation. Due to the length of the grains, epitaxial grain growth can be assumed. However, epitaxial grain growth needs to be validated with an electron backscatter diffraction scan. Some equiaxed grains can be seen, which can be correlated to the scan strategy and hatch distance used. The difference in microstructure is due to the scan strategy and the rotation of 90°. Similar microstructures were found by Arisoy et al. with Ti64 [35], leading to the assumption that this result is independent of material but rather depends on cooling rate and temperature distribution. Similar microstructures are also found for Al alloys manufactured with LPBF [36]. Therefore, the obtained microstructure corresponds to the expected LPBF microstructure.
The additive repair was not perfectly positioned. Positioning therefore needs to be optimized. The coordinate system of the LPBF machine should be synchronized with the coordinate system of the pre-processing software. The additive repair can then be positioned more precisely. Additionally, the repair should be upscaled to account for shrinkage. Excess material can be removed in post-processing.
Hardness is not homogeneous throughout the tool. This result can be correlated to the observed microstructures, in particular grain size. The additive repair experiences much higher cooling rates (i.e., 106 K/s [29,37]) compared to the conventional preform. The fast cooling rate leads to grain refinement within the additive repair causing higher strength according to the Hall–Petch relation [38,39]. Similar results were found by Tian et al. with regards to tensile properties [40]. Subsequent heat treatment could homogenize the microstructure.
The surface roughness listed in Table 2 shows the highest values for low and high energy densities. When using high energy densities, powder particles partially melt onto the surface of the component increasing surface roughness. At low energy densities, the energy used does not suffice to melt the powder, therefore particles sinter onto the component surface, again increasing surface roughness. The channel floors show lower surface roughness since there are no overhanging structures. Each new powder layer is supported by solid material. The channel ceiling shows higher surface roughness due to the overhanging structure being supported by powder. Using low energy densities for the channel ceiling causes sintering of the powder, while high energy densities lead to partial melting. Both cases increase surface roughness.
The difference in tensile properties in as-built, sand blasted, and machined lies at approximately 8%. A possible hypothesis for the small difference could be the generated heat during machining. This generated heat at the surface could alter the microstructure at the surface, reducing the tensile strength. For sand blasting, the collision of the glass beads onto the sample surface could lead to work hardening, altering the materials properties at the surface. These hypotheses need to be verified in further studies. Since the microstructure at the core of the cylinder is not altered, the ductilities remain similar at roughly 2%. These results agree with literature [7,41,42].
By means of the effect size analysis, a conclusion about the effect on surface roughness when changing the factors (i.e., process parameters) is possible [43]. The calculation of an effect is shown in Equation (1). An effect describes the mean recorded change of the quality characteristic (i.e., surface roughness) when changing the factor setting (i.e., process parameters) from low to high.
C F a c t o r = i = 1 n y i n j = 1 m y j m
where
C: effect related to the selected factor
n: Number of high-level expressions of the chosen factor.
m: number of low-level expressions of the selected factor
yi: quality characteristic at high level of the selected factor
yj: quality characteristic at low level of the selected factor
The interaction is the average mutual influence of several factors on their effect on surface roughness. A high value for the interaction indicates a strong average influence on surface roughness and means that the interaction of the two factors with each other plays a significant role on the surface roughness. An interaction exists for two, three, or more factors. Within the scope of this study, a total of three factors (i.e., laser power, scan speed, and hatch distance) is considered.
In the context of surface roughness, values as low as possible should be aimed for. Accordingly, effects and interactions with a negative sign show quality improvement. A positive sign indicates a deterioration of the surface roughness. Table 3 shows that the process parameters on their own have a negligible influence on surface roughness. Thus, a change in laser power, hatch distance, or scan speed alone has a very small average effect on the measurement result. Similar results are seen for factors laser power × hatch distance and laser power × scan speed, whose average influence on the surface roughness is also small if the third factor remains unchanged.
In contrast, the interaction of scan speed × hatch distance shows an average influence on the surface roughness of 2.71. This means that the interaction of these two factors has the strongest influence on surface roughness.
The interaction of the combination of laser power × scan speed × hatch distance with an average effect of 1.25 on the surface roughness shows the second largest influence.
Based on these results, it is recommended to optimize hatch distance and scan speed simultaneously and then address laser power to achieve an energy density, ranging between 50–150 J/mm3 to achieve a high relative density. To reduce surface roughness, a small hatch distance and fast scan speed should be chosen.
Considering channel diameter, the factors with an effect with a negative sign are particularly responsible for sintering and shrinkage of powder layers and vice versa. Table 4 shows that the process parameters hatch spacing, scan speed, and laser power on their own have the greatest influence on the dimensional stability of the channel diameter. In combination with the signs, it can be confirmed that lower energy densities lead to better dimensional stability.
A step change in scan speed × hatch distance leads to worse results, meaning a stronger sintering tendency in the overhang zone for equal step settings of the two factors.
The opposite is true for the interaction effects laser power × hatch distance and laser power × scan speed. However, these two interaction effects are considerably smaller than those previously discussed.
The energy density range required for high relative densities (50–150 J/mm3) agrees with the energy density required for dimensionally stable channel structure. This conclusion and the results related to the optimization direction are also confirmed by the results of Feng [44].
When considering the results of the sensitivity analysis, channel diameter, and relative density, it can be concluded that different parameter combinations cause a different effect:
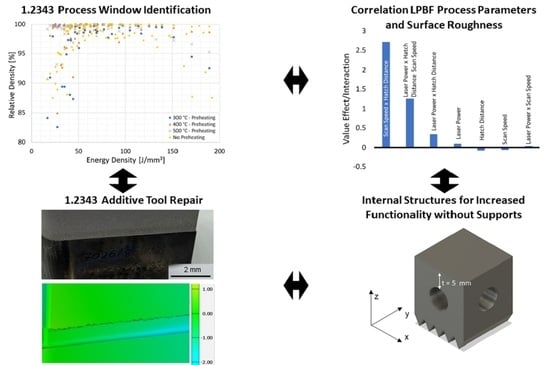
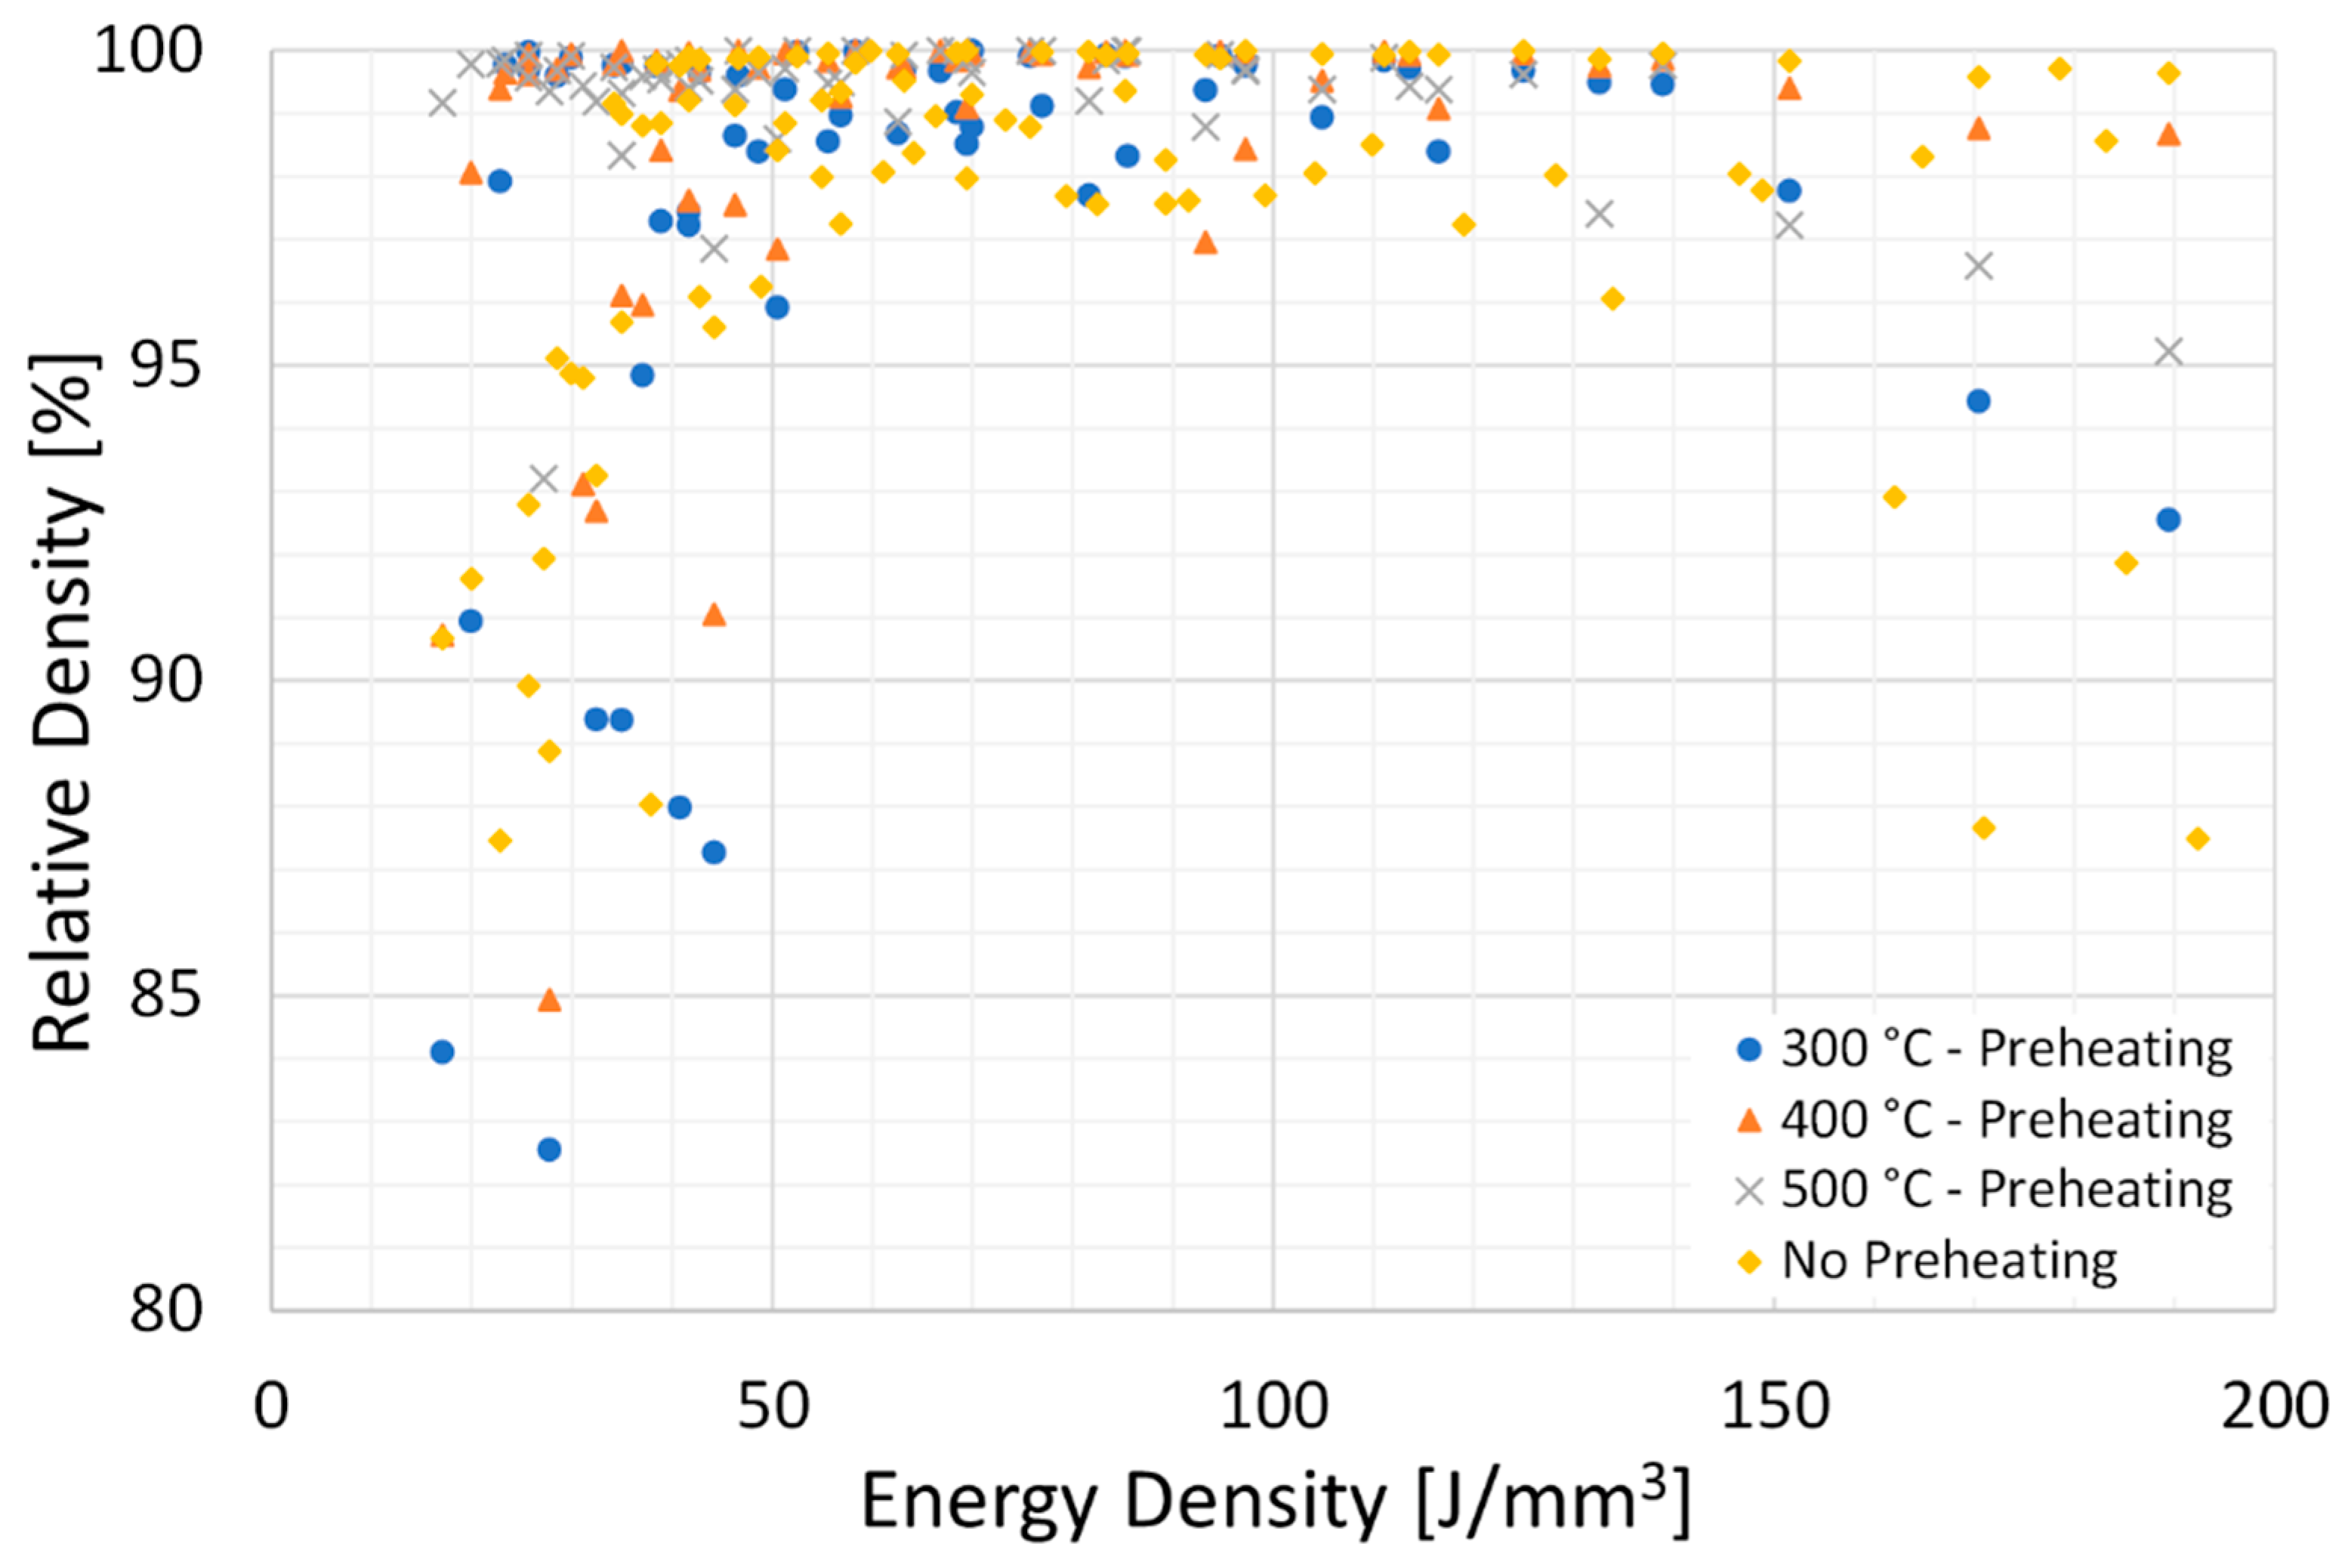
  • A high relative density is necessary to avoid defects. Too high an energy density leads to keyholing and if the energy density is too low, lack of fusion is found.
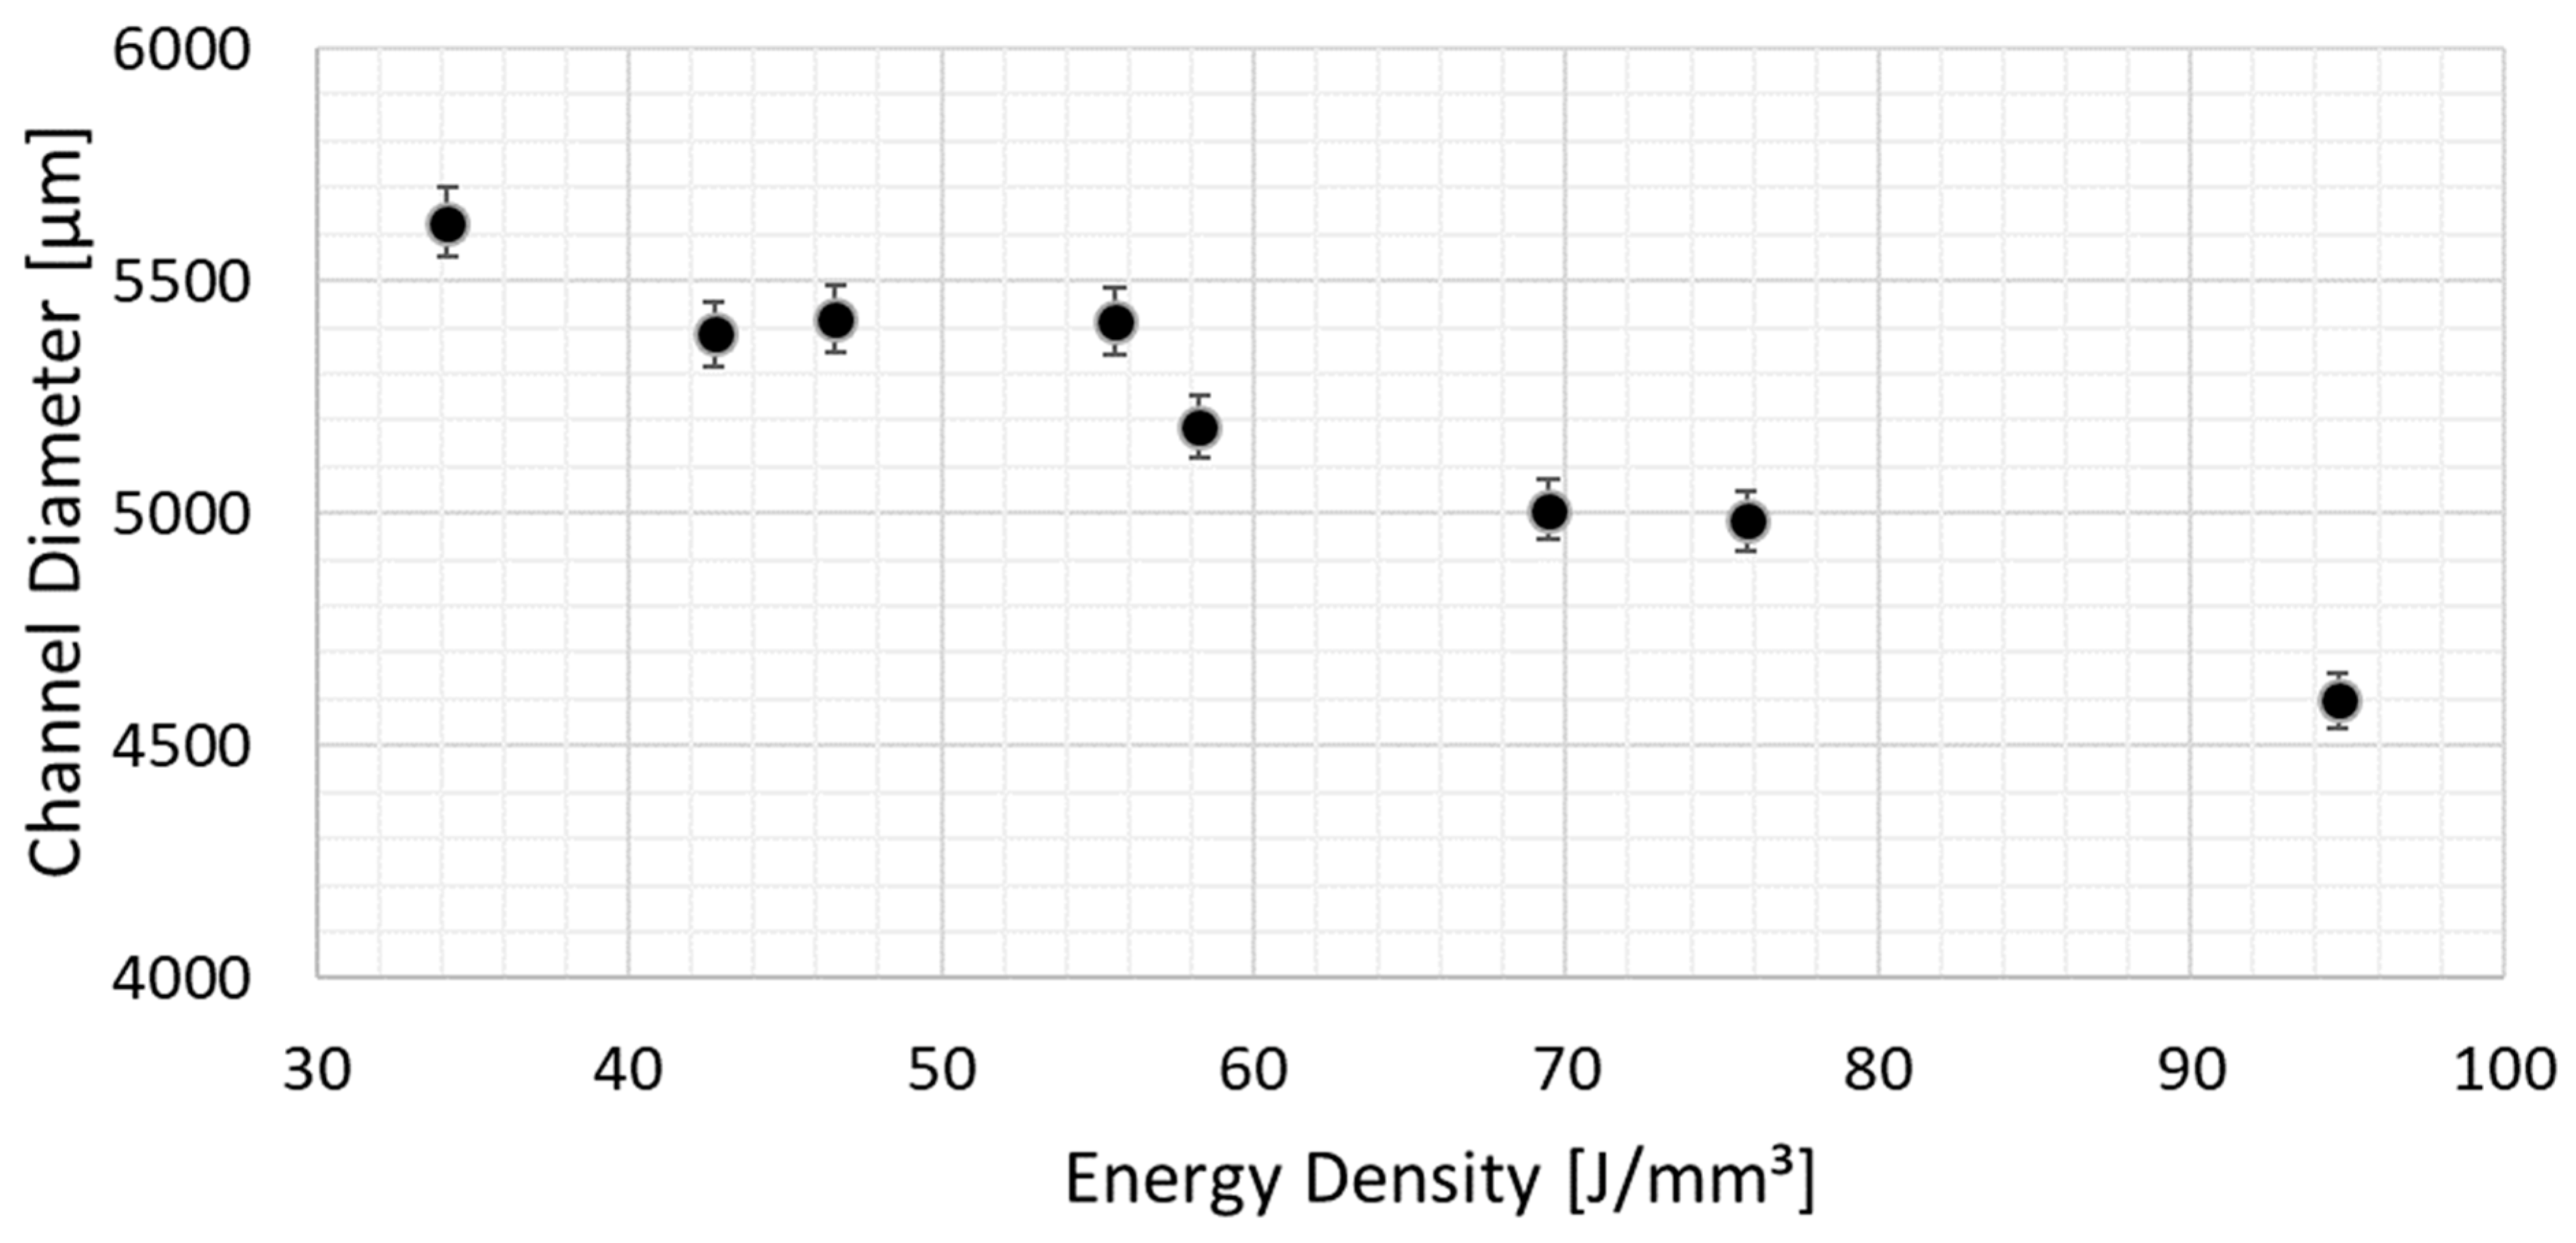
  • For improved channel diameter compliance, it was found that a minimum energy density leads to better results. This will cause a trade off when considering the relative density for the remaining volume of the component.
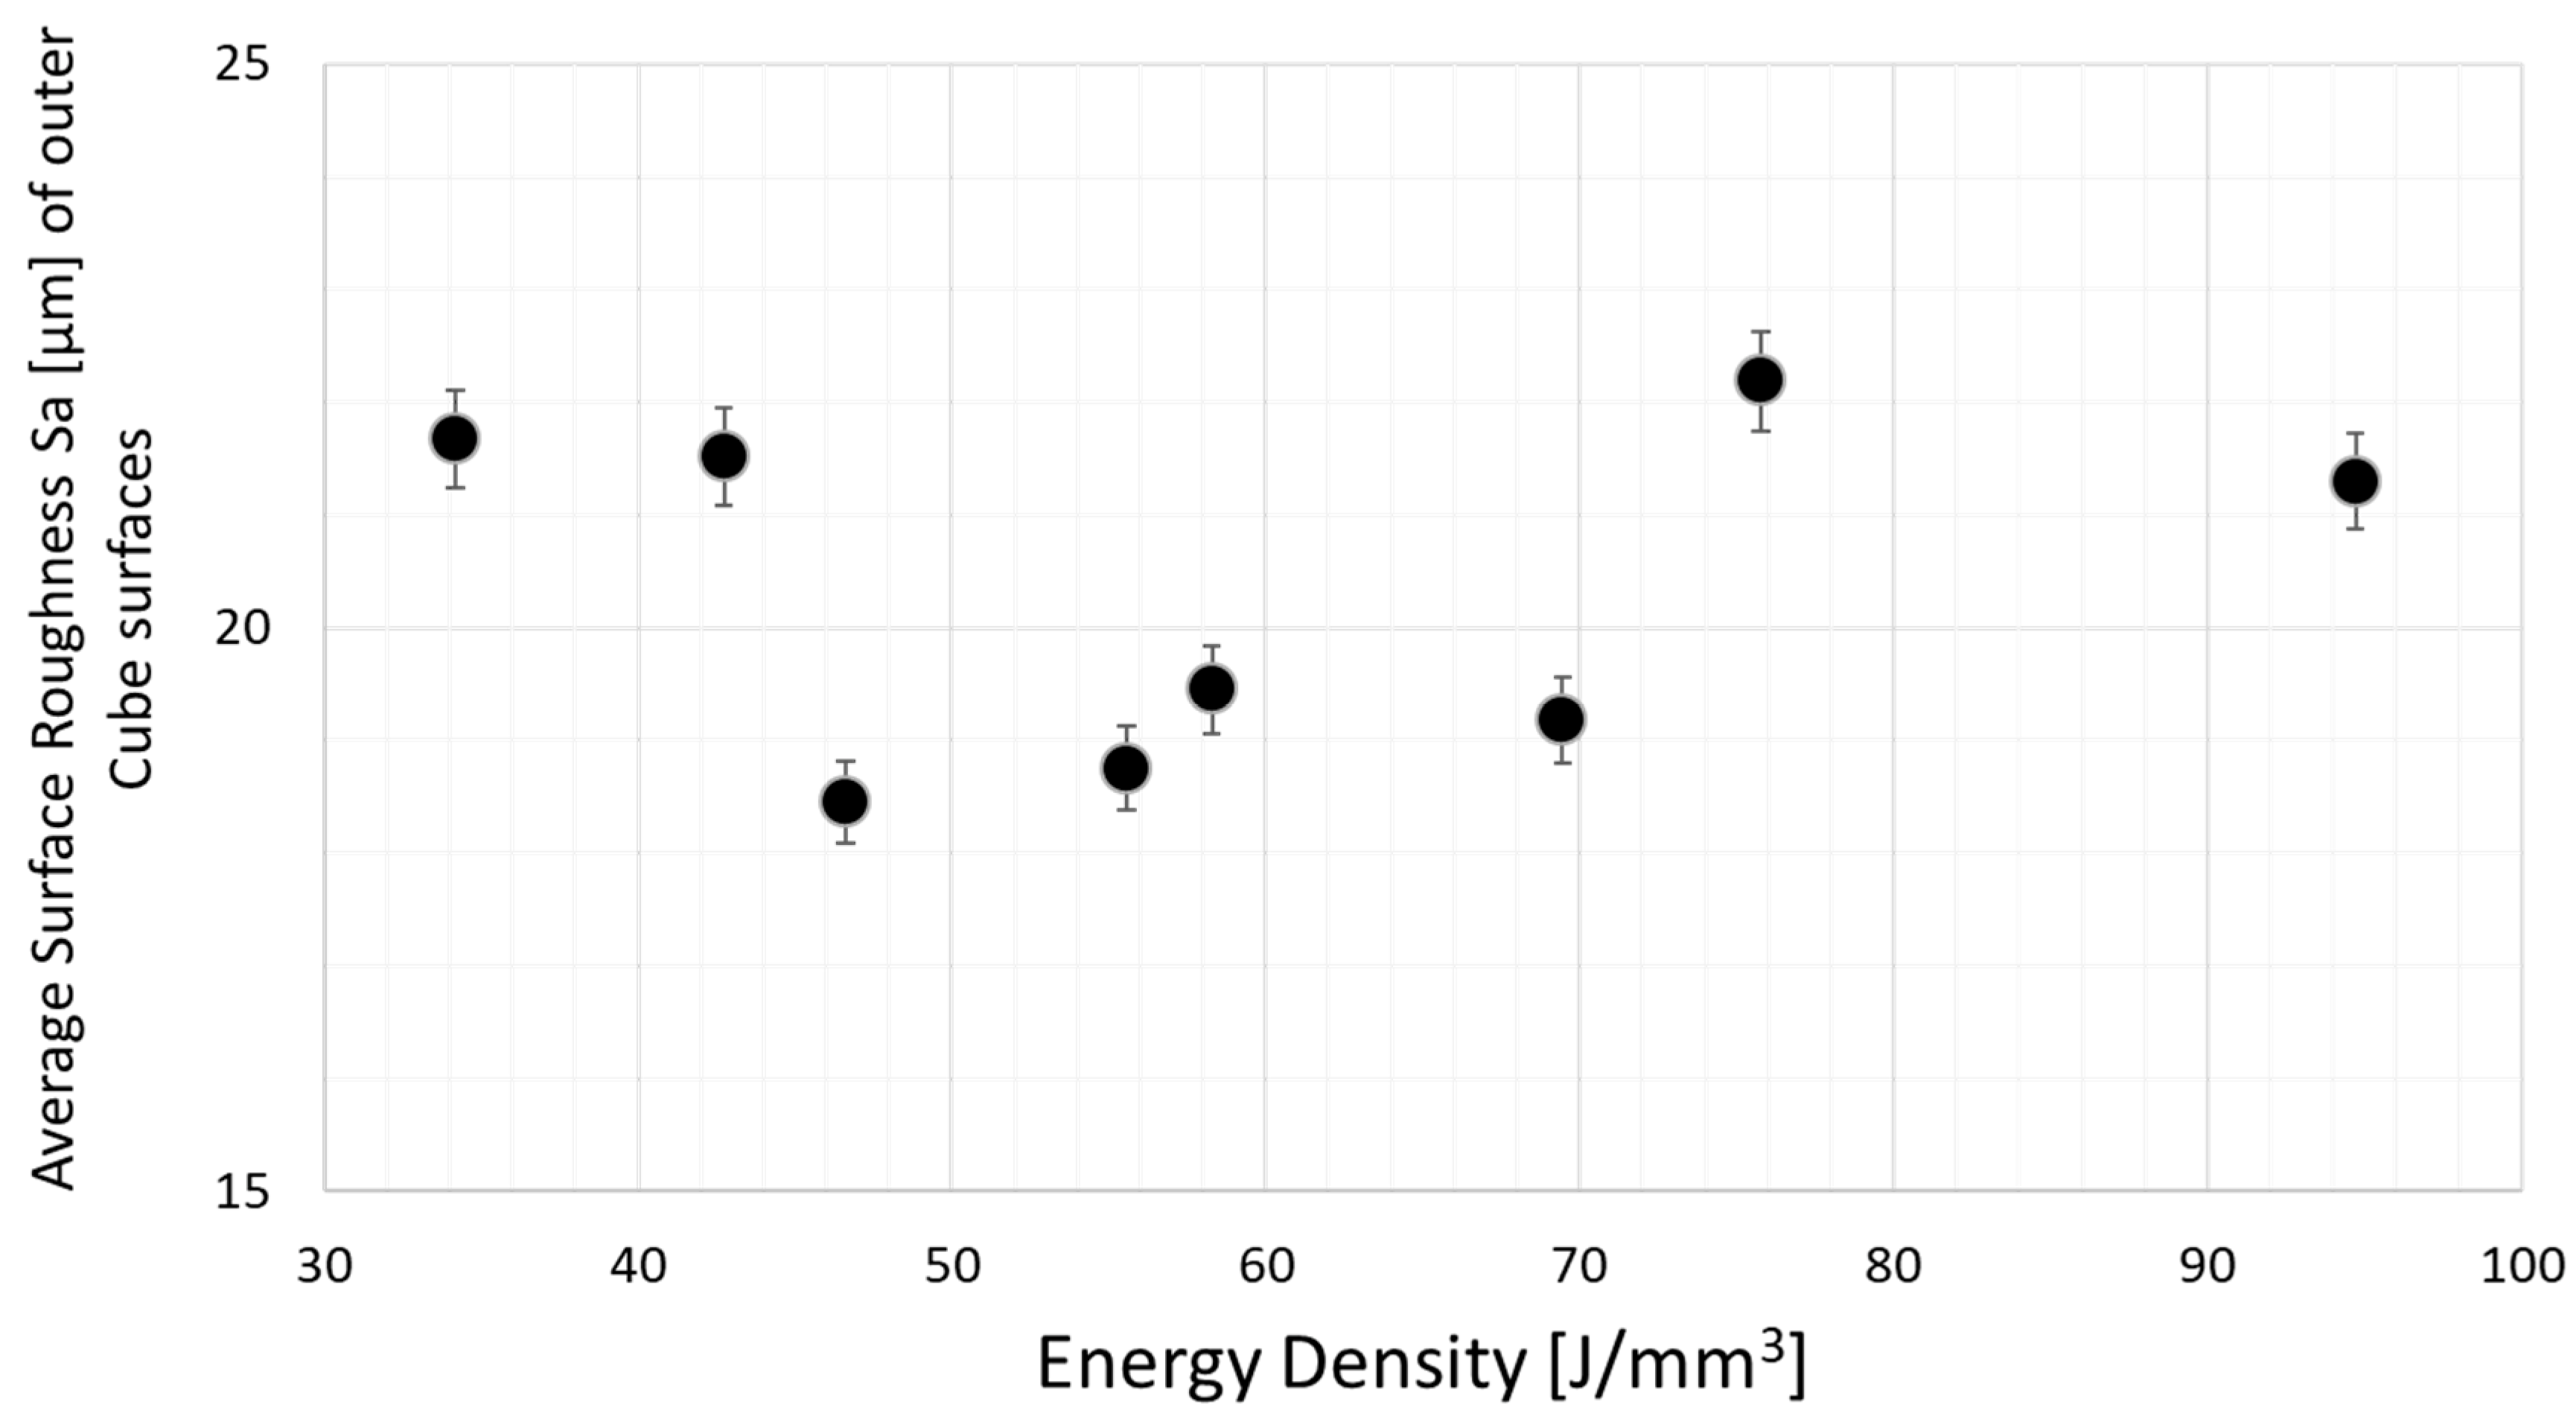
  • When considering surface roughness, the combination of scan speed and hatch distance played the largest role. Here, the possibility of adjusting contour parameters with this parameter combination would avoid adjusting the energy density for the entire component.

5. Conclusions and Outlook

In this study, 1.2343/H11 tool steel was successfully manufactured with LPBF without preheating.
  • An energy density of 69.93 J/mm3 and no preheating was used.
  • No pores or cracks could be found.
  • The tensile properties agree with those reported in literature.
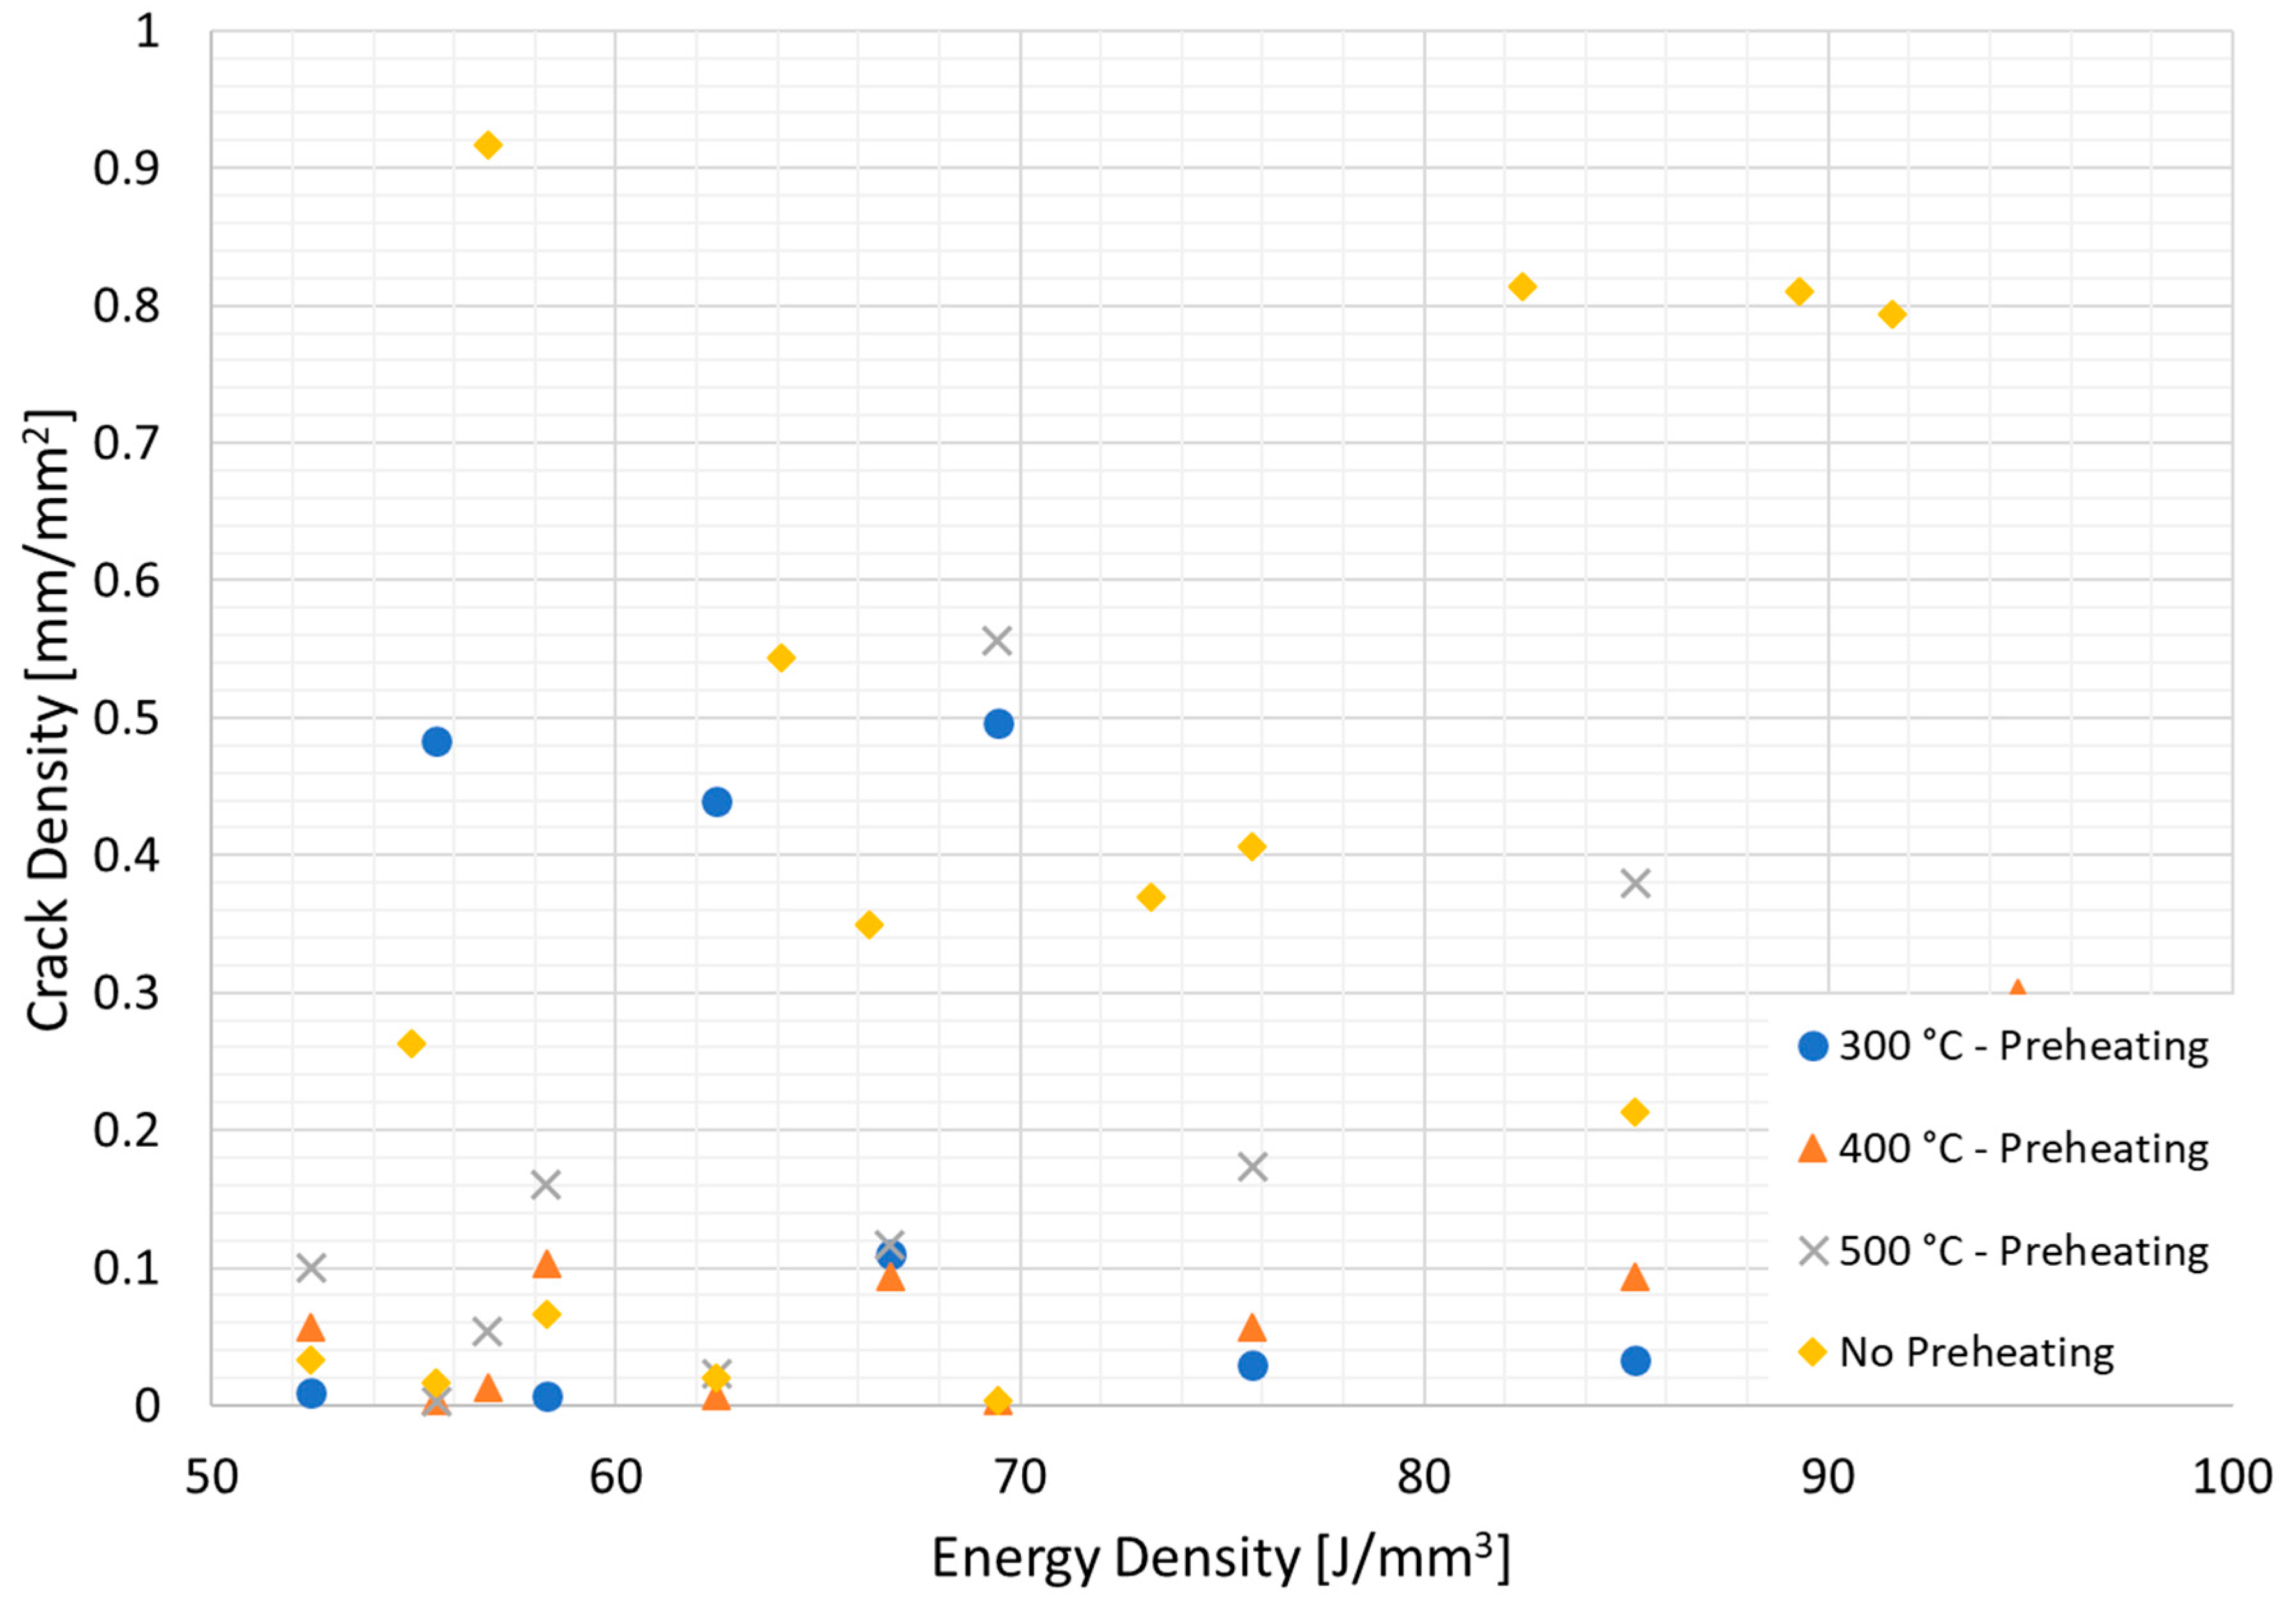
  • Preheating only showed a limited effect on reducing crack density.
A tool insert was successfully repaired using LPBF and was examined for mechanical properties and microstructure. The printed volume was ~2000 cm3.
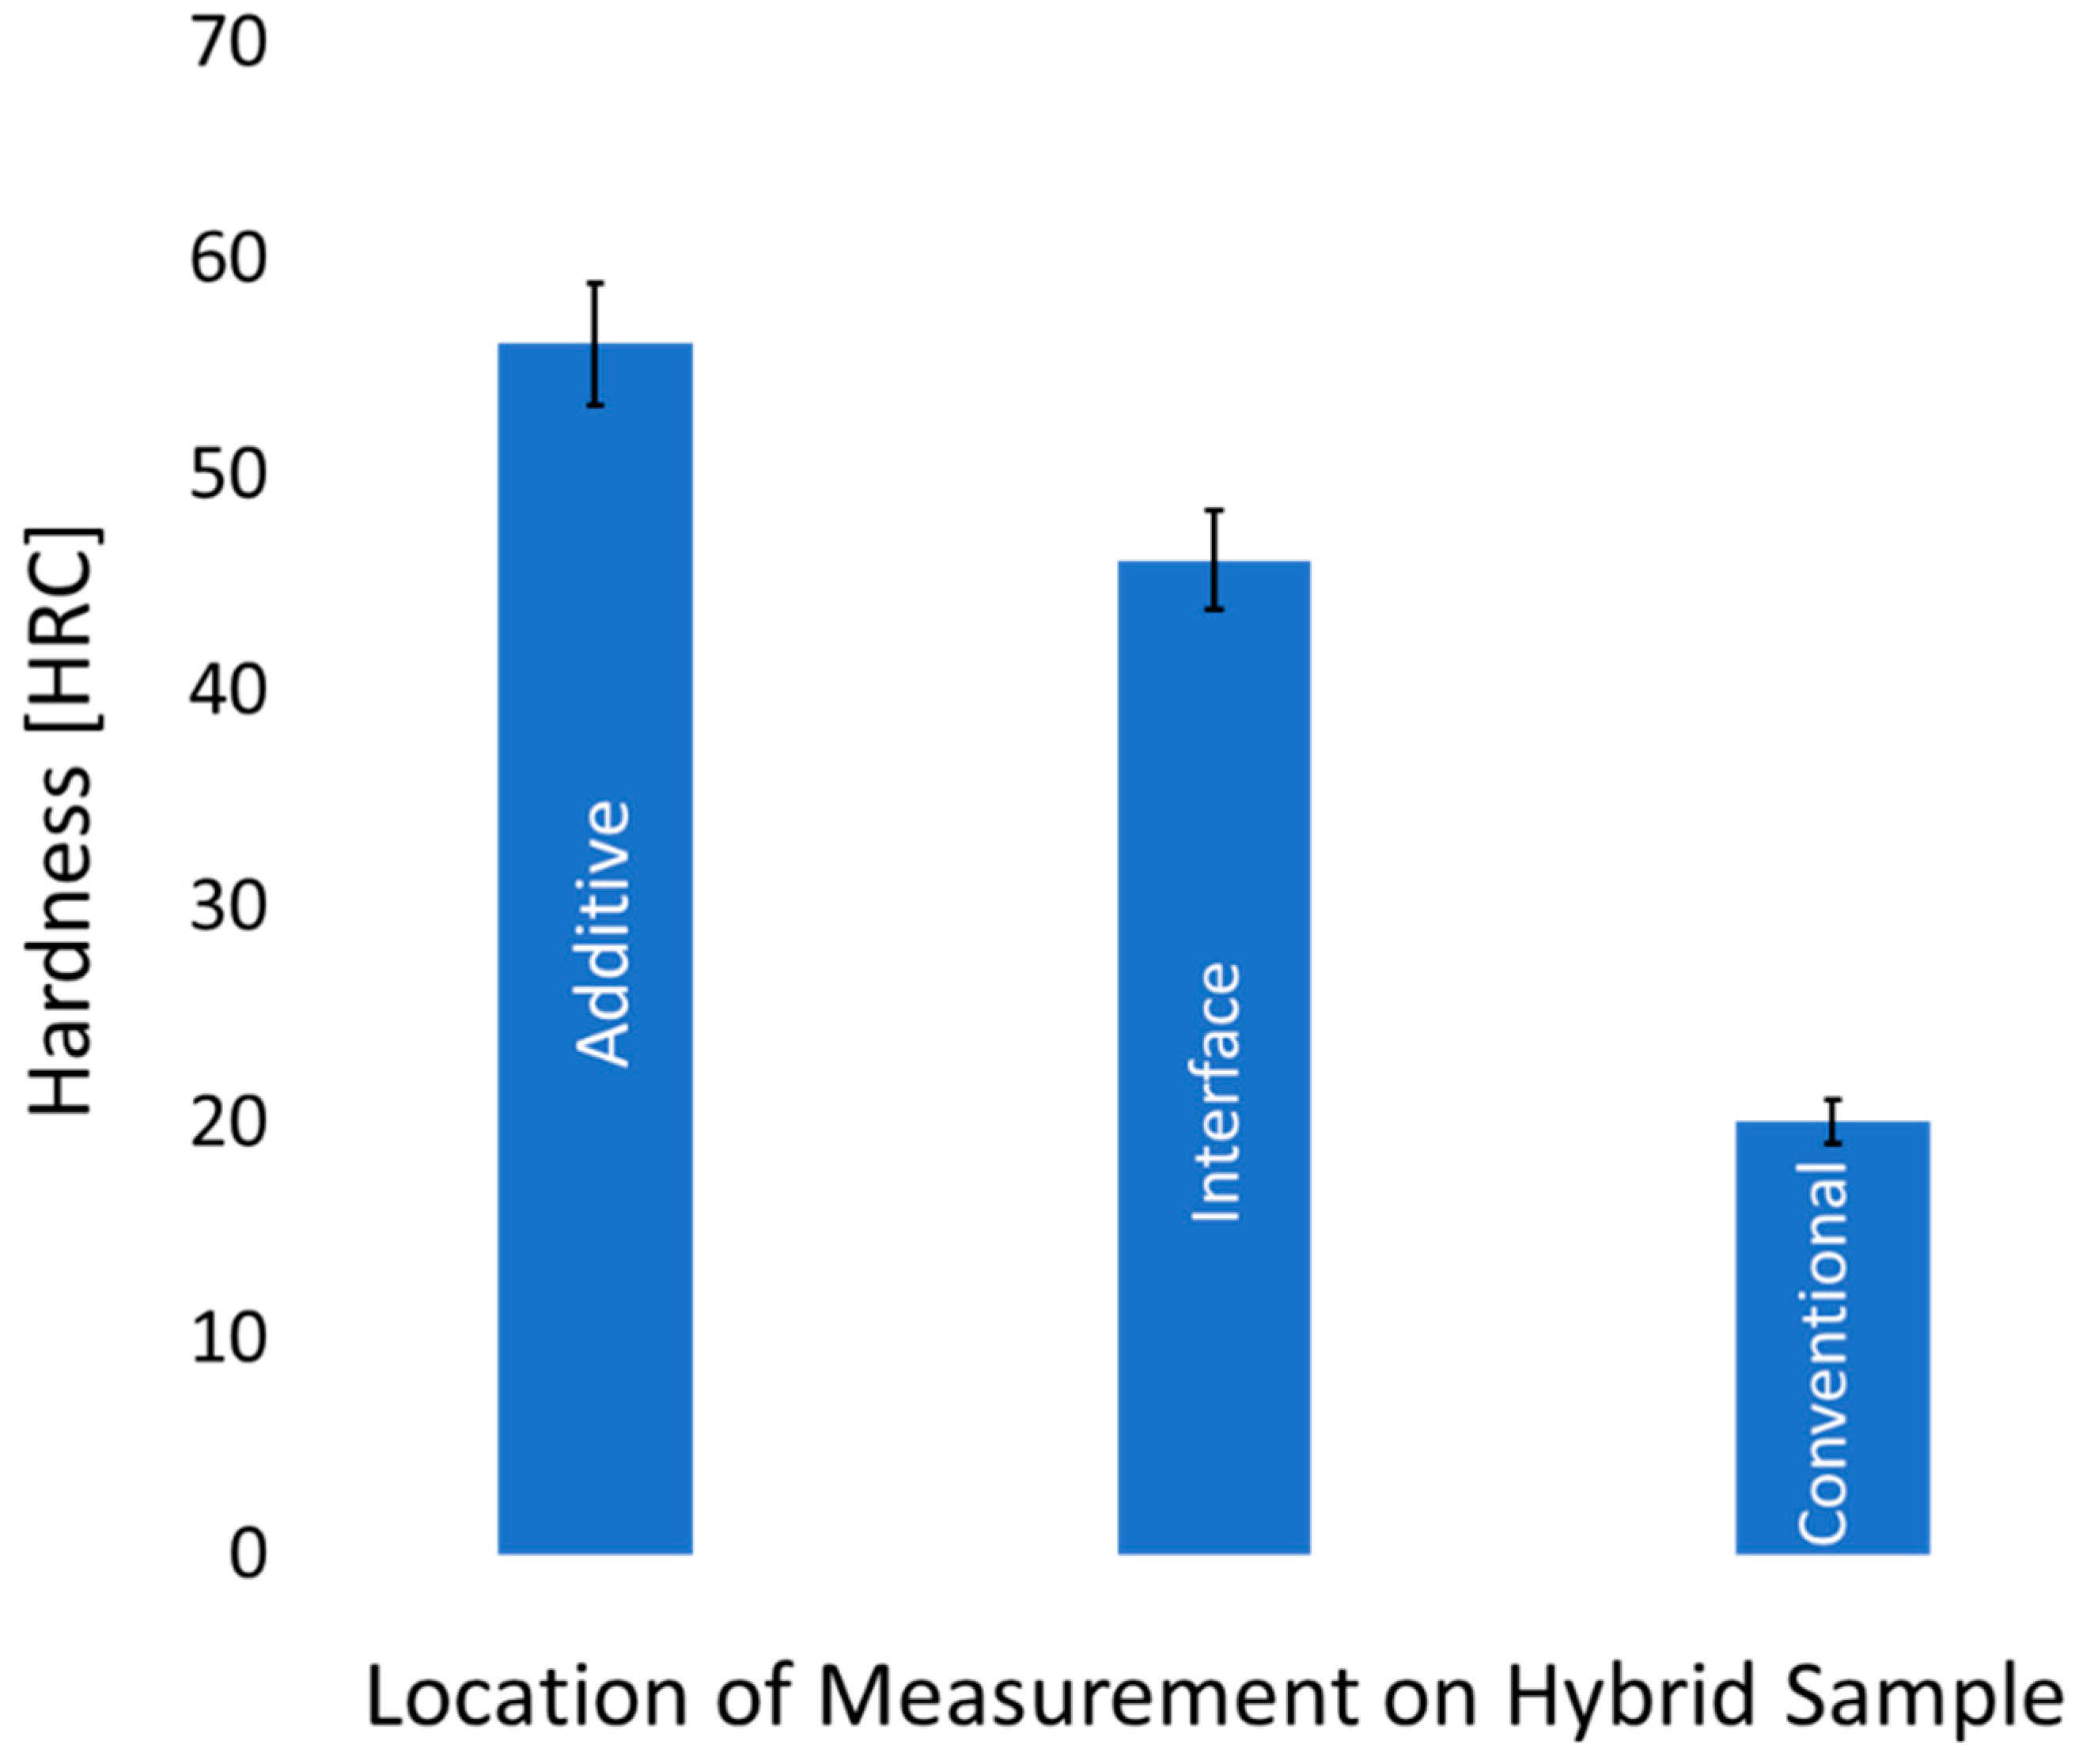
  • The hardness is not homogenously spread.
Therefore, heat treatments should be investigated in further studies.
  • CT scans of the repaired tool should also be considered in further studies to identify defects within the volume of the insert.
The relationship of laser power, scan speed, and hatch distance on surface the roughness of support-free channel structures was characterized.
  • Lower energy input is recommended for improved geometric compliance of channel structures. Higher energy densities lead to sagging of the surface layers and reduce dimensional stability.
  • Hatch distance, scan speed, and laser power should be adjusted in descending order to optimize the minimum channel diameter. It is recommended to use a small hatch distance and fast scan speed combined with a high laser power. The energy density range of 50–150 J/mm3 should be considered to simultaneously achieve high relative densities.
  • The interaction of scan speed and hatch distance has a significant effect on geometric compliance and surface roughness and should be further investigated in further studies.

Author Contributions

Conceptualization, S.M.; Formal analysis, S.M.; Methodology, S.M. and R.K.; Supervision, R.K. and J.H.S.; Visualization, S.M.; Writing—original draft, S.M.; Writing—review & editing, S.M., R.K. and J.H.S. All authors have read and agreed to the published version of the manuscript.

Funding

This research received no external funding.

Institutional Review Board Statement

Not applicable.

Informed Consent Statement

Not applicable.

Data Availability Statement

Data is not available.

Conflicts of Interest

The authors declare no conflict of interest.

References

  1. DIN EN ISO 17296-3:2016-12; Additive Manufacturing—General Principles—Part 3: Main Characteristics and Corresponding Test Methods (ISO 17296-3:2014). ISO: Berlin, Germany, 2014.
  2. DIN EN ISO 17296-4:2016-12; Additive Manufacturing—General Principles—Part 4: Overview of Data Processing (ISO 17296-4:2014). ISO: Berlin, Germany, 2014.
  3. DIN EN ISO/ASTM 52900:2017-06; Additive Manufacturing—General Principles—Terminology (ISO/ASTM 52900:2015). ISO: Berlin, Germany, 2015.
  4. Herderick, E. Additive Manufacturing of Metals: A Review. Mater. Sci. Technol. 2011, 1413–1425. [Google Scholar]
  5. Diegel, O.; Nordin, A.; Motte, D. A Practical Guide to Design for Additive Manufacturing; Springer: Singapore, 2019. [Google Scholar]
  6. Grasso, M. In Situ Monitoring of Powder Bed Fusion Homogeneity in Electron Beam Melting. Materials 2021, 14, 7015. [Google Scholar] [CrossRef] [PubMed]
  7. Huber, F.; Bischof, C.; Hentschel, O.; Heberle, J.; Zettl, J.; Nagulin, K.Y.; Schmidt, M. Laser beam melting and heat-treatment of 1.2343 (AISI H11) tool steel—Microstructure and mechanical properties. Mater. Sci. Eng. A 2019, 742, 109–115. [Google Scholar] [CrossRef]
  8. Thomas, D. The Development of Design Rules for Selective Laser Melting. Ph.D. Thesis, University of Wales; National Centre for Product Design & Development Research, Cardiff, UK, 2009. [Google Scholar]
  9. Junker, D.; Hentschel, O.; Schmidt, M.; Merklein, M. Investigation of Heat Treatment Strategies for Additively-Manufactured Tools of X37CrMoV5-1. Metals 2018, 8, 854. [Google Scholar] [CrossRef] [Green Version]
  10. Carter, L.N. Selective Laser Melting of Nickel Superalloys for High Temperature Applications. Ph.D. Thesis, University of Birmingham, Birmingham, UK, 2013. [Google Scholar]
  11. Yadroitsev, I. Selective Laser Melting: Direct Manufacturing of 3D-Objects by Selective Laser Melting of Metal Powders; LAP Lambert Academic Publishing: Sunnyvale, CA, USA, 2009. [Google Scholar]
  12. Armillotta, A.; Baraggi, R.; Fasoli, S. SLM tooling for die casting with conformal cooling channels. Int. J. Adv. Manuf. Technol. 2014, 71, 573–583. [Google Scholar] [CrossRef] [Green Version]
  13. Wang, D.; Yang, Y.; Yi, Z.; Su, X. Research on the fabricating quality optimization of the overhanging surface in SLM process. Int. J. Adv. Manuf. Technol. 2013, 65, 1471–1484. [Google Scholar] [CrossRef]
  14. Han, Q.; Gu, H.; Soe, S.; Setchi, R.; Lacan, F.; Hill, J. Manufacturability of AlSi10Mg overhang structures fabricated by laser powder bed fusion. Mater. Des. 2018, 160, 1080–1095. [Google Scholar] [CrossRef]
  15. Tan, C.; Wang, D.; Ma, W.; Chen, Y.; Chen, S.; Yang, Y.; Zhou, K. Design and additive manufacturing of novel conformal cooling molds. Mater. Des. 2020, 196, 109147. [Google Scholar] [CrossRef]
  16. Shange, M.; Yadroitsava, I.; Du Plessis, A.; Yadroitsev, I. Roughness and Near-Surface Porosity of Unsupported Overhangs Produced by High-Speed Laser Powder Bed Fusion. 3d Print. Addit. Manuf. 2021, 9, 288–300. [Google Scholar] [CrossRef]
  17. Wang, D.; Yang, Y.; Zhang, M.; Lu, J.; Liu, R.; Xiao, D. Study on SLM fabrication of precision metal parts with overhanging structures. In Proceedings of the 2013 IEEE International Symposium on Assembly and Manufacturing (ISAM), Xi’an, China, 30 July 2013–2 August 2013; pp. 222–225. [Google Scholar]
  18. Kruth, J.-P.; Bartolo, P.J. Feedback control of selective laser melting. In Proceedings of the 3rd International Conference on Advanced Research in Virtual and Rapid Prototyping, Leiria, Portugal, 24–29 September 2007; pp. 521–527. [Google Scholar]
  19. Gusarov, A.V.; Laoui, T.; Froyen, L.; Titov, V.I. Contact thermal conductivity of a powder bed in selective laser sintering. Int. J. Heat Mass Transf. 2003, 46, 1103–1109. [Google Scholar] [CrossRef]
  20. Dadić, Z.; Živković, D.; Čatipović, N. Surface wear of steel X38CrMoV5-1 in conditions of die casting. In Proceedings of the International Conference Mechanical Technologies and Structural Materials, Beijing, China, 30–31 December 2016. [Google Scholar]
  21. Persson, A. On Tool Failure in Die Casting. Ph.D. Dissertation, Acta Universitatis Upsaliensis and Comprehensive Summaries of Dissertations from the Faculty of Science and Technology, Karlstad, Sweden, 2003. [Google Scholar]
  22. Dadić, Z.; Živković, D.; Čatipović, N.; Bilić, J. High pressure die casting mould repair technologies. In Proceedings of the 7th International Conference “Mechanical Technologies and Structural Materials 2017”, Split, Croatia, 21–23 September 2017. [Google Scholar]
  23. Hantke, N.; Großwendt, F.; Strauch, A.; Fechte-Heinen, R.; Röttger, A.; Theisen, W.; Weber, S.; Sehrt, J.T. Processability of a Hot Work Tool Steel Powder Mixture in Laser-Based Powder Bed Fusion. Materials 2022, 15, 2658. [Google Scholar] [CrossRef] [PubMed]
  24. Raffeis, I.; Adjei-Kyeremeh, F.; Ewald, S.; Schleifenbaum, J.H.; Bührig-Polaczek, A. A Combination of Alloy Modification and Heat Treatment Strategies toward Enhancing the Properties of LPBF Processed Hot Working Tool Steels (HWTS). J. Manuf. Mater. Process. 2022, 6, 63. [Google Scholar] [CrossRef]
  25. Foster, J.; Cullen, C.; Fitzpatrick, S.; Payne, G.; Hall, L.; Marashi, J. Remanufacture of hot forging tools and dies using laser metal deposition with powder and a hard-facing alloy Stellite 21®. J. Remanufact. 2019, 9, 189–203. [Google Scholar] [CrossRef] [Green Version]
  26. Jiménez, A.; Bidare, P.; Hassanin, H.; Tarlochan, F.; Dimov, S.; Essa, K. Powder-based laser hybrid additive manufacturing of metals: A review. Int. J. Adv. Manuf. Technol. 2021, 114, 63–96. [Google Scholar] [CrossRef]
  27. Oh, W.J.; Lee, W.J.; Kim, M.S.; Jeon, J.B.; Shim, D.S. Repairing additive-manufactured 316L stainless steel using direct energy deposition. Opt. Laser Technol. 2019, 117, 6–17. [Google Scholar] [CrossRef]
  28. Aconity MINI|Aconity3D. Available online: https://aconity3d.com/de/products/aconity-mini/ (accessed on 28 February 2022).
  29. DebRoy, T.; Wei, H.L.; Zuback, J.S.; Mukherjee, T.; Elmer, J.W.; Milewski, J.O.; Beese, A.M.; Wilson-Heid, A.; De, A.; Zhang, W. Additive manufacturing of metallic components—Process, structure and properties. Prog. Mater. Sci. 2018, 92, 112–224. [Google Scholar] [CrossRef]
  30. Yan, X.; Lin, J.C. Prediction of hot tearing tendency for multicomponent aluminum alloys. Metall. Mater. Trans. B 2006, 37, 913–918. [Google Scholar] [CrossRef]
  31. Campbell, J. Castings; Elsevier Butterworth Heinemann: Oxford, UK, 2003. [Google Scholar]
  32. Rappaz, M.; Drezet, J.-M.; Gremaud, M. A new hot-tearing criterion. Metall. Mater. Trans. A 1999, 30, 449–455. [Google Scholar] [CrossRef] [Green Version]
  33. Clyne, T.W.; Davis, G.J. The Influence of Composition on solidification Cracking Susceptibility in Binary Alloy Systems. Br. Foundrym. 1981, 74, 65–73. [Google Scholar]
  34. Gor, M.; Soni, H.; Wankhede, V.; Sahlot, P.; Grzelak, K.; Szachgluchowicz, I.; Kluczyński, J. A Critical Review on Effect of Process Parameters on Mechanical and Microstructural Properties of Powder-Bed Fusion Additive Manufacturing of SS316L. Materials 2021, 14, 6527. [Google Scholar] [CrossRef]
  35. Arısoy, Y.M.; Criales, L.E.; Özel, T.; Lane, B.; Moylan, S.; Donmez, A. Influence of scan strategy and process parameters on microstructure and its optimization in additively manufactured nickel alloy 625 via laser powder bed fusion. Int. J. Adv. Manuf. Technol. 2017, 90, 1393–1417. [Google Scholar] [CrossRef]
  36. Wang, W.; Takata, N.; Suzuki, A.; Kobashi, M.; Kato, M. Microstructural Variations in Laser Powder Bed Fused Al-15%Fe Alloy at Intermediate Temperatures. Materials 2022, 15, 4497. [Google Scholar] [CrossRef] [PubMed]
  37. Scipioni Bertoli, U.; Wolfer, A.J.; Matthews, M.J.; Delplanque, J.-P.R.; Schoenung, J.M. On the limitations of Volumetric Energy Density as a design parameter for Selective Laser Melting. Mater. Des. 2017, 113, 331–340. [Google Scholar] [CrossRef] [Green Version]
  38. Megahed, S.; Aniko, V.; Schleifenbaum, J.H. Electron Beam-Melting and Laser Powder Bed Fusion of Ti6Al4V: Transferability of Process Parameters. Metals 2022, 12, 1332. [Google Scholar] [CrossRef]
  39. Porter, D.A.; Easterling, K.E.; Sherif, M. Phase Transformations in Metals and Alloys, Third Edition (Revised Reprint), 3rd ed.; CRC Press: Hoboken, NJ, USA, 2009. [Google Scholar]
  40. Tian, Y.; Zhao, M.; Liu, W.; Zhang, J.; Zhang, M.; Li, H.; Yin, D.; Atrens, A. Comparison on Tensile Characteristics of Plain C-Mn Steel with Ultrafine Grained Ferrite/Cementite Microstructure and Coarse Grained Ferrite/Pearlite Microstructure. Materials 2021, 14, 2309. [Google Scholar] [CrossRef]
  41. Holzweissig, M.J.; Taube, A.; Brenne, F.; Schaper, M.; Niendorf, T. Microstructural Characterization and Mechanical Performance of Hot Work Tool Steel Processed by Selective Laser Melting. Metall. Mater. Trans. B 2015, 46, 545–549. [Google Scholar] [CrossRef]
  42. Tan, C.; Weng, F.; Sui, S.; Chew, Y.; Bi, G. Progress and perspectives in laser additive manufacturing of key aeroengine materials. Int. J. Mach. Tools Manuf. 2021, 170, 103804. [Google Scholar] [CrossRef]
  43. Siebertz, K.; van Bebber, D.; Hochkirchen, T. Statistische Versuchsplanung; Springer: Berlin/Heidelberg, Germany, 2017. [Google Scholar]
  44. Feng, S.; Chen, S.; Kamat, A.M.; Zhang, R.; Huang, M.; Hu, L. Investigation on shape deviation of horizontal interior circular channels fabricated by laser powder bed fusion. Addit. Manuf. 2020, 36, 101585. [Google Scholar] [CrossRef]
Figure 1. SEM images of 1.2343/H11 tool steel powder (left) and PSD (right).
Jmmp 06 00139 g001
Figure 2. (a) Schematic representation of a cube with circular channels; (b) Positioning of cubes with circular channels; (c) Build job with cubes, the green numbers indicated sample numbers.
Jmmp 06 00139 g002
Figure 3. Relative density vs. energy density for the DoE of 1.2343/H11 tool steel.
Jmmp 06 00139 g003
Figure 4. Crack density vs. Energy density.
Jmmp 06 00139 g004
Figure 5. (a) Cross-section of sample manufactured without preheating and 69.93 J/mm3 with 99.99% relative density and no cracks; (b) Microstructure of sample shown in (a).
Jmmp 06 00139 g005
Figure 6. Roughness value Sa plotted against energy density for outer cube surfaces.
Jmmp 06 00139 g006
Figure 7. Plot of minimum channel diameters vs. energy density.
Jmmp 06 00139 g007
Figure 8. Cross-sectional views of the channel ceiling of the selected samples.
Jmmp 06 00139 g008
Figure 9. Stress–strain curves for 1.2343/H11 tool steel tensile samples (B4x20). The surfaces were differentiated between as-built, sand blasted, and machined.
Jmmp 06 00139 g009
Figure 10. Cross-section of repaired sample. The interface was measured to be ~200 µm.
Jmmp 06 00139 g010
Figure 11. Microstructure of repaired sample. The microstructure of the additive cube is finer than the conventional preform.
Jmmp 06 00139 g011
Figure 12. Hardness map of repaired sample. The hardness of additive cube is higher than conventional. The interface hardness lies between additive and conventional.
Jmmp 06 00139 g012
Figure 13. (a) Repaired 1.2343/H11 Tool. (b) 3D GOM Scan of the interface. The scale is shown in mm.
Jmmp 06 00139 g013
Table 1. Composition of 1.2343/H11 tool steel powder.
CFeSiVCrMnMo
wt.%0.37Rest1.60.77.390.051.4
Table 2. Channel roughness of samples with low, medium, and high energy density.
Energy Density34.19 J/mm358.28 J/mm394.7 J/mm3
Ra Channel Ceiling48 ± 6 µm70 ± 1 µm96 ± 10 µm
Ra Channel Floors 54 ± 6 µm4 ± 1 µm106 ± 10 µm
Table 3. Effects and interactions of surface roughness.
Factor(s)Value Effect/Interaction
ScanSpeed × Hatch Distance2.71
Laser Power × Scan Speed × Hatch Distance1.25
Laser Power × Hatch Distance0.33
Laser Power0.10
Hatch Distance−0.08
Scan Speed−0.07
Laser Power × Scan Speed0.04
Table 4. Effects and interaction effects of the minimum channel diameter.
Factor(s)Value Effect/Interaction
Hatch Distance527.12
Scan Speed403.90
Laser Power−370.08
Laser Power × Scan Speed × Hatch Distance−312.93
Scan speed × Hatch Distance−196.39
Laser Power × Hatch Distance86.33
Laser Power × Scan Speed56.78
Publisher’s Note: MDPI stays neutral with regard to jurisdictional claims in published maps and institutional affiliations.

