Article

Thermal Contact Resistance between Mold Steel and Additively Manufactured Insert for Designing Conformal Channels: An Experimental Study

1
CMEMS-UMinho—Center for Microelectromechanical Systems, University of Minho, 4800-058 Guimarães, Portugal
2
LABBELS—Associate Laboratory, 4800-058 Guimarães, Portugal
3
Prifer—Fundição, S.A., 3750-043 Águeda, Portugal
4
MEtRICs—Mechanical Engineering and Resource Sustainability Center, 4800-058 Guimarães, Portugal
*
Author to whom correspondence should be addressed.
These authors contributed equally to this work.
J. Manuf. Mater. Process. 2022, 6(5), 99; https://doi.org/10.3390/jmmp6050099
Submission received: 28 July 2022 / Revised: 8 September 2022 / Accepted: 9 September 2022 / Published: 13 September 2022
(This article belongs to the Special Issue Advances in Injection Molding: Process, Materials and Applications)

Abstract

:
The focus of this research is on thermal contact resistance between a mold and its insert, specifically inserts made by additive manufacturing (AM). Using a thermal steady-state system and varying contact pressures (0, 50, 75, and 100 bars), we present experimental results of the thermal contact resistance at the contact interface between steel A (1.2344), obtained from an extruded rod, and steel B (1.2709), produced by laser powder bed fusion. Thermal tests were performed for unbonded and bonded configurations. Results showed that increasing the contact pressure allows the system equilibrium to be reached at lower temperatures. Furthermore, thermal tests showed that in the transition zone of the bonded configuration, a well-defined resistance is not formed between the two steel samples as it occurs in the unbonded configuration. For the unbonded configuration, the thermal contact resistance values decrease with increasing applied contact pressure, improving the system’s heat transfer.

1. Introduction

In the foundry industry, mold thermal management is a crucial phase of the molding cycle, affecting the parts’ final quality and production time [1]. To optimize this process, it is necessary to develop a cooling channel system that is tailored to the part be cast. In this way, the cooling time can be reduced, resulting in increased production and improved surface and microstructural quality of the casting [2]. Due to the limits of standard drilling processes, the most common mold cooling systems use straight channels. However, this configuration does not provide optimal performance in cooling castings with organic and complex shapes [2,3]. The use of mold inserts is a method to solve issues related to inhomogeneous cooling in complex sections [4,5,6,7].
The significant growth and evolution of the metal additive manufacturing (AM) technique have enabled the manufacture of parts with complex geometries directly from a 3D CAD model [8,9]. Thus, this approach has made it feasible to manufacture cooling systems with channels of geometric complexity (conformal cooling), enabling the design of an insert according to the requirements of the geometry of mold cavity [10,11]. The insert is a die part that can reproduce the mold cavity’s intrinsic geometry and enhance cooling in specific and critical sections. Each insert has one or more cooling channels to cool each hot region effectively [12]. However, using two distinct materials (base mold and insert) results in a new interface. The contact between these two materials occurs microscopically at various points, which, depending on the corresponding surface roughness values, minimizes the actual contact area. This reduction in the contact area impacts the heat flow across the interface and introduces a thermal resistance known as thermal contact resistance (TCR) at the junction of the two surfaces [13]. TCR is one of the most critical parameters for the thermal analysis of materials. It affects applications with engineering devices that require a high heat flux [14,15], making it difficult to accurately manage the heat and cooling performance of many applications, such as those observed in the aeronautical industry, cryogenics, the nuclear industry, microelectronics, and space vehicles, among others [16,17,18].
Generally, three methods are used in research on TCR: analytical models [19,20,21], numerical simulations [22,23,24], and experimental studies [25,26,27], which are often the preferred option. It is challenging to create a model or computer method capable of exhaustively computing every solid interface [14]. TCR may be measured experimentally using either a steady-state or transient system, although the one-dimensional steady-state method is the most common.
Numerous investigations of TCR determination for different pairs of materials have been published in the scientific literature. Madhusudana et al. [26] studied the accuracy of contact heat transfer tests and demonstrated that heat loss from samples to the surrounding material occurs when contact pressures are low and samples are weak conductors. Dounghuan Liu et al. [25] studied the TCR between a high-thermal-conductivity C/C material and superalloy Inconel 600, which are widely used in thermal protection structures to increase heat transmission. The authors found that the TCR value is pressure- and temperature-sensitive. Cousineau et al. [28] described the thermal properties of electrical machine lamination stacks, measuring thermal conductivity and identifying variables that influence TCR between laminations in a stack, including surface quality and contact pressure. Le et al. [29] built equipment to measure the TCR of a low-thermal-conductivity fiber insulator under high temperatures and atmospheric pressure conditions and determined that the TCR decreases with increasing pressure. Choi et al. [30] designed an experimental apparatus for accurate testing, using a steady-state method to evaluate thermal contact conductance between metals at temperatures below 100 K. Recent research conducted by Ren et al. [11] on the TCR at three contact interfaces of carbon-fiber-reinforced silicon carbide composite revealed that the TCR decreases with increasing pressure and temperature.
The aim of this study is to fill the dearth in the literature with respect to experimental studies on TCR in mold/insert contact interfaces, particularly for AM-machined inserts. Here, we describe the experimental determination of TCR at the interface contact between a casting mold steel (Orvar 2M) and steel for inserts produced via AM (M300). The TCR values for this contact pair were obtained through steady-state laboratory testing using different contact pressures. In addition, the AM steel was deposited directly onto the Orvar 2M steel to link the identical pair of steels. We also investigated the heat behavior of this steel combination.

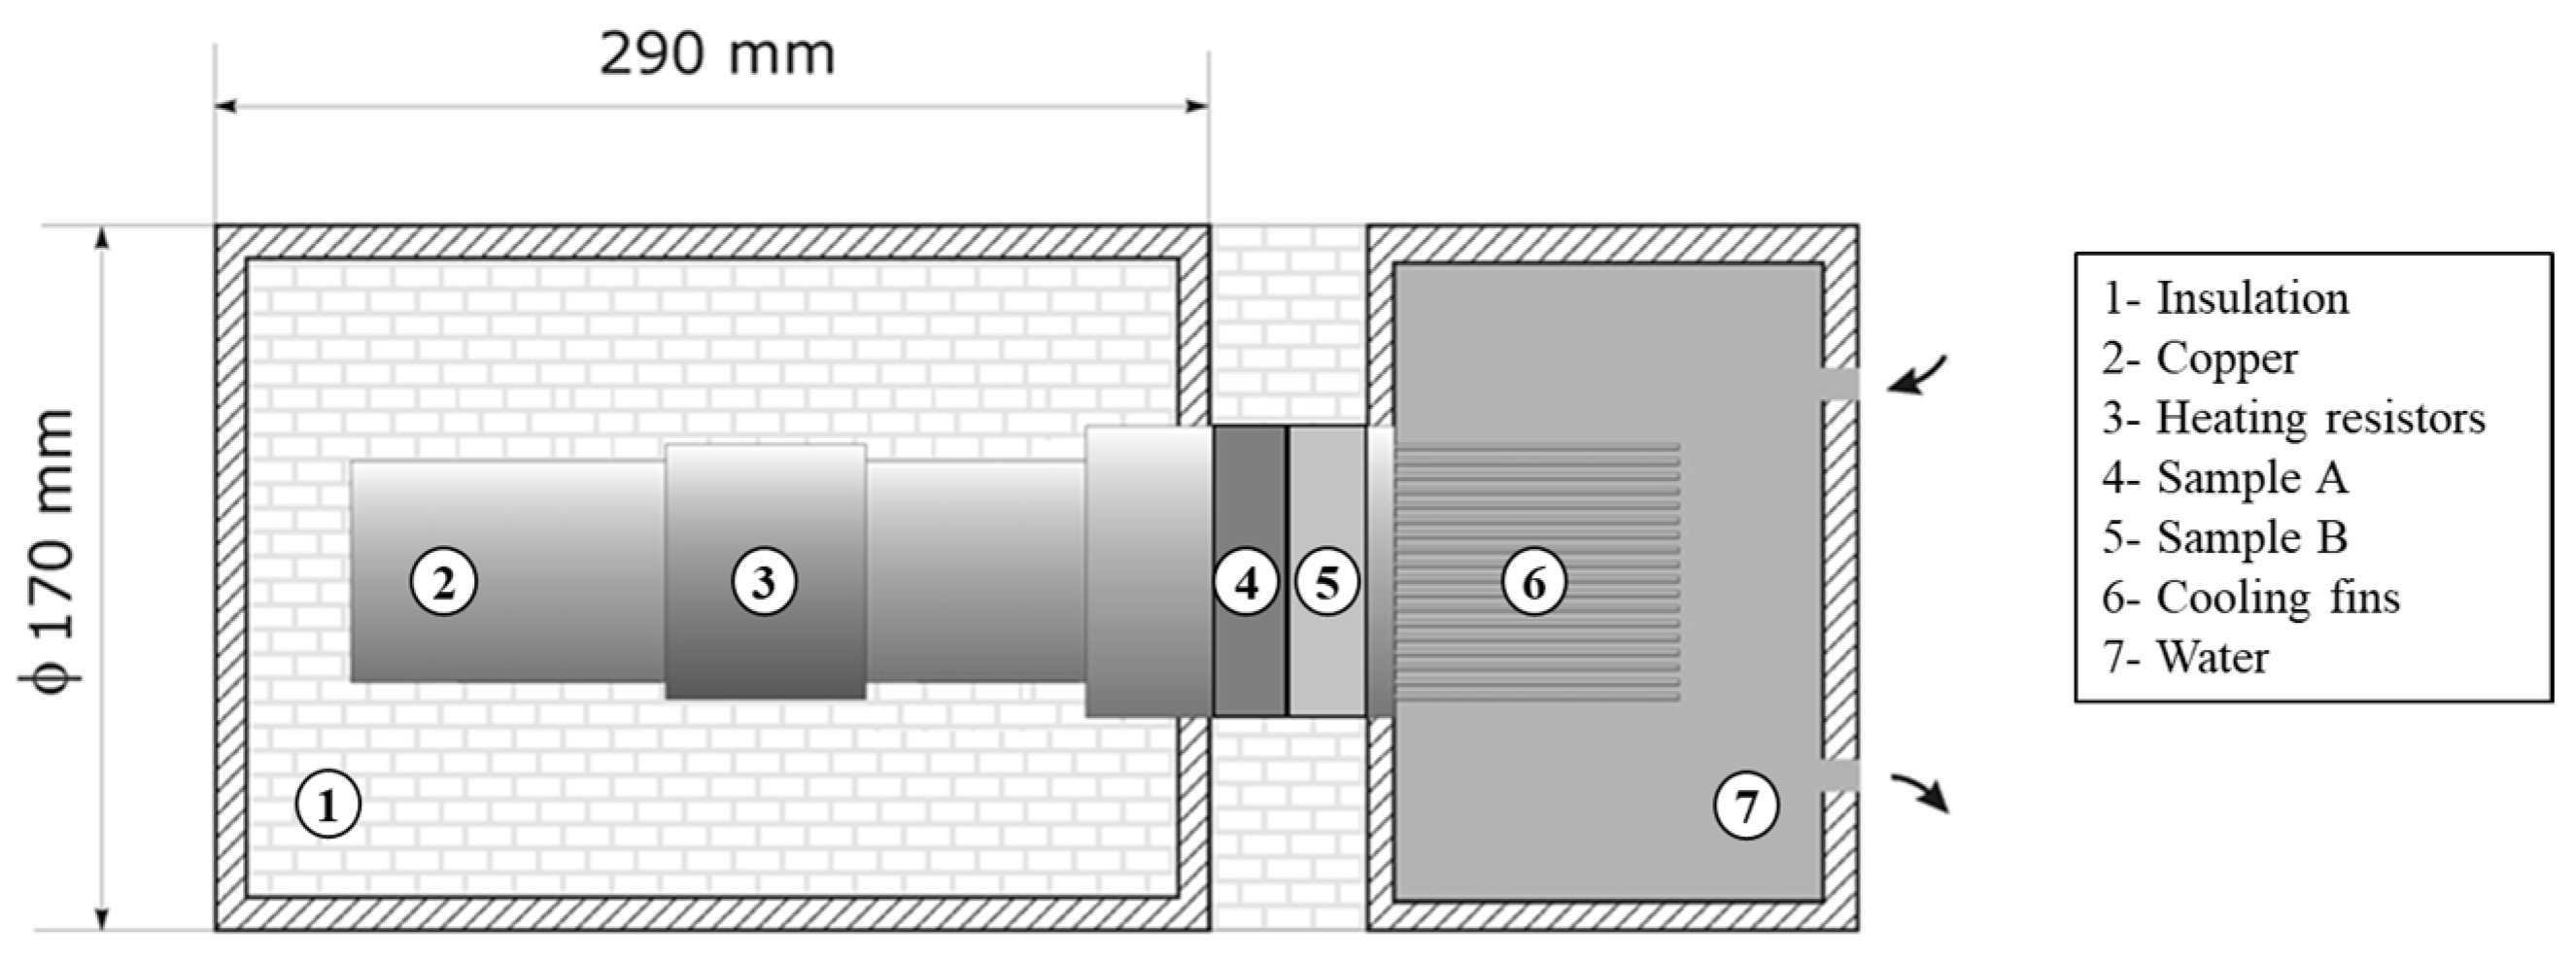
2. Materials and Methods

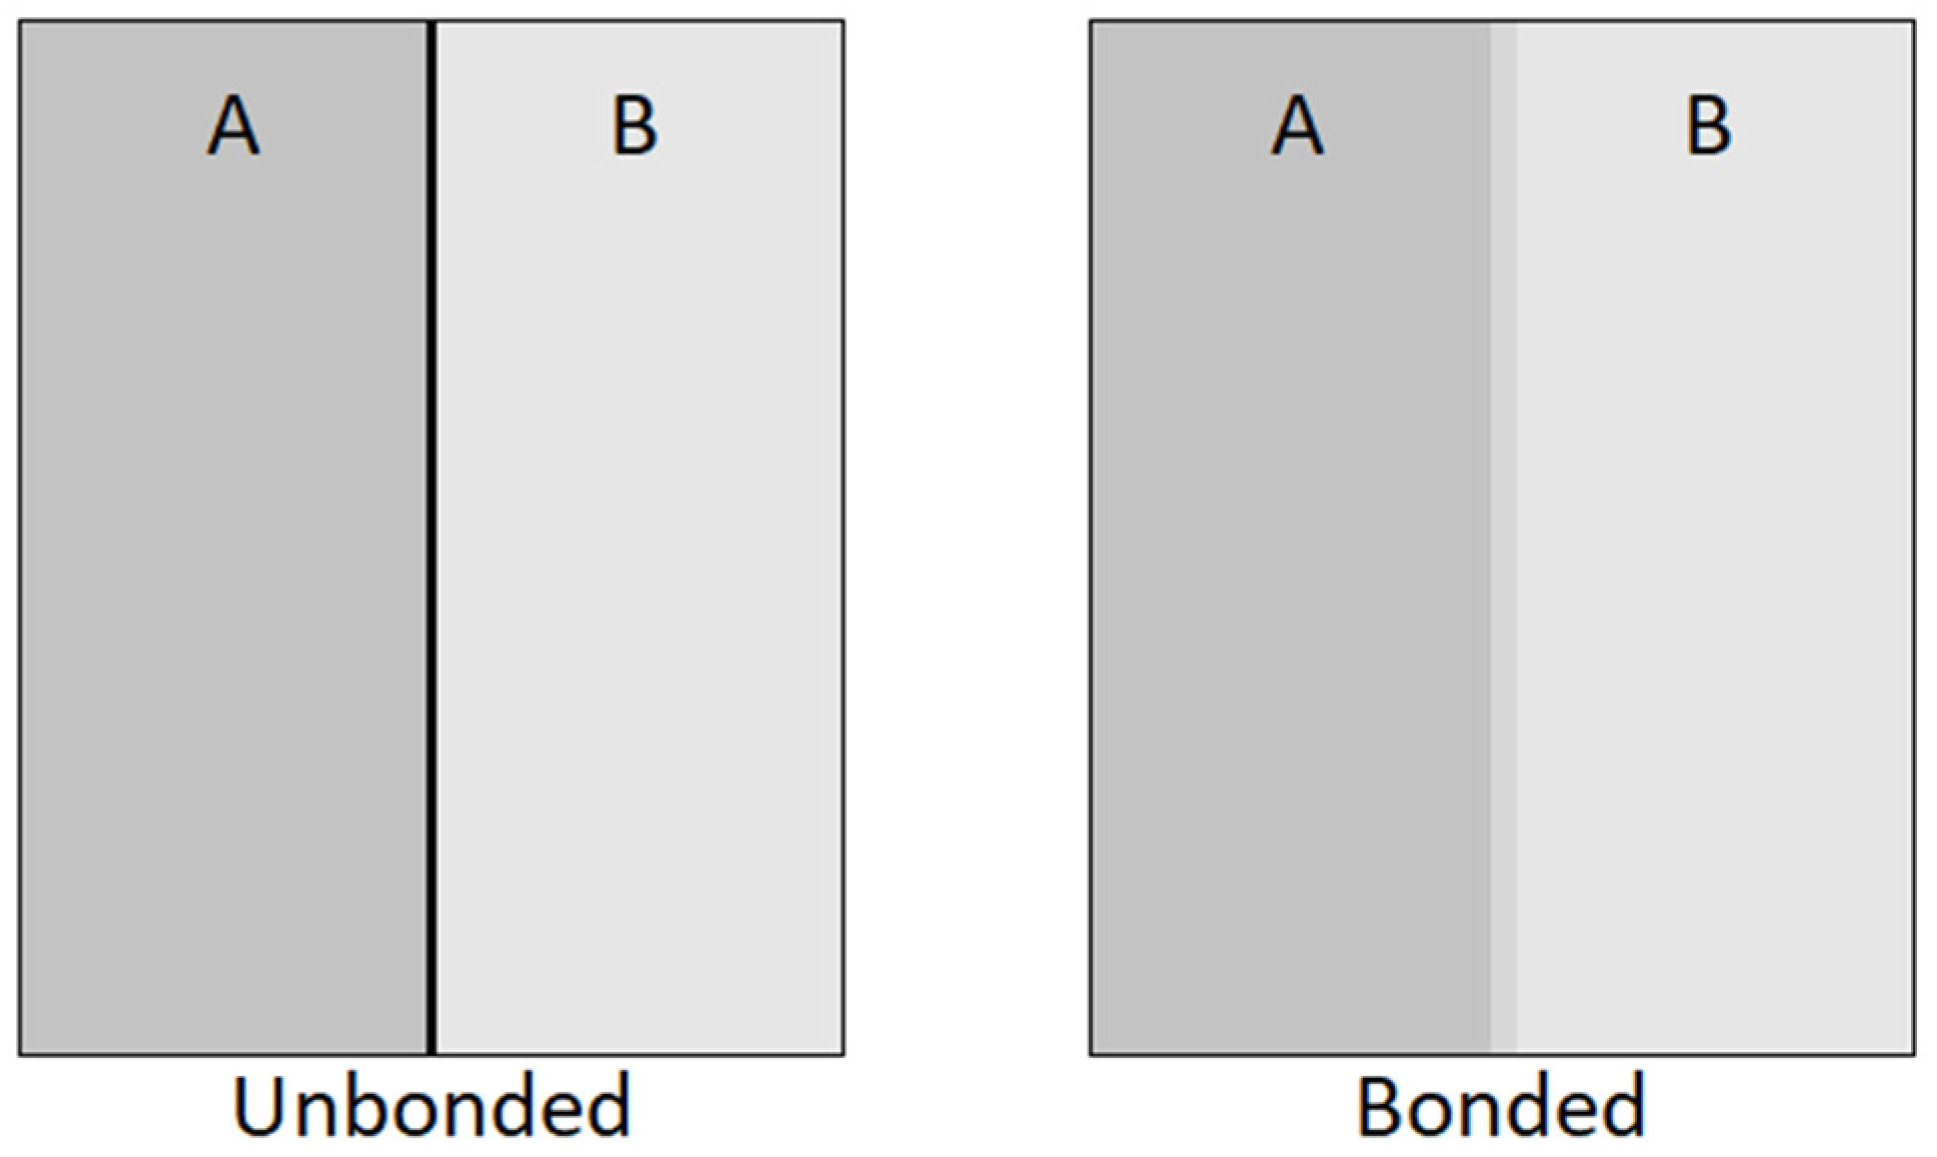
2.1. Sample Preparations

The two studied steels were designated A and B in the interest of simplicity. Steel A is a 1.2344 steel (Orvar 2M steel) used to manufacture casting molds. It has a density of 7.8 g/cm3 and a thermal conductivity ranging from 25 to 30 W/m·K between room temperature and 700 °C, respectively. Steel B is a 1.2709 steel obtained by AM (M300 steel) that may be utilized for inserts. The bulk steel resulting from steel B obtained by AM (by laser powder bed fusion process) processing has a density of 8.1 g/cm3 and a thermal conductivity ranging from 14.2 to 28.6 W/m K between room temperature and 1300 °C, respectively. Two contact configurations were investigated between the two steels. Configuration A/B considers the contact interface between steels A and B as unbonded. Arrangement A.B. considers the same steels, with steel B directly bonded to steel A using an AM process (by laser powder bed fusion process).
For the thermal behavior experiments and TCR determination, disc-shaped samples were required. In order to prepare samples for the two assembly configurations, samples of steel A were cut from a rod and machined with dimensions of Ø 72 × 21 mm. Steel B discs were produced with the same dimensions as steel A discs by laser powder bed fusion (1.2709 steel) using Renishaw M300 maraging steel powder. A 400 W laser was used to obtain a 40 µm layer of steel per pass until a length of 21 mm was achieved. Samples A and B for the unbonded assembly (configuration A/B) were polished with P600 sandpaper to achieve an appropriate surface finish in the contact areas.
In the bonded assembly (configuration A.B.), unlike the unbonded assembly, in which the two discs are in contact, the steel B disc was directly deposited on the steel A disc by AM processing. For this latter configuration, sample A was finished using sandpaper with successive grits of P600, P1200, and P2000 prior to the deposition of steel B. On steel A disc, a surface roughness (Ra) of 0.015 µm was measured prior to steel deposition of disc B. Figure 1 is a schematic representation of the two assemblies under study, with the unbonded (A/B) and bonded (A.B.) configurations.
In both assembly configurations, three holes were drilled to position the thermocouples to measure the samples’ temperature during the experiment. The thermocouple holes were separated by 120° around the circumference of the discs. The diameter and depth of the holes were 2 mm and 25 mm, respectively.

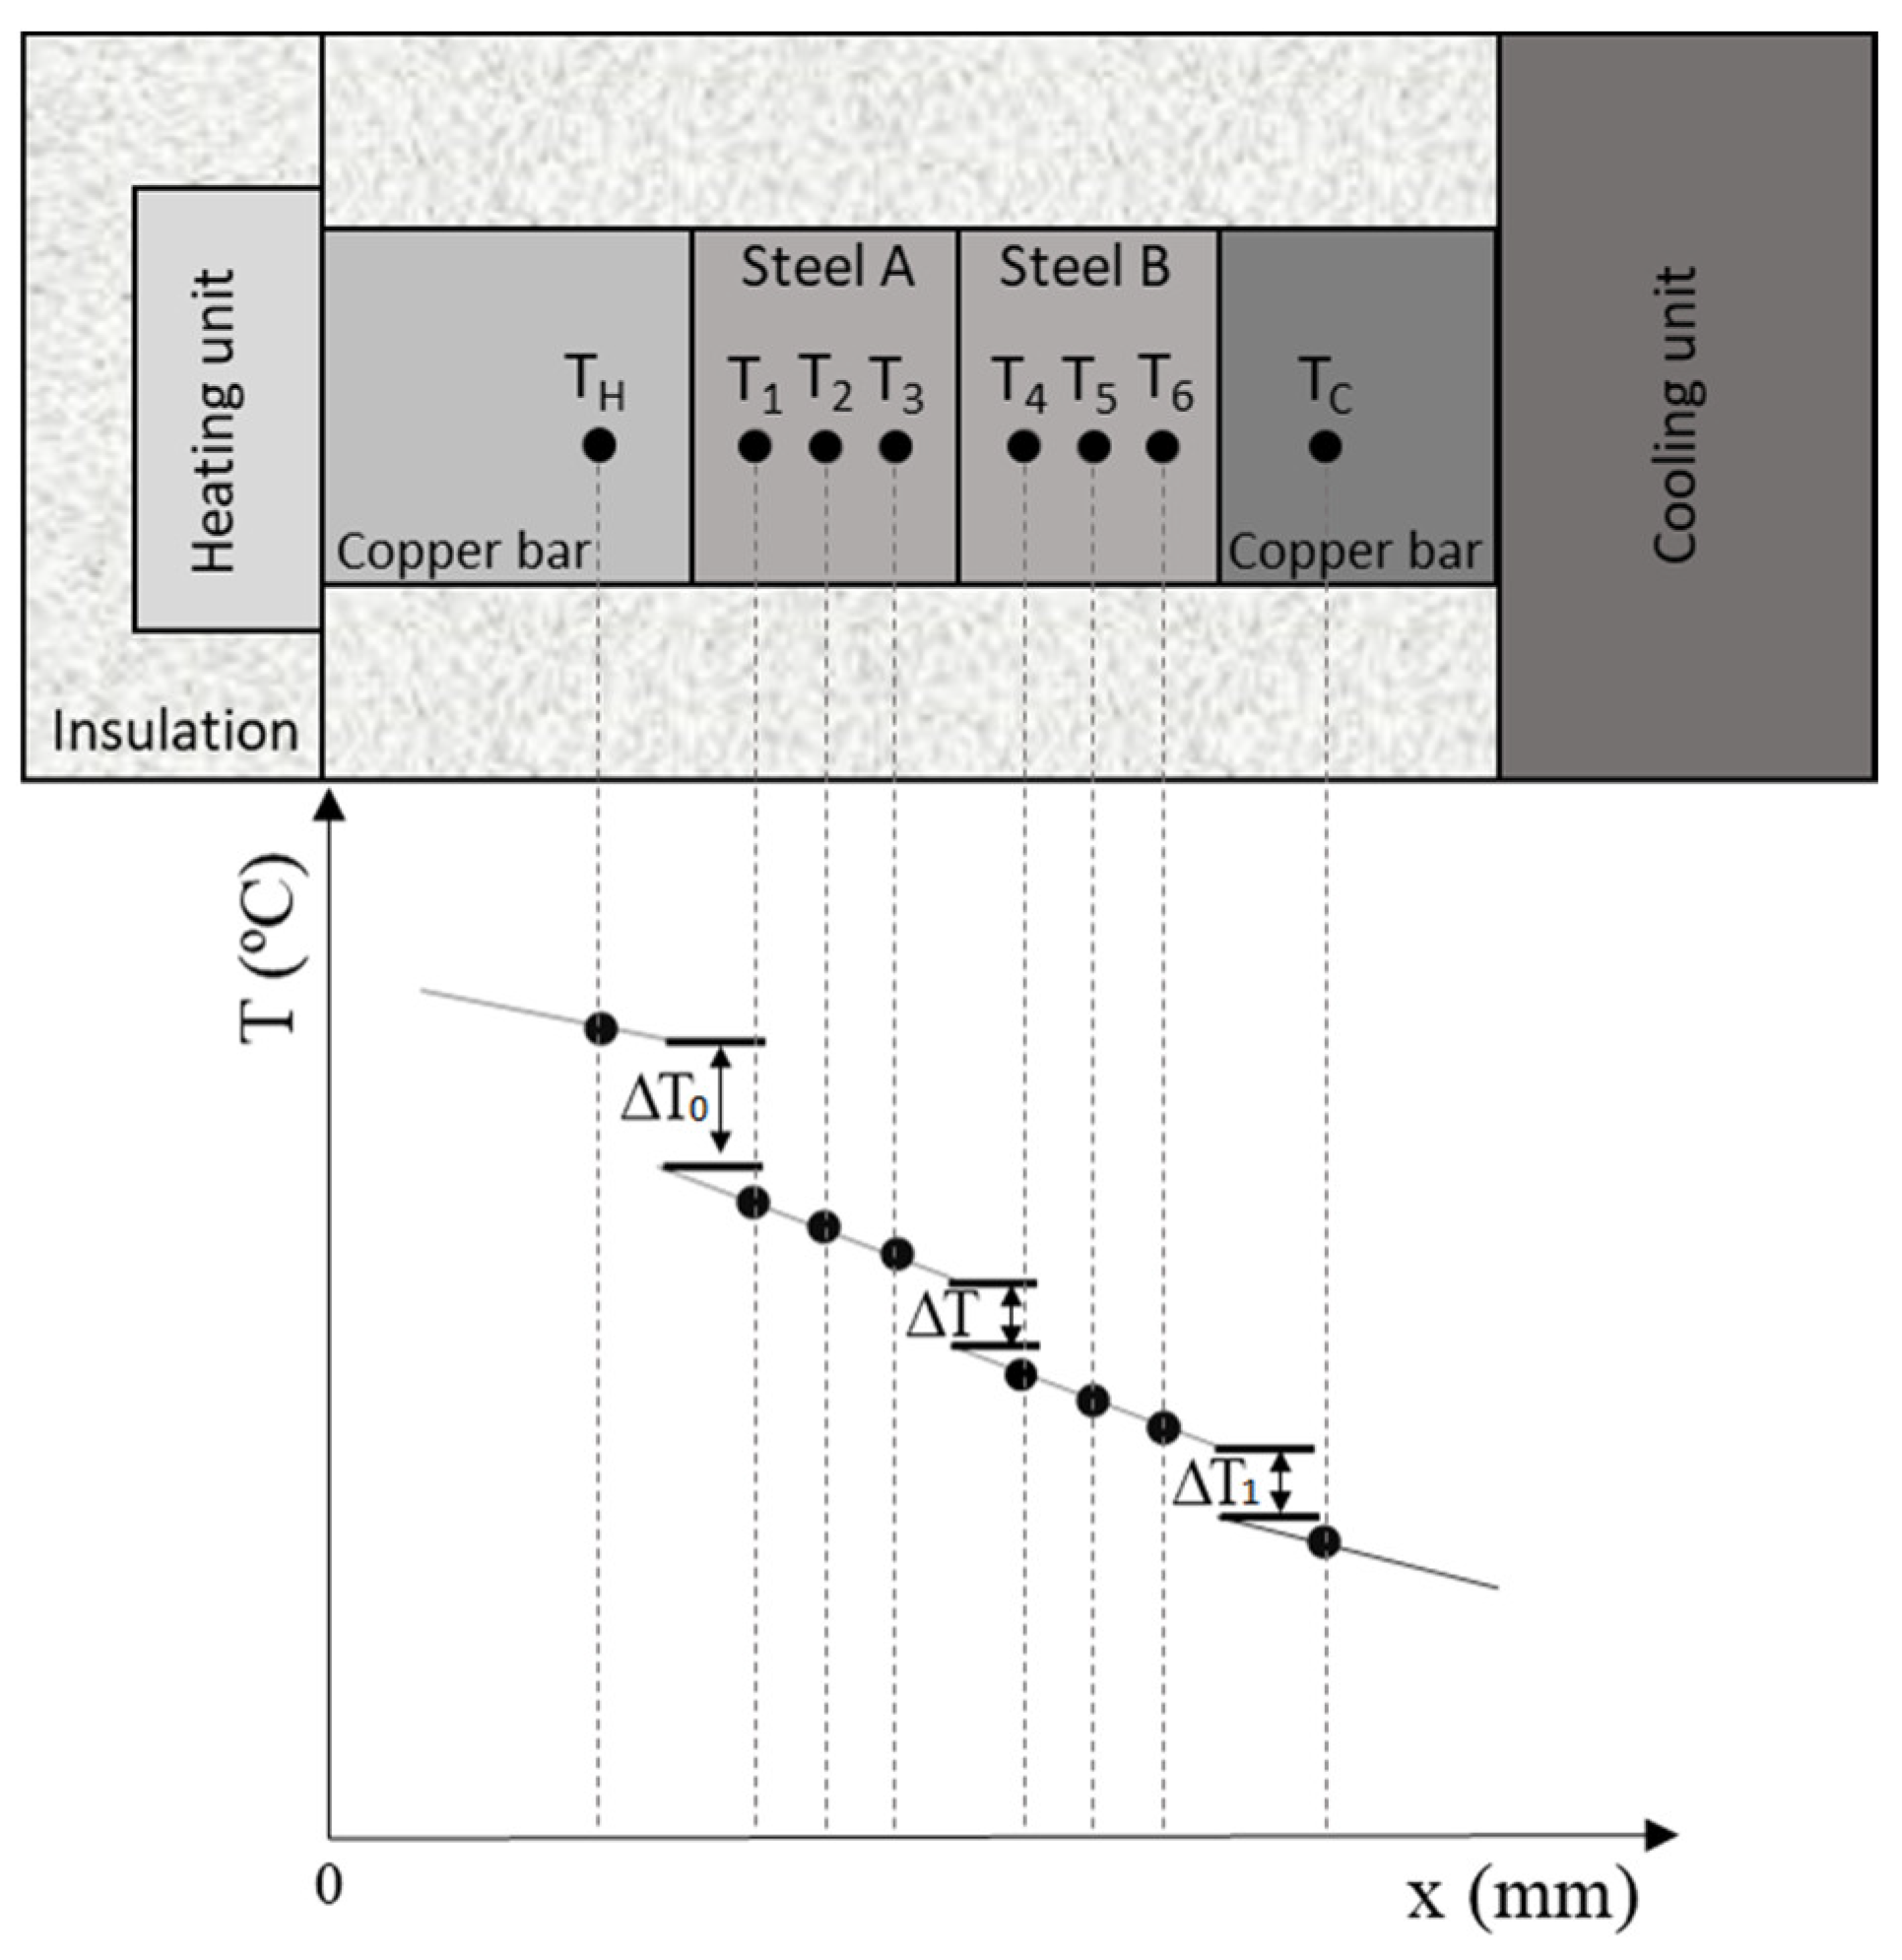
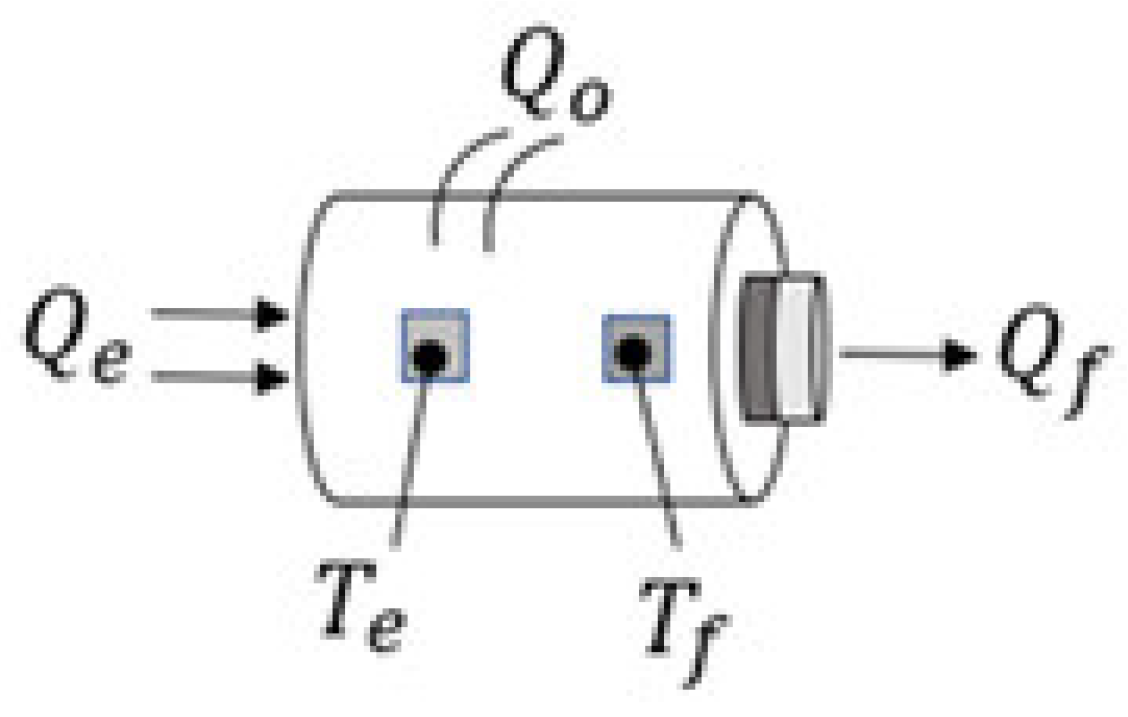
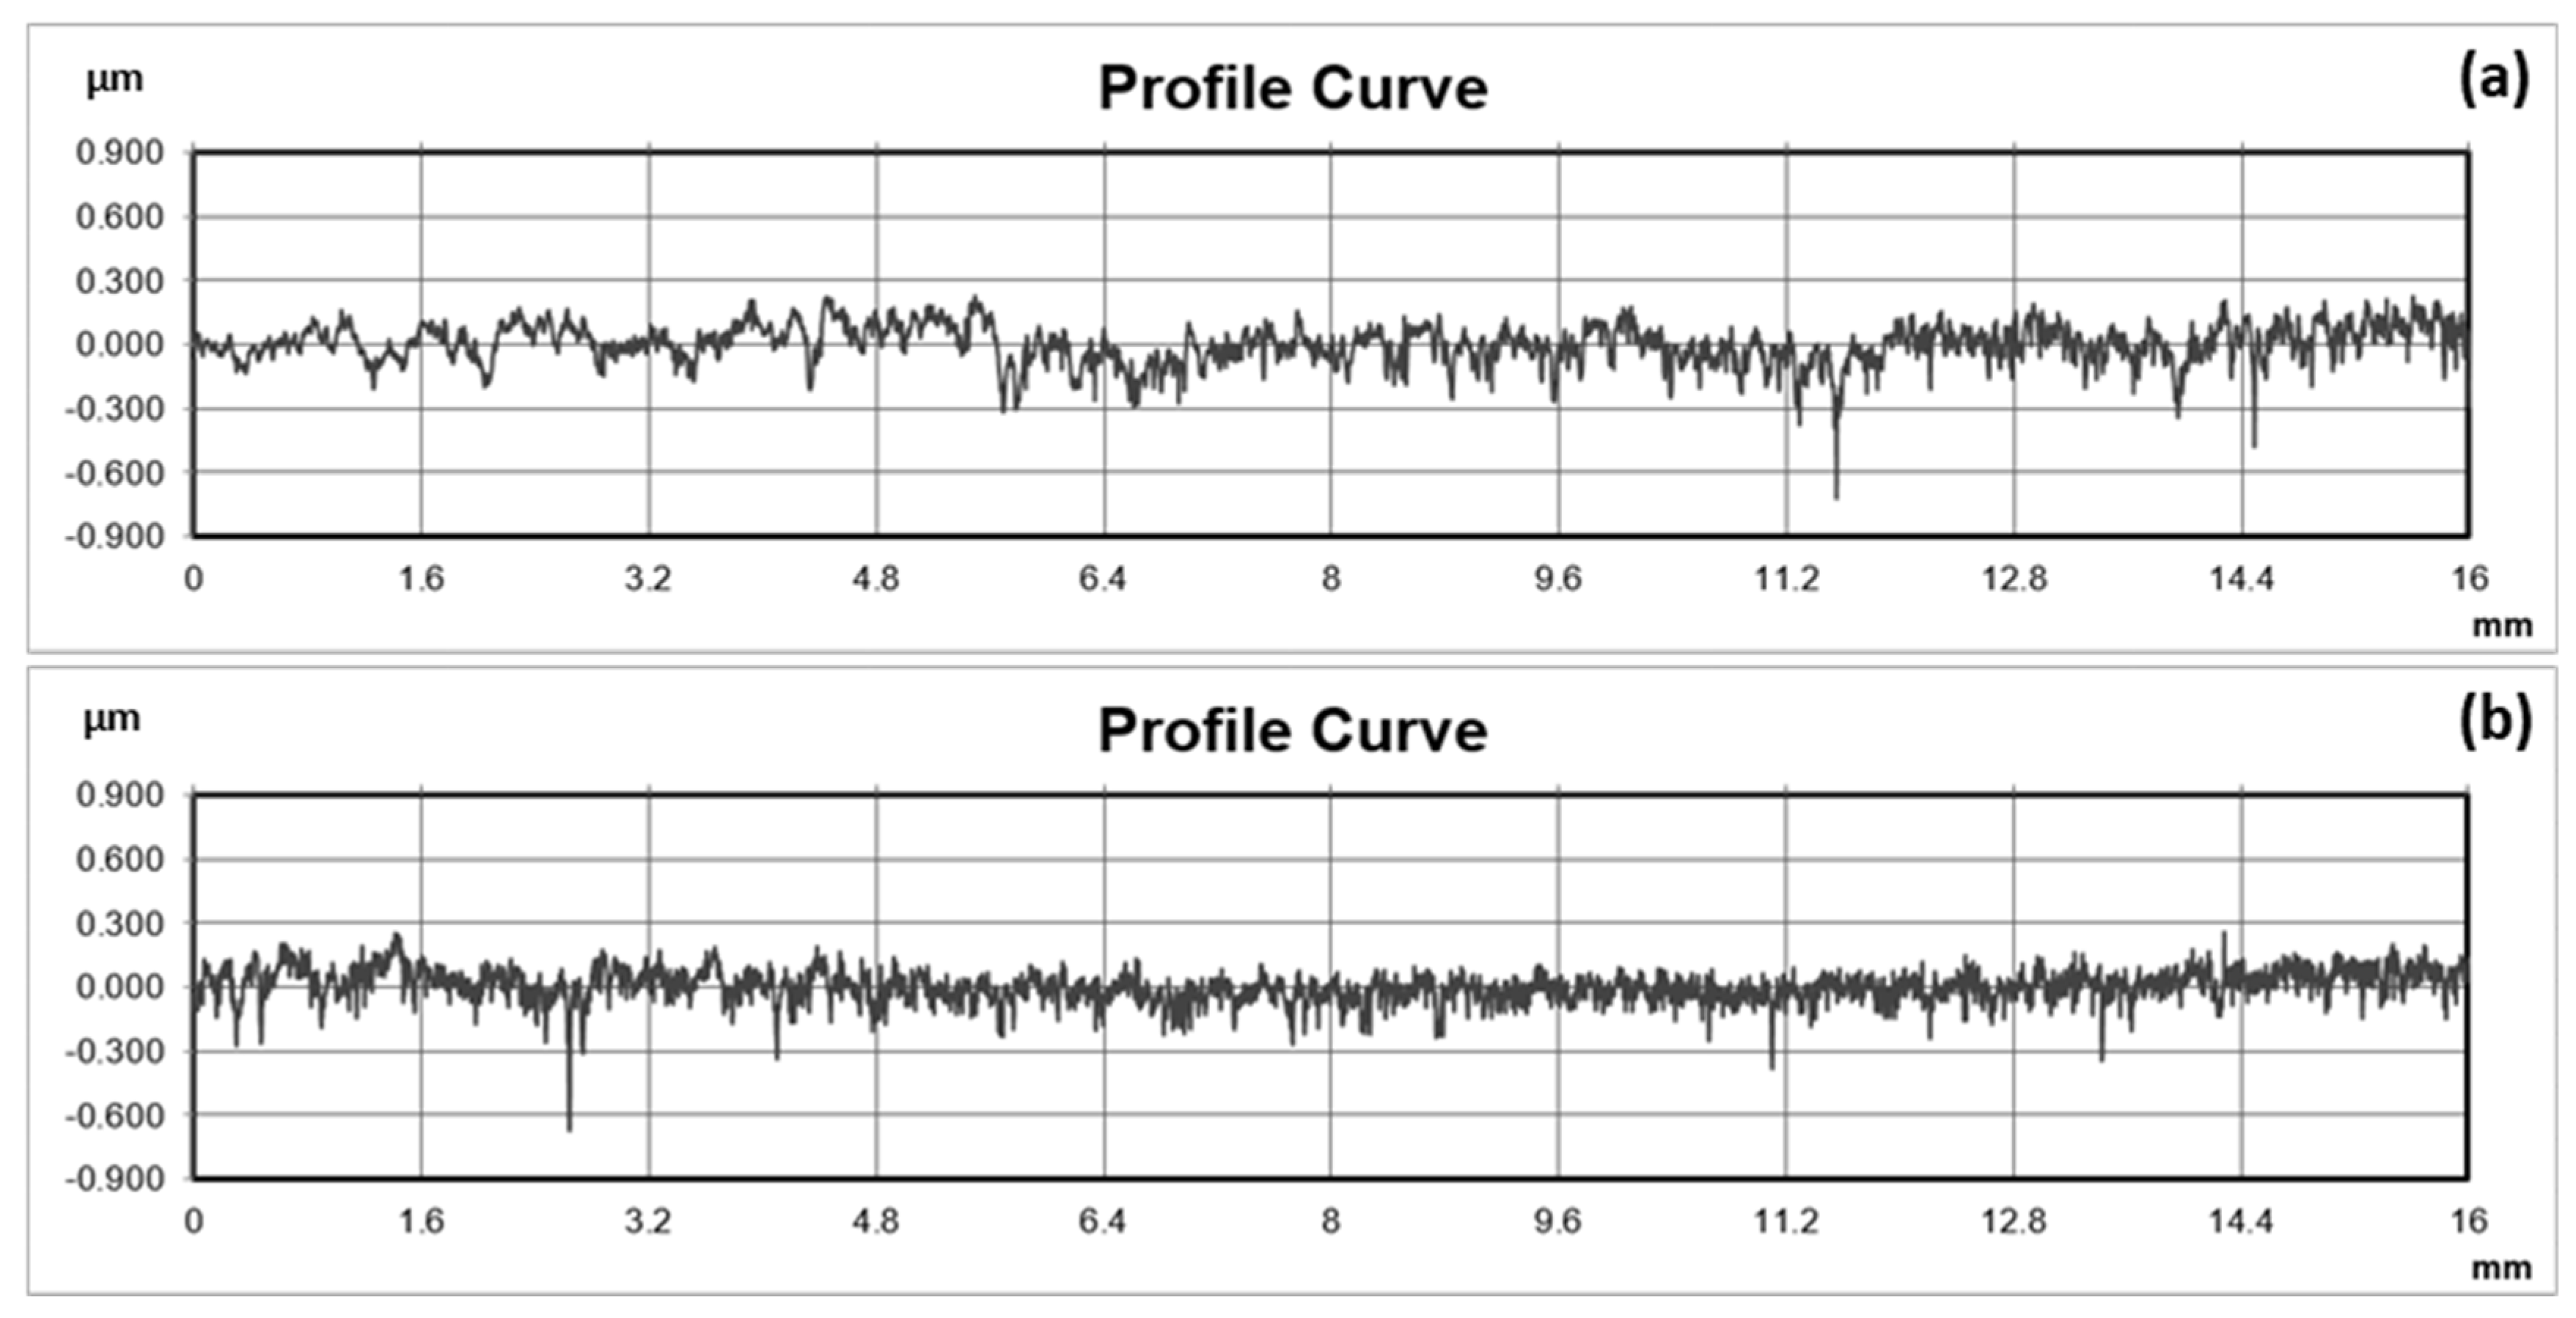
2.2. Sample Characterization

In the two studied configurations (A/B and A.B.), the two steels mimic the interface between the casting mold (sample A) and the cooling insert (sample B). Regarding the unbonded assembly, in which there is only a single contact between the insert and the mold, a proper fit must be established between the two samples (A and B). Roughness tests are crucial in the industrial setting, as they allow for the verification of the surface finish of the samples according to application requirements, including component adjustment, adhesion, and sealing, among others. The literature indicates that a good surface finish in the contact region between two materials, when subjected to heat flux, decreases the thermal conductivity ratio (TCR), boosting the heat transfer rate. The surface of the steel discs was evaluated for roughness using an SJ-210 portable roughness meter (Mitutoyo Corporation, Kawasaki, Japan, with Handysurf+ software, ver.1.05, Tokyo Seimitsu). The samples were measured along a linear measuring length of 16 mm at a constant speed of 0.25 mm/s in accordance with the ISO 1997 standard. In order to create a surface profile and to estimate the arithmetic mean roughness (Ra, µm), surface roughness was measured at several locations on each sample. The roughness of samples was measured in two orientations: (i) perpendicular to the polishing grooves and (ii) parallel to the polishing grooves. Six measurements were taken for each direction.
In the bonded assembly (configuration A.B.), the deposition of one steel part on another creates a link due to the laser’s effect on the steel powder used in the AM process and the base steel. In practice, the two steels exhibit a welding effect. SEM analysis of the bonded pair of steels was performed using an FEI Nova 200 (FEG/SEM) NanoSEM scanning electron microscope system. A smaller specimen was cut from the interface of the A.B. bonded configuration and prepared for SEM analysis (3 µm polishing). The analysis focused mainly on the interface between the steel (Orvar 2M, sample A) and steel (M300, sample B).
The thermal properties of the two assembly configurations under investigation were determined. Four contact pressures were tested between the steel discs. Thus, it was possible to monitor how the heat transfer efficiency, and we found that the TCR values were affected. The tests were conducted with an input power at 475 W when the system attained thermal equilibrium (temperature changes of less than 0.5 °C). Figure 2 depicts the experimental setup utilized for these studies.
The experimental apparatus consists of a heat source and a heating resistor. The heating resistor, with a sleeve-style component wrapped around a copper cylinder, provides around 400 W of power. This whole ensemble is thermally insulated with rock wool to minimize heat losses. The copper cylinder is operated by a hydraulically driven cylinder, which maintains constant contact pressure between the copper cylinder and the metals throughout the test, and a manometer monitors the clamping pressure. The opposing end, which is cooled by a water stream, functions as a cold source. A steel structure protects the entire set. The samples were placed between the hot source (sample A) and the cold source (sample B). To ensure steady-state heat conduction, samples were wrapped in an insulating material (rock wool) to minimize heat loss.
The apparatus comprises eight K-type thermocouples to record temperatures: one in the hot source, three in each sample (spaced 6.5 mm apart), and one in the cold source. Two additional K-type thermocouples were installed on the outside structure to measure the surface temperature of the equipment, and one thermocouple was utilized to record the room temperature. These measurements were used to assess heat losses from the equipment surface. Figure 3 shows the arrangement of thermocouples inside the experimental apparatus.
The heating resistor imposes an input heat flux ( Q e ) , but a portion of this heat flux is lost ( Q o ) , leaving the effective heat flux ( Q f ) , which is conveyed to the sample material, as shown in Figure 4 and Equation (1).
Q f = Q e Q o ,
The thermal contact conductance ( h c ) can be calculated based on the values of the effective heat flux and the temperature change acquired by the thermocouples in the samples. This value is calculated by dividing the heat flow by the temperature gradient at the contact interface (Equation (2)):
h c = Q f A   Δ T ,
where Q f is the effective heat transfer rate, A is the apparent contact area, and Δ T is the temperature difference at the interface, which is obtained by extrapolating the temperature profiles recorded in each material. These parameters are associated with TCR through Equation (3):
T C R = 1 h c = Δ Τ Q f / A ,
The TCR is the inverse of thermal contact conductance. The TRC concept is used to describe the influence of contact on heat transmission. With these tests, the TCR value can be determined as a function of surface roughness and contact pressure. These data may then be used in numerical simulation to determine the required degree of surface polish in the mold/insert contact areas. Therefore, it is feasible to provide additional assembly arrangements without wasting time or money.
To test the bonded (A.B.) and unbonded (A/B) configurations, the samples were positioned in the equipment such that sample A was always in contact with the hot source and sample B was always in contact with the cold source. In the unbonded configuration (A/B), both samples were adjusted such that the entire surfaces of both materials were in contact. The resistors and water to cool the cold zone were connected after assembly, and then contact pressure was applied. Four distinct contact pressures were used throughout the tests: 0 bar, 50 bar, 75 bar, and 100 bar. The temperatures measured by each thermocouple were recorded as soon as the system attained a steady-state temperature.

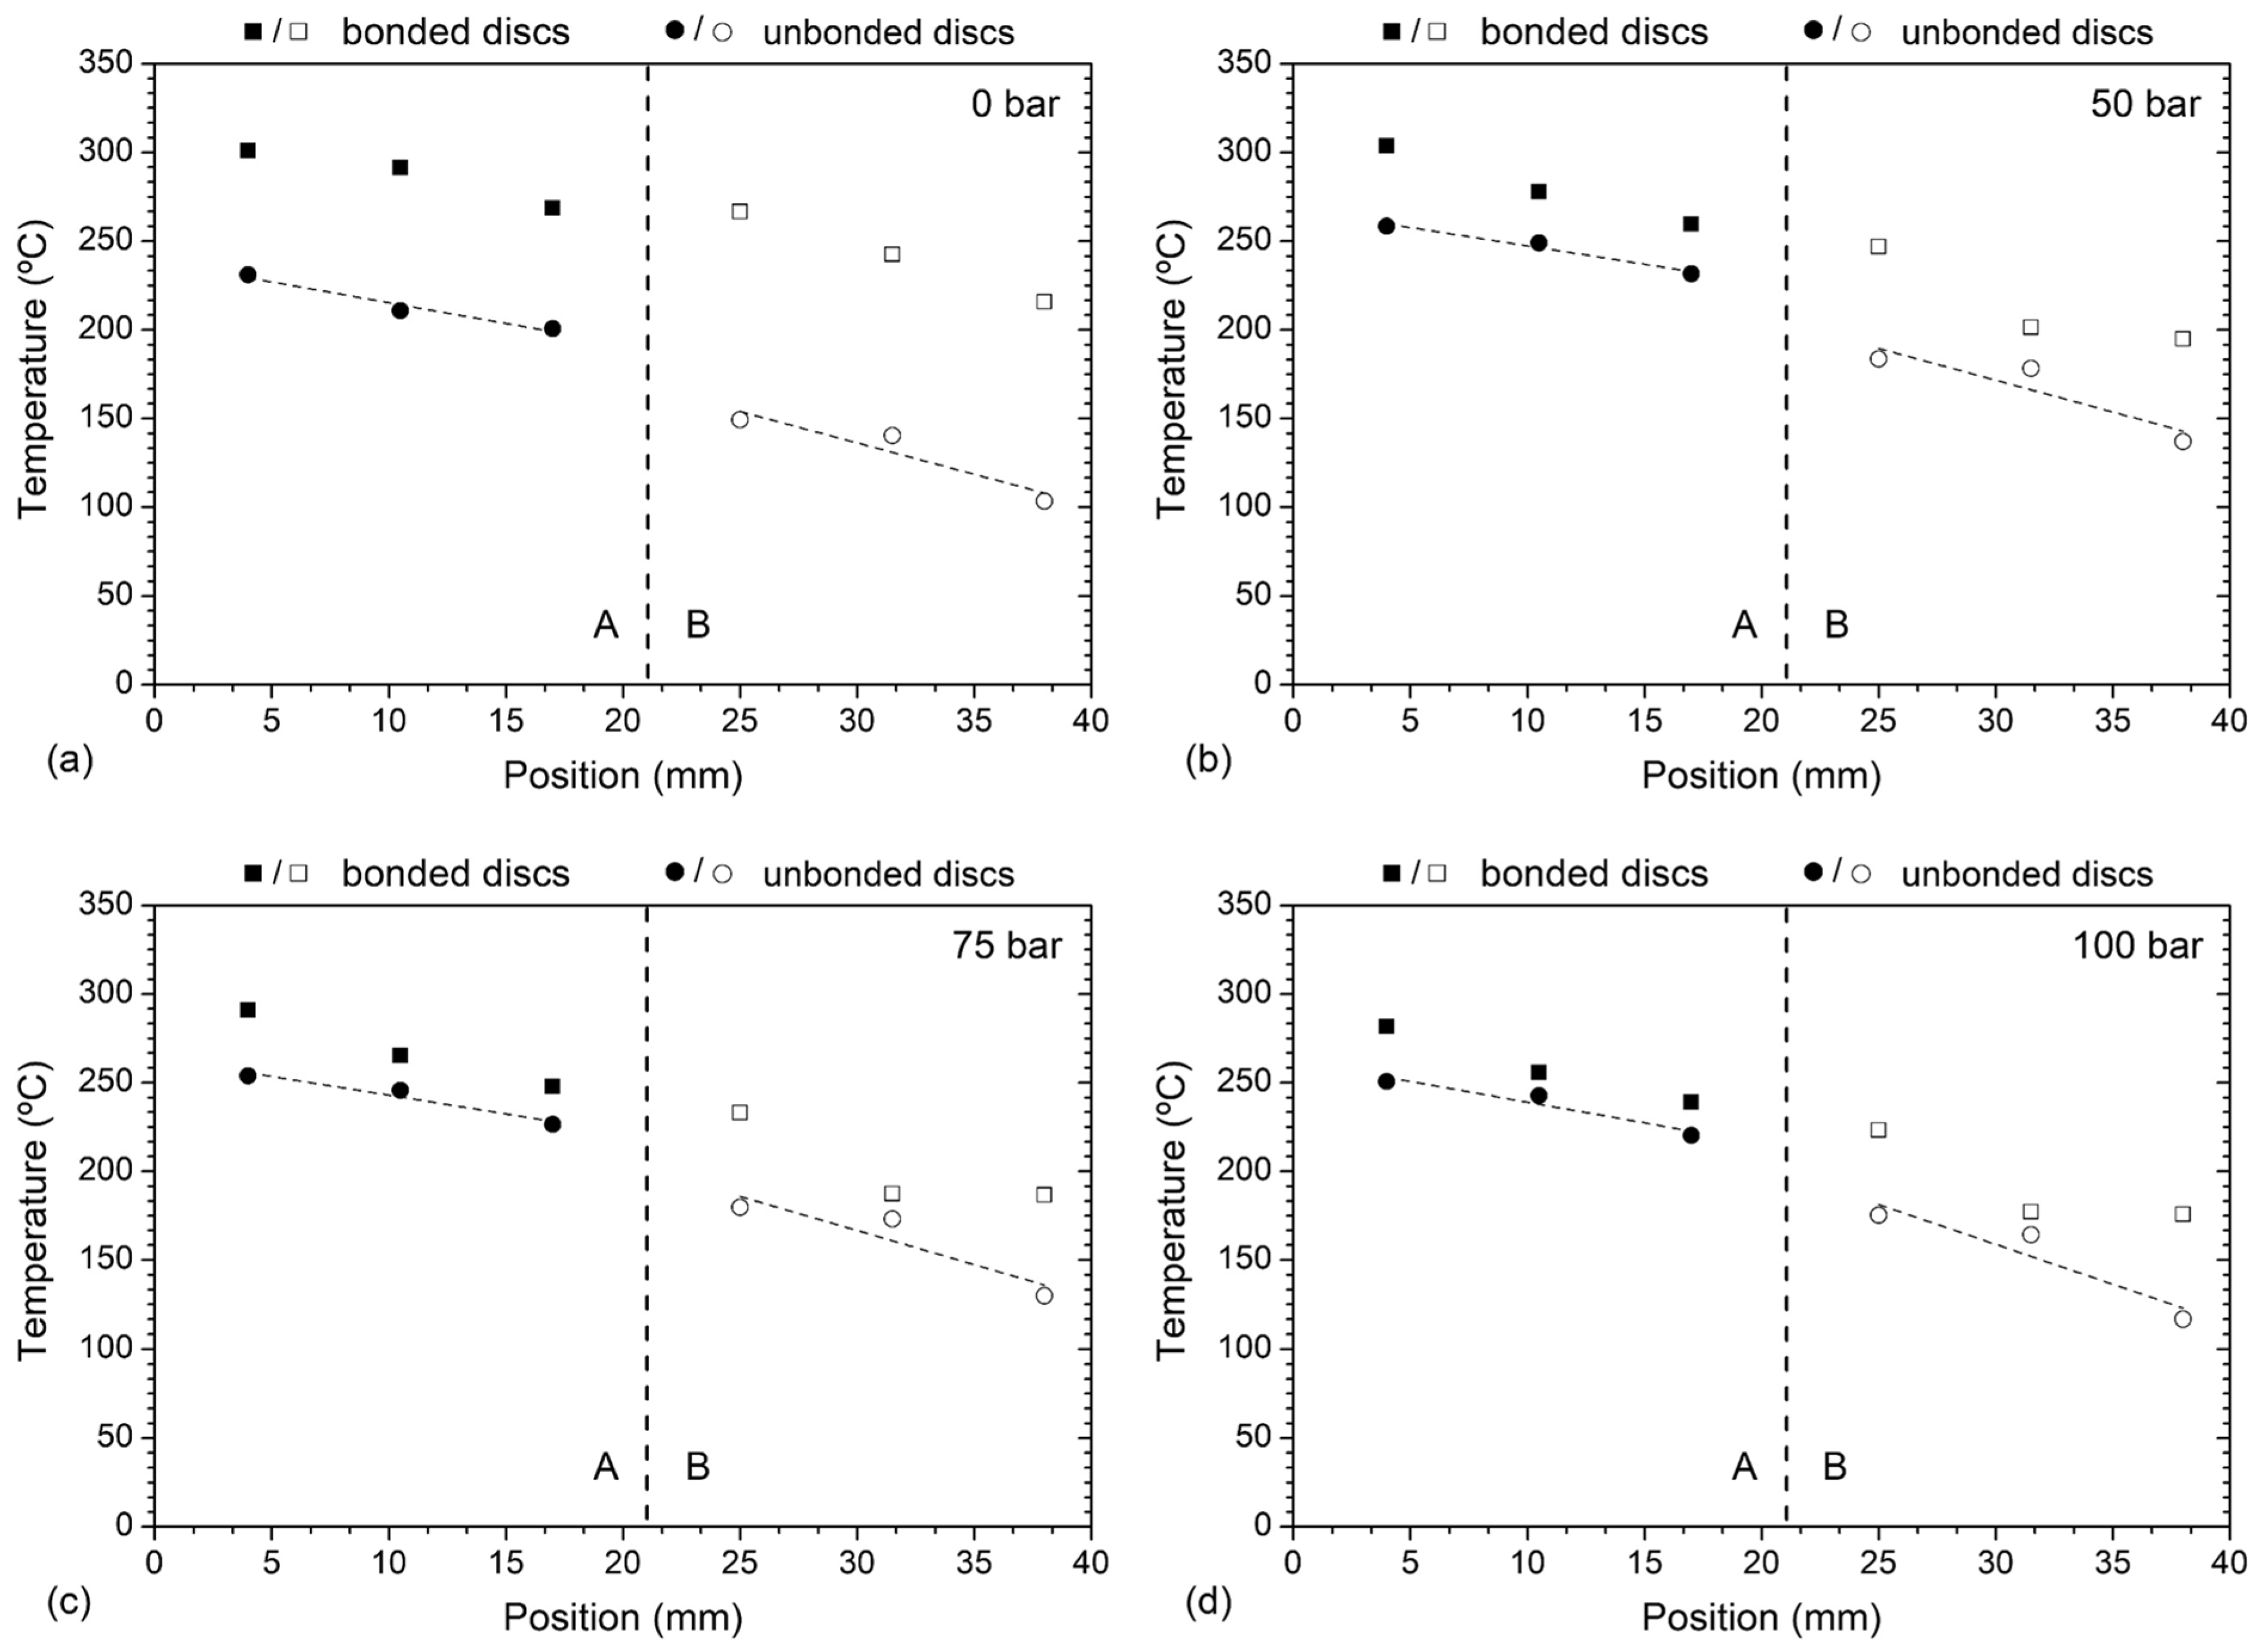
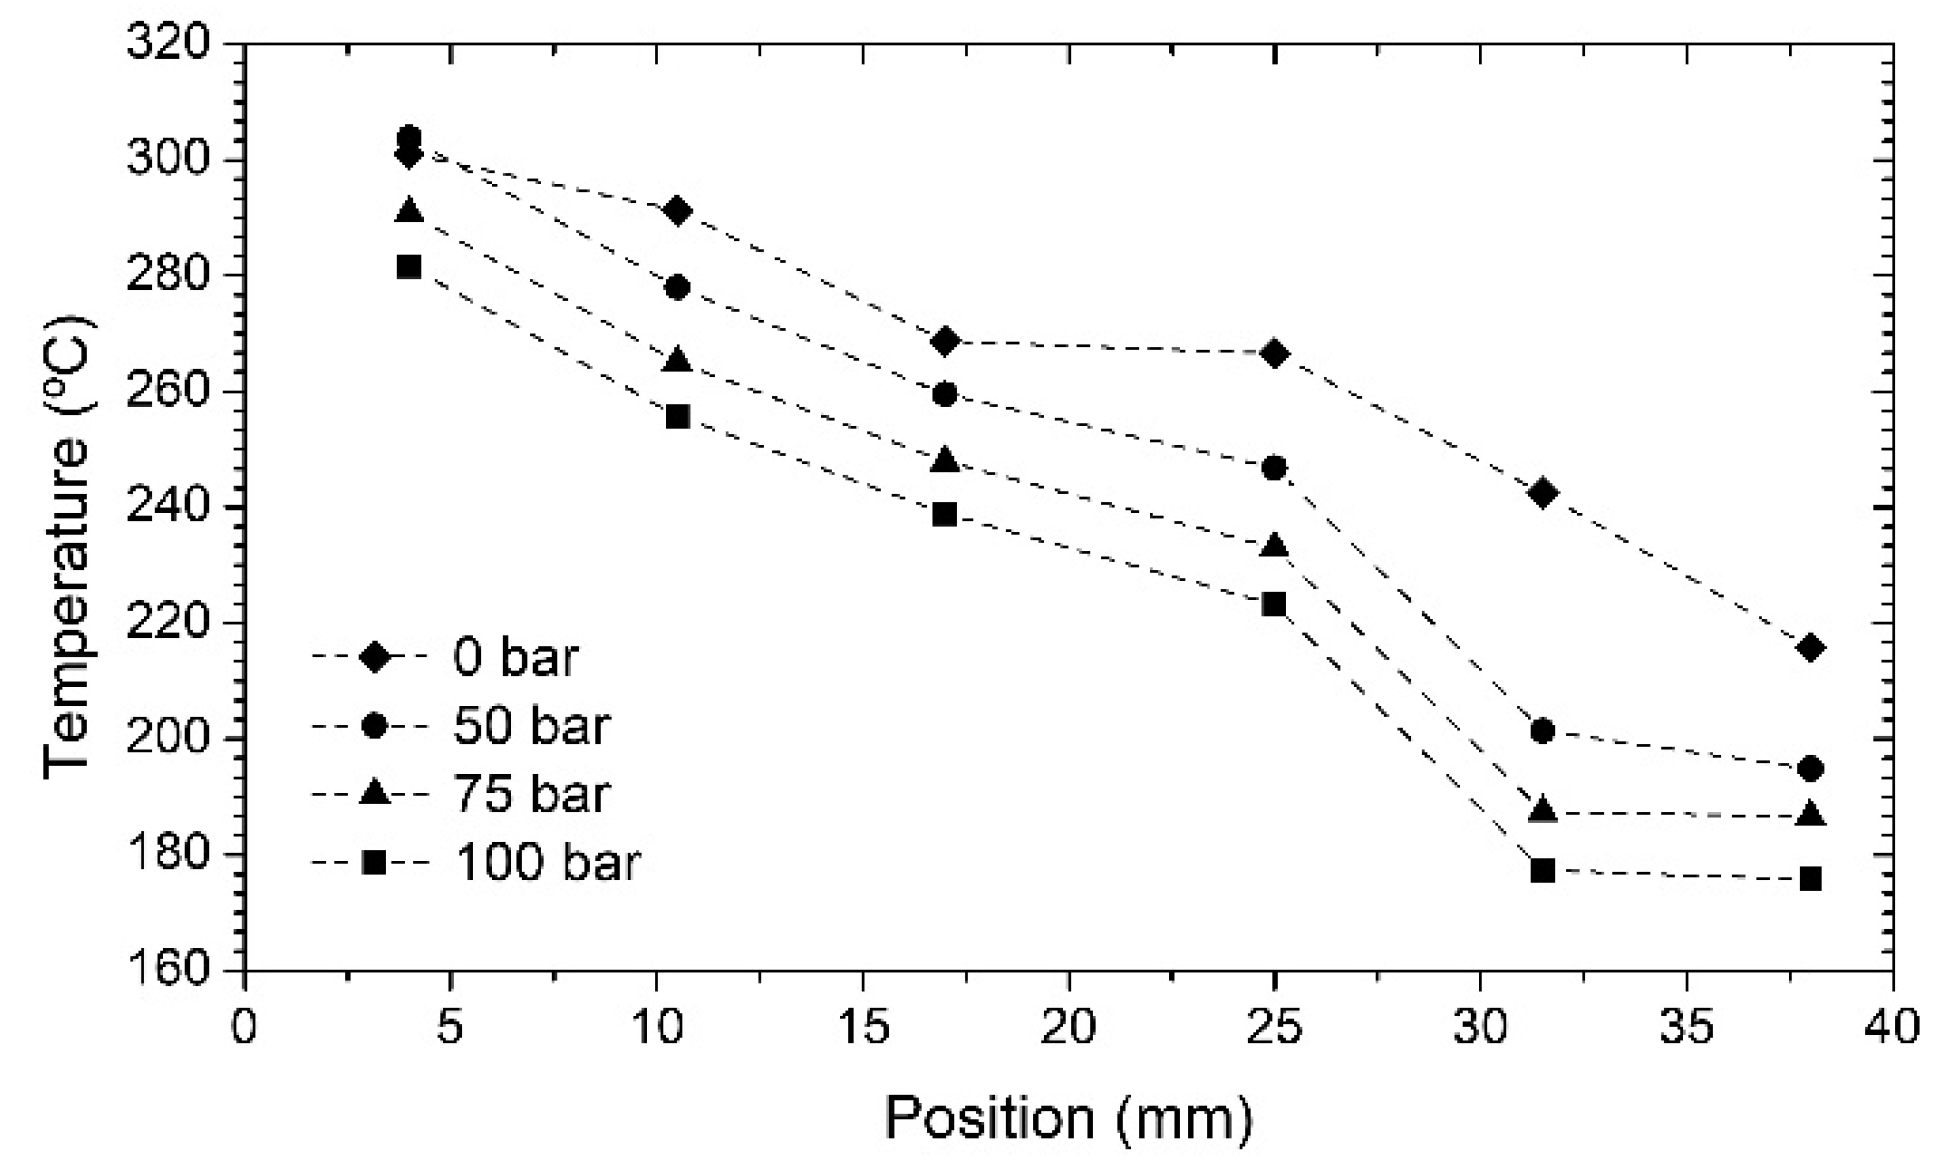
3. Results and Discussion

Prior to evaluation of the thermal behavior of both configurations, the roughness on the contact surfaces of steel disc samples A and B were measured. Figure 5 shows one of the profile curves registered from A and B steel disc surfaces. According to the recorded profiles, the arithmetic mean roughness measured on the surfaces was identical between the samples: Ra of 0.05 µm.
Despite having the same roughness (0.05 µm), samples A and B exhibited distinct roughness patterns. The surface of sample B, which was manufactured using AM, has a more uniform surface than that of sample A for the same surface finish (P600).
Figure 6 shows a SEM image of the transition zones resulting from the laser effect on the steel powder used in the AM process. Analysis focused on the interface between the two steels reveals the AM deposition layers, particularly in the zone of transition between the two steels. The image clearly demonstrates the adherence of the sample B steel to the sample A steel. Furthermore, the laser used in the AM process melted the surface of the base steel of sample A during the deposition of the first layer.
In both configurations (A/B and A.B.), contact pressures were evaluated between 0 and 100 bar. The temperature profiles of the two configurations vary for all measured contact pressures (Figure 7). The bonded configuration (A.B.) between steel sample A and B has a continuous and fully linked interface. For unbonded (A/B) configuration, as the two steels samples are not exactly matched, there is a gap at the contact interface, which increases the TCR value. For both configurations, based on experimental measurements and using Equation (1) through (3), Qf and hc values were calculated for the various tested contact pressures (Table 1). TCR values were also calculated for the unbonded configuration. Table 1 displays the results of the experimental tests conducted on the two configurations, including the rate of heat transfer (Qf), the interfacial conductance between T3 and T4 (hc), and the predicted TCR.
Increasing contact pressure causes an increase in thermal conductance (hc) between T3 and T4 in the unbonded (A/B) configuration (Table 1). With a contact pressure of 100 bar, the initial calculated value for 0 bar increases by 54%. Because the TCR is the inverse of conductance (hc) (Equation (3)), for identical contact pressure, the TCR value resulted in an increase of 36% (100 bar). The hc values for a bonded (A.B.) configuration behave differently. There is no correlation between contact pressure and conductance, whereas the conductance (hc) is decreased at contact pressures greater than 0 bar. In general, the interfacial conductance between T3 and T4 (Figure 3) is much more significant in the bonded (A.B.) configuration compared to the unbonded (A/B) configuration. The union of samples A and B in a bonded (A.B.) configuration permits an increased in thermal conductivity (hc) by four to six times compared with the unbonded (A/B) configuration.
Figure 7 shows the temperature profiles at the interface between the unbonded (A/B) and bonded (A.B.) configurations in a thermally steady state. These temperature profiles were recorded at contact pressures ranging from 0 to 100 bar.
The values for the bonded (A.B.) configuration presented in the graphs show a higher thermal profile compared to the unbonded (A/B) configuration, indicating this system’s relatively higher heat transfer capacity. This is true regardless of the location of the temperature measurement in the sample or the measured contact pressure. These findings complement those presented in Table 1, demonstrating that the conductance is much larger in the bonded (A.B.) configuration than in the unbonded (A/B) configuration, allowing for increased thermal diffusivity between samples A and B. Furthermore, when contact pressure (and also hc) increases, the temperature profile of the unbonded (A/B) configuration approaches that of the bonded (A.B.) configuration. However, whereas a temperature step is detected at the A/B interface (unbonded (A/B) configuration), the temperatures in the transition zone from sample A steel to sample B sample are reduced only very marginally in the bonded (A.B.) configuration.
Figure 8 shows the development of the temperature profile with contact pressures in bonded samples. These data enable evaluation of the influence of pressure on the system’s hot and cold points, as no interface losses occur in the bonded (A.B.) configurations. According to our findings, the system reaches equilibrium at lower temperatures when the contact pressure is increased. The increase in contact pressure seems to enhance the contact between the samples and the hot and cold ends of the system, reducing heat loss at these connection points. Overall, the temperature of the samples decreased from the hot source to the cold source.
As shown in Figure 8, the temperature decline in sample B is more pronounced than that in sample A. This observation is consistent with the thermal conductivity values for samples A and B. The thermal conductivity of sample A steel (kA) at the tested temperature (380 °C) is 27 W/m·K, whereas that of sample B steel (kB) is 18 W/m·K.
The temperature reduction from T1 (near the heat source) to T6 (at the end of the unbonded (A/B) and bonded (A.B.) configuration) is shown in Table 2 (near the cold source). Overall, there is a reduced temperature decrease in the system at 0 bar for both configurations. From 0 to 50 bar, the thermal reduction increased by ~20 °C. The thermal reduction did not significant differ between 50 and 100 bar. The heat transfer rate (Qf) rises as contact pressure increases (Table 1). However, with this increase in heat flow, the losses associated with the thermal path also increase, resulting in an enhanced thermal reduction (Table 2). In addition, the temperature decrease in the unbonded (A/B) configuration is larger than that of the bonded (A.B.) configuration. Due to heat losses associated with the A/B contact, the unbonded (A/B) configuration exhibits greater thermal resistance than the bonded (A.B.) configuration (TCR). The unbonded (A/B) configuration requires a higher temperature to attain thermal equilibrium, whereas the bonded (A.B.) configuration reaches equilibrium at lower temperatures. This explains the larger temperature decline of the unbonded (A/B) configuration.

4. Conclusions

The impact of contact between two samples of 1.2344 and 1.2709 steels on the heat transmission through these components was investigated by mimicking the contact between a steel die-casting mold (1.2344) and an AM-produced steel insert with conformal cooling channels (1.2709). The contact between the two steel samples was investigated with the steels leaning on one another (unbonded configuration) and with the 1.2709 steel directly placed on the 1.2344 steel (bonded configuration).
The two steel samples were initially characterized. The surface finish in the contact regions of unbonded steel samples presented a roughness of 0.05 µm according to standard testing. In addition, SEM research revealed that the bonded configuration produced by AM resulted in a complete union of the two steels.
When the contact pressure was increased from 0 to 100 bar, the system equilibrium was attained at lower temperatures according to the results of thermal experiments. The increase in contact pressure seems to enhance the contact between the samples and the hot and cold ends of the system, reducing energy loss in these connections.
In addition, heat testing revealed that a well-defined resistance does not emerge between the two steels in the bonded configuration as it does in the unbonded configuration. In the transition zone of the thermal profiles of the bonded configuration, the temperature reduction from steel 1.2344 to steel 1.2709 is minimal. In contrast, the temperature profile of the unbonded configuration reveals a temperature step at the contact interface, which decreases from 49 to 40 degrees with increasing compaction pressure (from 0 to 100 bar). Each of these steps correspond to a TCR.
The heat flow in an A-B system is contingent on the thermal conduction properties of the system. These characteristics vary depending on the contact configuration of the assembly and the system’s contact pressure. As contact pressure increases from 0 to 100 bar, the temperature profiles of bonded and unbonded steel samples tend to converge. The contact area between the two steels expands with increasing pressure in the unbonded configuration. As a result, heat conduction increases, and heat losses associated with this interface decrease. The increase in contact pressure seems to enhance the contact between the samples and the hot and cold ends of the system, reducing heat loss in these connections.
Despite the variation in heat conductivity properties of the two tested steels, combining the mold and insert in a bonded configuration may considerably reduce the interface resistance, despite being a permanent solution. In this manner, the cooling by heat transfer in a die-casting mold can be optimized.

Author Contributions

Conceptualization, D.S. and J.T.; methodology, V.L., A.S., D.S. and J.T.; formal analysis, V.L., P.C., D.S. and J.T.; investigation, V.L., A.S., P.C., H.P., F.P., D.S. and J.T.; resources, D.S. and J.T.; data curation, V.L., P.C., D.S. and J.T.; writing—original draft preparation, P.C. and A.S.; supervision, J.T. and D.S.; project administration, F.P., H.P. and D.S. All authors have read and agreed to the published version of the manuscript.

Funding

This work was financially supported by project PRIDOP (POCI-01-0247-FEDER-040271), co-financed by the European Community Fund FEDER through POCI—Programa Operacional Competitividade e Internacionalização. This work was also supported by FCT—Fundação para a Ciência e Tecnologia within the R&D Units Project Scope: UIDB/04077/2020 (METRICS Center). Furthermore, this work was supported by Portuguese FCT under the reference project UIDB/04436/2020.

Data Availability Statement

Research data are not shared.

Acknowledgments

Andrews Souza acknowledges PhD scholarship 2021.07961.BD provided by FCT.

Conflicts of Interest

The authors declare no conflict of interest.

References

  1. Hsu, F.H.; Wang, K.; Huang, C.T.; Chang, R.Y. Investigation on conformal cooling system design in injection molding. Adv. Prod. Eng. Manag. 2013, 8, 107–115. [Google Scholar] [CrossRef]
  2. Kurtulus, K.; Bolatturk, A.; Coskun, A.; Gürel, B. An experimental investigation of the cooling and heating performance of a gravity die casting mold with conformal cooling channels. Appl. Therm. Eng. 2021, 194, 117105. [Google Scholar] [CrossRef]
  3. Shinde, M.S.; Ashtankar, K.M. Additive manufacturing—Assisted conformal cooling channels in mold manufacturing processes. Adv. Mech. Eng. 2017, 9, 1687814017699764. [Google Scholar] [CrossRef]
  4. Heogh, W.; Yeon, S.M.; Kang, D.S.; Park, S.; Park, S.; Ryu, K.; Ha, C.W. The design and additive manufacturing of an eco-friendly mold utilized for high productivity based on conformal cooling optimization. Mater. Des. 2022, 222, 111088. [Google Scholar] [CrossRef]
  5. Tan, C.; Wang, D.; Ma, W.; Chen, Y.; Chen, S.; Yang, Y.; Zhou, K. Design and additive manufacturing of novel conformal cooling molds. Mater. Des. 2020, 196, 109147. [Google Scholar] [CrossRef]
  6. Davis, W.; Lunetto, V.; Priarone, P.C.; Centea, D.; Settineri, L. An appraisal on the sustainability payback of additively manufactured molds with conformal cooling. Procedia CIRP 2020, 90, 516–521. [Google Scholar] [CrossRef]
  7. Whal, J.P.; Niedermeyer, J.; Bernhard, R.; Hermsdorf, J.; Kaierle, S. Design of additively manufacturable injection molds with conformal cooling. Procedia CIRP 2022, 111, 97–100. [Google Scholar] [CrossRef]
  8. Blakey-Milner, B.; Gradl, P.; Snedden, G.; Brooks, M.; Pitot, J.; Lopez, E.; du Plessis, A. Metal additive manufacturing in aerospace: A review. Mater. Des. 2021, 209, 110008. [Google Scholar] [CrossRef]
  9. Murugan, P.D.; Vijayananth, S.; Natarajan, M.P.; Jayabalakrishnan, D.; Arul, K.; Jayaseelan, V.; Elanchezhian, J. A current state of metal additive manufacturing methods: A review. Mater. Today Proc. 2022, 59, 1277–1283. [Google Scholar] [CrossRef]
  10. Tomasoni, D.; Colosio, S.; Giorleo, L.; Ceretti, E. Design for additive manufacturing: Thermoforming mold optimization via conformal cooling channel technology. Procedia Manuf. 2020, 47, 1117–1122. [Google Scholar] [CrossRef]
  11. Clemente, M.R.; Oliveira Panão, M.R. Introducing flow architecture in the design and optimization of mold inserts cooling systems. Int. J. Therm. Sci. 2018, 127, 288–293. [Google Scholar] [CrossRef]
  12. Fiorentini, F.; Curcio, P.; Armentani, E.; Rosso, C.; Baldissera, P. Study of two alternative cooling systems of a mold insert used in die casting process of light alloy components. Procedia Struct. Integr. 2019, 24, 569–582. [Google Scholar] [CrossRef]
  13. Wang, A.L.; Zhao, J.F. Review of prediction for thermal contact resistance. Sci. China Technol. Sci. 2010, 53, 1798–1808. [Google Scholar] [CrossRef]
  14. Li, X.; Luo, R.; Zhang, W.; Liao, H. Method for measuring thermal contact resistance of graphite thin film materials. Measurement 2016, 93, 202–207. [Google Scholar] [CrossRef]
  15. Ren, X.J.; Ding, H.; Dai, Y.J.; Tu, J.Y.; Chen, X.; He, J.Y.; Tao, W.Q. Experimental study on thermal contact resistance of carbon fiber reinforced silicon carbide composite with 3D needled preform (3DN C/SiC). Int. Commun. Heat Mass Transf. 2021, 124, 105271. [Google Scholar] [CrossRef]
  16. Bi, D.; Chen, H.; Ye, T. Influences of temperature and contact pressure on thermal contact resistance at interfaces at cryogenic temperatures. Cryogenics 2012, 52, 403–409. [Google Scholar] [CrossRef]
  17. Hsiao, F.-B.; Wang, D.-B.; Jen, C.-P. Numerical investigation of thermal contact resistance between the mold and substrate on laser-assisted imprinting fabrication. Numer. Heat Transf. A-Appl. 2006, 49, 669–682. [Google Scholar] [CrossRef]
  18. Goodarzi, K.; Ramezani, S.R.; Hajati, S. Reducing thermal contact resistance using nanocoating. Appl. Therm. Eng. 2014, 70, 641–646. [Google Scholar] [CrossRef]
  19. Fletcher, L.S.; Smuda, P.A. Thermal contact resistance of selected low-conductance interstitial materials. AIAA J. 1969, 7, 1302–1309. [Google Scholar] [CrossRef]
  20. Mikic, B.B. Thermal contact conductance; theoretical considerations. Int. J. Heat Mass Transf. 1974, 17, 205–214. [Google Scholar] [CrossRef]
  21. McCool, J.I.; April, R. Comparison of models for the contact of rough surfaces. Wear 1986, 107, 37–60. [Google Scholar] [CrossRef]
  22. Dai, Y.-J.; Gou, J.-J.; Ren, X.-J.; Bai, F.; Fang, W.-Z.; Tao, W.-Q. A test-validated prediction model of thermal contact resistance for Ti-6Al-4V alloy. Appl. Energy 2018, 228, 1601–1617. [Google Scholar] [CrossRef]
  23. Gou, J.-J.; Ren, X.-J.; Dai, Y.-J.; Li, S.; Tao, W.-Q. Study of thermal contact resistance of rough surfaces based on the practical topography. Comp. Fluids 2018, 164, 2–11. [Google Scholar] [CrossRef]
  24. Ren, X.-J.; Dai, Y.-J.; Gou, J.-J.; Tao, W.-Q. Numerical prediction of thermal contact resistance of 3D C/C-SiC needled composites based on measured practical topography. Int. J. Heat Mass Transf. 2019, 131, 176–188. [Google Scholar] [CrossRef]
  25. Liu, D.; Luo, Y.; Shang, X. Experimental investigation of high temperature thermal contact resistance between high thermal conductivity C/C material and Inconel 600. Int. J. Heat Mass Transf. 2015, 80, 407–410. [Google Scholar] [CrossRef]
  26. Madhusudana, C.V. Accuracy in thermal contact conductance experiments-the effect of heat losses to the surroundings. Int. Commun. Heat Mass Transf. 2000, 27, 877–891. [Google Scholar] [CrossRef]
  27. Dongmei, B.; Huanxin, C.; Shanjian, L.; Limei, S. Measurement of thermal diffusivity/thermal contact resistance using laser photothermal method at cryogenic temperatures. Appl. Therm. Eng. 2017, 111, 768–775. [Google Scholar] [CrossRef]
  28. Cousineau, J.E.; Bennion, K.; Devoto, D.; Narumanchi, S. Experimental characterization and modeling of thermal resistance of electric machine lamination stacks. Int. J. Heat Mass Transf. 2019, 129, 152–159. [Google Scholar] [CrossRef]
  29. Le, V.T.; Goo, N.S.; Kim, J.Y. Experimental investigation on thermal contact resistance of alumina fibrous insulation material with Ti-6Al-4V alloy at high temperature and its effective thermal conductivity. Heat Mass Transf. 2019, 55, 1705–1721. [Google Scholar] [CrossRef]
  30. Choi, Y.S.; Kim, M.S. Experiments on Thermal Contact Conductance between Metals below 100 K. Adv. Cryog. Eng. AIP Conf. Proc. 2014, 1573, 1070–1077. [Google Scholar]
Figure 1. Scheme showing the unbonded (A/B) and bonded (A.B.) steel disc configurations.
Jmmp 06 00099 g001
Figure 2. Heat transfer equipment.
Jmmp 06 00099 g002
Figure 3. Schematic representation of thermocouple positioning in the experimental setup.
Jmmp 06 00099 g003
Figure 4. Representation of heat flow through the system.
Jmmp 06 00099 g004
Figure 5. Roughness profile curves measured on steel sample contact surfaces: (a) surface A; (b) surface B.
Jmmp 06 00099 g005
Figure 6. SEM image of the transition zone in the A.B. bonded configuration.
Jmmp 06 00099 g006
Figure 7. Temperature profiles at the interface between the unbonded (A/B) and bonded (A.B.) configurations at the following contact pressures: (a) 0 bar, (b) 50 bar, (c) 75 bar, and (d) 100 bar.
Jmmp 06 00099 g007
Figure 8. Temperature profile for the bonded (A.B.) configuration with varying compression pressures.
Jmmp 06 00099 g008
Table 1. Thermal tests conditions and results for the unbonded (A/B) and bonded (A.B.) configurations with contact pressures of 0, 50, 75, and 100 bar.
Contact Pressure (bar)Qf
(W)
hc
(W/m2·°C)
TCR × 104
(m2·K/W)
Unbonded (A/B) configuration
038543952.28
5038645742.19
7538851421.94
10038967911.47
Bonded (A.B.) configuration
037426,160-
5037521,417-
7537922,415-
10038323,401-
Table 2. Temperature reduction in the unbonded (A/B) and bonded (A.B.) configurations from T1 to T6.
Contact Pressure
(bar)
T1–T6 Temperature Reduction (°C)
Unbonded
(A/B) Configuration
Bonded
(A.B.) Configuration
09185
50112109
75112104
100115106
Publisher’s Note: MDPI stays neutral with regard to jurisdictional claims in published maps and institutional affiliations.

