Article

X-ray Tomography Investigation of the Quality of Architected Structures Obtained with Additive Manufacturing Processes

Institut de Thermique Mécanique Matériaux (ITheMM EA7548), Université de Reims Champagne Ardenne, Chaire MATUR, Campus Sup Ardenne, Charleville Mézières, 08000 Reims, France
*
Author to whom correspondence should be addressed.
J. Manuf. Mater. Process. 2022, 6(4), 73; https://doi.org/10.3390/jmmp6040073
Submission received: 2 June 2022 / Revised: 24 June 2022 / Accepted: 30 June 2022 / Published: 4 July 2022

Abstract

:
Additive Manufacturing (AM) appears to be the best candidate to manufacture random architected materials, as it offers significant freedom in the design of hollowed parts with complex geometry. However, when these structures are needed with thins walls and struts, AM processes may encounter difficulties in properly manufacturing these structures due to their capability limits. This study proposes to characterize the manufacturing of random architected structures to see firstly their fabricability and the capability of the additive manufacturing processes used, such as vat photopolymerization (Stereolithography process (SLA)), material extrusion (Fused Filament Fabrication process (FFF)) and powder bed fusion (Selective Laser Sintering process (SLS)) through tomographic, dimensional, and mass analysis. Several defects specific to each process were identified. A higher predominance of porosities, lack of printing and excess of material manifests as trapped or partially fused powder for SLS and angel hair for FFF. These defects strongly affect the dimensional and geometric accuracy of the struts and, thus, the final mass of the structure obtained with these two processes. The SLA process makes it possible to print thinner details of random architected structures with better material quality and good dimensional and geometric accuracy, under the conditions and protocol used in this study.

1. Introduction

Architected structures are designed as lattice structures with struts and nodes that intersect in a volume with a certain arrangement. We distinguish two types of structures: periodic structures, based on the regular distribution of the same pattern, and random structures, based on random distribution of a basic generic pattern. The random structures can be generated with several techniques such as the use of “Voronoi” diagrams [1] which are based on the decomposition of a volume into adjacent cells based on a set of random points. Used in CAD software modules, these diagrams enable the automatic generation of random lattice structures. Compared to other architected materials, such as foams and honeycombs, lattice structures have a better flexibility with a controlled design allowing them to have high physical, thermal and mechanical properties. This is why they are widely used in various engineering applications such as energy absorption [2], thermal insulation [1] and in healthcare applications [3]. Moreover, these random structures can be generated with hybrid zones to increase their performance [4].
Previously, this type of structure was manufactured using traditional processes, such as casting, sheet metal bending and welding [5]. These processes only allow the fabrication of metallic structures with simple topologies at a macroscopic scale, which does not exploit their high potential when they are fabricated with small dimensions. This limitation is overcome by Additive Manufacturing (AM), which includes techniques able to manufacture parts layer by layer from CAD models. These techniques, classified into seven families according to the ASTM ISO/ASTM52900-21 [6], have shown a high capacity to manufacture different complex geometries, such as architected structures, which enables their properties: porosity rate, branch thicknesses, distribution mode, … [7] to be fully exploited. The most used AM processes to obtain architected structures are material extrusion, powder bed fusions and vat photopolymerization. Despite their numerous advantages, AM processes still have limitations in the fabrication of structures with complex geometries and thin walls. Indeed, while the macroscopic dimensions of a printed architected structure correspond to its CAD model, it generally retains printing defects due to the lack of control and/or limits of these innovative processes [8], which are related to several factors, such as the material used, printing parameters, printing equipment, etc. These defects can be classified into three categories: dimensional inaccuracy defects, surface defects and porosity defects [9].
Dimensional defects can occur at the macroscopic dimensions of the structure and, most importantly, at the local dimensions of the struts and nodes. In fact, several works have shown that, while printing circular struts, the obtained cross-section has an ellipsoidal shape [10,11,12,13]. The thickness of the struts, on their side, varies significantly with respect to the CAD model, with both negative and positive deviations as highlighted in [14] for the vat photopolymerization process. In addition to dimensional inaccuracy, the print quality is also related to the defects observed on the surface, which are also impacted by the way the material is deposited from one layer to another as confirmed by [15] in the powder bed fusion (Laser Powder Bed Fusion process (LPBF). Surface roughness parameters, according to ISO 4287 [16], can be used to analyze the struts’ surface quality, which can be improved by a post-treatment, such as chemical treatment, after printing [17]. Finally, porosity defects, reflecting a lack of material, can appear on the surface as well as in the interior of the material. This lack of material is often related to the process parameters as highlighted by the work of Carneiro et al. [11].
All these defects have been used in the literature to characterize the printing quality of architected structures function of strut diameter with the aim of evaluating the capability of the process used. The studied structures are generally periodic. For example, we mention the study carried out by Du Plessis et al. [18] on the capability of the powder bed fusion (SLS process) to manufacture periodic architected structures by varying the strut diameters from 0.1 mm to 0.25 mm. The structures were all obtained with a strut diameter of 0.15 mm which was explained by the authors according to the limits of the printing parameters. For the material extrusion (FFF process), the study conducted by Dong et al. [12] on the printing of periodic architected structures with strut diameters from 2 mm to 6 mm showed both positive and negative dimensional deviations attributed to printing defects. To our knowledge, there is no study simultaneously investigating the capability of several printing processes and, furthermore, using a random architected structure, especially with small diameter struts. The knowledge and control of this capacity would allow the adapted process for the manufacturing of these structures to be chosen and, especially when these are random or even hybrid [4,19], to reach the most optimal properties.
This study is part of this framework and proposes to investigate the manufacturability of random architected structures and the capability of the processes that will be used: vat photopolymerization (SLA), material extrusion (FFF), and powder bed fusion (SLS). These processes were chosen according to the equipment available in our laboratory. To achieve these aims, a random architected structure has been generated based on Voronoi diagrams according to various defined parameters. After modeling, the generated structures were fabricated with the three selected processes. Finally, macro and micro-observations were performed, and comparisons based on indicators were made to define the most suitable process to fabricate these types of structures.

2. Materials and Methods

2.1. Modeling and Structure Generation

The architected structures were generated using the “Engineering_Lattice” module of the CAD software “PTC Creo 7.0” (Parametric Technology Corporation, France), based on Voronoi diagrams. The first step is to create a basic pattern cell with circular struts (Figure 1a), which is defined by its diagonal size and the diameter of the struts. Then, the study volume (10 × 10 × 10 mm3) in which it will repeat to obtain the architected structure (Figure 1b) is defined. To facilitate the installation of the samples during the manufacturing process as well as the eventual characterization of their mechanical behavior, which will not be discussed here, two plates were added on the top and bottom faces (Figure 1c) to facilitate the fabrication and possible mechanical testing. So, the parameters for modeling the structures are: the size of the base pattern, the strut diameter and the plate thickness.
The first two parameters are the most important and concomitant for the study of the processability of these structures. In this way, ten architected structures were generated by simultaneously varying the diameter of the struts from 0.1 mm to 1 mm as well as the size of the pattern from 2 mm to 10 mm (Table 1). For the plates, a low thickness of 0.5 mm was chosen for the samples with small dimensions (samples 01, 02, 03, 04 and 05). For the other samples, the thickness is incremented by 0.1 mm, as for the strut diameter, to reach 1 mm for sample 10. In addition to the architected structures, a filled structure was also fabricated to be used as a reference in the comparison. The design and dimensions of each configuration are made at a scale of 1 in the CAD software “PTC Creo 7.0” (Parametric Technology Corporation, France) and are previously checked before exporting them to the slicing software to prepare printing.

2.2. Choice of Manufacturing Process and Protocols

Three processes allowing the fabrication of polymeric architected structures were chosen for this study: vat photopolymerization (SLA process), material extrusion (FFF process) and powder bed fusion (SLS process). The equipment and materials used are listed in Table 2.
For each process, a preliminary study was conducted to calibrate the process and determine the most relevant parameters and steps. For the SLA process, the Formlabs 2 machine (Formlabs, France) based on the photopolymerization of a resin was used to manufacture the samples by selectively curing a polymer resin layer by layer using an ultraviolet (UV) laser beam. According to the manufacturer, this machine can produce layer heights from 25 µm to 300 µm with a minimum layer width, supposedly equal to the diameter of the laser beam, which is 140 µm. Apart from the layer height, the other printing parameters were fixed and cannot be modified by the slicing software. Thus, given the precision required for the architected structures, a layer height of 25 µm was chosen. Once the layer height has been chosen, the structures were placed in the virtual bed of the slicing software, “PreForm” (Formlabs, France), which is specific to the machine and enables the orientation of the samples and to generate the necessary supports to finally prepare the G-code file for printing. When importing the files into the slicing software, we checked that the structure and its dimensions are not affected in comparison with the CAD model. After printing, each sample is immersed into a tank filled with isopropyl alcohol (IPA) and shaken several times. This post-treatment removes all the non-polymerized residues that close the internal cavities. A second rinse was performed in another tank of IPA cleaner to completely clean the part. The duration of these steps is approximately 15 min. This post-treatment is completed by a simple water rinse and the sample is left to dry in ambient air. Finally, the printing supports were removed with a cutter and the attachment points were sanded to improve the surface finish. These supports are automatically generated by the slicing software in order to enable the printing, as shown in Figure 2. In this study, no post-curing treatment is performed. This specific post-treatment, which improves the mechanical properties of the printed samples, is not necessary for the resin used in this study, which is a standard one.
For the FFF process, the Raise N2 machine (Raise 3D, France) was used. It is based on the extrusion of fused material for which an object is constructed by selectively depositing the material on a predetermined path, layer by layer. Using this technique, a thermoplastic polymer is used in the form of filaments. The manufacturer’s data sheet specifies that the machine can achieve accuracies of 10 µm to 250 µm in all three printing directions. The literature shows that the print quality of the parts obtained with this process depends on several parameters: nozzle diameter, layer height, print speed, print flowrate and nozzle and bed temperatures [20]. Preliminary tests were performed to determine the optimal parameters, the values of which are given in Table 3. The manufacturing process includes three steps: slicing the CAD model in a slicer,”ideaMaker” (Raise 3D, France), which is specific to the machine used with the chosen printing parameters and where the structures were placed and oriented such as to minimize the need for supports in the virtual bed of the software. When importing the files into the slicing software, we checked that the structure and its dimensions are not affected in comparison with the CAD model. The G-code thus obtained is sent to the machine that will print the part that is cleaned of the printing residues with a cutter afterwards. For this process, there is no additional specific post-processing.
The Lisa Pro machine (Sinterit, Poland) was used for the SLS process, which is based on the powder bed sintering technique where a laser selectively sinters powder particles of a thermoplastic polymer to build a part layer by layer. Similar to the SLA process, the machine does not allow modification of the printing parameters, which are already set by the manufacturer, except for the layer height. According to the data sheet of the equipment, this machine can print layer heights from 75 µm to 150 µm and a minimum width of 0.1 mm (minimum detail size) with a precision of 50 µm. Therefore, we have chosen the minimum value proposed by the machine, i.e., 75 µm. Once the layer height is chosen, the structures were placed in the virtual bed of the slicing software “Sinterit Studio” (Sinterit, Poland), to send the G-code file to the machine for printing. When importing the files into the slicing software, we checked that the structure and its dimension are not affected in comparison with the CAD model. It should be noted that, for the SLS process with polymer powder, there is no need for additional supports since the powder is self-supporting. After printing, the part was cleaned to eliminate the excess powder. The cleaning is performed manually with a brush and compressed air. As for the FFF process, there is no additional specific post-treatment.

3. Results

After printing the different samples, observations and measurements were performed to evaluate the limit of each process used to print architected structures as well as to compare their capabilities. Thus, in the first step, macroscopic observations with qualitative comparisons were realized. Then, these analyses were enriched with microscopic observations using X-ray tomography and local dimensional analyses to verify the quality of the printing of the struts. Finally, these observations were correlated with mass measurements to compare the expected theoretical masses with those obtained.

3.1. Printing Quality

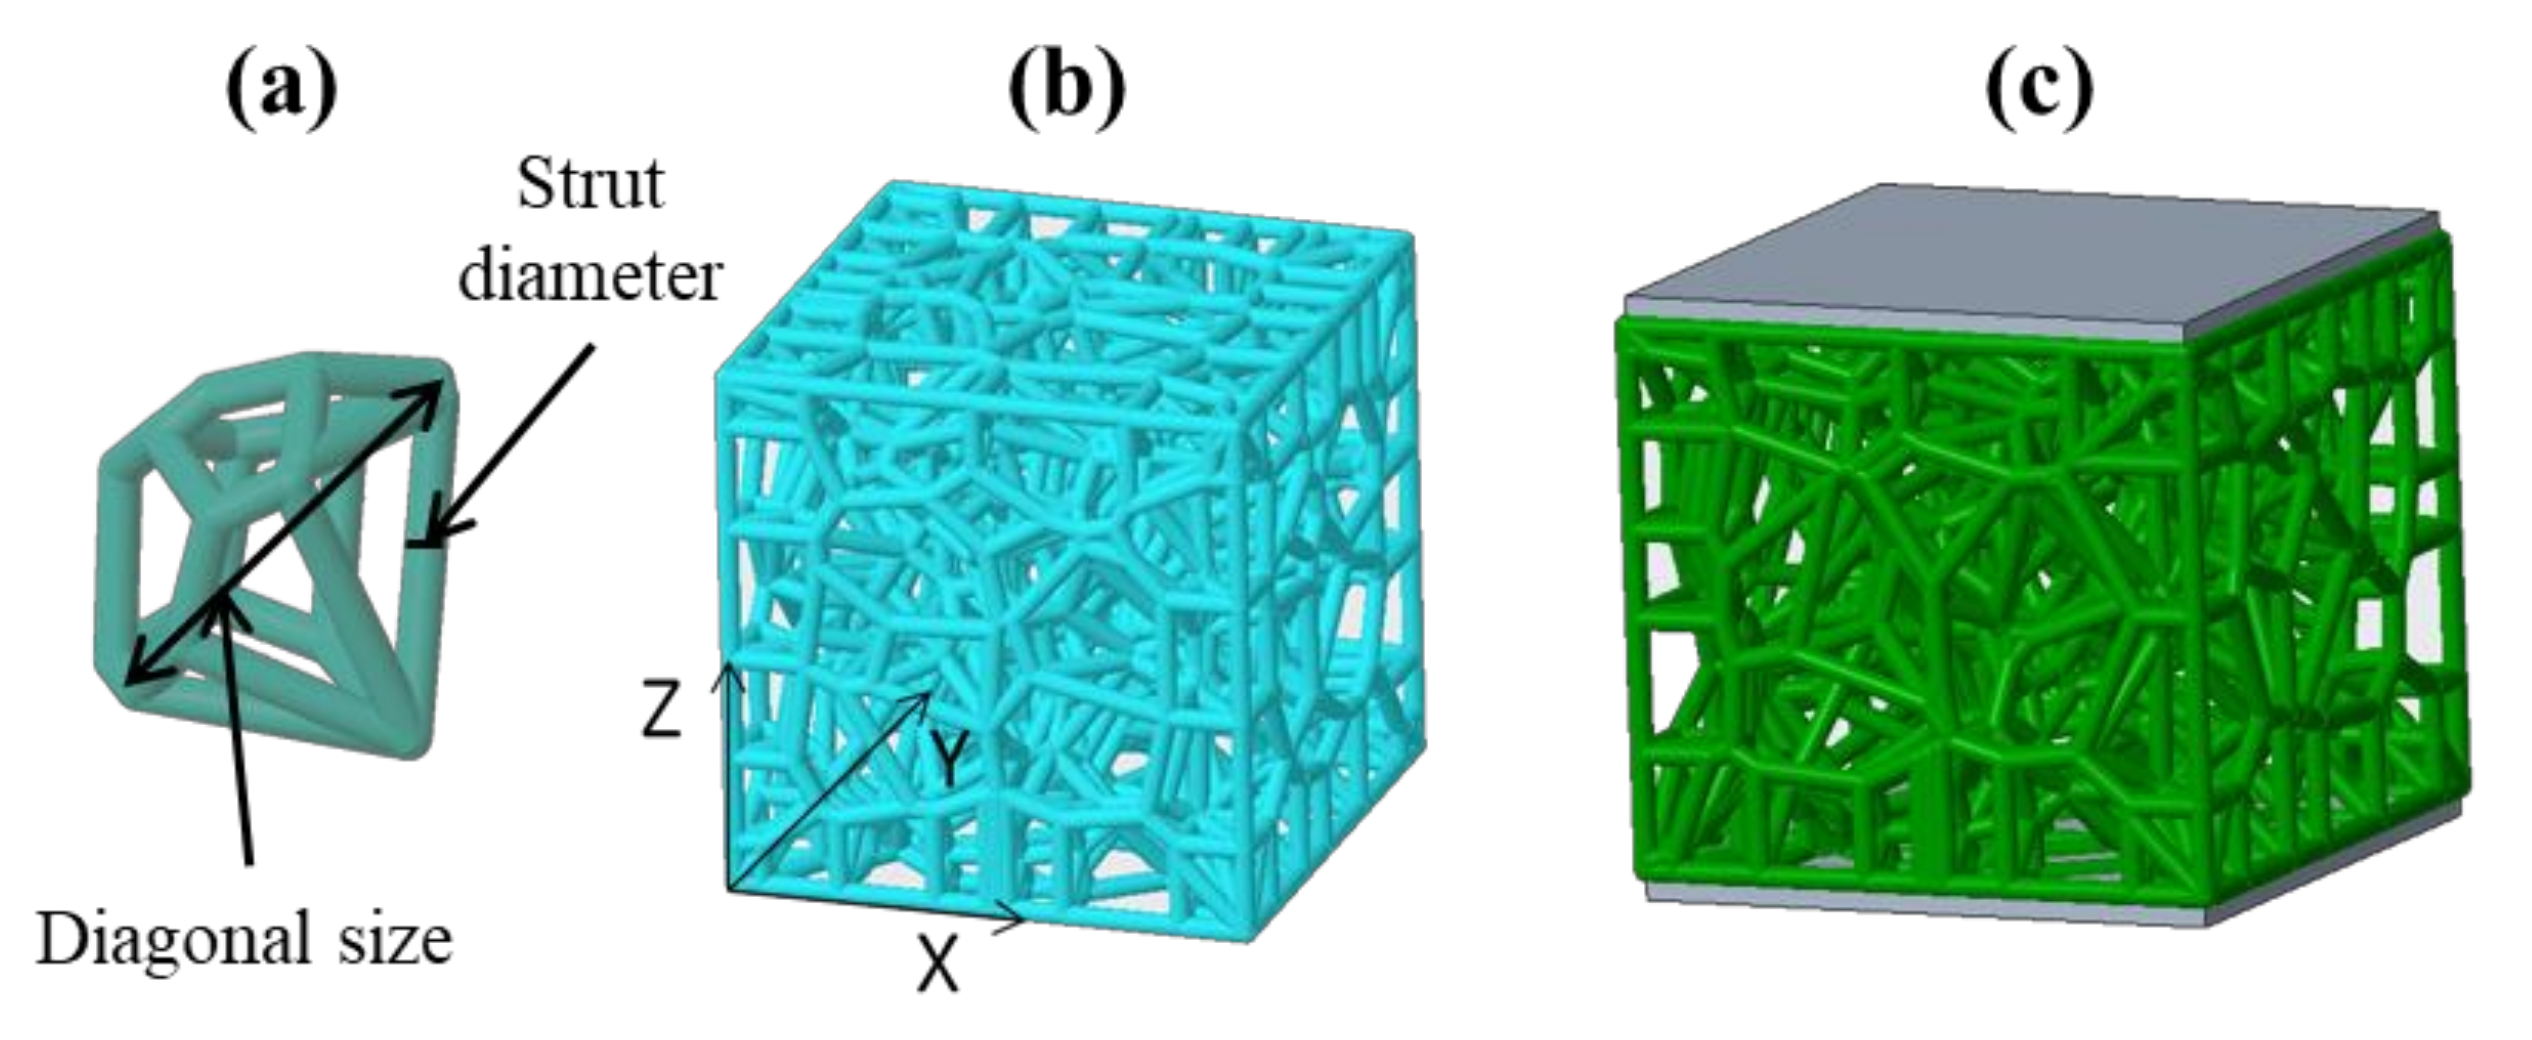
The macroscopic observations evaluated the printing quality of the printed samples, which can be linked to the capability limit of each process. The three processes used were able to print samples with strut diameters superior to 0.5 mm with relatively good quality. Samples with strut diameters less than 0.5 mm were printed with several major defects visible to the naked eye (Figure 3). The same observation has been made previously on metal lattices obtained with the LPBF process [21]. For the SLA process, these defects included missing and/or unprinted struts (samples 02 and 03) as well as the presence of non-cured or partially cured resin (sample 02) that could not be cleaned by the post-processing. Sample 01 has not been printed. For the FFF process, we observe a printing lack of struts in some areas and a poor quality for the printed struts which were characterized by the presence of printing residues in the form of fine filaments between them. Sample 01 could only be partially printed (Figure 3). Additionally, for the SLS process, even if all the specimens could be printed, it is very clear that the thickness of the struts is higher than the one modeled and we observed cavities that were completely closed because of the powder that stays stuck on the struts and trapped inside the structures.
To make the comparison more consistent, for the rest of the study we limited the analysis to the comparison and measurements made on samples with a strut diameter higher than 0.5 mm and which have been printed correctly by all the processes. Thus, the macroscopic observations showed that, even if some samples could be printed, the actual dimensions do not correspond to the targeted dimensions. Figure 3 illustrates this fact very well: one can observe that the external samples dimensions are greater than the targeted one of 10 mm. Moreover, since these observations were made from outside, we cannot distinguish the printing quality in the core of the samples where struts may not be printed or even material may be trapped. To support these hypotheses, we proposed first to make tomographic observations and then mass comparisons.
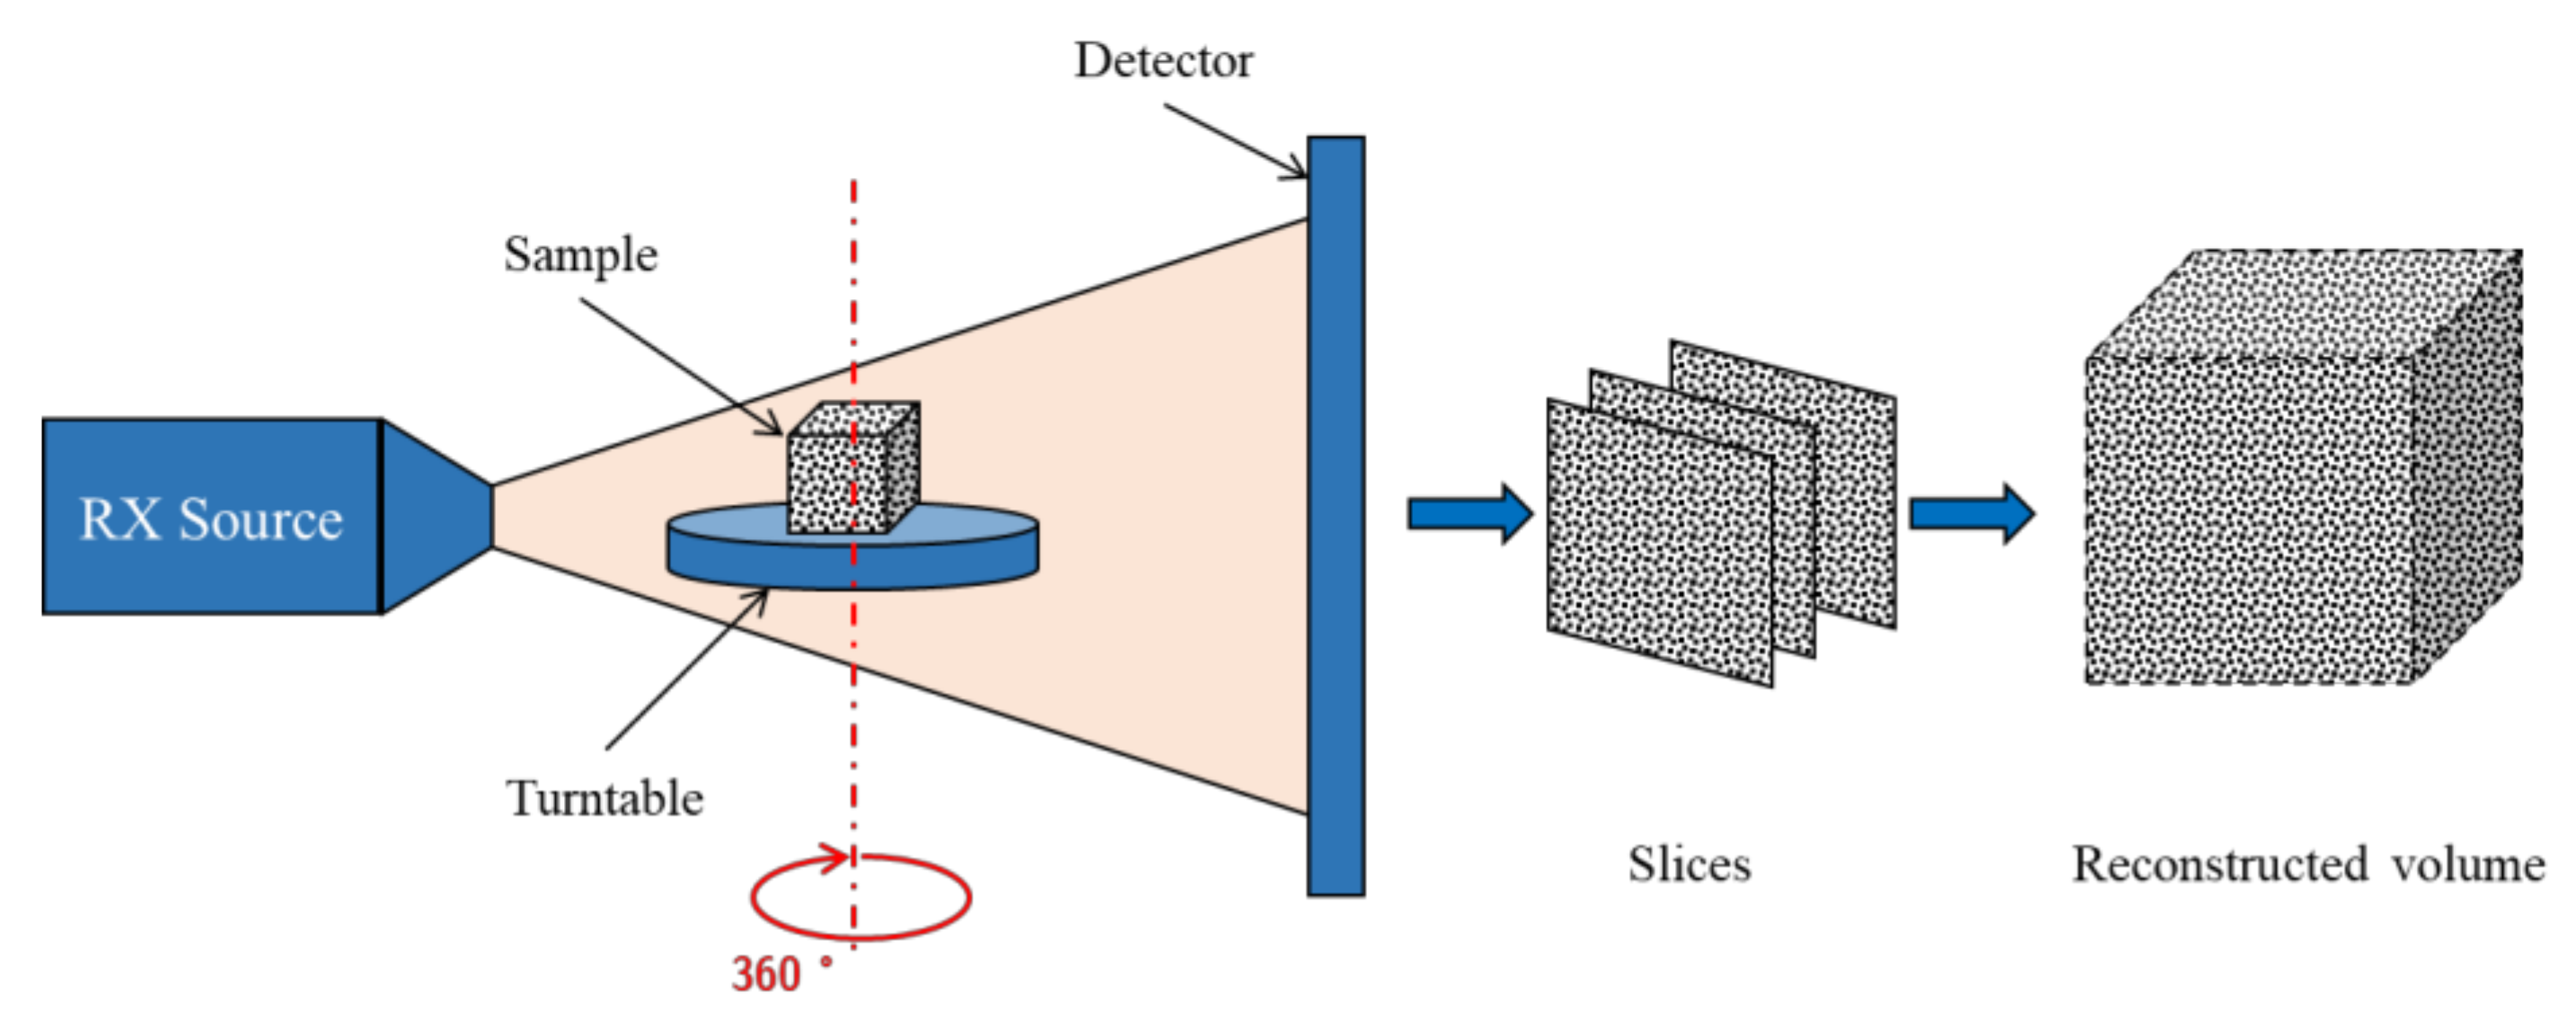
To enhance the macroscopic observations, X-ray tomography observations were performed on the printed samples. The principle of this technique consists of making an X-ray beam pass through the sample at a specific position and recording the beam transmitted by a detector in the form of an image (Figure 4). Several 2D images are acquired at different rotation angles and the slices obtained are then used to reconstruct the three-dimensional image using dedicated algorithms [22]. Using this technique and by post-processing the reconstructed volumes with the VGSTUDIO MAX software (Volume Graphics, Charlotte, NC, USA) from the VOLUME GRAPHICS products, one can make non-destructive analyses that give access to the various details of the internal structure: local dimensions, shape, local defects, porosities, etc. This software provides colored images according to the 3D thickness (at local and global scales) of the material’s pattern that is suitable to visualize these details and to highlight them. Since our images were taken at different magnifications, the color code is not relevant and will not be exploited after.
All tomographic scans were performed with an X-ray tomograph RX SOLUTIONS DESKTOM 150 (RX Solutions, France) in simple tomography mode. The main parameters used are: tube power 10 W, voltage 60 kV, intensity 166 µA, voxel size 10 µm and an acquisition time for each scan of 2 h and 30 min.
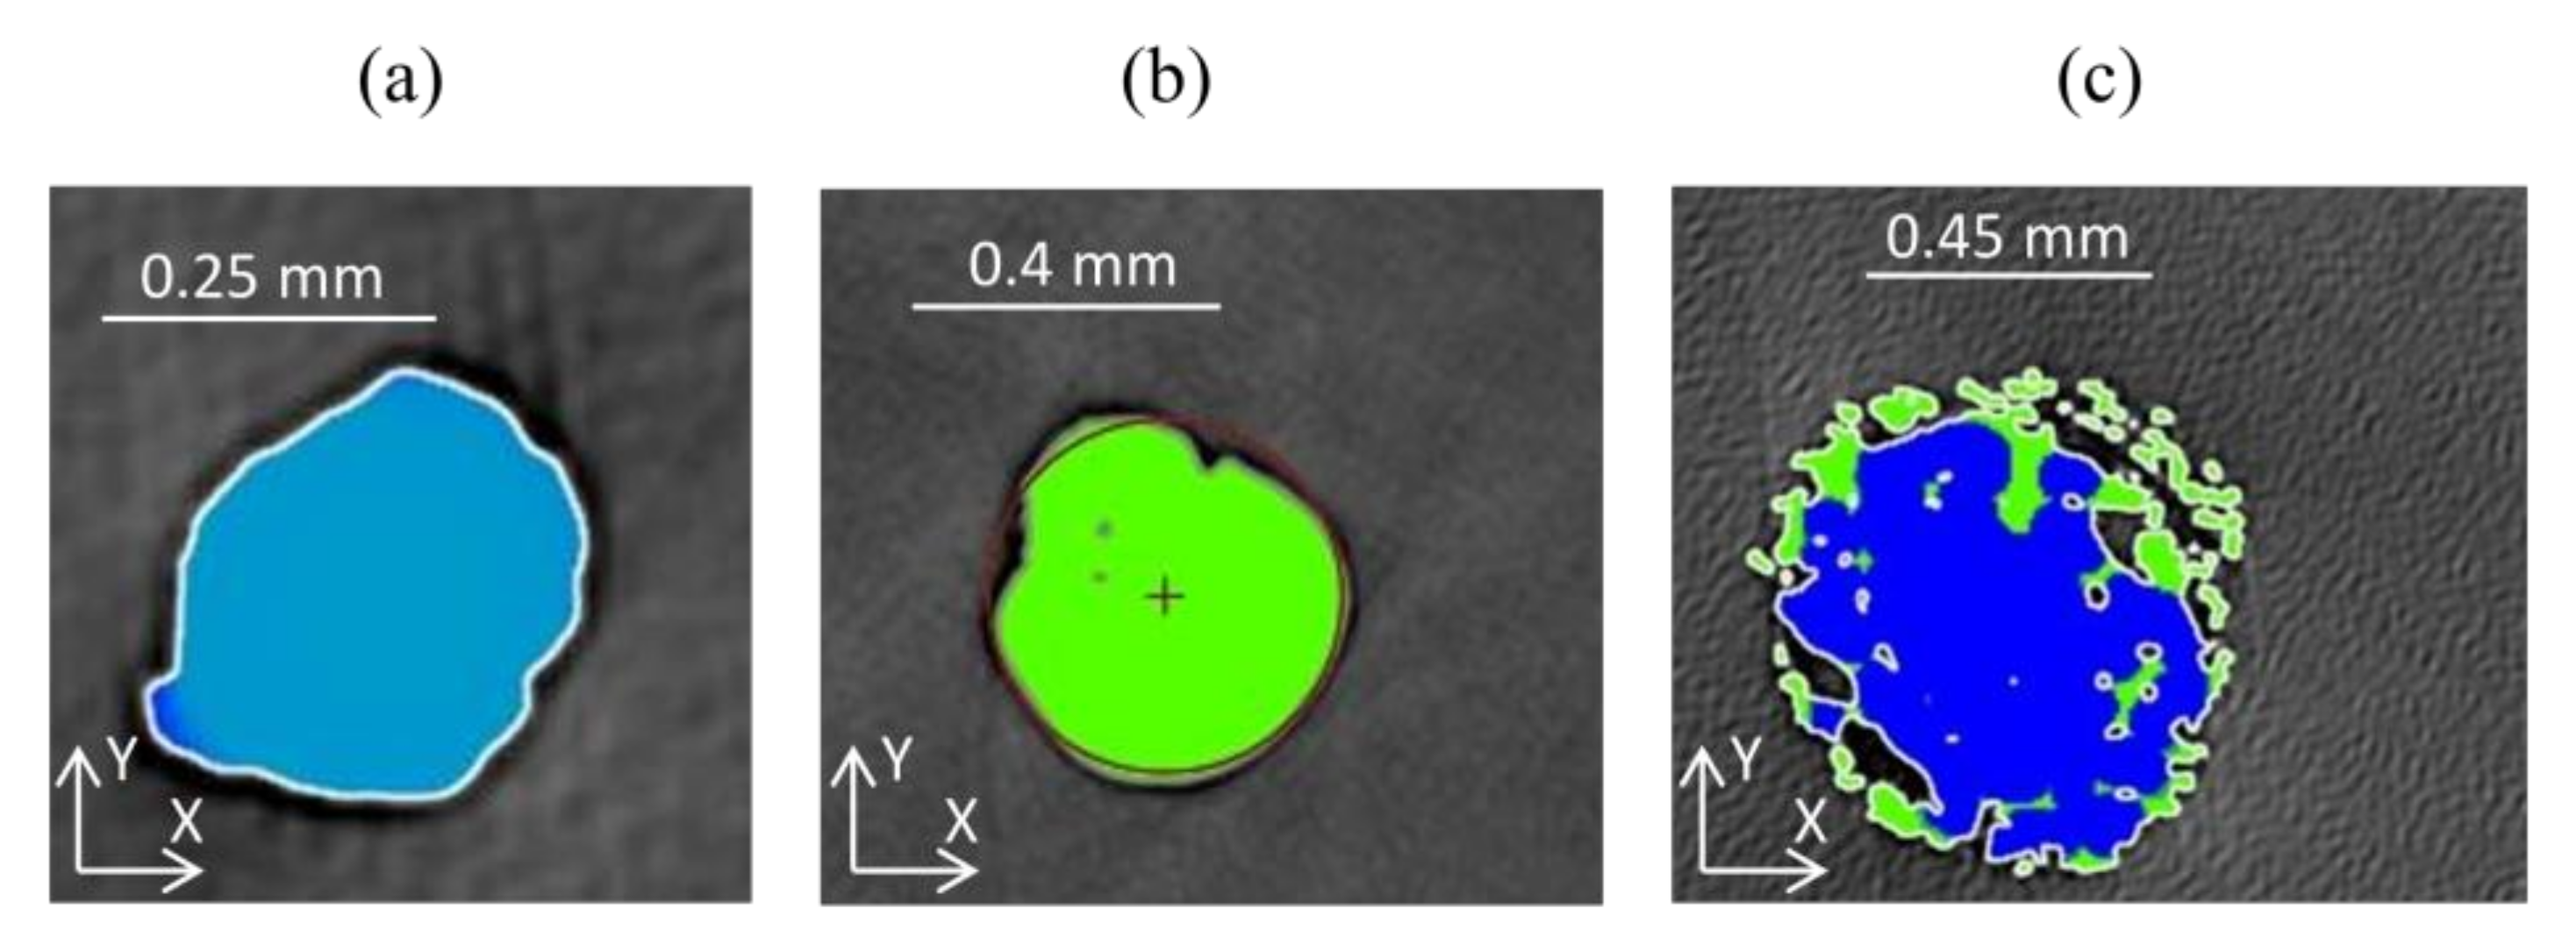
The tomographic observations of the samples obtained by SLA show the best printing quality with little or no porosity (Figure 5a). Even with this good quality, there were some unprinted zones on the struts or at the nodes, which were mainly located on the borders, which agrees with the observations made by Qi et al. [23]. The struts were printed with regular sections and their intersections, at the level of the nodes, were obtained with a rather soft rounding, which would give good mechanical properties to the structure (Figure 5a). Finally, no porosities were observed within the material of the struts and nodes, which would influence the dimensional quality or the excess mass (this is discussed later).
For the samples obtained by FFF, a lower quality is observed compared to that obtained by the SLA process, even if it remains acceptable (Figure 5b). Even though the process parameters have been optimized, printing residues remain and were observed on all the samples, as highlighted by previous studies [24]. These residues are mainly due to the displacement of the nozzle between an area where the printing is finished and the next point to print. During this displacement, the nozzle passes over empty places and the material flows out of the print head.
This phenomenon, known as “angel hair”, depends on the fused material, temperature and speed of the flowrate. We can clearly distinguish each stacked layer, as highlighted by [25], due to its rounded contour along the edges of both vertical and inclined struts. This gives the struts an obvious surface irregularity that, because of their less rounded junctions at the level of the nodes (Figure 5b), could affect the mechanical performance of the structures. Important porosities were also observed, both in the struts and the plates, which were caused by the non-coalescence between layers but also unprinted areas on the struts, as well as at the nodes. At this stage, we can consider that porosity is the most dominant defect that will generate mass differences (this is discussed later).
Finally, the tomographic analyses of the samples obtained by SLS show that the printing quality is very defective compared to the other two processes (Figure 5c). The most prevalent defects are the presence of non-fused powder on the struts and in the internal cavities that could not be removed with the post-treatment process, a high rate of porosity on the struts and at the nodes, the presence of sharp edges on the nodes and the presence of unprinted areas. All these defects are attributed to the lack or partial fusion of the powder in the areas concerned, which generates surfaces with a significant roughness. These observations are consistent with the results of the literature on powder bed fusion ([26] for the SLM (Selective Laser Melting) process, [27] for the EBM (Electron Beam Melting) process, [21,28] for the LPBF process) and material extrusion (FFF process [29]).

3.2. Dimensional and Geometric Analysis

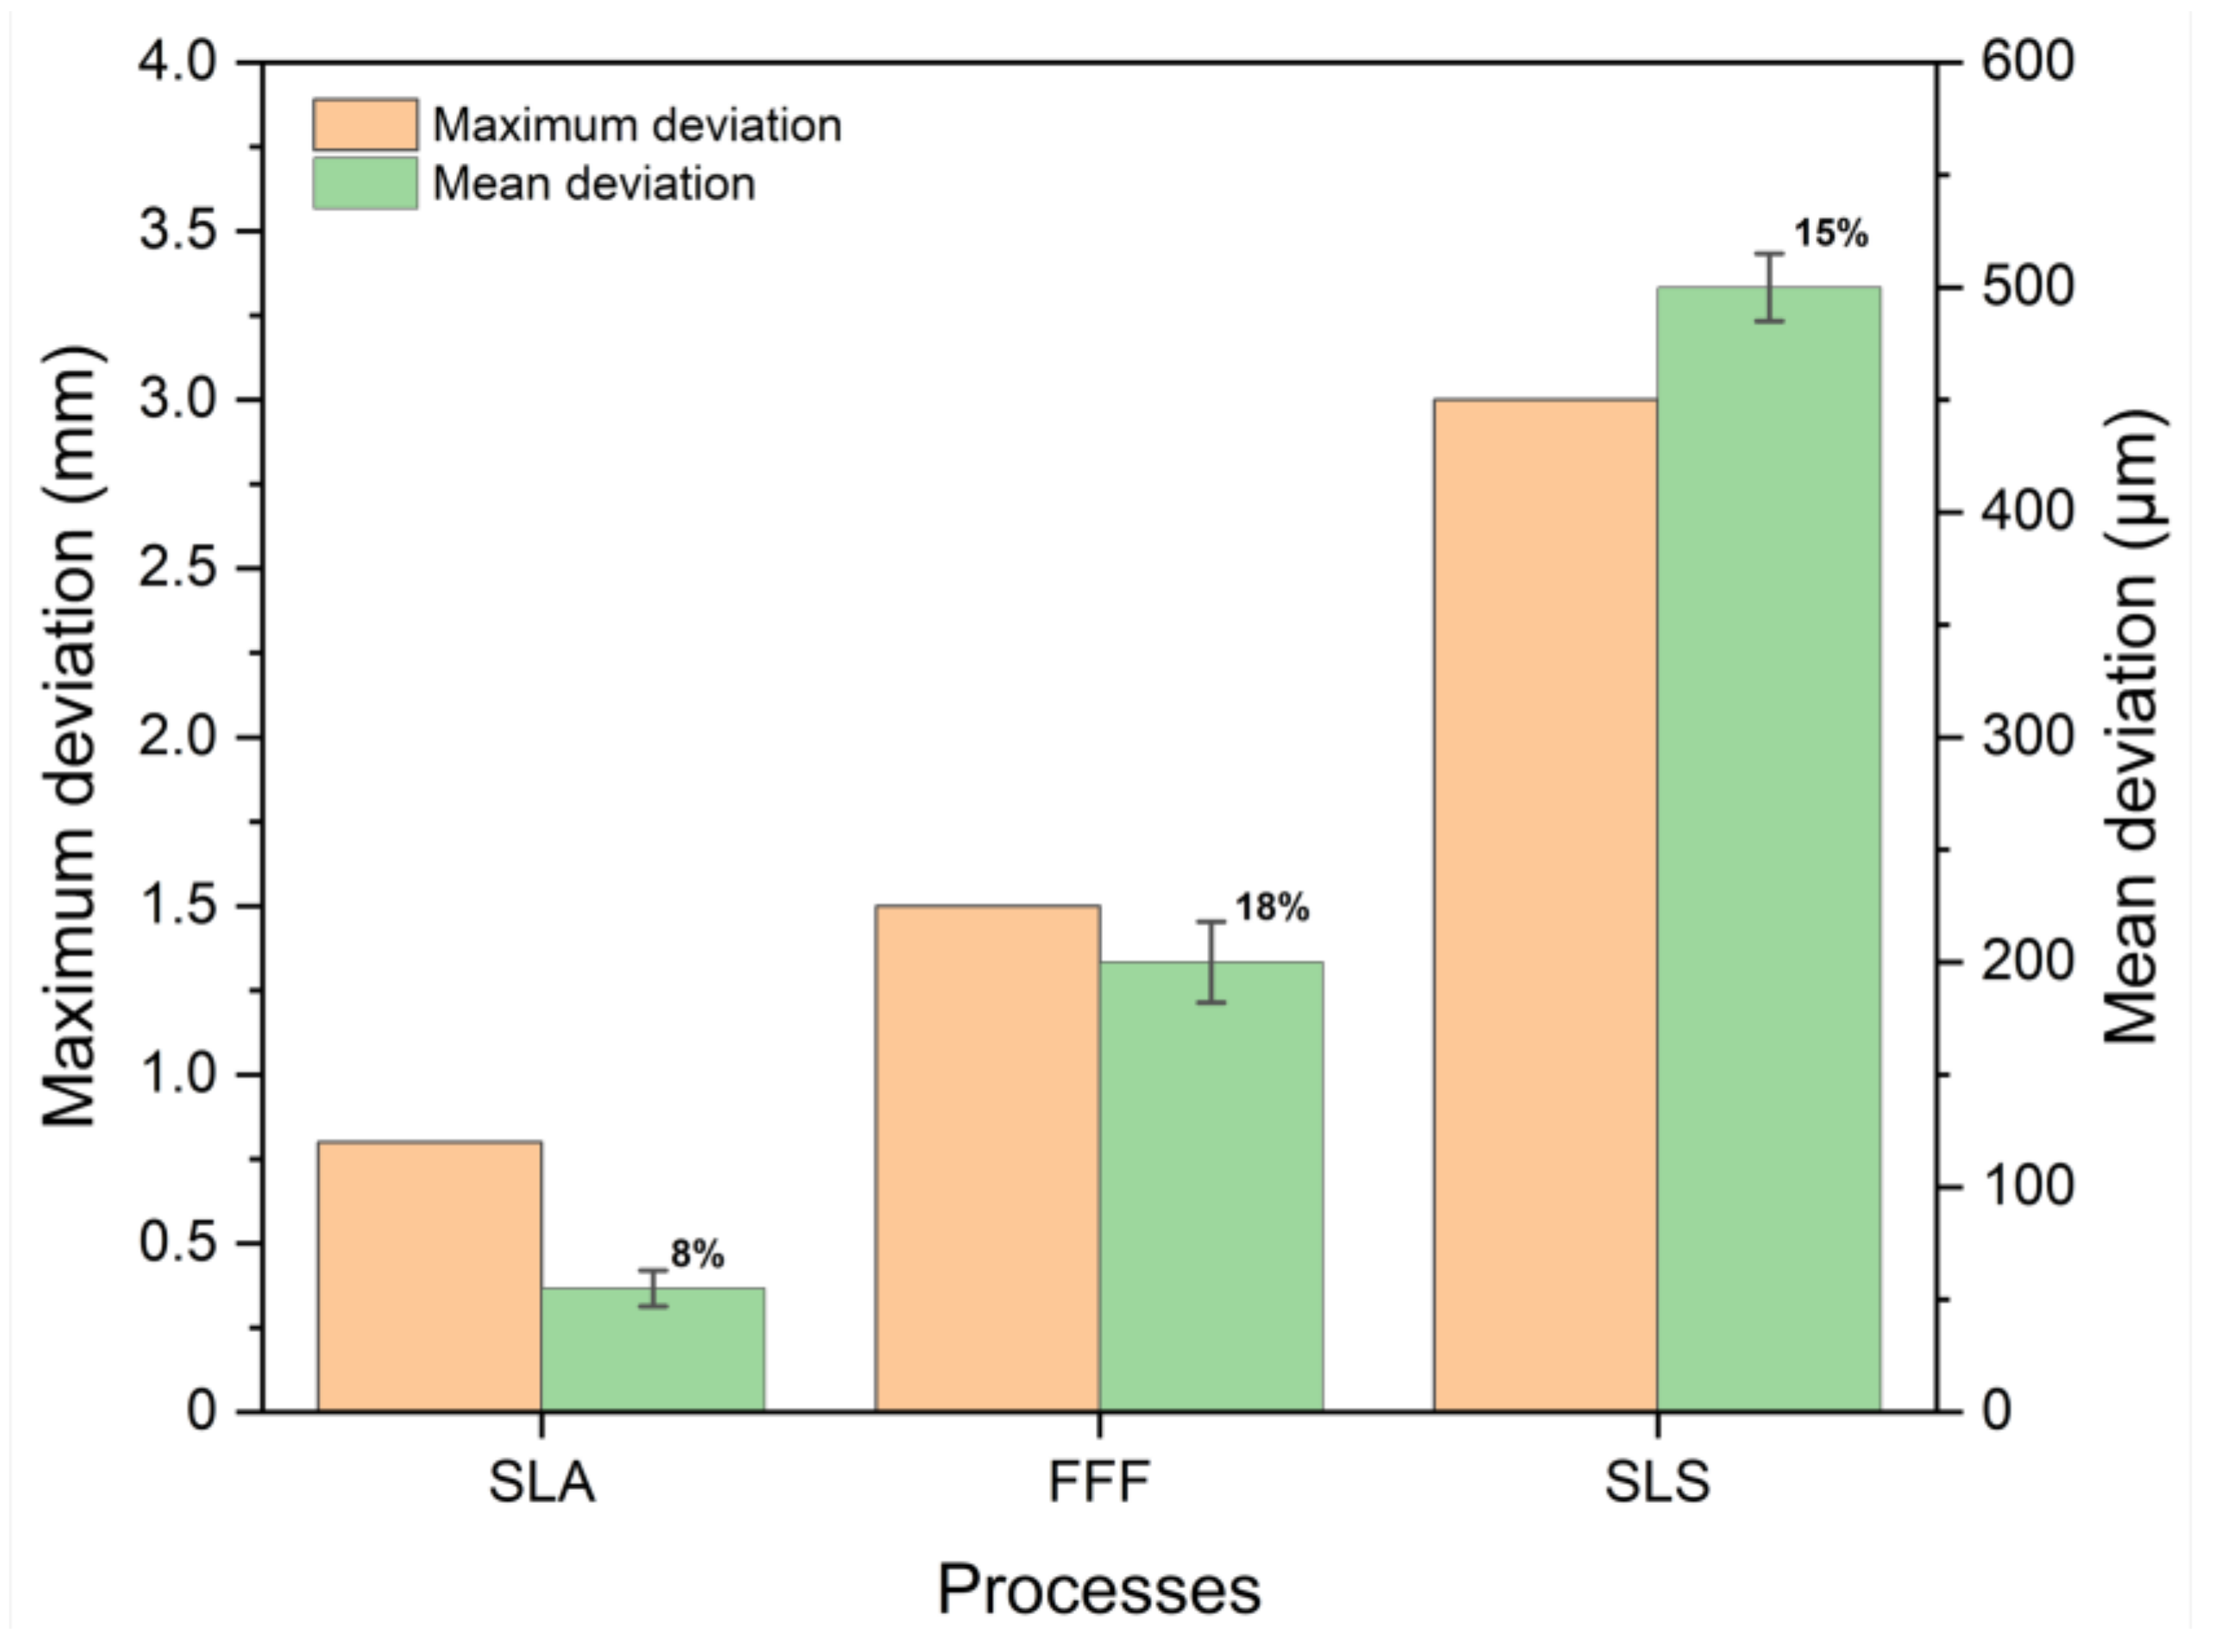
The tomographic analyses also enabled measurements to be taken to evaluate the dimensional and geometrical accuracy of the printed structures. For the dimensional analysis, the volume of each reconstructed structure after the tomographic scan is compared to the CAD model, which is used as a reference, to evaluate the dimensional deviation of both the elements (struts, nodes and plates) and the structure. This comparison was performed using the “CloudCompare” software (Open source, France), which compares two volumes. The results obtained on three samples 05 obtained with the three processes are shown in Figure 6, where the maximum and mean deviations are plotted. The value given on the bars corresponds to the standard deviation of the measured mean deviations for each configuration. We observed a small dimensional deviation of the sample printed with the SLA process compared to the CAD model. The average deviation was 55 µm both at the level of printed elements and the structure. The maximum deviation was about 0.8 mm, probably measured at the structure level (length of 10 mm) on the plates, which represents less than 10% deviation and remains acceptable. This small deviation can be explained by the good printing quality discussed above. For the FFF process, the average dimensional deviation reached 200 µm before getting worse; for the SLS process it reached 500 µm. The deviation of the dimensions of the plates, and thus of the sample, is around 3 mm for SLS, as illustrated in the images in Figure 5. This important difference is explained by the excess of powder stuck around the struts and on the plates.
Geometric accuracy analyses were conducted on the struts to verify their coherence with the CAD model, since the tomographic observations showed that the cylindricity of the struts is affected by the three processes due to stacking the layers on each other. In this case, different slices of the reconstructed volumes are compared to the CAD model used as a reference to evaluate their deviation. As we obtained a lot of 3D data, we could not present all of it and we have chosen to present some relevant examples.
The SLA process (Figure 7a) is the one that obtained the most cylindrical struts with a very negligible deviation from the CAD model, regardless of the orientation of the branches (vertical, inclined or horizontal). This fact can be explained by the precision of the equipment used, as well as the principle of the technique used, which photopolymerizes the necessary quantity of a liquid raw material and does not generate an excess of unusable material with no residual thermal effect affecting the polymerization of following layers. In the FFF process (Figure 7b), the cylindricity is not completely preserved and we obtained struts with a zigzag shape on the contour due to the superposition of the layers by the head of the nozzle. As a result, printed layers were obtained that are clearly identifiable and displaced from one another, producing an alternation of sections that have variable dimensions. This shift in the section positions may possibly be due to the nozzle positioning precision from one layer to another. The orientation of the struts influences the cylindricity. Indeed, the vertical struts are of better quality than the others. The horizontal struts are those with the worst quality, as can be seen in the image (Figure 7b) where the struts contain more defects due to the lack of support layer during the deposition of the first layer, as well as the effect of its bending.
Finally, the SLS process (Figure 7c) is the one where the cylindricity of the struts is the most affected. This poor quality is due to the high presence of porosities on the borders associated with the lack of material in some places and/or the presence of stuck powder residue. All this can be explained by the limits of the process used in relation to the accuracy expected.
Concerning the eccentricity of the struts, the tomographic analyses highlighted that the SLA process is the most respectful of this property. Indeed, the circular shape of the sections of the struts is globally respected even if there are some discontinuities and imperfections at the borders when switching from one layer to another (Figure 8a). These heterogeneities can be attributed to the laser beam alignment precision and possibly to the polymerization of the peripheral zones of the desired section. For the FFF process, the respect for the strut sections eccentricity remains acceptable, despite the presence of imperfections at the borders (Figure 8b). One should remember that a 0.2 mm diameter nozzle was used to fill the desired diameter, so the heterogeneities can be explained by the excess of material deposited at each layer and/or the precision of the alignment and trajectory of the nozzle. Finally, for the SLS process, the circular profile is highly affected firstly by the discontinuities and secondly by the powder residues and high porosity rate (Figure 8c).
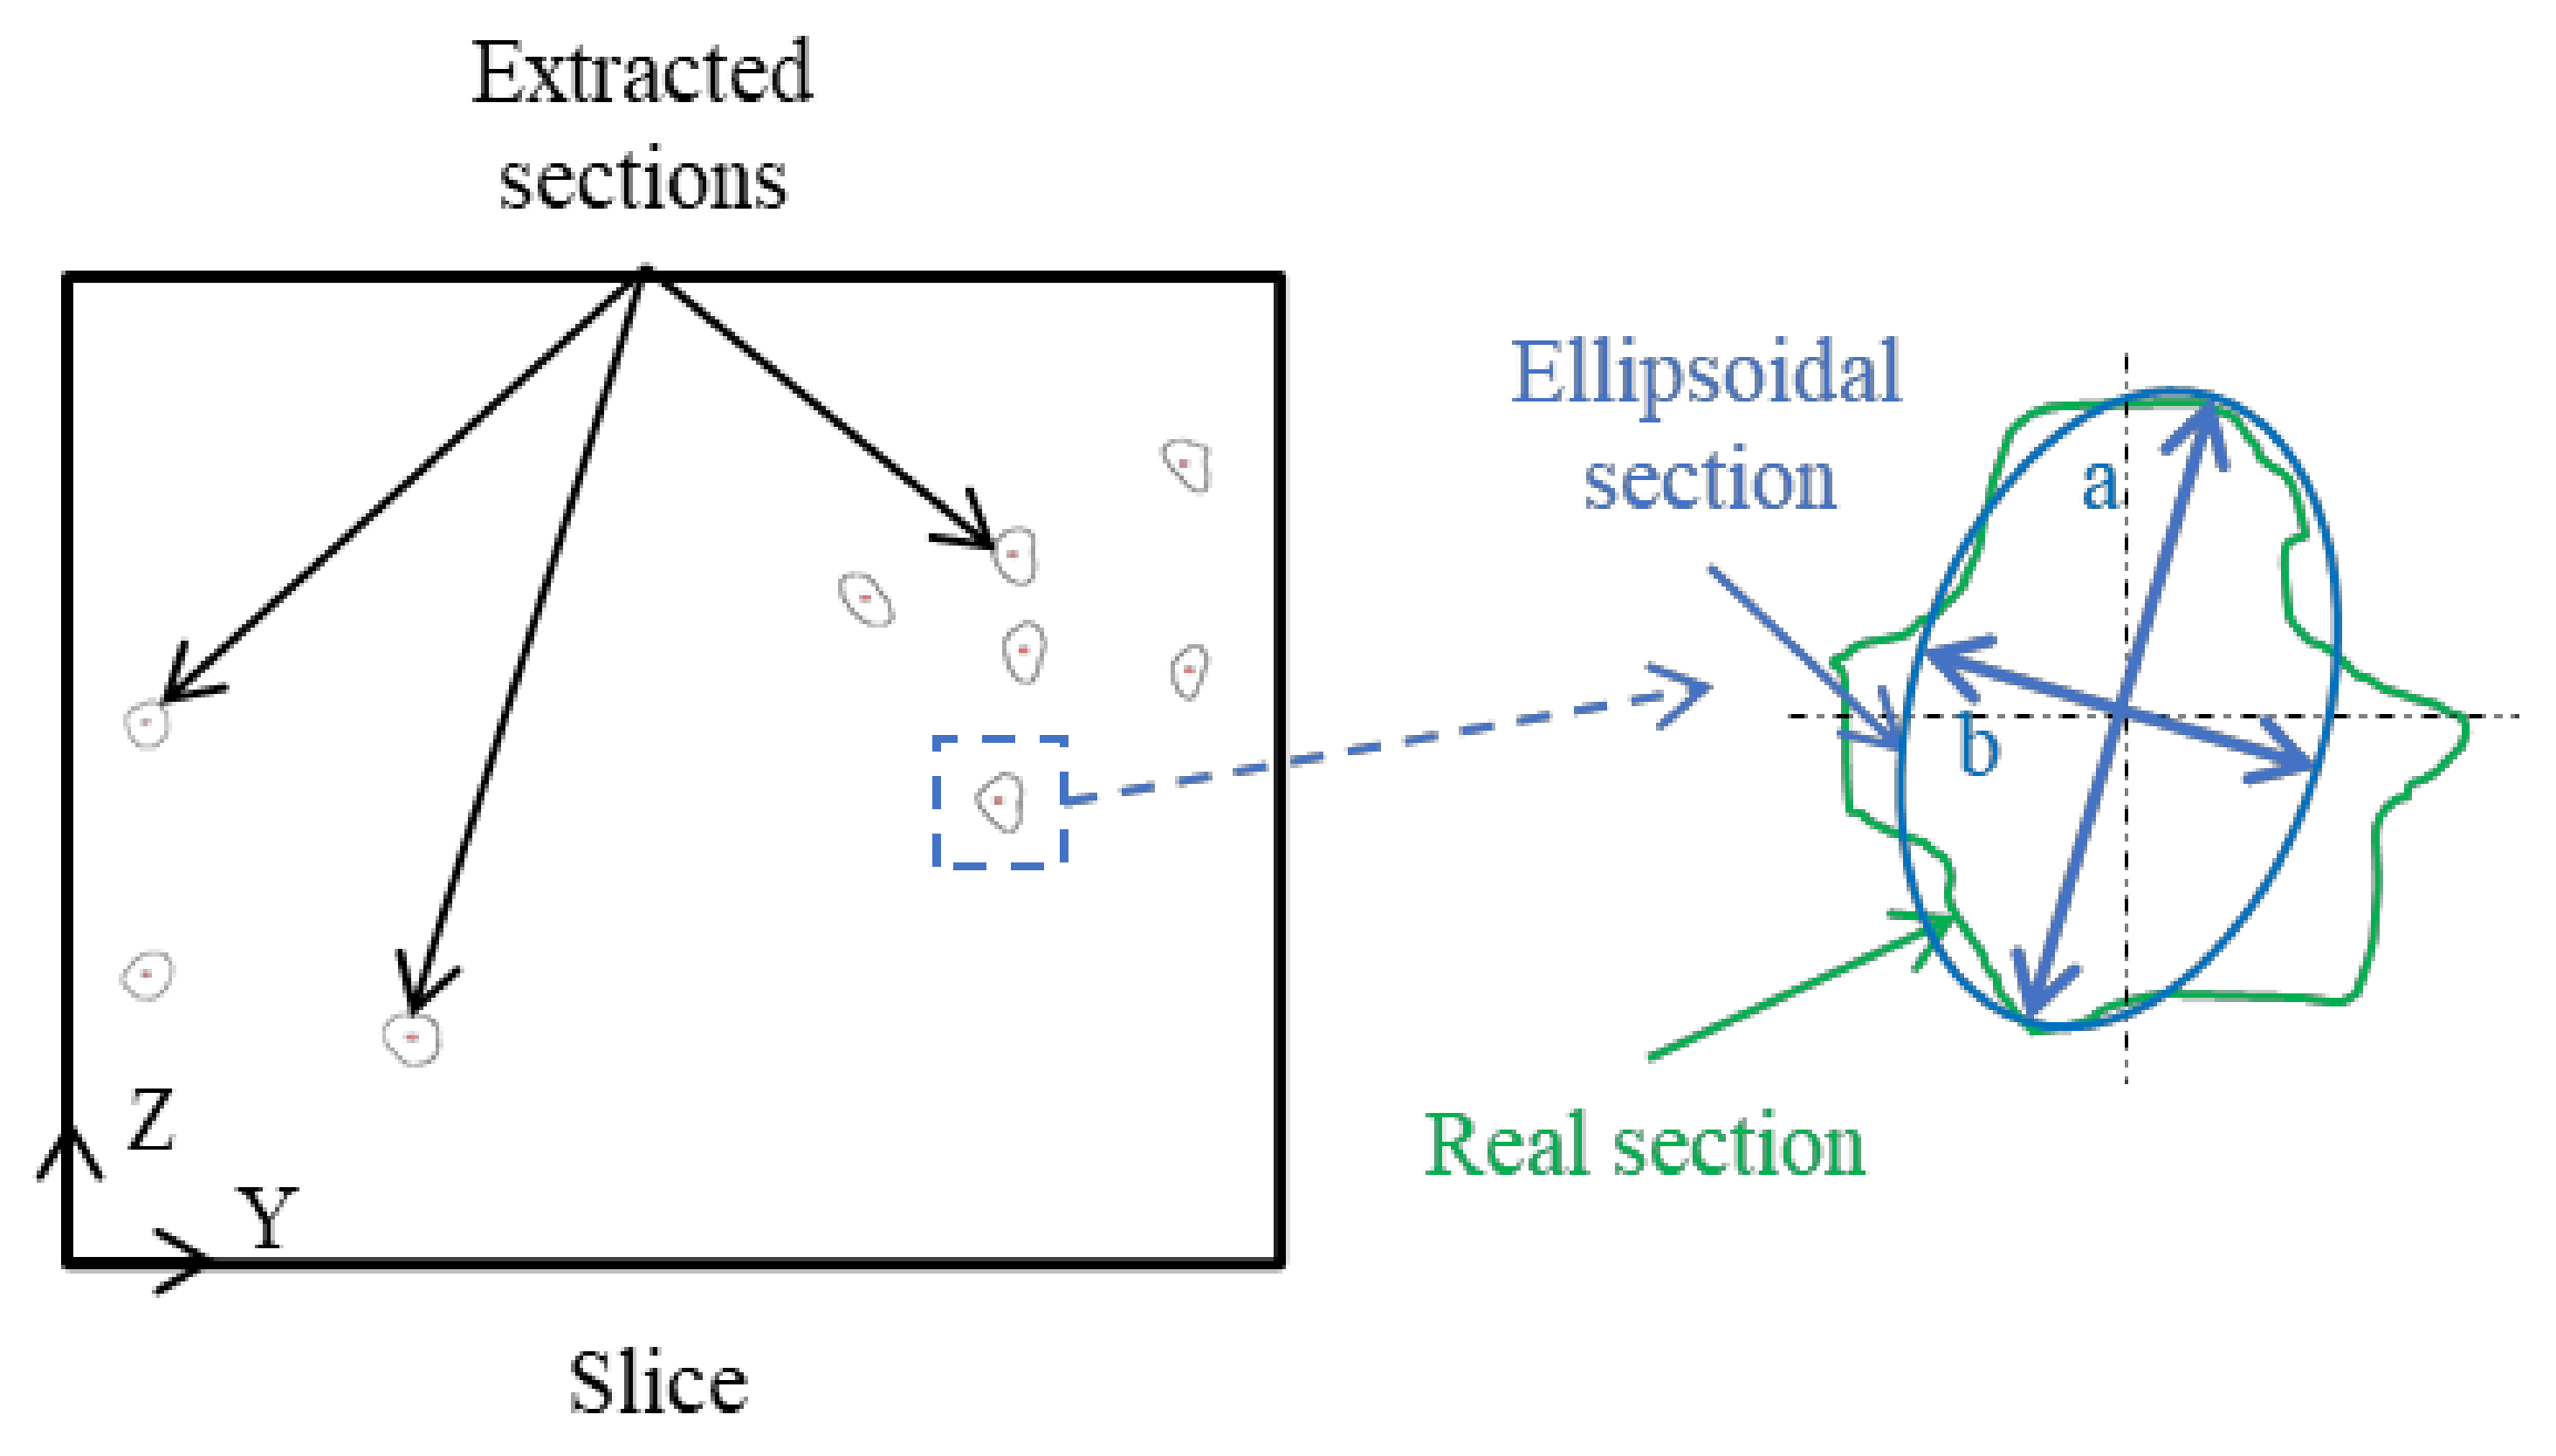
These observations and eccentricity measurements were made on one specific section of each structure. Therefore, their reproducibility is difficult to evaluate because it would require investigating all struts on their whole length. Therefore, to complete the tomographic observations, an evolution of the variation of the section of the struts of the printed architected structures was performed through statistical dimensional analysis. This approach consists of exporting the cross-sections of the struts contained in slices spaced at 0.1 mm along the three directions X, Y and Z (Figure 9).
This represents about 100 projections in each direction. Once the cross-sections were extracted, a statistical analysis was performed to evaluate their eccentricity “e” expressed in %. Since the shape of the sections is ellipsoidal, because the slice is not radial to the struts, “e” was calculated by considering the two diameters a and b according to the following expression [30], where a is the large diameter of the ellipsoidal section and b is the small diameter of the same section, as shown in Figure 9.
e = 100 × a 2 b ² a
The same approach was applied to the CAD model for which the results were used as a reference. The obtained results for the CAD model and the printed specimens along the three axes are illustrated in Figure 10. An eccentricity of 0% implies that the slice is perpendicular to the axis of the strut. The more the eccentricity increases, the more the strut is inclined along the slice concerned.
It can be observed that, in the case of the CAD model, most of the sections have an eccentricity between 0% and 50% (Figure 10) along all the axes. This implies the presence of inclined struts along the three axes, which is normal since the structure is randomly oriented. However, we observed that the density of struts with an eccentricity of 0% is important along the Z and Y axes, which indicates a strong presence of vertical struts (due to the way the architected structures are modeled).
Compared to the CAD model (Figure 10), a different statistical distribution is observed for the printed structures with the presence of struts with eccentricities higher than 50%. This means that, locally, the large diameter of the ellipsoidal section can be greater than 1.5 times the small one. The results of the SLA process and their statistical distribution are the ones that most converge with those of the reference model with the presence of a higher density of 0% eccentricity in the Z axis compared to the others.
The statistical distribution shows that the most preponderant section’s eccentricities are within the ranges of 20–60%, 40–80% and 60–90%, respectively, for the SLA, FFF and SLS processes while for the CAD model the range is comprised between 0% and 40%. The SLS has a different statistical eccentricity evolution than the other processes. This confirms the previous observations and conclusions that the SLA process is the process with the best dimensional accuracy, followed by the FFF process.
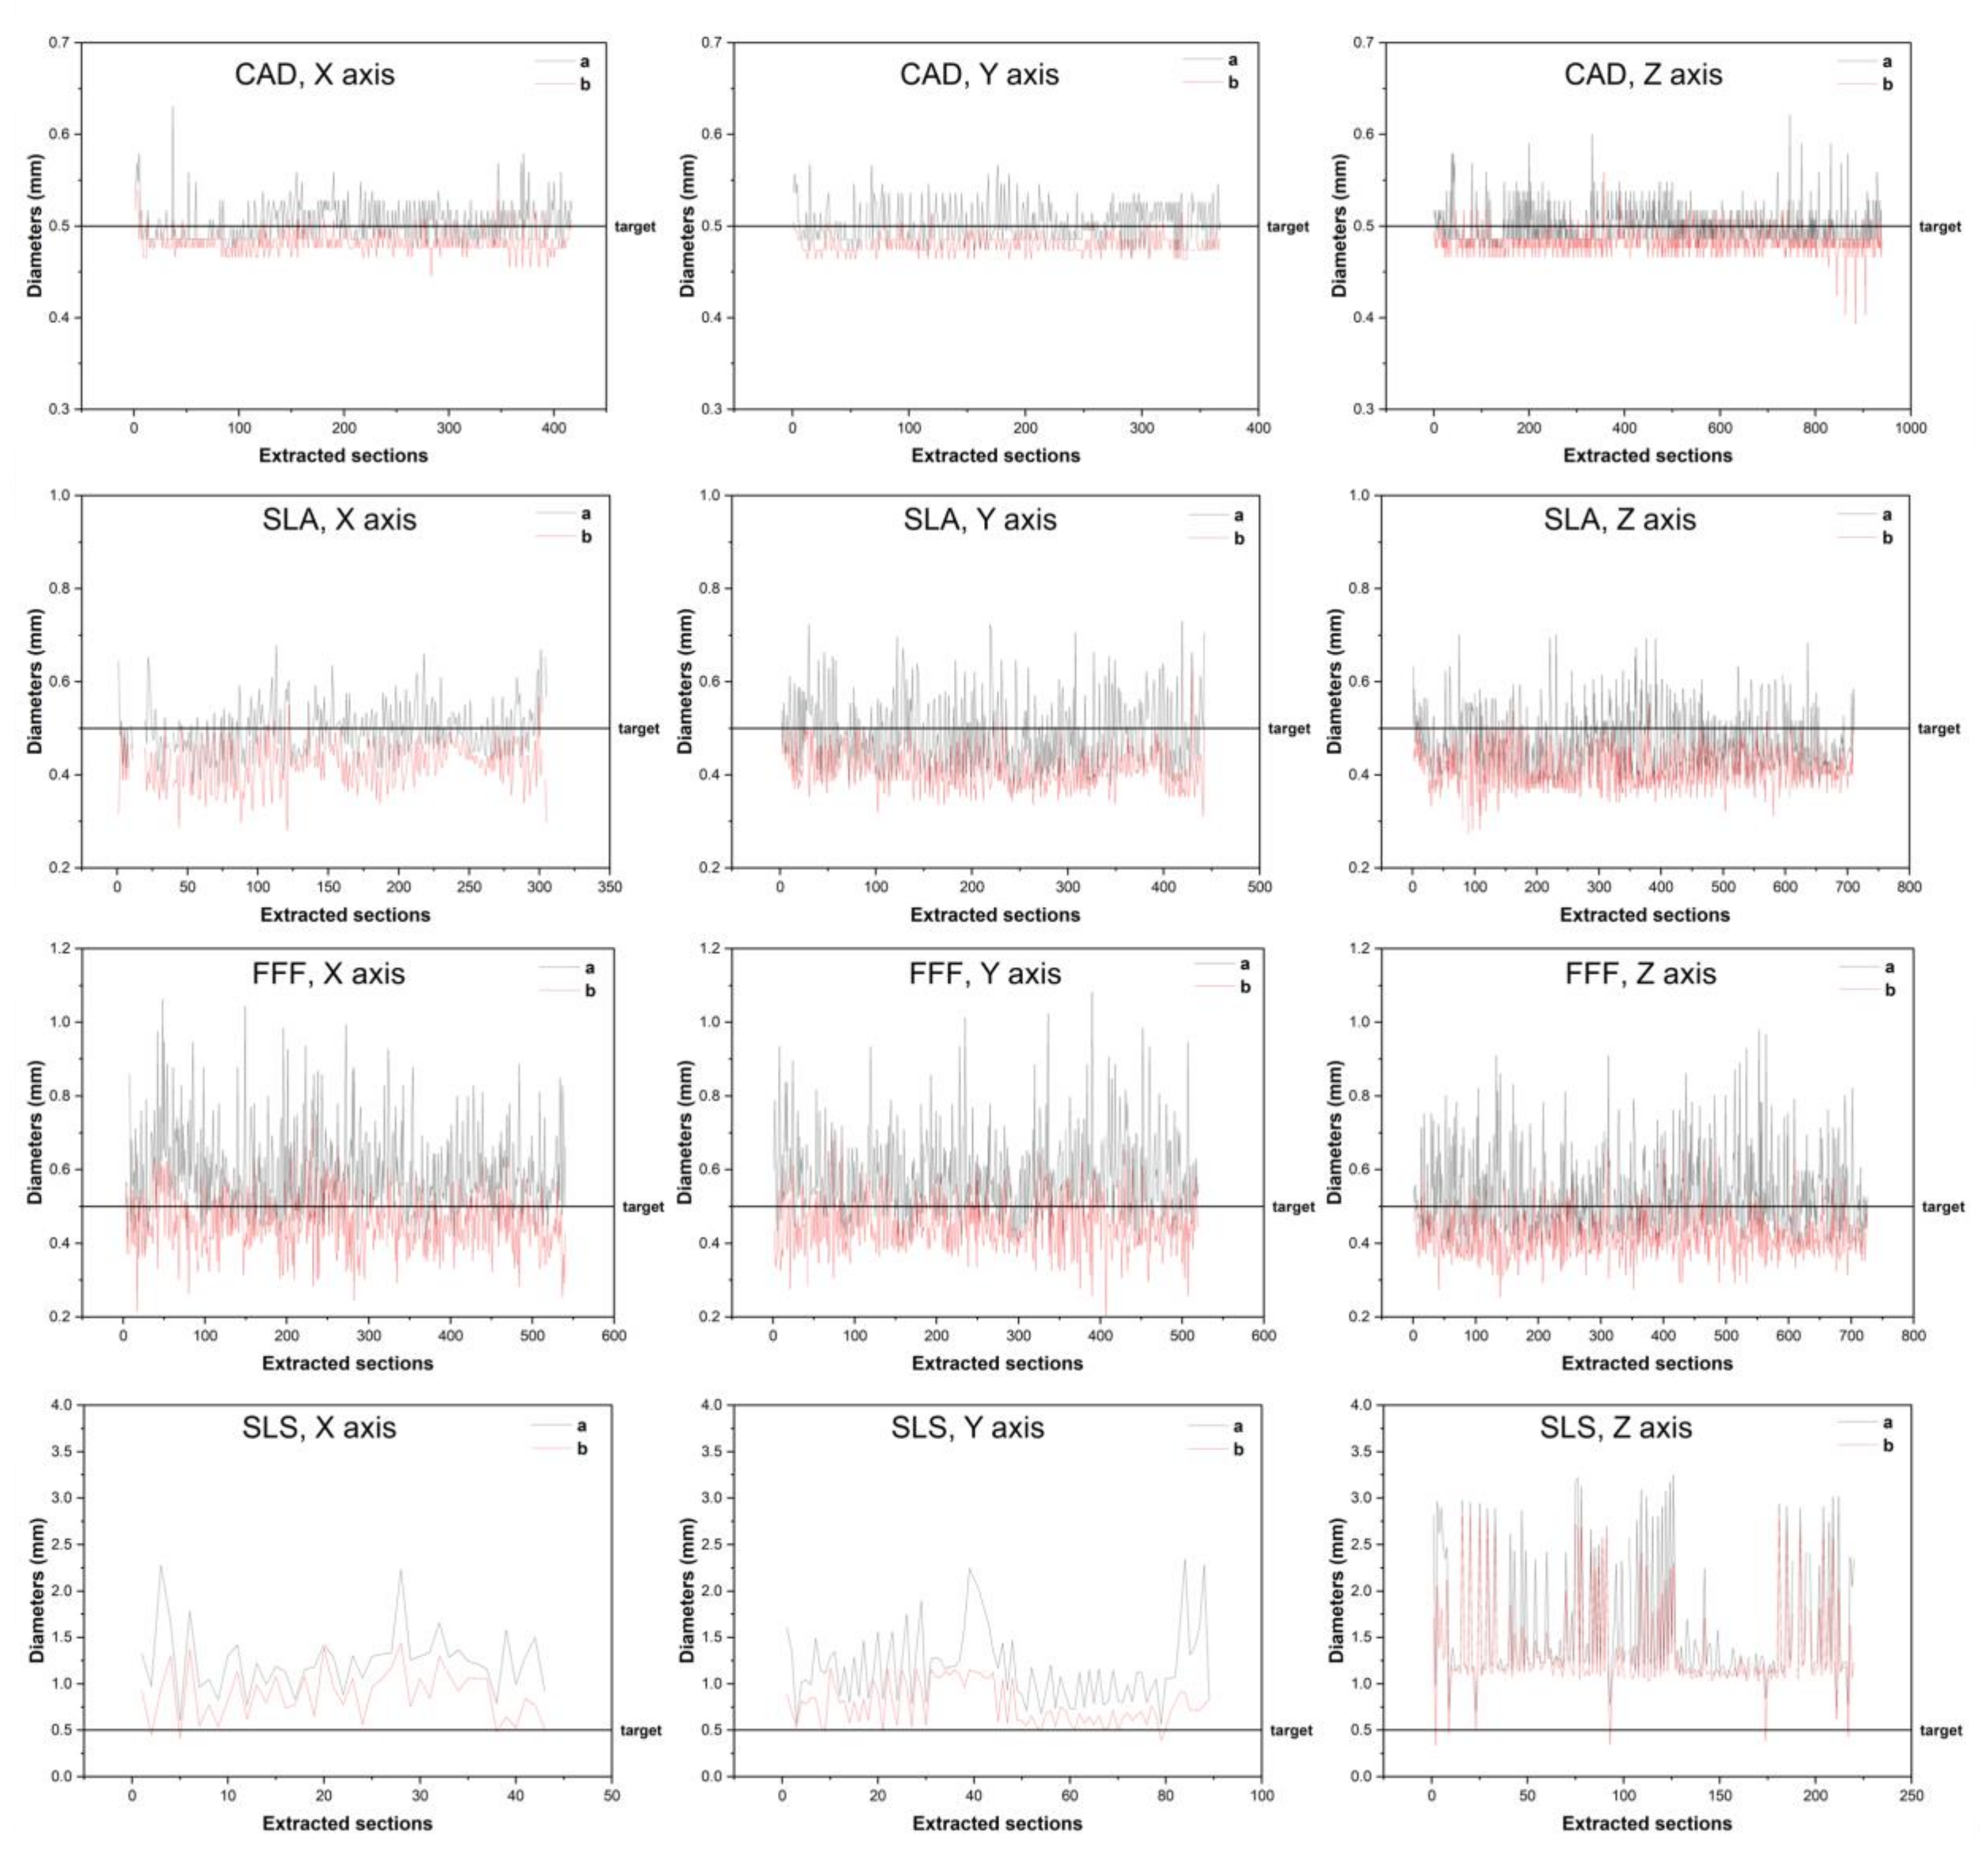
To complete this eccentricity indicator, measurements of the two diameters a and b were performed for each direction for the three processes using an algorithm under “FiJi-ImageJ” software (Open Source, Germany). To consider only the struts and to avoid as much as possible including the measurements of the nodes contained in each slice, since the measurements were made automatically, a domain was defined in advance. This domain includes all sections with diameters between 0.1 mm and 1 mm, representing struts with a diameter of about ±2 times the targeted diameter (0.5 mm) and sections whose axis was not perpendicular to the projection slice. Similarly, the range of sections to consider was defined between 0.1 mm2 and 0.2 mm2. The results obtained are illustrated in Figure 11. We observed that, in the case of the CAD model, the two parameters a and b have a rather stable average value close to the diameter of the strut (around 0.5 mm) with a maximum variation of ±20%. This implies that most of the struts are quite circular or slightly tilted relative to the slice cutting plane.
When considering the printed structures, it can be noted that the average values of the two parameters a and b deviate from the target value (0.5 mm) with significant variability, which indicates a high variation of the section due to the processes’ capability and the defects. Thus, the diameters vary between 0.3 mm and 0.7 mm for the SLA and 0.3 mm and 0.9 mm for the FFF process. For the SLA, the average diameters tend to 0.4 mm. For the SLA, we noted that a large part of the sections has an average diameter of around 0.4 mm, which implies printed sections smaller than the target, while for the SLS process the values diverge a lot from the targeted one, reaching 6 times the target diameter, which can be explained by the excess of fused powder around the struts as seen on Figure 7. So, the quality of the contour of the struts and the diameter accuracy are better for the SLA process and worse for the SLS process, which correlates well with the global and local tomographic observations.
Considering the number of strut sections identified in the defined domain, with diameters between 0.1 mm and 1 mm, one can observe that it varies between 350 and 900 sections along the three axes X, Y and Z for the CAD model. The cumulative number is around 1650 sections for the specimen. The Z direction is the one where the greatest number of sections is observed because it is in this direction where there is the highest number of vertical struts with an eccentricity close to 0% as seen before (Figure 9). For the specimens printed with the SLA process, the cumulative number of identified sections decreases moderately to 1450, representing −13%, but with a distribution along the three axes consistent with that of the model (between 300 and 700 depending on the three axes).
For the two other processes, the distribution along the three axes is no longer respected and the number of sections varies differently. Indeed, in the case of the FFF process, the cumulative number of identified sections is 1750 (an increase of 6%) which can be explained by the consideration of “angel hair” during counting. In the case of the SLS process, the number of sections drops drastically to reach 350 (between 40 and 220 along the three axes) which represents a decrease of −80% compared to the CAD model. This strongly confirms the eccentricity results discussed previously (Figure 9) and tomographic analyses which indicate that the struts are printed with sections greater than those targeted due to the fused powder around the struts.

3.3. Mass Deviations

For each configuration considered in this study, the real mass of each sample was measured and then compared to its theoretical mass, calculated based on CAD model geometry. The real mass was measured after printing the samples using a digital scale with an accuracy of 1/1000 g. The theoretical mass was calculated by multiplying the volume of the CAD model by the real density of the material concerned. The latter was measured, using the printed filled structures, by the double weighing method based on Archimedes’ principle. The choice to measure the real density of each material instead of considering the one given by the supplier’s data sheet was made to consider the potential effect of the process on the material and/or the eventual possible deviations.
The density measured for the polymerized resin used by the SLA process is 1.17 g/cm3 against a value announced by the data sheet of the order of 1.09 g/cm3. We noted that the measured density is slightly higher than the theoretical density, which can be attributed to the change of state of the material, i.e., the passage of the resin from a liquid state to a solid state. This tendency is reversed in the case of the two other processes where the densities measured for the PLA used by the FFF process and the PA12 used in SLS are, respectively, 1.09 g/cm3 and 0.98 g/cm3 after processing in comparison to 1.25 g/cm3 and 1.02 g/cm3 given by the data sheets. This slight diminution of the densities after printing can be attributed to the presence of porosity on the printed material. So, one can say that the manufacturing process has an effect, even if it is not very significant, on the densities of the materials used that were considered in this study. Consequently, the considered densities are averages integrating the effect of porosity, induced by the processes, on the printed material. After measuring the real masses of each sample and evaluating their theoretical masses, the difference between the two values was expressed in % using the following expression:
Mass   deviation = real   mass theoretical   mass theoretical   mass × 100
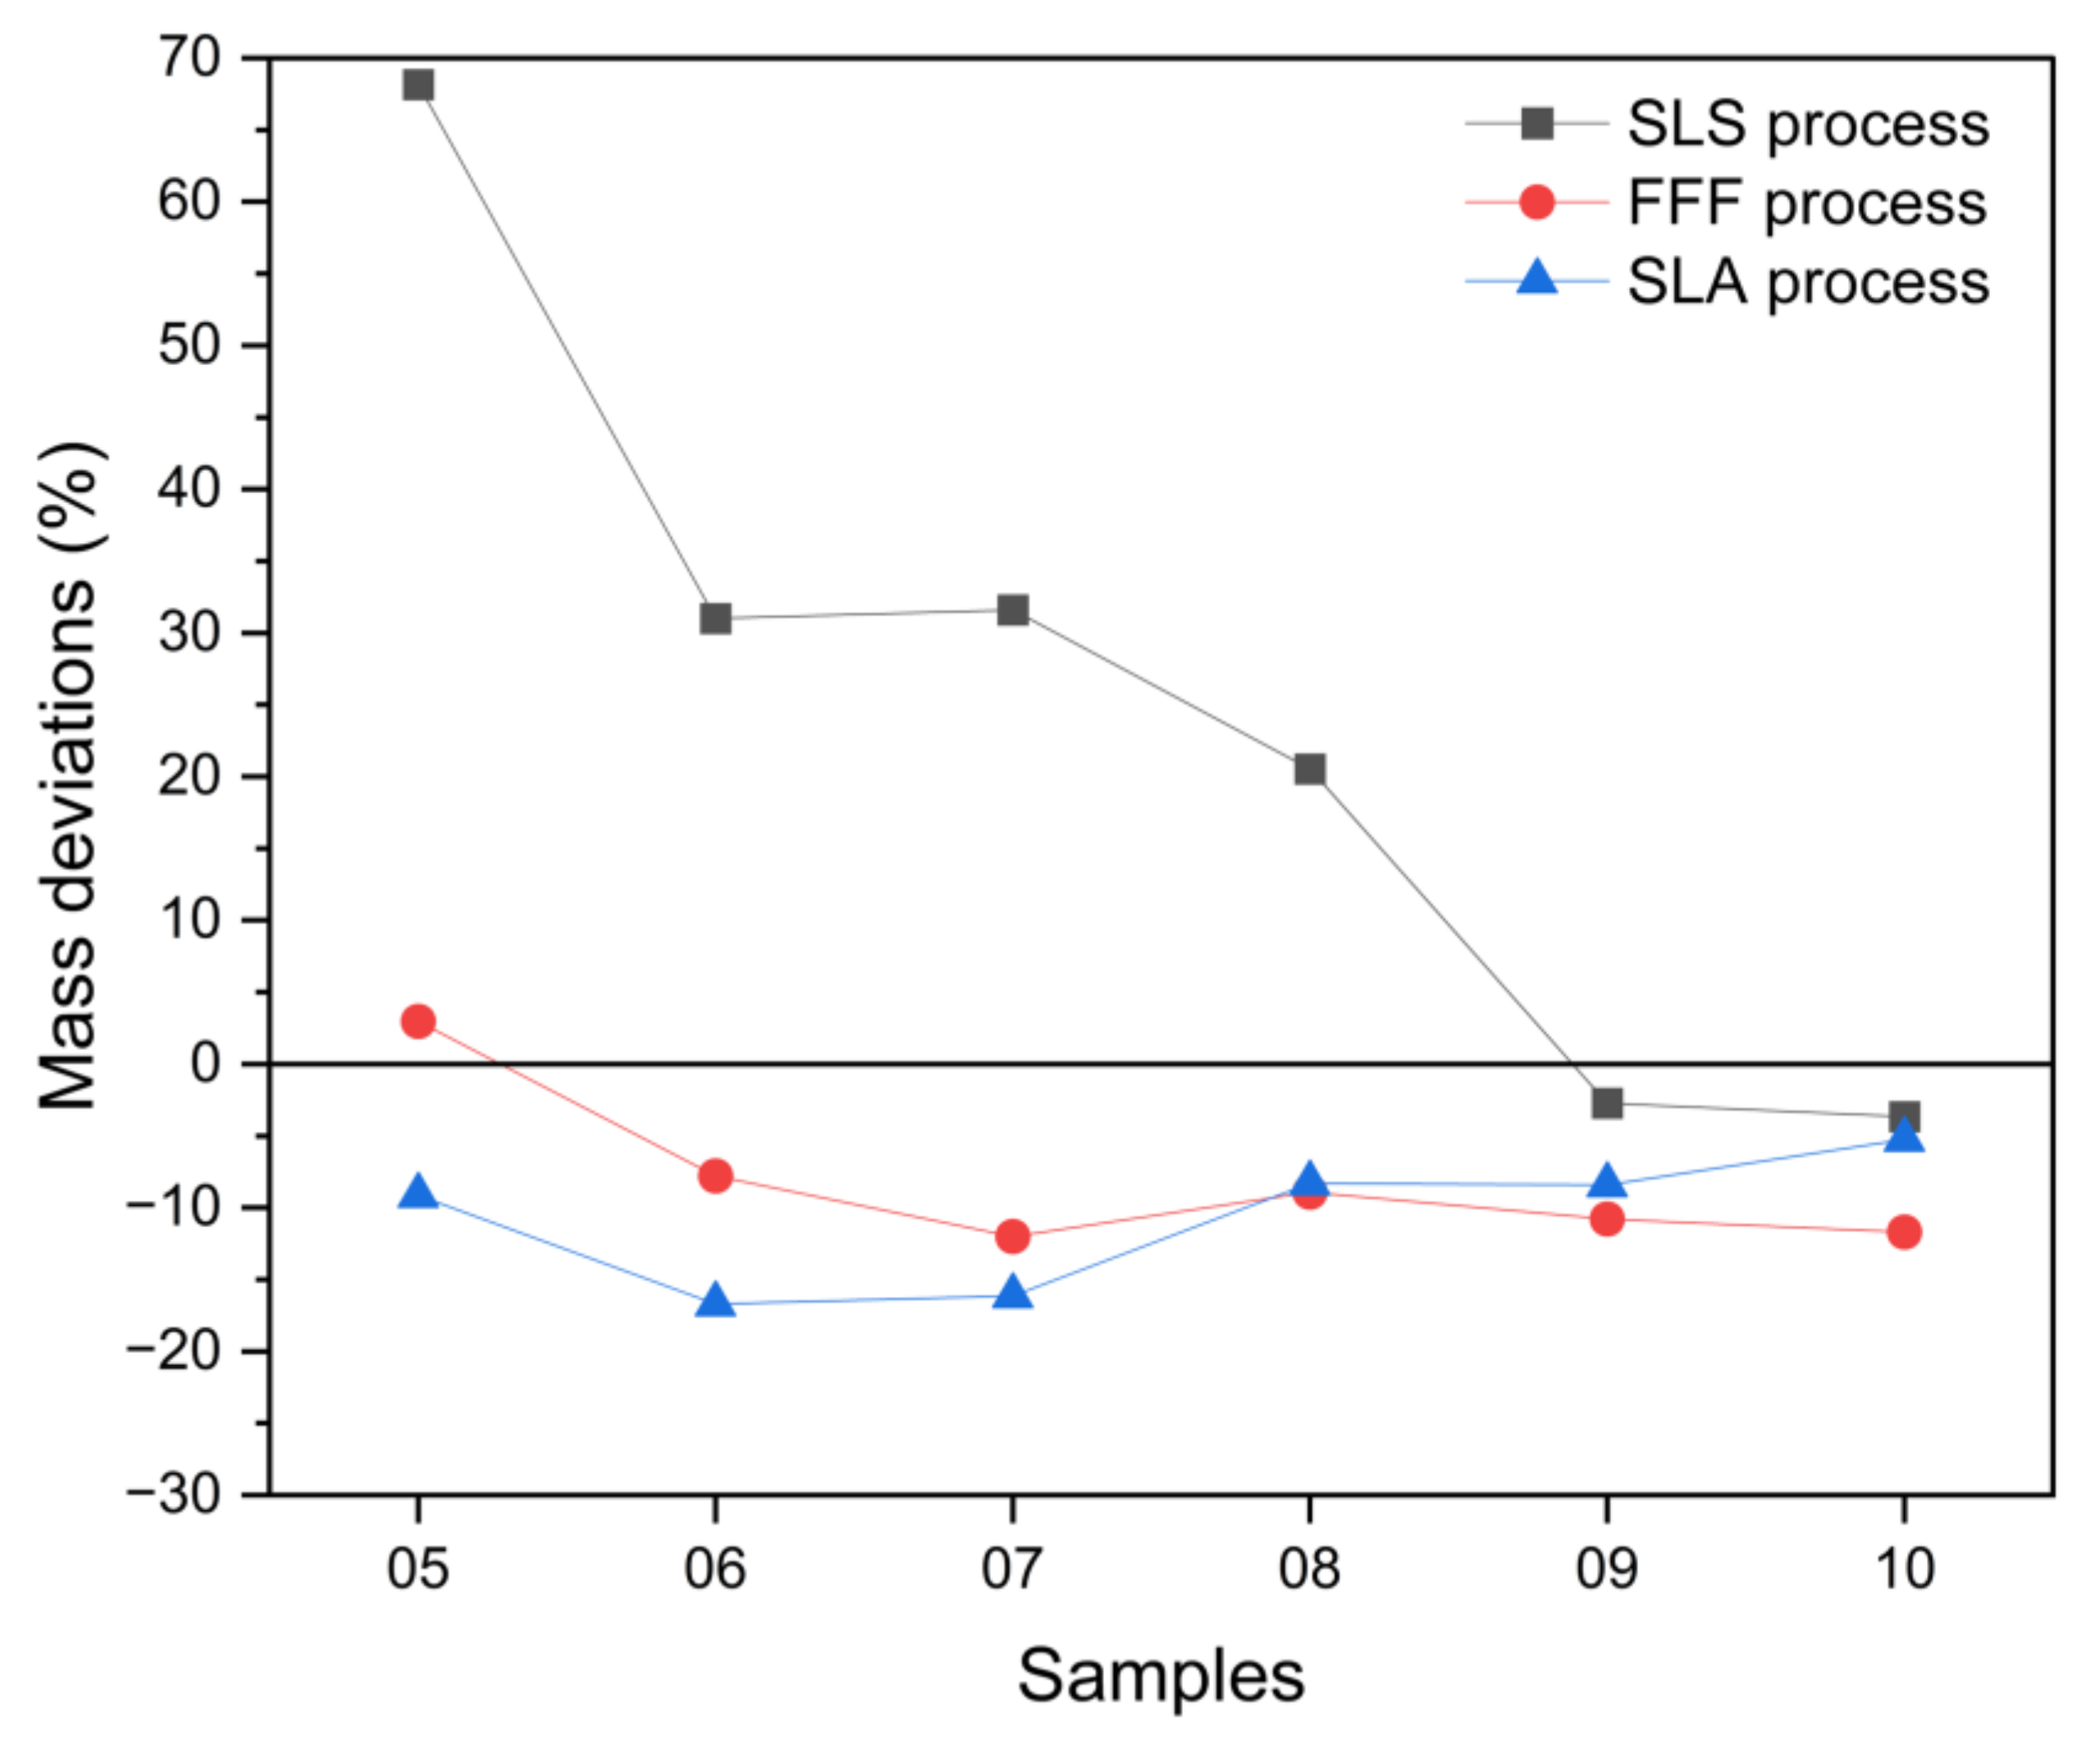
The results of the mass deviations calculated for each process, according to the different configurations of the fabricated structures, are illustrated in Figure 12.
The SLS process is the one for which the highest deviations, in addition to significant measurement variability (standard deviation of 26%), were obtained compared to the SLA and FFF processes. The mass deviations are significant for the samples from 05 to 08 with a maximum value that reaches 68% for sample 05. This can be explained by the predominant effect of the excess of powder, which remains stuck on the struts and inside the cavities despite the cleaning performed, which increases the weight to the detriment of the other parameters that tend to decrease it (porosities, unprinted struts, lack of material, etc.). This observation is correlated by Figure 5c where we can observe clumps of powder in certain zones, in addition to struts with diameters largely superior to those of the CAD model despite the fact that the targeted values (diameter between 0.5 mm and 0.8 mm for cubes from 05 to 08) are superior to the minimal width of a machine printable bead (0.1–0.15 mm). This phenomenon can be attributed to the partial melting of polymer grains around the beam application area, identified in the literature [26], but also to the trapping of the powder in the internal cavities. In addition, we also observed on the same figure the presence of other defects (porosities, unprinted struts…) whose effect was less predominant but limited the deviation of the weighting of the mass. This effect is reversed for cubes 09 and 10 where the printing quality was clearly improved, and the mass deviation drops drastically to negative values around −4%. This can be explained by the fact that the totality of powder trapped in the core of the samples, having a preponderant effect on the difference in mass, could be completely removed by the post-treatment. The fact remains that there is still some powder partially fused to the contours of the printed elements, but the effect of which is less significant and preponderant than that of present defects which tend to decrease the mass (porosities, unprinted struts, lack of material, …).
For the SLA and FFF processes, the deviations are negative and smaller and do not exceed −17%, with a maximum standard deviation of 5.6%.
The FFF process is the one for which the evolution of the mass is less important, with a deviation that remains stable, around −10%, for samples from 06 to 10. The decrease in mass generated by the previously identified defects (see Figure 5b), such as the presence of porosities and lack of printing certain patterns such as struts, is more preponderant than the increased effect generated by “angel hair” and the positive dimensional deviations of the printed geometries. It should be noted that the positive mass deviation for sample 05 (+4%) can be driven by an excess of printing material due to the process capability limit.
The observations made on the FFF process can be transposed to the SLA process, which reached a low negative deviation of around −5% for samples 09 and 10. The main origins that have driven the mass decrease in SLA samples are the time attributed to the effect of lack of printing certain patterns and especially the small strut diameter that have a significant effect for samples from 05 to 07.

4. Conclusions

The aim of this study is to characterize the manufacturing of random architected structures to observe, firstly, their fabricability and the capability of the additive manufacturing processes used such as vat photopolymerization, material extrusion and powder bed fusion. For this purpose, random structures with variable dimensions were generated with Voronoi diagrams and then several measurements and observations were made using 3D images obtained by tomography.
The results showed that all the processes enabled the proper printing of the samples with strut diameters superior to 0.5 mm with, more or less, good quality. The samples with strut diameters less than 0.5 mm were printed with several major defects and did not respect the dimensional and geometric tolerances of the CAD model. The SLA process is the one that could print structures with strut diameters smaller than 0.5 mm properly. This already gives a general idea of the limits of each process with the equipment used.
The printing quality at the macroscopic and microscopic scale is affected by various defects common to all the processes used, such as porosities and the lack and/or non-printing of struts or elements of the structure. We also found defects specific to the three processes: the trapping of unpolymerized resin for the samples obtained by SLA, printing residues for the samples obtained by FFF, and finally powder trapping inside the cavities, as well as the presence of partially polymerized powder on the strut contours, for the samples obtained by SLS. The specific defects of the SLS process have a major impact on the quality of the printed samples.
The tomographic observations and the measurements carried out made it possible to highlight, on the samples printed with the FFF and SLS processes, a strong presence of roughness on the surfaces of struts, defective geometrical and dimensional characteristics, discontinuities of the material and a significant presence of porosities specifically for the SLS process. All these defects impact the dimensional and geometrical homogeneity of the printed structures and, consequently, their functional mechanical properties. The SLA process is the one that exhibits the best printing quality and dimensional and geometrical homogeneity, which will help to preserve the properties of the structures.
In summary, regarding the capability of the processes studied, based on the various observations and indicators of comparison, we can classify the SLA process as the most suitable among the studied processes to manufacture random architected structures with small geometric dimensions. In second place is the FFF process and finally, the SLS process. This is therefore a basis for choosing a process applicable under the conditions and protocols used in this study. Other criteria, such as the quality of the post-processing, the requirements of the intended application or the material, etc., must be considered.

Author Contributions

Conceptualization, M.A., R.M. and S.A.; methodology, M.A., E.L., R.M. and S.A.; software, M.A., E.L. and V.M.; validation, S.A., R.M., and E.L.; formal analysis, M.A., R.M., E.L. and S.A.; investigation, M.A., R.M., E.L. and S.A.; resources, M.A., V.M., E.L. and S.A.; data curation, M.A.; writing—original draft preparation, M.A.; writing—review and editing, S.A.; visualization, M.A., V.M., R.M., E.L. and S.A.; supervision, R.M., E.L. and S.A.; project administration, S.A.; funding acquisition, S.A. All authors have read and agreed to the published version of the manuscript.

Funding

This research was funded by French Région Grand-Est (Grant number D201507798), the European Union (grant number D201507799) and UIMM (grant number 13-2015) within the MATUR chair.” and “The APC was funded by University of Reims Champagne Ardenne.

Conflicts of Interest

The authors declare that they do not have any known competing financial interests or personal relationships that could have appeared to influence the work reported in this paper.

References

  1. Lei, H.-Y.; Li, J.-R.; Xu, Z.-J.; Wang, Q.-H. Parametric Design of Voronoi-Based Lattice Porous Structures. Mater. Des. 2020, 191, 108607. [Google Scholar] [CrossRef]
  2. Sun, Z.P.; Guo, Y.B.; Shim, V.P.W. Characterisation and Modeling of Additively-Manufactured Polymeric Hybrid Lattice Structures for Energy Absorption. Int. J. Mech. Sci. 2021, 191, 106101. [Google Scholar] [CrossRef]
  3. Kang, J.H.; Sakthiabirami, K.; Jang, K.J.; Jang, J.G.; Oh, G.J.; Park, C.; Fisher, J.G.; Park, S.W. Mechanical and Biological Evaluation of Lattice Structured Hydroxyapatite Scaffolds Produced via Stereolithography Additive Manufacturing. Mater. Des. 2022, 214, 110372. [Google Scholar] [CrossRef]
  4. Soro, N.; Brodie, E.G.; Abdal-hay, A.; Alali, A.Q.; Kent, D.; Dargusch, M.S. Additive Manufacturing of Biomimetic Titanium-Tantalum Lattices for Biomedical Implant Applications. Mater. Des. 2022, 218, 110688. [Google Scholar] [CrossRef]
  5. Wadley, H.N.G. Multifunctional Periodic Cellular Metals. Philos. Trans. R. Soc. A Math. Phys. Eng. Sci. 2006, 364, 31–68. [Google Scholar] [CrossRef]
  6. ISO/ASTM52900-21: Additive Manufacturing—General Principles—Fundamentals and Vocabulary. Available online: https://www.astm.org/f3177-21.html (accessed on 21 June 2022).
  7. Guo, N.; Leu, M.C. Additive Manufacturing: Technology, Applications and Research Needs. Front. Mech. Eng. 2013, 8, 215–245. [Google Scholar] [CrossRef]
  8. Mahmoud, D.; Elbestawi, M.A. Lattice Structures and Functionally Graded Materials Applications in Additive Manufacturing of Orthopedic Implants: A Review. J. Manuf. Mater. Process. 2017, 1, 13. [Google Scholar] [CrossRef]
  9. Echeta, I.; Feng, X.; Dutton, B.; Leach, R.; Piano, S. Review of Defects in Lattice Structures Manufactured by Powder Bed Fusion. Int. J. Adv. Manuf. Technol. 2020, 106, 2649–2668. [Google Scholar] [CrossRef] [Green Version]
  10. Karamooz Ravari, M.R.; Kadkhodaei, M.; Badrossamay, M.; Rezaei, R. Numerical Investigation on Mechanical Properties of Cellular Lattice Structures Fabricated by Fused Deposition Modeling. Int. J. Mech. Sci. 2014, 88, 154–161. [Google Scholar] [CrossRef]
  11. Carneiro, V.H.; Rawson, S.D.; Puga, H.; Withers, P.J. Macro-, Meso- and Microstructural Characterization of Metallic Lattice Structures Manufactured by Additive Manufacturing Assisted Investment Casting. Sci. Rep. 2021, 11, 4974. [Google Scholar] [CrossRef]
  12. Dong, G.; Wijaya, G.; Tang, Y.; Zhao, Y.F. Optimizing Process Parameters of Fused Deposition Modeling by Taguchi Method for the Fabrication of Lattice Structures. Addit. Manuf. 2018, 19, 62–72. [Google Scholar] [CrossRef] [Green Version]
  13. Khan, S.Z.; Masood, S.H.; Ibrahim, E.; Ahmad, Z. Compressive Behaviour of Neovius Triply Periodic Minimal Surface Cellular Structure Manufactured by Fused Deposition Modelling. Virtual Phys. Prototyp. 2019, 14, 360–370. [Google Scholar] [CrossRef]
  14. McGregor, D.J.; Tawfick, S.; King, W.P. Automated Metrology and Geometric Analysis of Additively Manufactured Lattice Structures. Addit. Manuf. 2019, 28, 535–545. [Google Scholar] [CrossRef]
  15. Chahid, Y.; Racasan, R.; Pagani, L.; Townsend, A.; Liu, A.; Bills, P.; Blunt, L. Parametrically Designed Surface Topography on CAD Models of Additively Manufactured Lattice Structures for Improved Design Validation. Addit. Manuf. 2021, 37, 101731. [Google Scholar] [CrossRef]
  16. ISO—ISO 4287:1997/Cor 2:2002—Geometrical Product Specifications (GPS)—Surface Texture: Profile Method—Terms, Definitions and Surface Texture Parameters—Technical Corrigendum 2. Available online: https://www.iso.org/standard/41861.html (accessed on 21 June 2022).
  17. Gautam, R.; Idapalapati, S.; Feih, S. Printing and Characterisation of Kagome Lattice Structures by Fused Deposition Modelling. Mater. Des. 2018, 137, 266–275. [Google Scholar] [CrossRef]
  18. Du Plessis, A.; Kouprianoff, D.-P.; Yadroitsava, I.; Yadroitsev, I. Mechanical Properties and In Situ Deformation Imaging of Microlattices Manufactured by Laser Based Powder Bed Fusion. Materials 2018, 11, 1663. [Google Scholar] [CrossRef] [Green Version]
  19. Maskery, I.; Aboulkhair, N.T.; Aremu, A.O.; Tuck, C.J.; Ashcroft, I.A.; Wildman, R.D.; Hague, R.J.M. A Mechanical Property Evaluation of Graded Density Al-Si10-Mg Lattice Structures Manufactured by Selective Laser Melting. Mater. Sci. Eng. A 2016, 670, 264–274. [Google Scholar] [CrossRef] [Green Version]
  20. Mohamed, O.A.; Masood, S.H.; Bhowmik, J.L. Optimization of Fused Deposition Modeling Process Parameters: A Review of Current Research and Future Prospects. Adv. Manuf. 2015, 3, 42–53. [Google Scholar] [CrossRef]
  21. Noronha, J.; Leary, M.; Qian, M.; Kyriakou, E.; Brandt, M. Geometrical Parameters and Mechanical Properties of Ti6Al4V Hollow-Walled Lattices. Mater. Sci. Eng. A 2022, 840, 142667. [Google Scholar] [CrossRef]
  22. Baruchel, J.; Buffière, J.-Y.; Maire, E. X-ray Tomography in Material Science; Hermes Science Publications: Paris, France, 2000; p. 204. [Google Scholar]
  23. Qi, D.; Hu, W.; Xin, K.; Zeng, Q.; Xi, L.; Tao, R.; Liao, H.; Deng, Y.; Liao, B.; Wu, W. In-Situ Synchrotron X-Ray Tomography Investigation of Micro Lattice Manufactured with the Projection Micro-Stereolithography (PμSL) 3D Printing Technique: Defects Characterization and in-Situ Shear Test. Compos. Struct. 2020, 252, 112710. [Google Scholar] [CrossRef]
  24. Silva, R.G.; Torres, M.J.; Viñuela, J.Z.; Zamora, A.G. Manufacturing and Characterization of 3D Miniature Polymer Lattice Structures Using Fused Filament Fabrication. Polymers 2021, 13, 635. [Google Scholar] [CrossRef] [PubMed]
  25. Gungor, O.U.; Gorguluarslan, R.M. Experimental Characterization of Spatial Variability for Random Field Modeling on Struts of Additively Manufactured Lattice Structures. Addit. Manuf. 2020, 36, 101471. [Google Scholar] [CrossRef]
  26. Abele, E.; Stoffregen, H.A.; Klimkeit, K.; Hoche, H.; Oechsner, M. Optimisation of Process Parameters for Lattice Structures. Rapid Prototyp. J. 2015, 21, 117–127. [Google Scholar] [CrossRef]
  27. Parthasarathy, J.; Starly, B.; Raman, S.; Christensen, A. Mechanical Evaluation of Porous Titanium (Ti6Al4V) Structures with Electron Beam Melting (EBM). J. Mech. Behav. Biomed. Mater. 2010, 3, 249–259. [Google Scholar] [CrossRef]
  28. Soul, H.; Terriault, P.; Brailovski, V. The Static and Fatigue Behavior of AlSiMg Alloy Plain, Notched, and Diamond Lattice Specimens Fabricated by Laser Powder Bed Fusion. J. Manuf. Mater. Process. 2018, 2, 25. [Google Scholar] [CrossRef] [Green Version]
  29. Kladovasilakis, N.; Charalampous, P.; Tsongas, K.; Kostavelis, I.; Tzetzis, D.; Tzovaras, D. Experimental and Computational Investigation of Lattice Sandwich Structures Constructed by Additive Manufacturing Technologies. J. Manuf. Mater. Process. 2021, 5, 95. [Google Scholar] [CrossRef]
  30. Dallago, M.; Winiarski, B.; Zanini, F.; Carmignato, S.; Benedetti, M. On the Effect of Geometrical Imperfections and Defects on the Fatigue Strength of Cellular Lattice Structures Additively Manufactured via Selective Laser Melting. Int. J. Fatigue 2019, 124, 348–360. [Google Scholar] [CrossRef]
Figure 1. Steps for the architected structure generation: (a) basic pattern, (b) architected structure, (c) addition of plates on the top and bottom faces.
Jmmp 06 00073 g001
Figure 2. Orientation and supports needed for the SLA process.
Jmmp 06 00073 g002
Figure 3. Defects in samples with strut diameters lower than 0.5 mm.
Jmmp 06 00073 g003
Figure 4. X-ray tomography principle.
Jmmp 06 00073 g004
Figure 5. Tomography observations of the quality of samples from 05 to 10.
Jmmp 06 00073 g005
Figure 6. Dimensional deviations of the printed sample 05 from the CAD model.
Jmmp 06 00073 g006
Figure 7. Strut cylindricity of sample 05 for the three processes.
Jmmp 06 00073 g007
Figure 8. Examples of sample 05 strut sections (a) SLA, (b) FFF, (c) SLS.
Jmmp 06 00073 g008
Figure 9. Principle of the statistical analysis of the eccentricity of cross-sections.
Jmmp 06 00073 g009
Figure 10. Eccentricity “e” of the cross-sections, sample 05 for CAD model and the three processes.
Jmmp 06 00073 g010
Figure 11. Representation of the diameters a and b, sample 05 for CAD model and the three processes.
Jmmp 06 00073 g011
Figure 12. Mass deviations of the samples obtained with the three processes.
Jmmp 06 00073 g012
Table 1. Geometric parameters of the different structures.
SamplesDimensions (mm)
Pattern Size Struts Plates
0120.10.5
0220.2
0340.3
0440.4
0540.5
06100.60.6
07100.70.7
08100.80.8
09100.90.9
101011
filled structure10 × 10 × 10
Table 2. Processes, equipment and materials selected.
ProcessesSLAFFFSLS
EquipmentFormlabs 2Raise N2Lisa Pro
MaterialsStandard liquid resinFilament PLA standardPowder PA12
Table 3. FFF process parameters.
ParametersValues
Nozzle diameter [mm]Ø 0.2
Layer height [mm]0.1
Print speed [mm/s]50
Print flowrate [%]100
Temperatures [°C]T° Nozzle 215, T° Bed 60
Publisher’s Note: MDPI stays neutral with regard to jurisdictional claims in published maps and institutional affiliations.

