Article

Numerical Simulation of the Thermo-Mechanical Behavior of 6061 Aluminum Alloy during Friction-Stir Welding

1
Institute of Machinery, Materials, and Transport, Peter the Great St. Petersburg Polytechnic University, 195251 St. Petersburg, Russia
2
Laboratory of Mechanical Properties of Nanostructural Materials and Superalloys, Belgorod National Research University, 308015 Belgorod, Russia
*
Author to whom correspondence should be addressed.
J. Manuf. Mater. Process. 2022, 6(4), 68; https://doi.org/10.3390/jmmp6040068
Submission received: 31 May 2022 / Revised: 14 June 2022 / Accepted: 22 June 2022 / Published: 24 June 2022
(This article belongs to the Special Issue Advances in Friction Stir Welding in the Light of Industry 4.0)

Abstract

:
In this work, a finite-element model was elaborated to simulate the thermomechanical behavior of 6061 aluminum alloy during friction-stir welding (FSW). It was shown that FSW-induced deformation is a two-stage process. In addition to the stirring action exerted by the rotating tool probe, the material in the near-surface area of the stir zone also experienced a secondary deformation by the shoulder edge after passage of the welding tool. Both deformation steps were found to be comparable in terms of temperature and strain, but the secondary deformation was primarily concentrated in the near-surface layer. The effects of tool rotation and translation rates on FSW temperature and strain were also systematically examined. Depending on particular welding conditions, the peak welding temperature was predicted to vary from 360 to 500 °C, while the cumulative effective strain was from 12 to 45.

1. Introduction

1.1. Broad Aspects of Numerical Simulation of Friction-Stir Welding

Friction-stir welding is an innovative solid-state joining technology [1]. It enables the sound welding of aluminum alloys with a significant industrial impact. Remarkably, the welded material undergoes very large strains at elevated temperatures and high strain rates. As material behavior at such extreme deformation conditions is not studied well, FSW is also of essential academic interest.
Technically, FSW is a relatively simple process, but it involves complex physical phenomena. Most of these are difficult to study experimentally, and therefore numerical simulations are widely employed in this area. Typically, finite element modelling (FEM) is used for this purpose. In this approach, a modeling object is discretized into elementary elements (“mesh”), with each element representing a set of algebraic equations describing the simulated phenomenon, and then all sets are recombined into a global system for a final calculation.
To avoid the problem of excessive mesh distortion, which is typical for the simulation of FSW, the so-called arbitrary Lagrangian–Eulerian (ALE) or coupled Eulerian–Lagrangian (CEL) modelling techniques are often used. The former method allows the mesh inside a domain to be stable and to move arbitrarily, i.e., the mesh topology remains unchanged. In fact, the ALE technique involves a system re-meshing after each time increment [2]. On the other hand, the CEL method combines Lagrangian and Eulerian approaches, i.e., a welding tool is considered as a rigid Langrangian body, whereas a workpiece is simulated employing Eulerian formulation; the interaction between the two is modelled by contact definition [3].
So far, most efforts in the simulation of FSW have been focused on aluminum alloys. Several important results are briefly outlined in the following two sections.

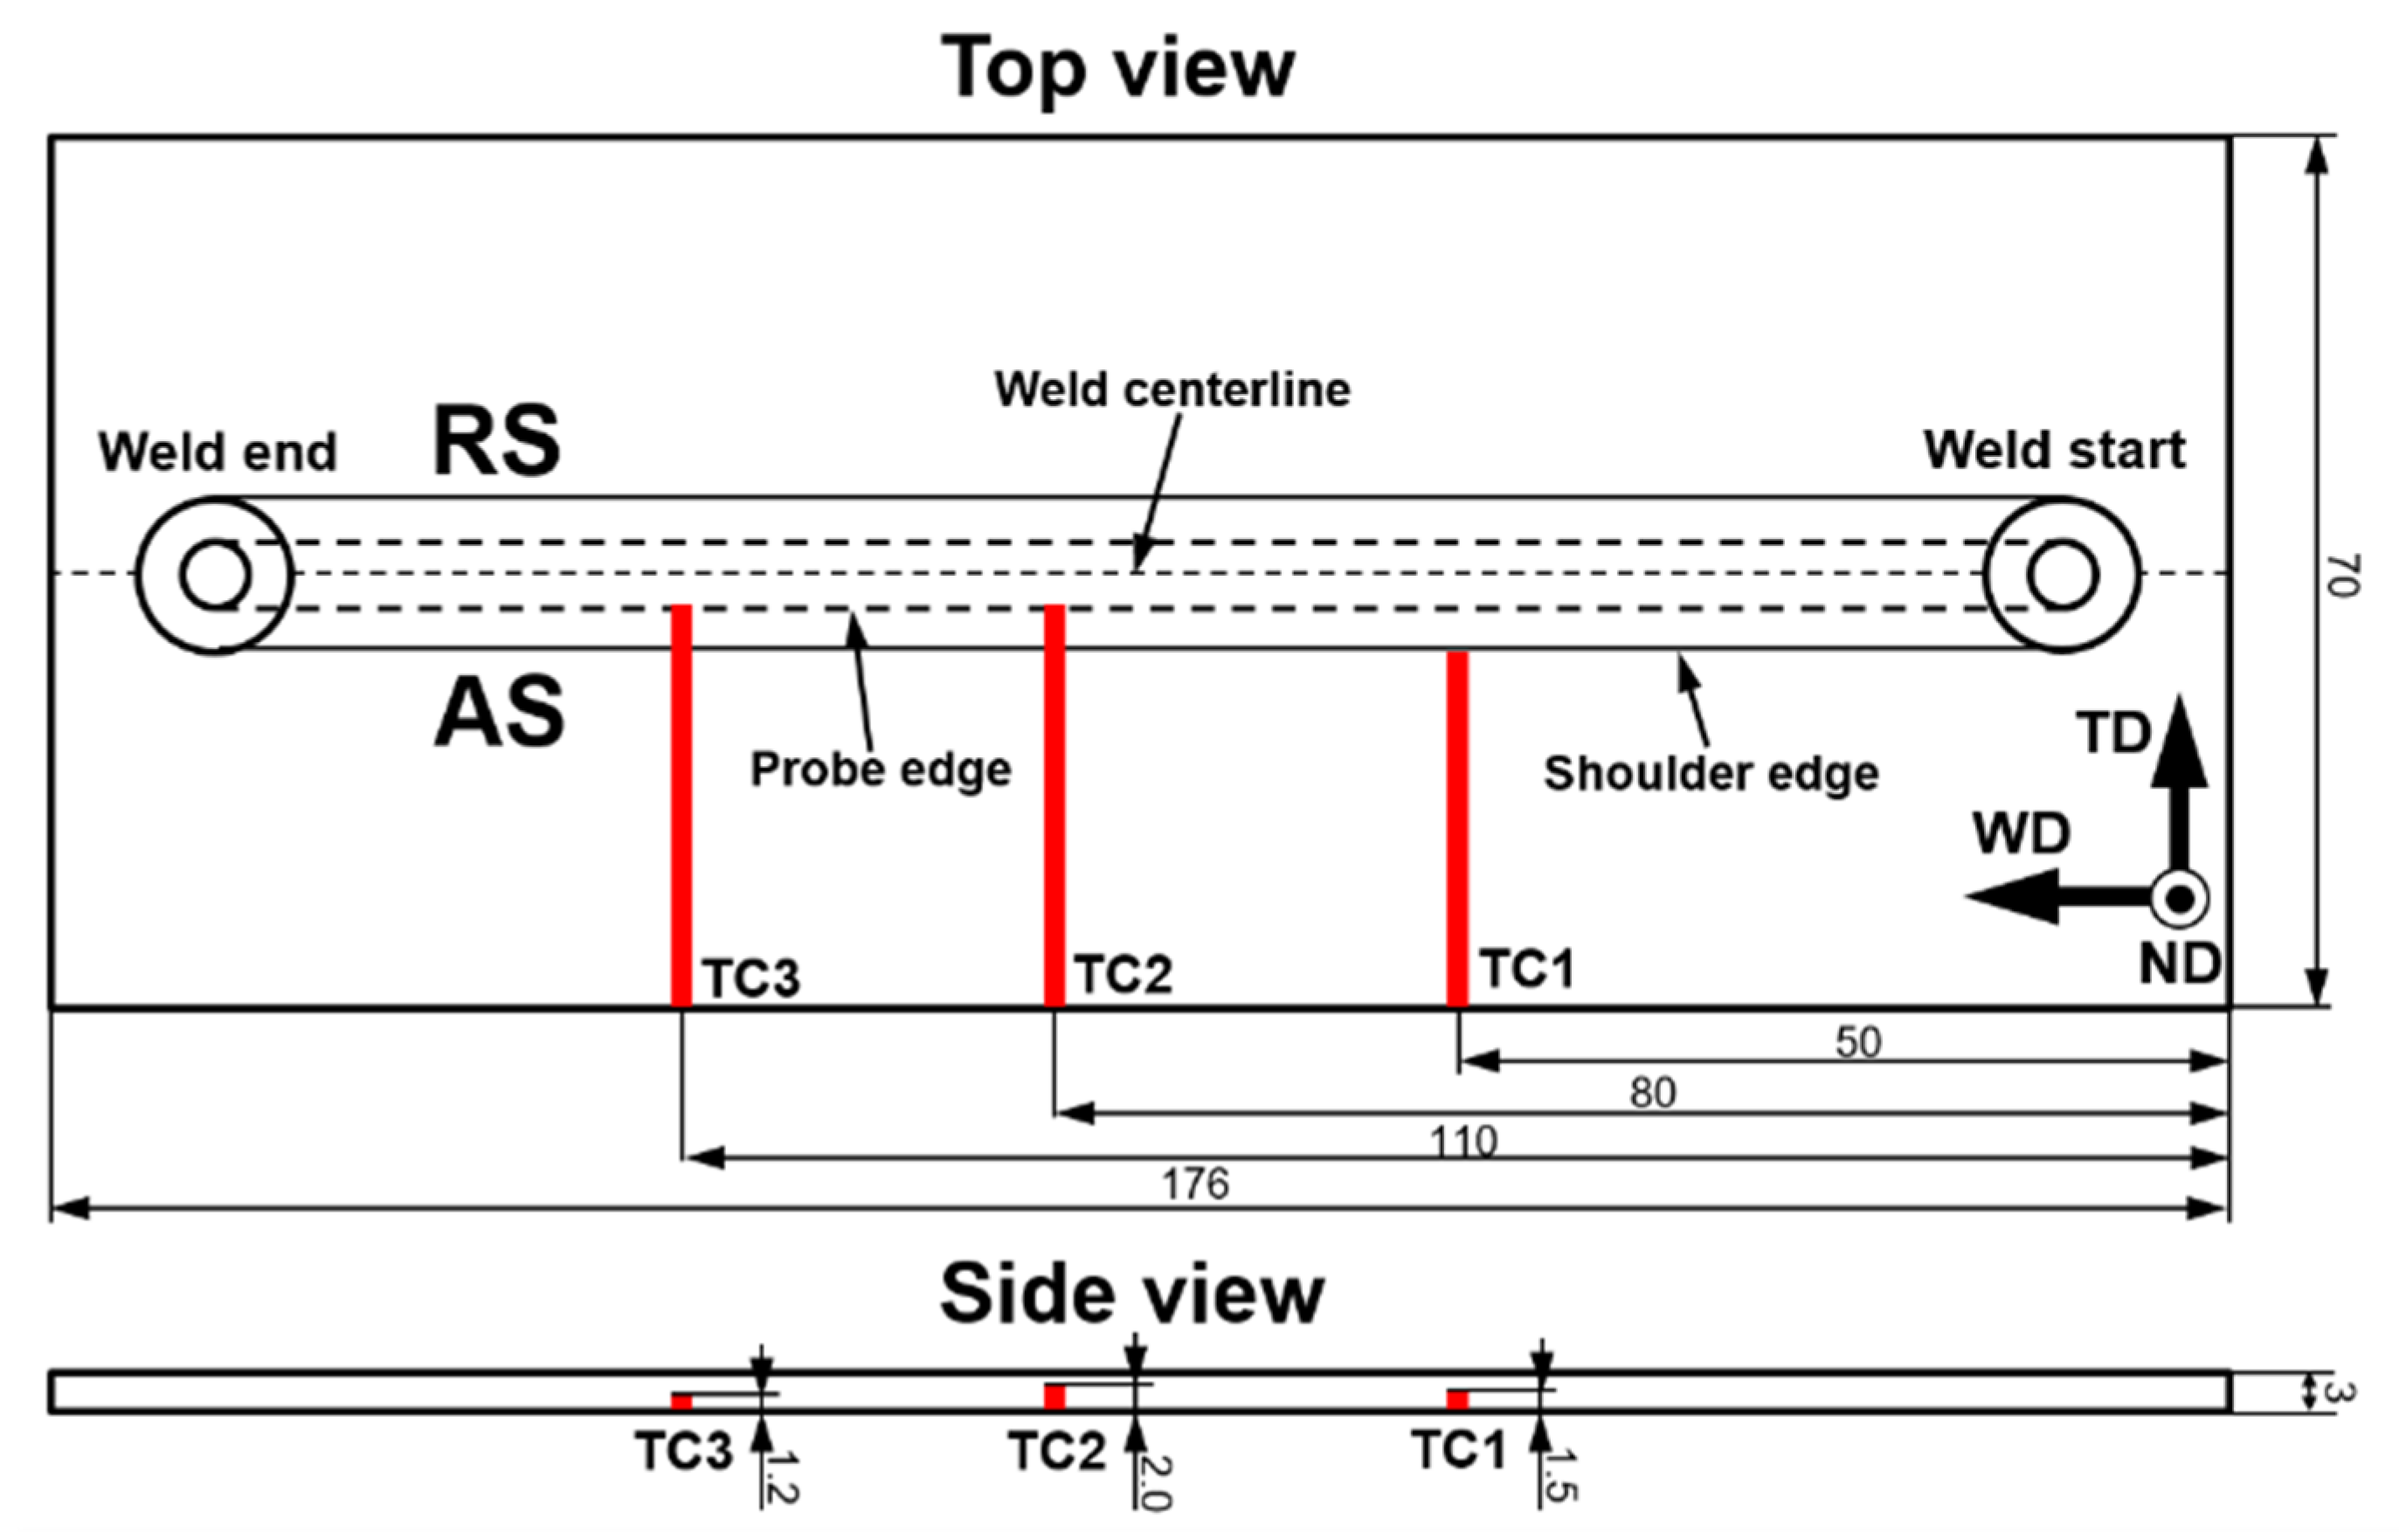
1.2. Weld Thermal Cycle

Analysis of the weld thermal cycle is one of the key issues in numerical simulations of FSW. It is well accepted that the heat generation during FSW is mainly associated with friction between the welding tool and the workpiece, though adiabatic heating also contributes to this process. Accordingly, the weld heat input is governed primarily by the tool dimensions/design [4,5]. On the other hand, the heat loss was found to be mainly driven by the heat sink into the backing plate [6]. Accordingly, the thickness of the welded workpieces may have an essential influence on the heat dissipation [4].
Quite expectably, the weld thermal cycle was observed to be a strong function of FSW variables. Specifically, a decrease in the tool rotation rate and/or an increase in the welding speed normally results in the lowering of the peak welding temperature [5,7,8,9,10,11,12,13,14]. On the other hand, the heating and cooling rates are mainly controlled by the tool travel speed [15].
It has been shown that the tool shoulder plays a major role in the generation of FSW heat [16]. Accordingly, the welding temperature normally decreases towards the weld root [7,8,16,17,18,19,20,21,22,23]. In contrast, the temperature distribution in the width direction of the stir zone is often found to be nearly symmetric [8,11,19,24,25,26,27]. In many cases, however, a slightly increased temperature (~10–20 K) is predicted on the advancing side (AS) [5,8,9,16,17,18,23,28,29,30]. This asymmetry is sometimes attributed to a slight variation in the contact conditions at the tool/workpiece interface due to a tool tilting effect [31].
It is interesting to note that the peak welding temperature tends to increase with the weld path due to the accumulation of heat energy by the welded workpieces [9].

1.3. FSW-Induced Strain and Strain Rate

Evaluation of the FSW-induced strain and strain rate attracts surprisingly low attention. Both these characteristics are important for elucidation of the underlying microstructural mechanisms. Therefore, they are of considerable academic interest.
Despite a limited number of studies in this area, there is an essential scattering in scientific literature. Specifically, the reported peak magnitude of true strain ranged from 5 to 190 [20,23,24,32,33,34], whereas that of the strain rate was from 4 to 1000 s−1 [4,8,21,24,34]. Partially, this effect is attributable to the influence of particular welding conditions. Specifically, the peak welding strain and strain rate were reported to increase with the tool rotation rate [5,20,34]. However, the main reason for this scattering is perhaps due to an uncertainty in the stick/slip condition in the modelling approaches [35].
Similar to the temperature distribution considered in the previous section, the strain and strain rate profiles in the stir zone are somewhat shifted towards AS [5,20,23,24,33,36]. In the thickness direction, the accumulated strain was found to decrease towards the weld root [5,20,33], whereas the peak strain rate was predicted to be near either the shoulder edge [4,5,8] or the probe tip [4].

1.4. Two-Stage Deformation during FSW

From microstructural examinations and textural measurements, it has been shown that material in the upper section of the stir zone normally experiences a two-stage deformation during FSW [37,38,39]. Specifically, it first undergoes a severe deformation during contact with the tool probe, and then, after passage of the welding tool, it experiences a secondary deformation at the shoulder edge. This effect is attributable to a specific design of the welding tool (i.e., a relatively large shoulder and a smaller probe) as well as the tool tilting, which is normally employed during FSW.
Therefore, the final weld microstructure (and thus the final weld properties) is virtually a result of the secondary deformation. To the best of the authors’ knowledge, however, the extent of this effect has not been studied numerically so far.

1.5. Purpose of This Work

The work shown in this paper is a part of a wide-ranging research project aiming to investigate of the effect of FSW on the microstructure and mechanical properties of 6061 aluminum alloy. In previous studies [40,41,42], the detailed examinations showed an inhomogeneous microstructure distribution in the stir zone (Microstructural characterization of the studied welds is shown in supplementary data “Microstructure”.). Moreover, it was found that such microstructural gradients may promote abnormal grain growth during the post-weld heat treatment of FSW joints [41,42]. To elucidate the origin of such a microstructure, it is necessary to know the local variation in thermomechanical conditions within the stir zone. To this end, an appropriate numerical model was elaborated in the present study.
Moreover, this work represents one of the first models that accounts for the secondary-deformation effect in FSW and systematically examines the influence of FSW variables on the peak welding temperature and the FSW-induced strain.

2. Materials and Methods

The material used in the present investigation was a commercial 6061 aluminum alloy. This alloy is widely used in the transportation industry and whose commercial application would benefit from FSW. The material was produced by semi-continuous casting, homogenized at 550 °C for 1 h, and then extruded at 380 °C to 75% of area reduction. To obtain a peak-hardened condition, the extruded material underwent a standard T6 tempering treatment, i.e., solutionized at 540 °C for 1 h, water quenched and then artificially aged at 160 °C for 8 h.
The 3 mm-thick sheets of the T6 tempered material were butt welded using an AccurStir FSW machine (General Tool Company, Cincinnati, OH, USA). The welding tool was fabricated from a tool steel and consisted of a concave-shaped shoulder of 12.5 in diameter and a M5 cylindrical probe of 2.7 mm in length. Further details of the tool design are given in supplementary Figure S1a. The clamping fixture of the FSW machine used in the present work is shown in supplementary Figure S1b.
To investigate the effect of FSW variables on the thermomechanical behavior of the welded material, several welding trials were conducted at different combinations of the tool rotation and translation rates, as shown in Table 1. To distinguish different welds throughout this manuscript, the N × V code was employed (where N is the spindle rate and V is the feed rate), as indicated in Table 1. In all cases, the tool tilting angle was 2.5°, and stainless steel was used as a backing plate.
The weld thermal history was recorded by using three K-type thermocouples placed in different positions within the weld zone, as shown in Figure 1.
It is important to emphasize that Z-force was found to be nearly unchanged during the stable stage of FSW. From this observation, it was suggested that the FSW temperature was also nearly constant along the weld path.

3. Numerical Simulation

3.1. General Description of the Model

Using the commercial Deform-3D software package, a 3-dimensional finite-element model of the FSW process was developed. To this end, a fully coupled thermomechanical approach was employed, i.e., temperature and strain were calculated simultaneously after each time increment. The model included a workpiece, a welding tool, and a backing plate, as shown in Figure 2a. The bottom surface of the workpiece was fully constrained against motion in all directions.
As the welded material experiences very large plastic strain during FSW, it was modelled as a plastic body, i.e., its elastic strain was neglected. In order to save computational time and avoid difficulties associated with modelling of the contact conditions of the welded sheets, the workpiece was considered as a single solid body with dimensions of 70 × 70 × 3 mm3 (Figure 2a). The workpiece was meshed with ~30,000 tetrahedral elements. To provide an appropriate balance between the calculation accuracy and the calculation time, a non-uniform meshing grid was used. Specifically, the mesh size in close proximity to the welding tool was 0.5 mm, whereas that in the remaining part of the workpiece was 3 mm (Figure 2a). In order to avoid excessive distortion of the mesh elements due to severe deformation conditions of FSW, the adaptive re-meshing technique (i.e., the ALE approach) was employed [43]. The relative interference depth of 0.7 was used as a re-meshing criterion.
It is important to emphasize that the mesh size used in the present work was not entirely consistent with the weld pitch for some welding conditions and therefore may result in some uncertainties in the predicted strain distributions. However, further reducing the mesh size resulted in an enormous increase in computational time and may even have caused some computational instability. Therefore, the selected meshing was a compromise between accuracy and computational time. Nevertheless, the model is believed to be suitable for a comparative analysis of temperature and strain distributions for various FSW conditions.
The welding tool and the backing plates were modelled as rigid bodies, i.e., their stress and strain states were ignored, and only heat exchange with the workpiece was considered. The threads on the tool probe were neglected.
The modelling of the FSW was divided into two stages. In the first step, the welding tool was rotated with an angular velocity of either 500, 750, or 1100 rpm and simultaneously inserted into the workpiece to a plunge depth of 2.75 mm. During the second stage, the rotating tool was translated along the workpiece with a feed rate of either 125, 380, or 760 mm/min. Thus, eight different welding regimes were modeled to mimic the real FSW processes depicted in Table 1. In all simulations, the tool tilting angle was assumed to be 2.5°, and the initial temperature of the workpiece, backing plate, and welding tool was 25 °C.

3.2. Material Model

The Johnson–Cook equation [44] was used to quantify the thermomechanical response of the welded material to FSW. This model is widely used in the numerical simulation of FSW, e.g., [45,46], because it accurately predicts material behavior in a wide range of temperatures, strains, and strain rates. According to this equation, flow stress σ was calculated as
σ = ( A + B ε n ) [ 1 + C ln ( 1 + ε ˙ ε ˙ 0 ) ] [ 1 ( T T r T m e l t T r ) m ] ,
where T is temperature, ε is effective strain, ε ˙ is strain rate, ε ˙ 0 is the normalized strain rate, Tr is the reference room temperature (taken to be 25 °C), and Tm is the incipient melting temperature. A, B, n, C and m are the material constants. The input constants for 6061-T6 aluminum alloy are summarized in Table 2 [46].
The temperature-dependent properties of 6061-T6 aluminum alloy were taken from Ref. [19]. The workpiece material was considered to have isotropic thermal properties, and the same values of thermal conductivity, heat capacity, and density were used for all three directions.

3.3. Contact Condition at the Tool/Workpiece Interface

The contact condition between the workpiece and the welding tool is one of the key issues in FSW because it governs heat generation and material flow. In this work, the contact interaction was simulated via the shear friction model.
τ = k σ / 3
where τ is the friction stress σ is flow stress, and k is the friction factor.
In a similar study by Jain et al. [47], the constant shear stress condition (i.e., the sticking condition) was used. Given the significant scattering of friction coefficients in the scientific literature (from 0.3 to 1.0 [21,48,49,50]), it was decided to derive experimentally from a comparison of the predicted and measured thermal cycles (see Section 3.4). In most cases, the best fit was achieved by assuming a friction factor of 0.7.

3.4. Thermal Analysis

It is well accepted that the heat generated at the surface of the welding tool is transferred into the workpiece material following the Fourier’s law of heat conduction [51]:
ρ c T t = λ 2 T + q ,
where ρ is material density, c is specific heat capacity, t is time, λ is thermal conductivity, and q is the heat generation rate.
The frictional and adiabatic heating contribute to the total heat generation rate, which can be expressed as:
q = q f + q p
where q f and q p are the frictional heating rate and the adiabatic heating rate, respectively.
The frictional heating depends on friction stress and could be calculated as [51]:
q f = ϖ ( τ × γ )
where ϖ is the frictional heat factor (taken to be 1.0 [46]) and γ is the slip rate at friction interface.
On the other hand, the adiabatic heating rate could be evaluated as [51]:
q p = η ( σ × ε ˙ )
where η is the plastic deformation heat factor (taken to be 0.9 [49]).
The heat loss from the workpiece surfaces to the surroundings was considered to be due to air convection, thermal radiation, and heat transfer into the backing plate. For the upper and side surfaces of the workpiece, the heat transfer process was represented based on the following equation:
λ T n = α c o n v ( T T e ) + μ ν ( T 4 T e 4 )
where n is the normal direction vector of the heat exchange surface, α c o n v is the convection heat transfer coefficient, T e is the temperature of the surrounding environment, μ is Stefan–Boltzmann constant, and ν is material emissivity.
The heat transfer through the bottom surface of the workpiece was calculated as
λ T n = α p l a t e ( T T p )
where α p l a t e is the coefficient of the heat transfer through the backing plate, T p is the temperature of the backing plate.
The heat transfer through the welding tool was found to be as
λ T n = α t o o l ( T T t o o l )
where α t o o l is the coefficient of the heat transfer through the welding tool, T t o o l is the welding tool temperature.
As the heat transfer coefficient is influenced by numerous factors which are difficult to control precisely, its proper selection is usually a challenging task. The coefficient for natural air convection is commonly assumed to be 20–30 W/(m2°C) [45,47,52], whereas the coefficient for heat conduction to the backing plate can range from 350 to 10,000 W/(m2°C) [19,21,45,53]. In this work, the heat transfer coefficients were selected to provide the best fit between the predicted temperature profiles and the experimental thermal cycles measured by all three thermocouples in different weld positions (Figure 1) for all examined welding conditions (Table 1). The best fit was obtained with an air convection coefficient of 20 W/(m2°C), a heat sink to backing plate of 1200 W/(m2°C), and a heat transfer from the welding tool of 2000 W/(m2°C).

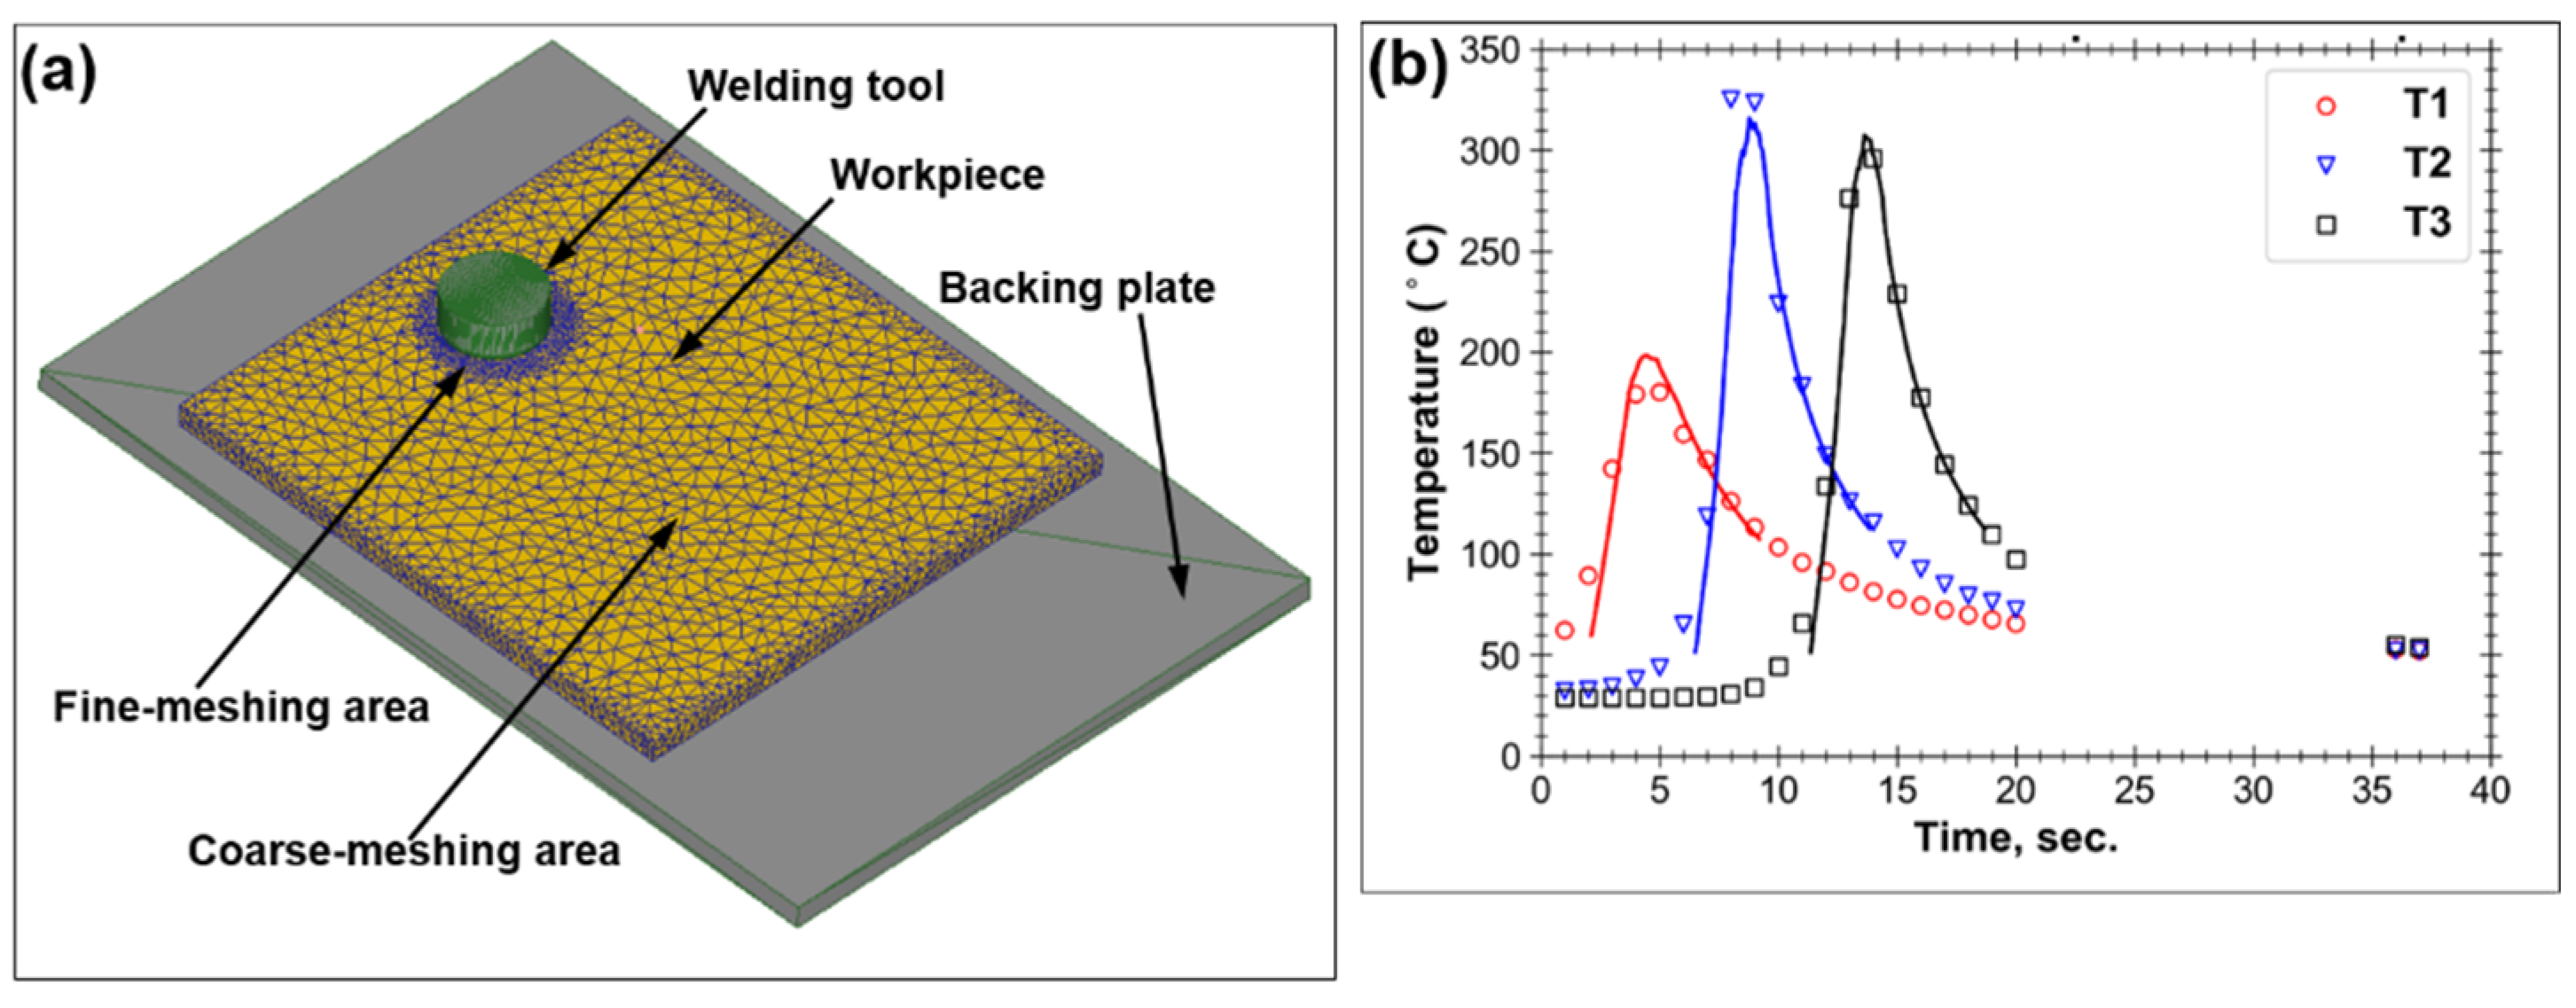
3.5. Model Validation

In order to examine the validity of the elaborated model, the predicted thermal cycles and Z-forces were compared with measured ones (Figure 2b, supplementary Figure S2, and Table 3). The relatively good agreement between the data suggests reliability of the simulation results.
On the other hand, it is important to realize that the experimental measurement of the FSW-induced strains and strain rates is challenging. Accordingly, these predictions were not verified.

4. Results and Discussion

In this work, analysis was focused on the steady-state condition of FSW, i.e., a condition reached after complete tool plunging and its subsequent traverse to the middle of the workpiece.

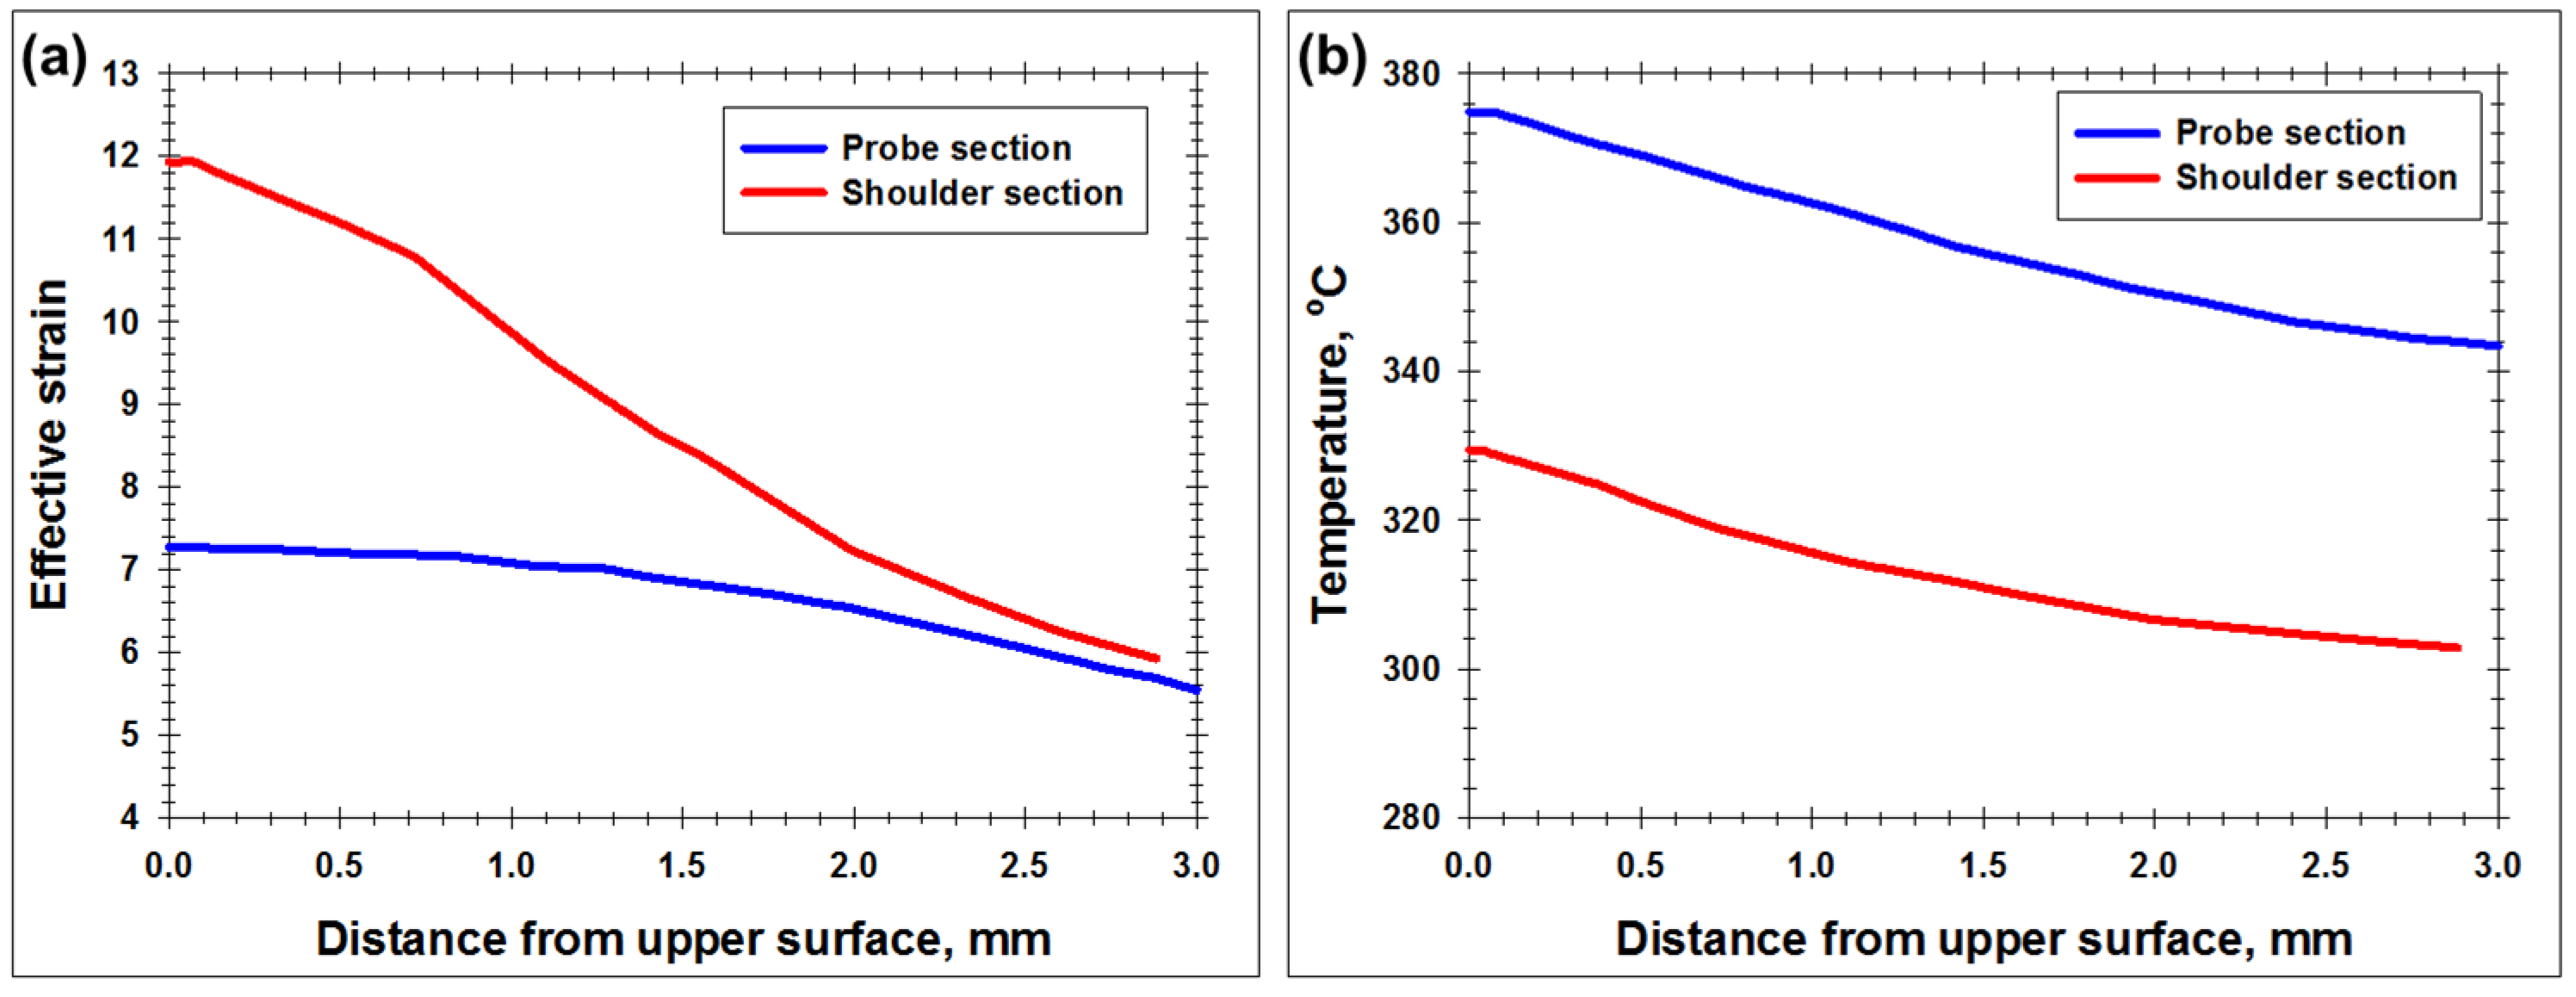
4.1. Secondary Deformation

In order to investigate the secondary deformation effect, two sections of the simulated weld were analyzed, as shown in Figure 3. Specifically, the section directly behind the tool probe (Figure 3a) showed the thermomechanical conditions that arise immediately after the stirring of the workpiece material by the rotating tool probe. On the other hand, the section directly behind the shoulder edge (Figure 3b) illustrated the secondary deformation effect.
Typical 2D distributions of temperature and cumulative effective strain for both the above sections are shown in Figure 4, while the entire data set is given in supplementary Figures S3–S9. The temperature distributions were found to be relatively broad and virtually encompassed the entire workpiece (Figure 4a). On the other hand, the strain distributions were comparatively narrow (Figure 4b). In both examined sections, the peak magnitudes of the thermomechanical characteristics were typically found in the upper section of the stir zone (Figure 4), thereby confirming the primary role of the tool shoulder in the generation of heat and strain. Within this area, however, strain distributions were not uniform (Figure 4b), thus presumably reflecting the complex character of material flow in the near-surface region.
To quantify the secondary deformation effect, through-thickness profiles of temperature and effective strain were calculated for both examined weld sections (The profiles were simulated along weld centerline.) and compared with each other. A typical example is shown in Figure 5, whereas the entire dataset is summarized in supplementary Figures S10–S16. From Figure 5a, it is evident that the peak cumulative strain in the section behind the shoulder edge was nearly doubled, i.e., the secondary deformation had indeed taken place. Despite it being characterized by a somewhat lower temperature than the probe-induced deformation (Figure 5b), the difference was not drastic, so both deformation stages exerted a comparable effect.
As expected, the secondary deformation was most pronounced in the near-surface layer (Figure 5). It may be concluded, therefore, that the surface material has a specific thermomechanical history, i.e., it not only experiences a larger strain at a higher temperature and strain rate but also undergoes the longest thermomechanical exposure.

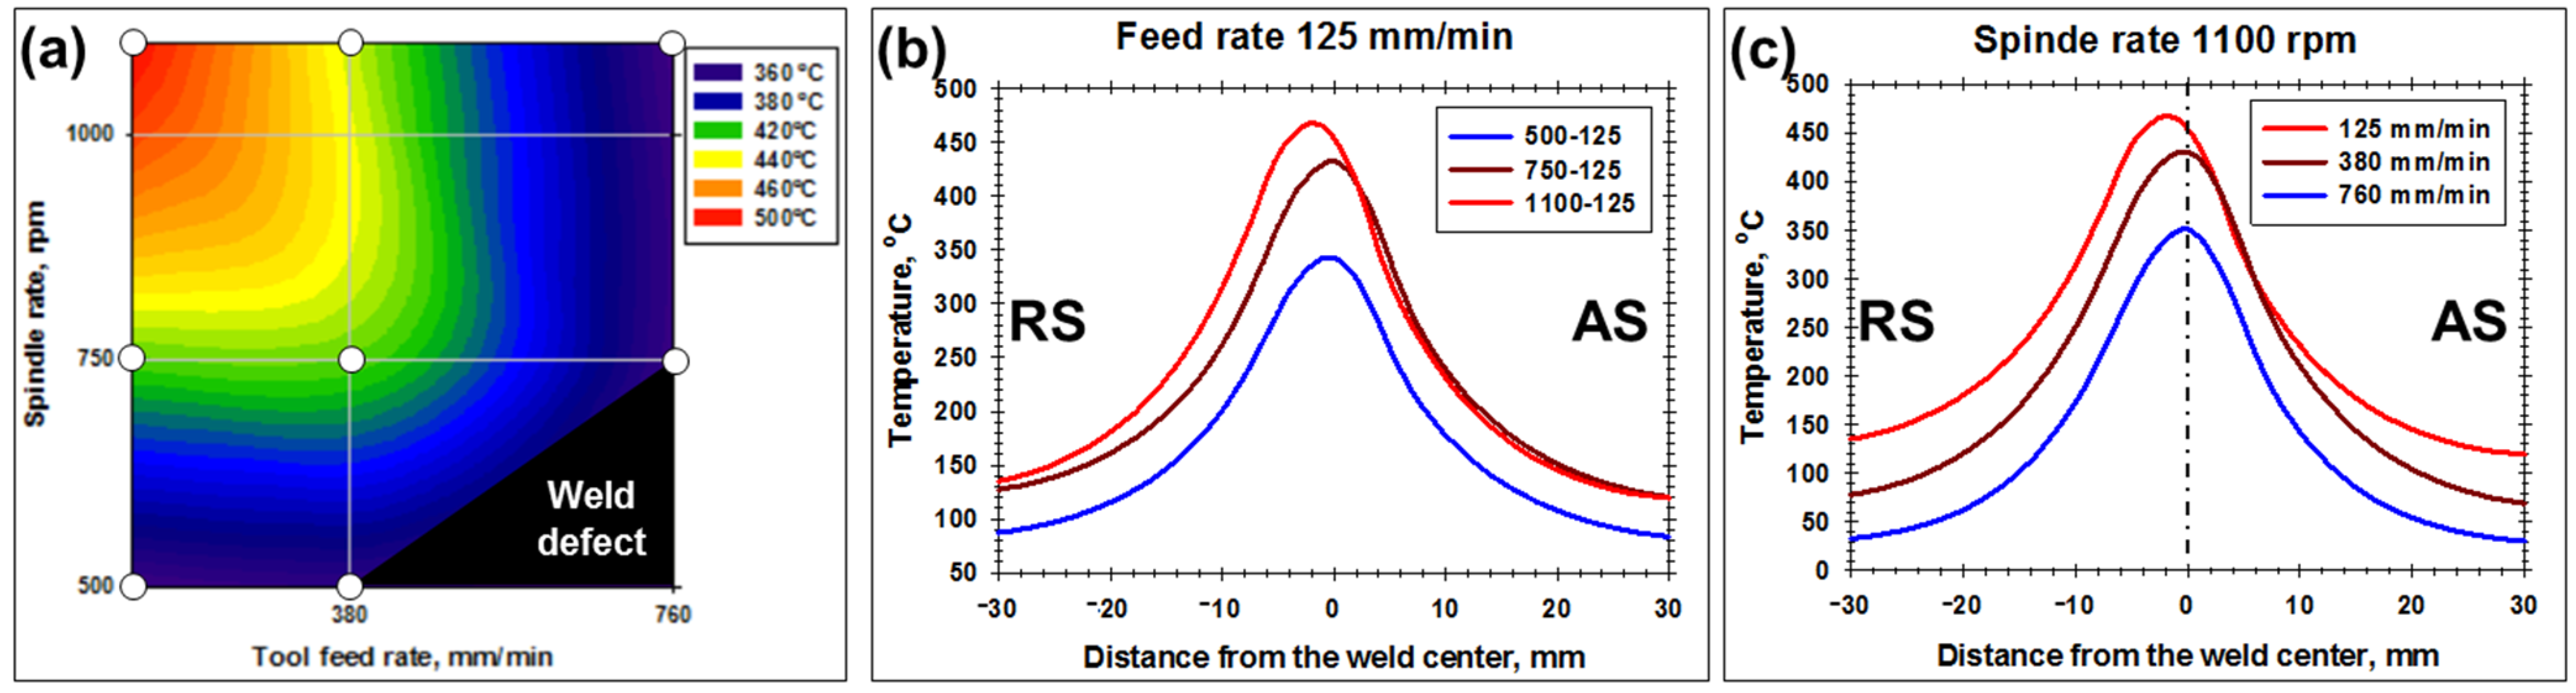
4.2. Effect of Welding Variables

In this section, a relationship between FSW variables and thermomechanical characteristics of the welded material was studied. As shown in Figure 5, peak temperature was predicted for the probe section, whereas peak strain was found in the shoulder-edge section. As a result, the temperature data used in this section came from the probe section, while the strain data came from the shoulder-edge section. In order to evaluate the spatial distributions of the two above characteristics within the welds, appropriate profiles were calculated across the weld mid-thickness.
The combined effects of the tool feed speed and spindle rate on the peak welding temperature and the peak cumulative strain are shown in Figure 6a and Figure 7a, respectively. Depending on particular welding conditions, the temperature was predicted to vary from 360 to 501 °C (Figure 6a), whereas the cumulative strain was from 12 to 45.2 (Figure 7a). Remarkably, both the welding temperature and the strain exhibited a nearly similar dependence on FSW conditions. Specifically, both characteristics tended to increase with the spindle rate but decreased with the welding speed (Figure 6a and Figure 7a). In the case of the welding temperature, such behavior was quite expectable and agreed well with experimental measurements, e.g., [54]. In the case of the FSW-induced strain, however, the situation is less clear. While the predicted increase in the FSW strain with the spindle rate seems to be entirely reasonable (and is consistent with literature data, e.g., [5,20,34]), the adverse effect of the welding speed was somewhat surprising. One of the possible explanations for this result may be thermal-induced material softening (expected at low feed rates), which should enhance material flow.
The cross-width distributions of temperature and strain are shown in Figure 6b,c and Figure 7b,c and supplementary Figures S17–S20. In all cases, a slight asymmetry towards the retreating side (RS) is worthy of remark. This observation contradicts the data available in the scientific literature, in which a shift towards AS is usually predicted [5,8,9,16,17,18,20,23,24,28,29,30,33,36]. The reason for this discrepancy is not clear and warrants further analysis.
As expected, the temperature distribution tended to broaden with the tool rotation rate (Figure 6b) but narrowed with the welding speed (Figure 6c). In both cases, the effect was most pronounced on the RS. Remarkably, the material at the workpiece edges (i.e., located in the nominally base-material zone) was also predicted to experience substantial heating, which ranged from 30 to 130 °C depending on particular welding conditions (Figure 6b,c).
The strain distribution was also found to widen with either an increase in the spindle rate (Figure 7b) and/or a reduction in the feed rate (Figure 7c). Notably, the width of the deformation zone was predicted to span ~10–30 mm from the weld centerline (Figure 7b,c), thus significantly exceeding the radius of the tool shoulder (i.e., 6.25 mm). As expected, in all cases, the deformation zone on the RS was wider than that on the AS (Figure 7b,c).

5. Conclusions

In this work, a finite-element model was elaborated to simulate the thermomechanical behavior of 6061 aluminum alloy during FSW. Particular emphasis was given to the examination of the effect of secondary deformation induced by the shoulder edge. The main conclusions derived from this work are as follows.
(1)
The deformation induced by FSW is a two-stage process. In addition to the stirring action exerted by the rotating tool probe, the material in the near-surface area of the stir zone also experiences a secondary deformation by the shoulder edge after passage of the welding tool. Despite the secondary deformation being characterized by a somewhat lower temperature than the probe-induced one, the difference is not drastic, so both deformation stages are comparable.
(2)
The secondary deformation is most pronounced in the near-surface layer. Accordingly, the material in this area experiences not only a larger strain at a higher temperature but also undergoes the longest thermomechanical exposure, i.e., its thermomechanical history is very specific.
(3)
The peak FSW temperatures, as well as the width of the heat-affected zone, increased with an increase in tool rotation rate and/or a decrease in welding speed. Importantly, the material at the workpiece edges (i.e., located in the nominally base-material zone) was also found to experience heating up to 130 °C.
(4)
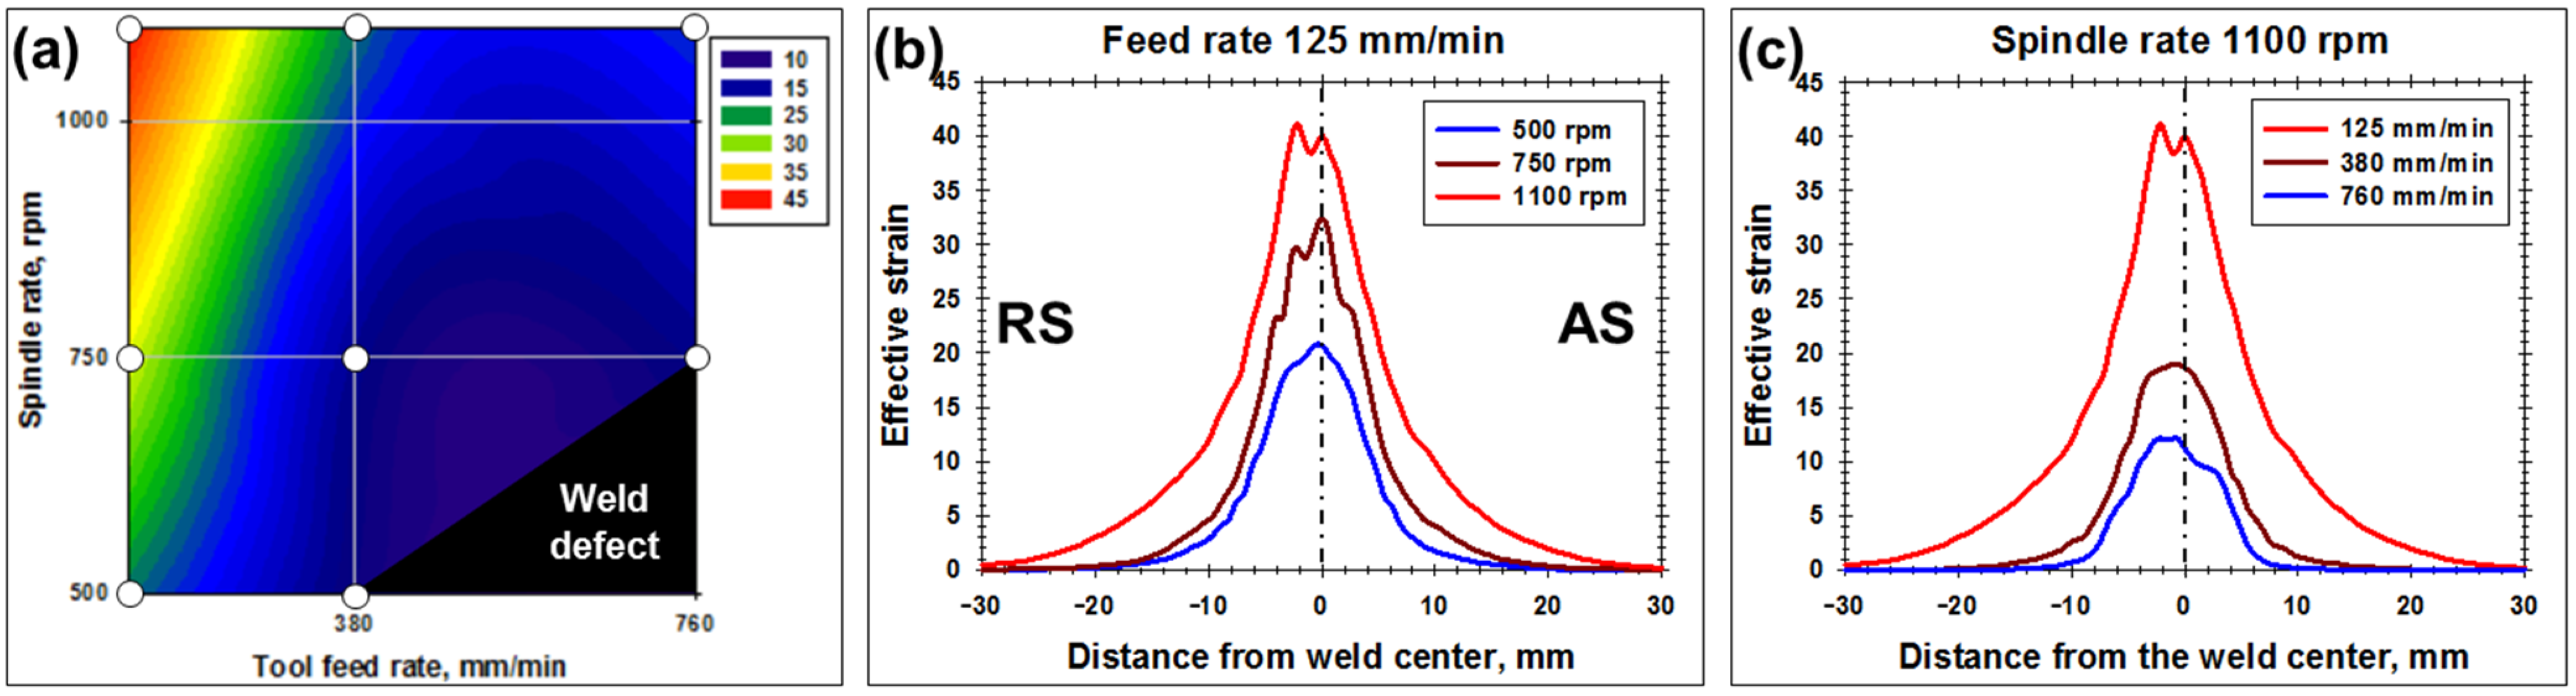
The peak FSW-induced strain and the width of the deformation zone were also predicted to increase with spindle rate and/or reduction in the feed rate. Depending on particular welding conditions, the predicted peak strain ranged from 12 to 45. Remarkably, the width of the deformation zone was predicted to reach ~20–30 mm, thus significantly exceeding the stir zone size.
(5)
The simulation of the detailed distribution of thermomechanical conditions within the weld zone opens up new perspectives for exploring material behavior. Coupled with detailed microstructural mapping (e.g., via sample-scale electron backscatter diffraction), it may provide a useful insight into the processing–microstructure relationship and thus refine our fundamental understanding of microstructural mechanisms.

Supplementary Materials

The following supporting information can be downloaded at: https://www.mdpi.com/article/10.3390/jmmp6040068/s1.

Author Contributions

Conceptualization, V.M., I.S., S.M. (Sergey Mironov); methodology, V.M., I.S.; V.M., I.S.; formal analysis, V.M., I.S.; investigation, A.K., I.V., I.Z., S.M. (Sergey Mironov); resources, V.M., I.S., R.K.; data curation, S.M. (Sergey Mironov); writing—original draft preparation, S.M. (Sergey Mironov); writing—review and editing, V.M., I.S., A.K., I.V., I.Z., S.M. (Sergey Malopheyev), R.K.; V.M., I.S., S.M. (Sergey Mironov); supervision, R.K.; project administration, S.M. (Sergey Mironov). All authors have read and agreed to the published version of the manuscript.

Funding

This research received no external funding.

Institutional Review Board Statement

Not applicable.

Informed Consent Statement

Not applicable.

Data Availability Statement

Data available on request.

Conflicts of Interest

The authors declare no conflict of interest.

References

  1. Mishra, R.S.; Ma, Z.Y. Friction stir welding and processing. Mater. Sci. Eng. R 2005, 50, 1–78. [Google Scholar] [CrossRef]
  2. Schmidt, H.; Hattel, J. A local model for the thermomechanical conditions in friction stir welding. Model. Simul. Mater. Sci. Eng. 2004, 13, 77–93. [Google Scholar] [CrossRef]
  3. Al-Badour, F.; Merah, N.; Shuaib, A.; Bazoune, A. Coupled Eulerian Lagrangian finite element modeling of friction stir welding processes. J. Mater. Proc. Technol. 2013, 213, 1433–1439. [Google Scholar] [CrossRef]
  4. Anrade, D.G.; Leitao, C.; Dialami, N.; Chiumenti, M.; Rodrigues, D.C. Modelling torque and temperature in friction stir welding of aluminum alloys. Int. J. Mech. Sci. 2020, 182, 105725. [Google Scholar] [CrossRef]
  5. Ansari, M.A.; Samanta, A.; Behnagh, R.A.; Ding, H. An efficient coupled Eulerian-Lagrangian finite element model for friction stir processing. Int. J. Adv. Manuf. Technol. 2019, 101, 1495–1508. [Google Scholar] [CrossRef]
  6. Khandkar, M.Z.H.; Khan, J.A.; Reynolds, A.P. Prediction of temperature distribution and thermal history during friction stir welding: Input torque based model. Sci. Technol. Weld. Join. 2003, 8, 165–174. [Google Scholar] [CrossRef]
  7. Bastier, A.; Maitournam, M.H.; Roger, F.; Van, K.D. Modelling of the residual state of friction stir welded plates. J. Mater. Proc. Technol. 2008, 200, 25–37. [Google Scholar] [CrossRef]
  8. Chen, G.; Shi, Q.; Li, Y.; Sun, Y.; Dai, Q.; Jia, J.; Zhu, Y.; Wu, J. Computational fluid dynamics studies on heat generation during friction stir welding of aluminum alloy. Comp. Mater. Sci. 2013, 79, 540–546. [Google Scholar] [CrossRef]
  9. Yau, Y.H.; Hussain, A.; Lalwani, R.K.; Chan, H.K.; Hakimi, N. Temperature distribution study during the friction stir welding process of Al2024-T3 aluminum alloy. Int. J. Miner. Met. Mater. 2013, 20, 779–787. [Google Scholar] [CrossRef]
  10. Wang, L.; Davies, C.M.; Wimpory, R.C.; Xie, L.Y.; Nikbin, K.M. Measurement and simulation of temperature and residual stress distributions from friction stir welding AA2024 Al alloy. Mater. High Temp. 2010, 27, 167–178. [Google Scholar] [CrossRef]
  11. Zina, N.; Zahaf, S.; Bouaziz, S.A.; Brahami, A.; Kaid, M.; Chetti, B.; Vafa, Z.N. Numerical simulation on the effect of friction stir welding parameters on the peak temperature, von Mises stress, and residual stresses of 6061-T6 aluminum alloy. J. Fail. Anal. Prev. 2019, 19, 1698–1719. [Google Scholar] [CrossRef]
  12. Kaid, M.; Zemri, M.; Brahami, A.; Zahaf, S. Effect of friction stir welding (FSW) parameters on the peak temperature and the residual stresses of aluminum alloy 6061-T6: Numerical modelisation. Int. J. Interact. Des. Manuf. 2019, 13, 797–807. [Google Scholar] [CrossRef]
  13. Kandasamy, J.; Sairam, J.; Hussain, M.M. Comparative analysis of temperature variation in friction stir welding. Mater. Today Proc. 2018, 5, 18798–18804. [Google Scholar] [CrossRef]
  14. Gharibshahiyan, E.; Raouf, A.H. Finite element simulations of heat transfer in friction stir welding of Al 5052. AIP Conf. Proc. 2012, 1476, 164–168. [Google Scholar]
  15. Reynolds, A.P.; Tang, W.; Khandkar, Z.; Khan, J.A.; Linder, K. Relationship between welding parameters, hardness distribution and temperature history in alloy 7050 friction stir welds. Sci. Tech. Weld. Join. 2005, 10, 190–199. [Google Scholar] [CrossRef]
  16. Zhang, J.; Shen, Y.; Li, B.; Xu, H.; Yao, X.; Kuang, B.; Gao, J. Numerical simulation and experimental investigation on friction stir welding of 6061-T6 aluminum alloy. Mater. Des. 2014, 60, 94–101. [Google Scholar] [CrossRef]
  17. Kadian, A.K.; Biswas, P. A comparative study of material flow behavior in friction stir welding using laminar and turbulent models. J. Mater. Eng. Perform. 2015, 24, 4119–4127. [Google Scholar] [CrossRef]
  18. Hamilton, C.; Kopyscianski, M.; Senkov, O.; Dymek, S. A coupled thermal/material flow model of friction stir welding applied to Sc-modified aluminum alloys. Met. Mater. Trans. A 2013, 44, 1730–1740. [Google Scholar] [CrossRef] [Green Version]
  19. Riahi, M.; Nazari, H. Analysis of transient temperature and residual thermal stresses in friction stir welding of aluminum alloy 6061-T6 via numerical simulation. Int. J. Adv. Manuf. Technol. 2011, 55, 143–152. [Google Scholar] [CrossRef]
  20. Jain, R.; Pal, S.K.; Singh, S.B. Finite element simulation of temperature and strain distribution during friction stir welding of AA2024 aluminum alloy. J. Inst. Eng. India Ser. C 2017, 98, 37–43. [Google Scholar] [CrossRef]
  21. Nakamura, T.; Obikawa, T.; Nishizaki, I.; Enomoto, M.; Fang, Z. Friction stir welding of non-heat-treatable high-strength alloy 5083-O. Metals 2018, 8, 208. [Google Scholar] [CrossRef] [Green Version]
  22. Liu, X.; Yu, Y.; Yang, S.; Liu, H. A modified analytical heat source model for numerical simulation of temperature field in friction stir welding. Adv. Mater. Sci. Eng. 2020, 2020, 4639382. [Google Scholar] [CrossRef] [Green Version]
  23. Wu, T.; Zhao, F.; Luo, H.; Wang, H.; Li, Y. Temperature monitoring and material flow characteristics of friction stir welded 2A14-T6 aerospace aluminum alloy. Materials 2019, 12, 3387. [Google Scholar] [CrossRef] [Green Version]
  24. Buffa, G.; Hua, J.; Shivpuri, R.; Fratini, L. Design of the friction stir welding tool using the continuum based FEM model. Mater. Sci. Eng. A 2006, 419, 381–388. [Google Scholar] [CrossRef]
  25. Lin, B.Y.; Yuan, P.; Liu, J.J. Temperature distribution of aluminum alloys under friction stir welding. Adv. Mater. Res. 2011, 264–265, 217–222. [Google Scholar] [CrossRef]
  26. Pan, Y.; Lados, D.A. Friction stir welding in wrought and cast aluminum alloys: Heat transfer modeling and thermal history analysis. Met. Mater. Trans. A 2017, 48, 722–734. [Google Scholar] [CrossRef]
  27. Naumov, A.A.; Isupov, F.Y.; Golubev, Y.A.; Morozova, Y.N. Effect of the temperature of friction stir welding on the microstructure and mechanical properties of welded joints of an Al–Cu–Mg alloy. Met. Sci. Heat Treat. 2019, 60, 695–700. [Google Scholar] [CrossRef]
  28. Hamilton, C.; Węglowski, M.S.; Dymek, S.; Sedek, P. Using a coupled thermal/material flow model to predict residual stress in friction stir processed AlMg9Si. J. Mater. Eng. Perform. 2015, 24, 1305–1312. [Google Scholar] [CrossRef]
  29. Zhao, P.-C.; Shen, Y.-F.; Huang, G.-Q.; Zheng, Q.-X. Numerical simulation of friction stir butt-welding of 6061 aluminum alloy. Trans. Nonfer. Metal. Soc. Chin. 2018, 28, 1216–1225. [Google Scholar] [CrossRef]
  30. Muhsin, J.J.; Tolephih, M.H.; Muhammed, A.M.; Sadiq, G.S. Numerical and experimental analysis of transient temperature and residual thermal stresses in friction stir welding of aluminum alloy 7020-T53. ARPN J. Eng. Appl. Sci. 2016, 11, 11663–11674. [Google Scholar]
  31. Chen, G.; Zhang, S.; Zhu, Y.; Yang, C.; Shi, Q. Thermo-mechanical analysis of friction stir welding: A review on recent advances. Acta Met. Sin. 2020, 33, 3–12. [Google Scholar] [CrossRef] [Green Version]
  32. Assidi, M.; Fourment, L.; Guerdoux, S.; Nelson, T. Friction model for friction stir welding process simulation: Calibrations from welding experiments. Int. J. Mach. Tool Manuf. 2010, 50, 143–155. [Google Scholar] [CrossRef]
  33. Zhang, P.; Guo, N.; Chen, G.; Meng, Q.; Dong, C.; Zhou, L.; Feng, J. Plastic deformation behavior of the friction stir welded AA2024 aluminum alloy. Int. J. Adv. Manuf. Technol. 2014, 74, 673–679. [Google Scholar] [CrossRef]
  34. Long, T.; Tang, W.; Reynolds, A.P. Process response parameter relationships in aluminium alloy friction stir welds. Sci. Technol. Weld. Join. 2007, 12, 311–317. [Google Scholar] [CrossRef]
  35. Wang, H.; Colegrove, P.A.; dos Santos, J.F. Numerical investigation of the tool contact condition during friction stir welding of aerospace aluminum alloy. Comp. Mater. Sci. 2013, 71, 101–108. [Google Scholar] [CrossRef]
  36. Sun, H.; Zhou, Q.; Zhu, J.; Shi, X.; Sun, Z. Deformation analysis of a friction stir-welded thin sheet aluminum alloy joint. Chin. Weld. 2020, 29, 56–62. [Google Scholar]
  37. Suhuddin, U.F.H.R.; Mironov, S.; Sato, Y.S.; Kokawa, H.; Lee, C.-W. Grain structure evolution during friction stir welding of AZ31 magnesium alloy. Acta Mater. 2009, 57, 5406–5418. [Google Scholar] [CrossRef]
  38. Suhuddin, U.F.H.R.; Mironov, S.; Sato, Y.S.; Kokawa, H. Grain structure and texture evolution during friction stir welding of thin 6016 aluminum alloy sheets. Mater. Sci. Eng. A 2010, 527, 1962–1969. [Google Scholar] [CrossRef]
  39. Mironov, S.; Yang, Q.; Takahashi, H.; Takahashi, I.; Okamoto, K.; Sato, Y.S.; Kokawa, H. Specific character of material flow in near-surface layer during friction stir processing of AZ31 magnesium alloy. Met. Mater. Trans. A 2010, 41, 1016–1024. [Google Scholar] [CrossRef]
  40. Kalinenko, A.; Vysotskiy, I.; Malopheyev, S.; Mironov, S.; Kaibyshev, R. Influence of the weld thermal cycle on the grain structure of friction-stir joined 6061 aluminum alloy. Mater. Charact. 2021, 178, 111202. [Google Scholar] [CrossRef]
  41. Kalinenko, A.; Vysotskiy, I.; Malopheyev, S.; Mironov, S.; Kaibyshev, R. New insight into the phenomenon of the abnormal grain growth in friction-stir welded aluminum. Mater. Lett. 2021, 302, 130407. [Google Scholar] [CrossRef]
  42. Kalinenko, A.; Mishin, V.; Shishov, I.; Vysotskiy, I.; Malopheyev, S.; Zuiko, I.; Novikov, V.; Mironov, S.; Kaibyshev, R.; Semiatin, S.L. Mechanisms of abnormal grain growth in friction-stir-processed aluminum alloy 6061-T6. J. Alloys Compd. 2022. submitted. [Google Scholar]
  43. Wan, J.; Kocak, S.; Shephard, M.S. Automated adaptive 3D forming simulation processes. Eng. Comput. 2005, 21, 47–75. [Google Scholar] [CrossRef]
  44. Johnson, G.R.; Cook, W.H. Fracture characteristics of three metals subjected to various strains, strain rates, temperatures and pressures. Eng. Fract. Mech. 1985, 21, 31–48. [Google Scholar] [CrossRef]
  45. Chauhan, P.; Jain, R.; Pal, S.K.; Singh, S.B. Modeling of defects in friction stir welding using coupled Eulerian and Lagrangian method. J. Manuf. Process. 2018, 34, 158–166. [Google Scholar] [CrossRef]
  46. Salloomi, K.N. Fully coupled thermomechanical simulation of friction stir welding of aluminum 6061-T6 alloy T-joint. J. Manuf. Process. 2019, 45, 746–754. [Google Scholar] [CrossRef]
  47. Jain, R.; Pal, S.K.; Singh, S.B. Finite element simulation of pin shape influence on material flow, forces in friction stir welding. Int. J. Adv. Manuf. Technol. 2018, 94, 1781–1797. [Google Scholar] [CrossRef]
  48. Asadi, P.; Givi, M.K.B.; Akbari, M. Microstructural simulation of friction stir welding using a cellular automaton method: A microstructure prediction of AZ91 magnesium alloy. Int. J. Mech. Mater. Eng. 2015, 10, 20. [Google Scholar] [CrossRef] [Green Version]
  49. Buffa, G.; Hua, J.; Shivpuri, R.; Fratini, L. A continuum based fem model for friction stir welding—Model development. Mater. Sci. Eng. A 2006, 419, 389–396. [Google Scholar] [CrossRef]
  50. Zhao, Y.; Liu, H.; Yang, T.; Lin, Z.; Hu, Y. Study of temperature and material flow during friction spot welding of 7B04-T74 aluminum alloy. Int. J. Adv. Manuf. Technol. 2016, 83, 1467–1475. [Google Scholar] [CrossRef]
  51. Jain, R.; Pal, S.K.; Singh, S.B. Numerical modeling methodologies for friction stir welding process. In Computational Methods and Production Engineering; Elsevier: Amsterdam, The Netherlands, 2017; pp. 125–169. [Google Scholar]
  52. Jain, R.; Kumari, K.; Pal, S.K.; Singh, S.B. Counter rotating twin-tool system in friction stir welding process: A simulation study. J. Mater. Process. Technol. 2018, 255, 121–128. [Google Scholar] [CrossRef]
  53. Zhang, B.; Chen, X.; Pan, K.; Li, M.; Wang, J. Thermo-mechanical simulation using microstructure-based modeling of friction stir spot welded AA 6061-T6. J. Manuf. Process. 2019, 37, 71–81. [Google Scholar] [CrossRef]
  54. Kalinenko, A.; Kim, K.; Vysotskiy, I.; Zuiko, I.; Malopheyev, S.; Mironov, S.; Kaibyshev, R. Microstructure-strength relationship in friction-stir welded 6061-T6 aluminum alloy. Mater. Sci. Eng. A 2020, 793, 139858. [Google Scholar] [CrossRef]
Figure 1. Thermocouples layout inside the workpiece (unit: mm). T1, T2 and T3 show thermocouples used for the temperature measurements in the heat-affected zone, upper section of the stir zone, and bottom section of the stir zone, respectively. WD, the ND and TD refer to welding direction, normal direction and transverse direction, respectively; AS and RS refer to advancing side and retreating side, respectively. Not in scale.
Jmmp 06 00068 g001
Figure 2. (a) The utilized FEM model and (b) a typical comparison of the measured (symbols) and simulated (solid lines) temperature-time profiles for thermocouples T1, T2 and T3. In (b), the data for 750–380 weld are shown.
Jmmp 06 00068 g002
Figure 3. A schematic showing the analyzed sections of friction stir weld: (a) the section directly behind the tool probe, and (b) the section directly behind the shoulder edge. Note: In the figure, the simulated 3-D temperature distributions for 1100–125 weld are shown. AS and RS are advancing side and retreating side, respectively; WD, ND and TD are welding direction, normal direction, and transverse direction, respectively.
Jmmp 06 00068 g003
Figure 4. Typical 2-D distributions of temperature (a) and cumulative effective strain (b) simulated for the weld sections directly behind the tool probe and that behind the shoulder edge. RS and AS are retreating side and advancing side, respectively. Note: The distributions were calculated for 500–380 weld.
Jmmp 06 00068 g004
Figure 5. Typical through-thickness distributions of accumulated effective strain (a) and temperature (b) calculated at the weld centerline for the weld sections directly behind the tool probe and that behind the shoulder edge. Note: The distributions for the 500–380 weld is shown.
Jmmp 06 00068 g005
Figure 6. The combined effect of welding variables on the peak temperature (a), and typical effect of spindle rate (b) and the tool feed rate (c) on the temperature profiles calculated across the weld mid-thickness. In all cases, the temperature data were simulated for the weld section directly behind the tool probe. In (a), circles indicate the welding conditions for which the temperature data were actually simulated. In (b), the data for the welds produced at the feed rate of 125 mm/min are shown. In (c), the data for the welds produced at the spindle rate of 1100 rpm are shown.
Jmmp 06 00068 g006
Figure 7. The combined effect of welding variables on the peak strain (a), and typical effect of spindle rate (b) and the tool feed rate (c) on the strain profiles calculated across the weld mid-thickness. In all cases, the strain data were simulated for the weld section behind the shoulder edge. In (a), circles indicate the welding conditions for which the strain data were actually simulated. In (b), the data for the welds produced at the feed rate of 125 mm/min are shown. In (c), the data for the welds produced at the spindle rate of 1100 rpm are shown.
Jmmp 06 00068 g007
Table 1. Designation of welds.
Tool Translation Speed, mm/minTool Rotation Rate, rpm
5007501100
125500–125750–1251100–125
380500–380750–3801100–380
760-750–7601100–760
Table 2. Parameters of the Johnson–Cook equation used in numerical model.
ParameterDefinitionValueUnit
AYield stress at ambient temperature324MPa
BStrain factor114MPa
nStrain exponent0.42-
CStrain rate factor0.002-
ε ˙ 0 Normalized strain rate1-
TmIncipient melting temperature582°C
mTemperature exponent1.34-
Table 3. Comparison of predicted Z-force with experimental measurements.
FSW ConditionZ-force
Spindle Rate, rpmFeed Rate, mm/minMeasured, kNPredicted, kNError, %
5001256.06.1−1.67
3809.79.6+1.03
7501255.14.9+3.92
3805.96.0−1.69
7609.79.5+2.06
11001255.45.2+3.70
3805.76.1−7.02
7605.96.6−11.86
Publisher’s Note: MDPI stays neutral with regard to jurisdictional claims in published maps and institutional affiliations.

