Article

A Methodology to Parameterize Wire + Arc Additive Manufacturing: A Case Study for Wall Quality Analysis

Department of Engineering Science, Production Technology West, Division of Welding Technology, Högskolan Väst (University West), 46132 Trollhättan, Sweden
*
Author to whom correspondence should be addressed.
J. Manuf. Mater. Process. 2020, 4(1), 14; https://doi.org/10.3390/jmmp4010014
Submission received: 6 January 2020 / Revised: 13 February 2020 / Accepted: 17 February 2020 / Published: 19 February 2020

Abstract

:
The objective of this work was the development of a methodology to parametrize wire + arc additive manufacturing (WAAM), aiming dimension repeatability, and tolerances. Parametrization of WAAM is a difficult task, because multiple parameters are involved and parameters are inter-dependent on each other, making overall process complex. An approach to study WAAM would be through operational maps. The choice of current (Im) and travel speed (TS) for the desirable layer width (LW) determines a parametrization that leads to either more material or less material to be removed in post-operations, which is case study chosen for this work. The work development had four stages. First stage, named ‘mock design’, had the objective of visualizing the expected map and reduce further number of experiments. At the second stage, ‘pre-requisite for realistic operational map’, the objective was to determine the operating limits of TS and Im with the chosen consumables and equipment. Within the ‘realistic operational map’ stage, a design for the experiments was applied to cover a parametric area (working envelope) already defined in the previous stage and long and tall walls were additively manufactured. Actual values of LW (external and effective layer width) were measured and an actual operating envelope was reached. According to the geometry-oriented case study, a surface waviness index (SWindex) was defined, determined, and overlapped in the envelope. It was observed that the walls with parameters near the travel speed limits presented higher SWindex. This operational map was further validated (fourth stage) by selecting a target LW and finding corresponding three parametric set (covering the whole range of operational map) to produce walls on which geometry characterization was carried out. After geometry characterization, obtained LW was compared with the target LW (the maximum values were very tied, with deviations from +0.3 to 0.5 mm), with a SWindex deviation at the order of 0.05. Both results evidence high reproductivity of the process, validating the proposed methodology to parametrize WAAM.

1. Introduction

Wire + arc additive manufacturing (WAAM) belongs to the class of direct energy deposition (DED) processes with potentially higher deposition rate amongst the group. WAAM generally (not always) is an extension of gas metal arc welding (GMAW) process in additive manufacturing (AM) field. GMAW based WAAM process, also known as ‘gas metal arc additive manufacturing’ (GMAAM), uses the same welding setup as used for GMAW. The only difference is in the application of the process. GMAW used for joining whereas WAAM is used for layer by layer deposition to make functional part [1].
The process, material, and equipment of WAAM are relatively inexpensive. Hence, WAAM becomes competitive with other production methods which were conventionally used [2] and could be used as an alternative due to design freedom and customization. WAAM is competitive with other AM processes as well. Milewski [3] found that WAAM processes are advantageous over powder-bed fusion (PBF) processes because the part size is not constraint due to the build volume (as in case PBF due to powder bed), WAAM can generate minimum part size of 1 m whereas PBF processes are limited to part size of 0.4 m. Higher deposition rate is possible with wire- based AM processes. Also, the process operates at variable power (kW) levels, so a variety of materials can be manufactured. Ding et al. [4] found that the processes based on wires are successfully used in the aerospace industry to produce high value structured components of lengths in meters.
The potential high deposition rate of WAAM can be efficaciously used to manufacture and repair functional components. To manufacture functional components out of WAAM, the first requirement is to reach near net geometrical and shape of the build, considering the costs to redress the built part. As-built parts produced by WAAM have inherent lateral surface waviness (undulated surface), hence post processing is often required to eliminate this lateral surface waviness [5], i.e., to remove the extra material in such a way that all the surfaces turn evenly flat. Post-working costs must be mitigated to make WAAM manufacturing competitive with other subtractive or forming methods. The amount of this extra material which leads to lateral surface waviness varies from one parametric set to another and can be reduced by selecting a parametric set which produces minimum residual material.
Although higher deposition, WAAM has limited use in the industry due to complex parametrization, geometrical inaccuracy (compared to PBF processes), and requirement of post operation to obtain flat surfaces of the component which is an additional cost required for production. Due to these disadvantages, only low to medium complexity parts can be manufactured using WAAM [3,6]. Ding et al. [4] found that with the increase in deposition rate the surface roughness increases. Therefore, somehow different from welding operations, WAAM parametrization is critical for the shape and dimensions tolerances; in welding, the pool is almost molded by the groove. In addition, WAAM parametrization is not a popular subject in current literature to start a parametrization from scratch. Parametrization of WAAM is a difficult task, because multiple parameters are involved and parameters are inter-dependent on each other, making overall process complex.
An approach to study WAAM would be through operational maps. Operational maps have been used as a military term to show the location and strength of friendly forces involved in an operation. With operational maps, officials can foresee movement and location of enemy forces. In welding, operational map has a similar meaning, but rather than being geography related, a welding operation map covers a combination of parameters. It also shows locations of strength (parameter combinations that lead to sound welds) and enemies (parameter combinations that lead to welds with imperfections).
The objective of this work was to propose and access a methodology to raise operational maps and working envelopes from scratch as a means of selecting current (Im) and travel speed (TS) for reaching target wall layer widths (LW) with the desired and possible surface waviness. The strategy of parametrization will rely on attaining process conditions, which avoid poor surface quality of the wall [7,8] (avoiding humping effect and material flow beyond the substrate wall explained in Section 3).

2. Methodology, Materials, and Equipment

The methodology to develop this work is based on experimental construction of an operational map, i.e., a graph between travel speed and layer width (for specific values of current), schematic of the same is shown in Figure 1. Although this methodology can be applied to any wall layer width (LW), the case study will be to consider thin layer widths (< 10 mm), i.e., one straight run per layer depositions (no oscillation).
The workable range (working envelope) is a region within an operational map presenting a proper balance between imperfections (no) and production time (lowest). Imperfections in this work mean lateral surface waviness, top surface undulations or humping caused by high travel speed (TS). Lateral surface waviness, a less popular term for WAAM imperfections, can be described as follows: This imperfection is characterized by an undulation aspect of the wall lateral surface between each deposited layer. This imperfection takes place generally because the process physics is insufficient to prevent the pool volume from deforming (squash down) beyond the sidewalls before solidification. Lateral surface waviness can also be assessed by visualizing the wall cross sections.
It should be noted that he accumulation of lateral surface waviness and deviation of the actual built part width to the target width will lead to the volume of material that must be machined before getting the final part. This can be referred as buy-to-apply factor in parts not applied to aerospace (case in which buy-to-fly factor is used).
This working envelope will be means of selecting average current (Im) and travel speed (TS) for a given target layer width (LW), as suggested in Figure 2.
Selection of parametric sets for a given target LW from the operational map can influence various characteristics of the walls, such as:
  • Less material to be removed;
  • Higher mechanical properties;
  • More robust condition;
  • Fast production.
These effects can occur because of the chosen process parameters from the different region of the operational map and can be hypothesized as shown (Figure 3) with the corresponding numbers.
It is possible that the process parameters can greatly influence the various factors and one should analyze these factors for a target LW in order to make informed decisions. For this work, excess material to be removed was considered as a case study’s target.
The work methodology was based on various stages, as follows:
  • The stage ‘mock design’: with the objective of finding, without experimentation, a rough operational map (first approximation operational map) to visualize the expected map and reduce further number of experiments;
  • The stage ‘pre-requisite for realistic operational map’: with the objective of determining the actual WFS, Im and deposition rate (second approximation operational map) and the operating limits of Im and TS towards a second approximation working envelope;
  • The stage ‘realistic operational map’: with the objective of raising through a systematic design of experiment the actual working envelope;
  • The stage ‘operational map validation’: with the objective of finding corresponding three parametric set (covering the whole range of operational map) to produce walls according to a target wall width.
Still concerning methodology, the three commandments proposed in Yehorov et al. [5] were applied to reach the parameter ranges, which, in summary, are:
  • Arc pressure should be minimized to avoid pool lateral sag (CMT with low mean current values was employed);
  • The pool should present a proper volume for a given deposition rate and current, i.e., a too small pool volume means low heat transferred to the prior layer, and a too large pool is prone to run downward (a range of TSs for a given current that would lead to proper pool volumes was determined);
  • The material underneath each layer under deposition should be as cool as possible, so that the heat transfer through the built wall becomes easier (room temperature was adopted as the interlayer temperature, even at the expense of long production time).
The experimental setup is as shown in Figure 4. The process used in this work was the CMT®, which is an advanced process with wire feed control and usually employed for WAAM. This process was developed by Fronius in order to perform welding with colder melt pool [9]. This characteristic is reached due to small arc length (low arc pressure) and short arcing time. The torch manipulator used for this project was a commercial welding robot. For cooling the walls after each layer deposition and achieve inter-pass temperature as room temperature as fast as possible, compressed air aided by a vortex tube was employed.
As feedstock, a high-strength low-alloy (HSLA) steel wire was used (OK Tubrod 14.03 by ESAB, which is a metal cored consumable). Zidong et. al. [10] has shown that the metal cored wires have great applicability in WAAM. The contact tip-to-work distance (CTWD) was arbitrarily kept constant at 16 mm, aiming keeping a good balance between melting rate and average current. The wire entered the pool perpendicularly. On the other hand, the shielding gas should lead to relatively colder melt pools in order to reduce the heat input. To accomplish this, a shielding gas mixture used was 95% Ar + 5% CO2. Low percentage of CO2 was used in order to reduce the heat input [11], as expected by the commandment number two.
Usually substrate is kept such that the surface of greater area rests on the ground (or worktable), configuration that makes the flexural rigidity much lower. Therefore, a proper substrate was also devised to carry out the experiments and achieve the objectives. The proposed configuration of substrate is illustrated in Figure 5 (the layers are deposited on the upper edge). This option considered a high flexural rigidity of the substrate, so that distortions due to heat would be limited. In addition, with a substrate thickness close enough to the layer width(s), the heat flow through the first layer and subsequent layers would remain constant up along deposited layers. Otherwise, if the substrate is wider and one wants to build target layer thickness, then a greater number of layers would be required to build so that steady state heat flow is attained (less economical).
To attain the condition of having a same heat flow through the subsequent layers, the substrate thickness should be as close as possible to the target layer width. However, according to this methodology, the substrate thickness required to build the layers for the experiments could be extracted from the operational map. Nevertheless, to raise the operational map one needs the substrate thickness (a chicken and egg story).

3. Results

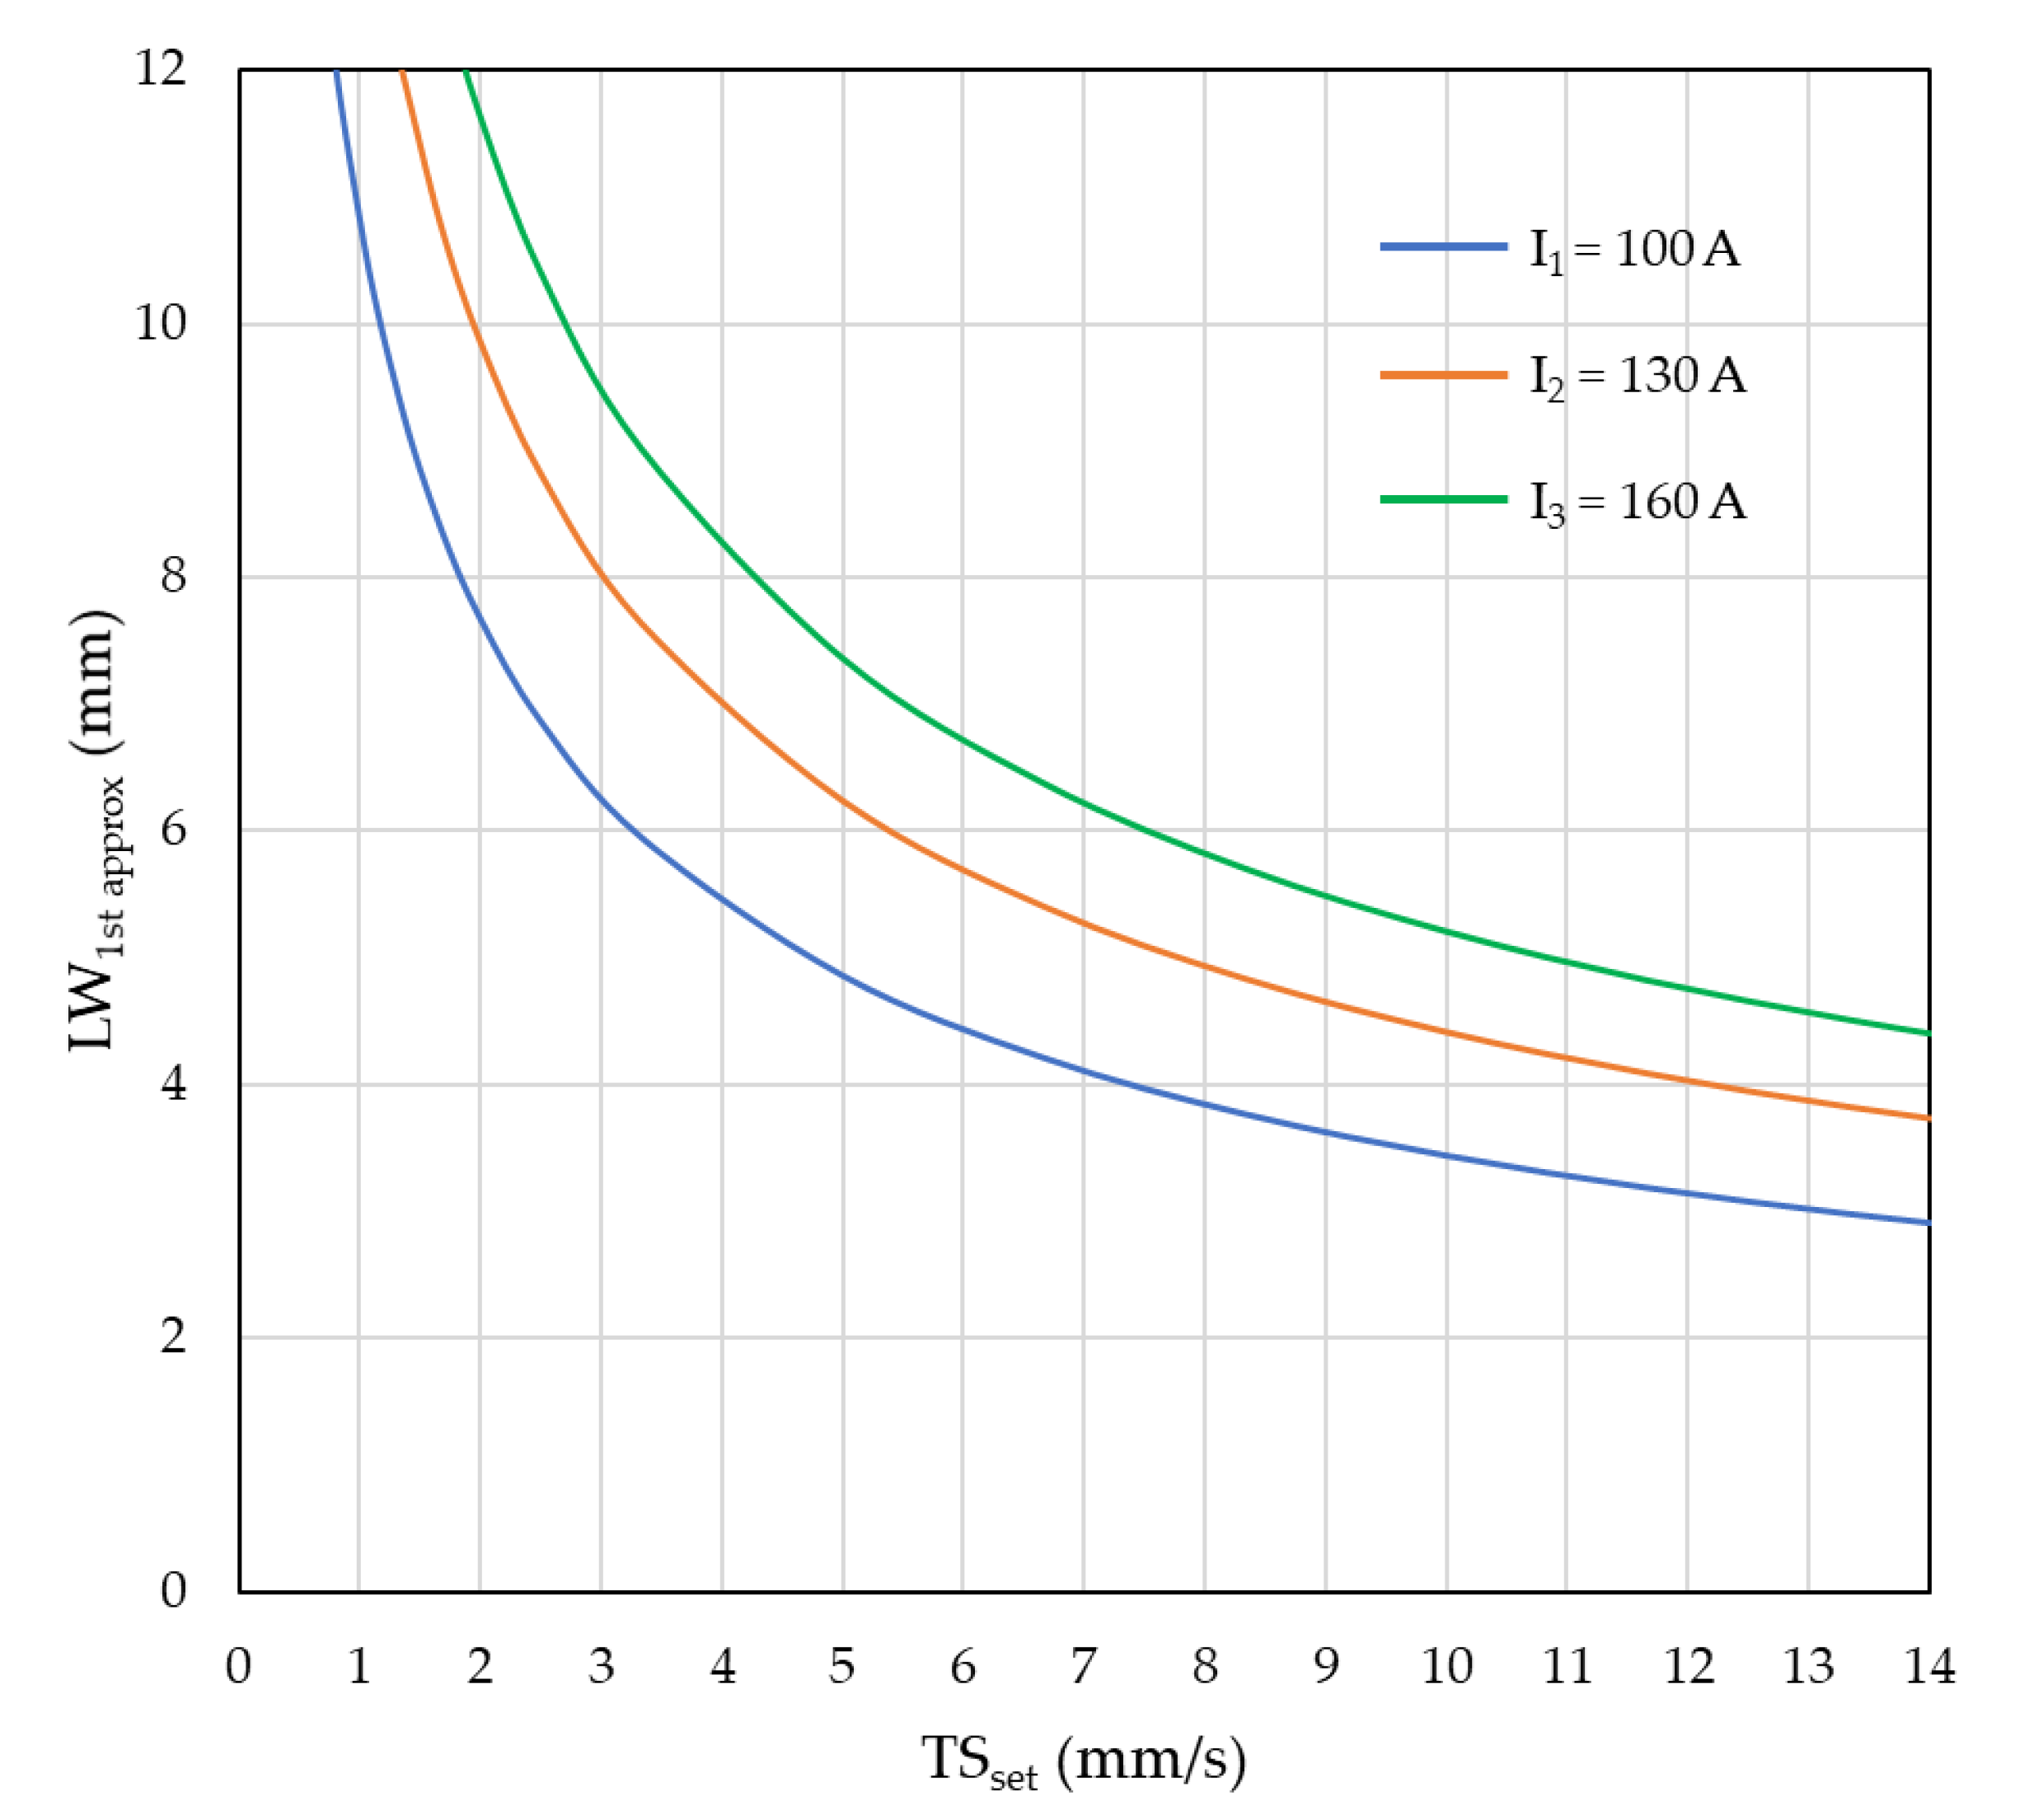
3.1. Mock Design of Operational Map (First Approximation Operational Map)

Aiming at visualizing the expected map without experimentation, firstly the relation between travel speed (TS) and layer width (LW) for different currents was formulated. However, at this stage the determination of neither the actual layer width as a function of the TS nor the deposition rate (DR) of the wire as a function of current (Im) and the contact tip-to-work distance (CTWD) was available. To reach this relation, a nominal deposition rate as function of current can be achieved, for instance, from the product data sheet of the feedstock wire, as presented in Table 1. The objective of this approach was to save time in relation to the determination of these parameter relationships from scratch in a potential and unknown large range. With the aid of interpolation, the figures in Table 1 were obtained for the 1.2-mm-diameter wire.
Arbitrarily, three current levels were chosen for defining the operational map, i.e., 100, 130, and 160 A. Hence, the corresponding DR were calculated using interpolation from the product data sheet, as shown in Table 2.
There were two assumptions considered in this approach to find the layer widths as a function of travel speed, as follows:
  • The cross-section of the deposited layer is assumed to be semi-circular;
  • The density of the material is constant through-out the material and assumed to be same as that for steels.
The relation between travel speed (TS) and layer width can be found out as follows:
  • Let,
s = DRd TS   { kg / mm }
where ‘S’ represents mass of the feedstock material deposited per unit of substrate length (just for simplification) and ‘DR’ is the deposition rate for a given current level.
2.
At the same time, let,
A = S ρ   { mm 2 }
where ‘ A ’ is the area of cross-section of the layer, assumed to be semi-circle (Equation (3)) with a determined radius (r).
A = π × r 2 2
3.
The cross-section radius (r) would be half of the layer width (LW) and is calculated after equating Equations (1), (2) and (3), that is
r = 2 × DR π × TS × ρ
  • The layer width (LW) in millimeters is reached through Equation (5).
LW = 20000 × 0.00106 × DR TS × ρ
where DR is in kg/h, TS is in cm/min and ρ is in kg/m3.
The TS × LW relationship obtained above is used to plot the graph for travel speed ranging from 0 to 14 mm/s for the three values of current 100, 130 and 160 A, as shown in Figure 6. Considering the assumptions (shape of the layer) and values uncertainties (DR), this resultant map from the ‘mock design’ stage was called ‘first approximation operational map’. It is important to mention that Figure 6 is an operational map and not a working envelope, since there is still no clue if the area inside or outside the lines are operational (proper to work) or not.

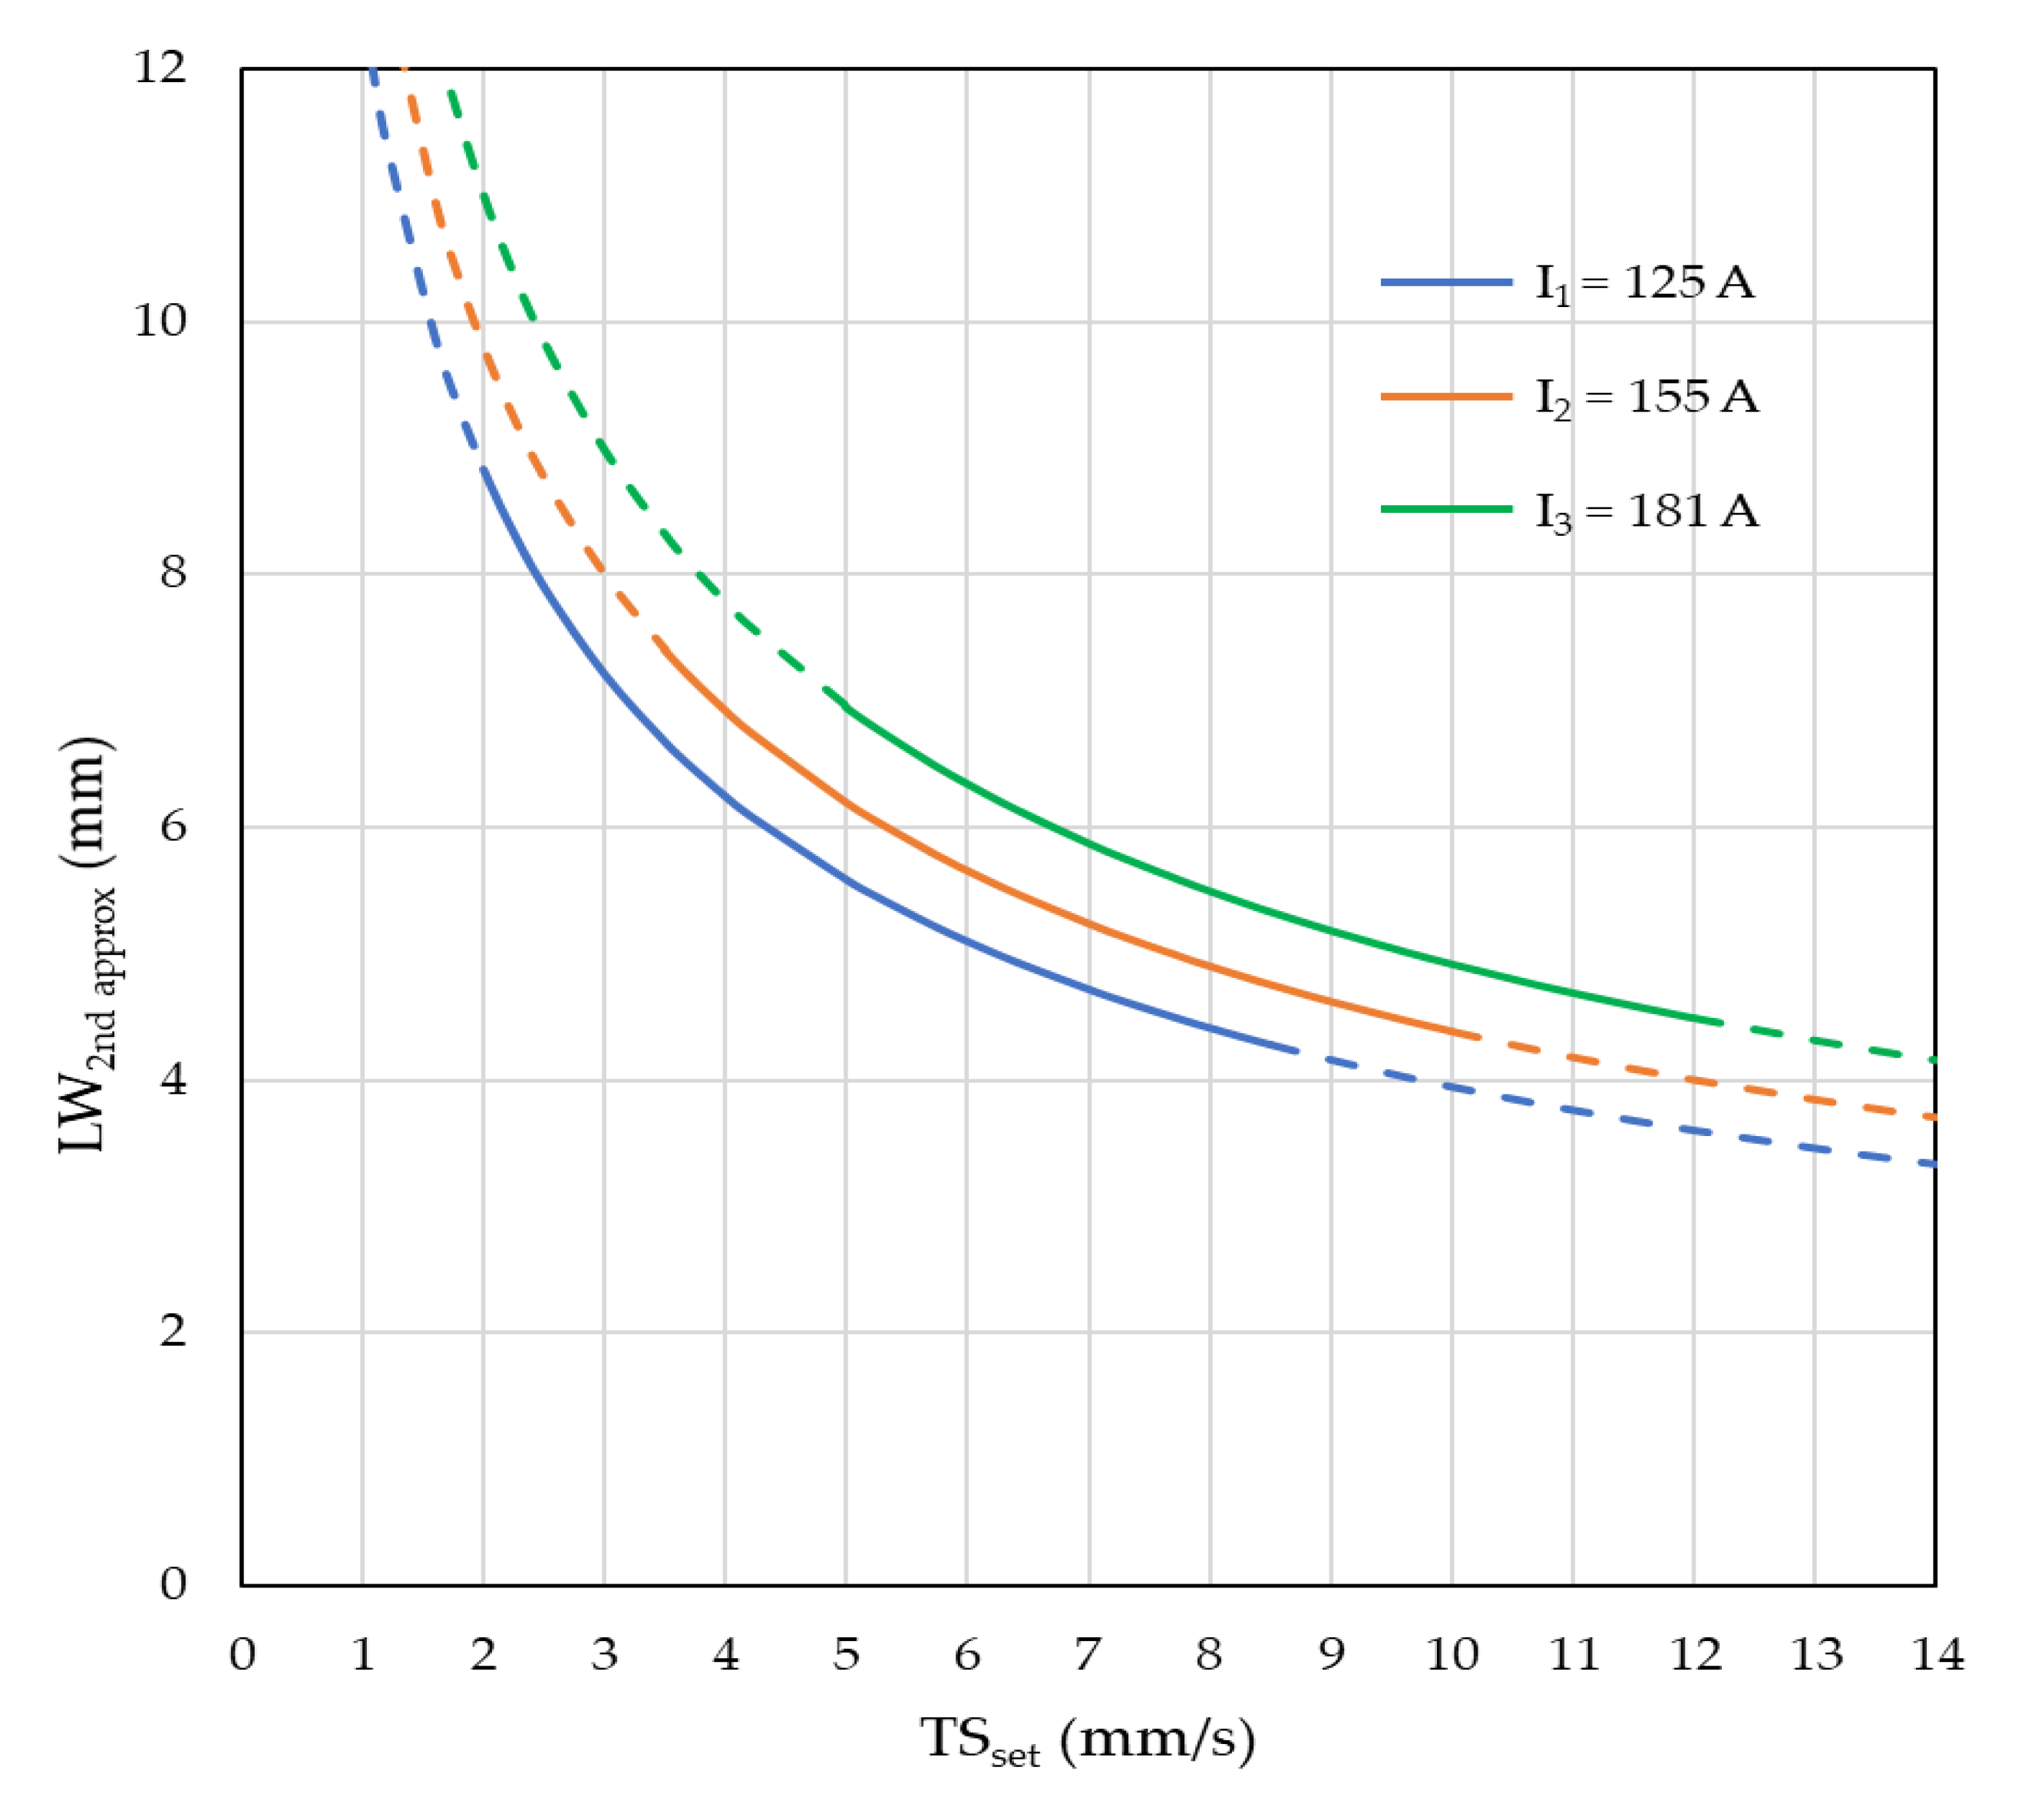
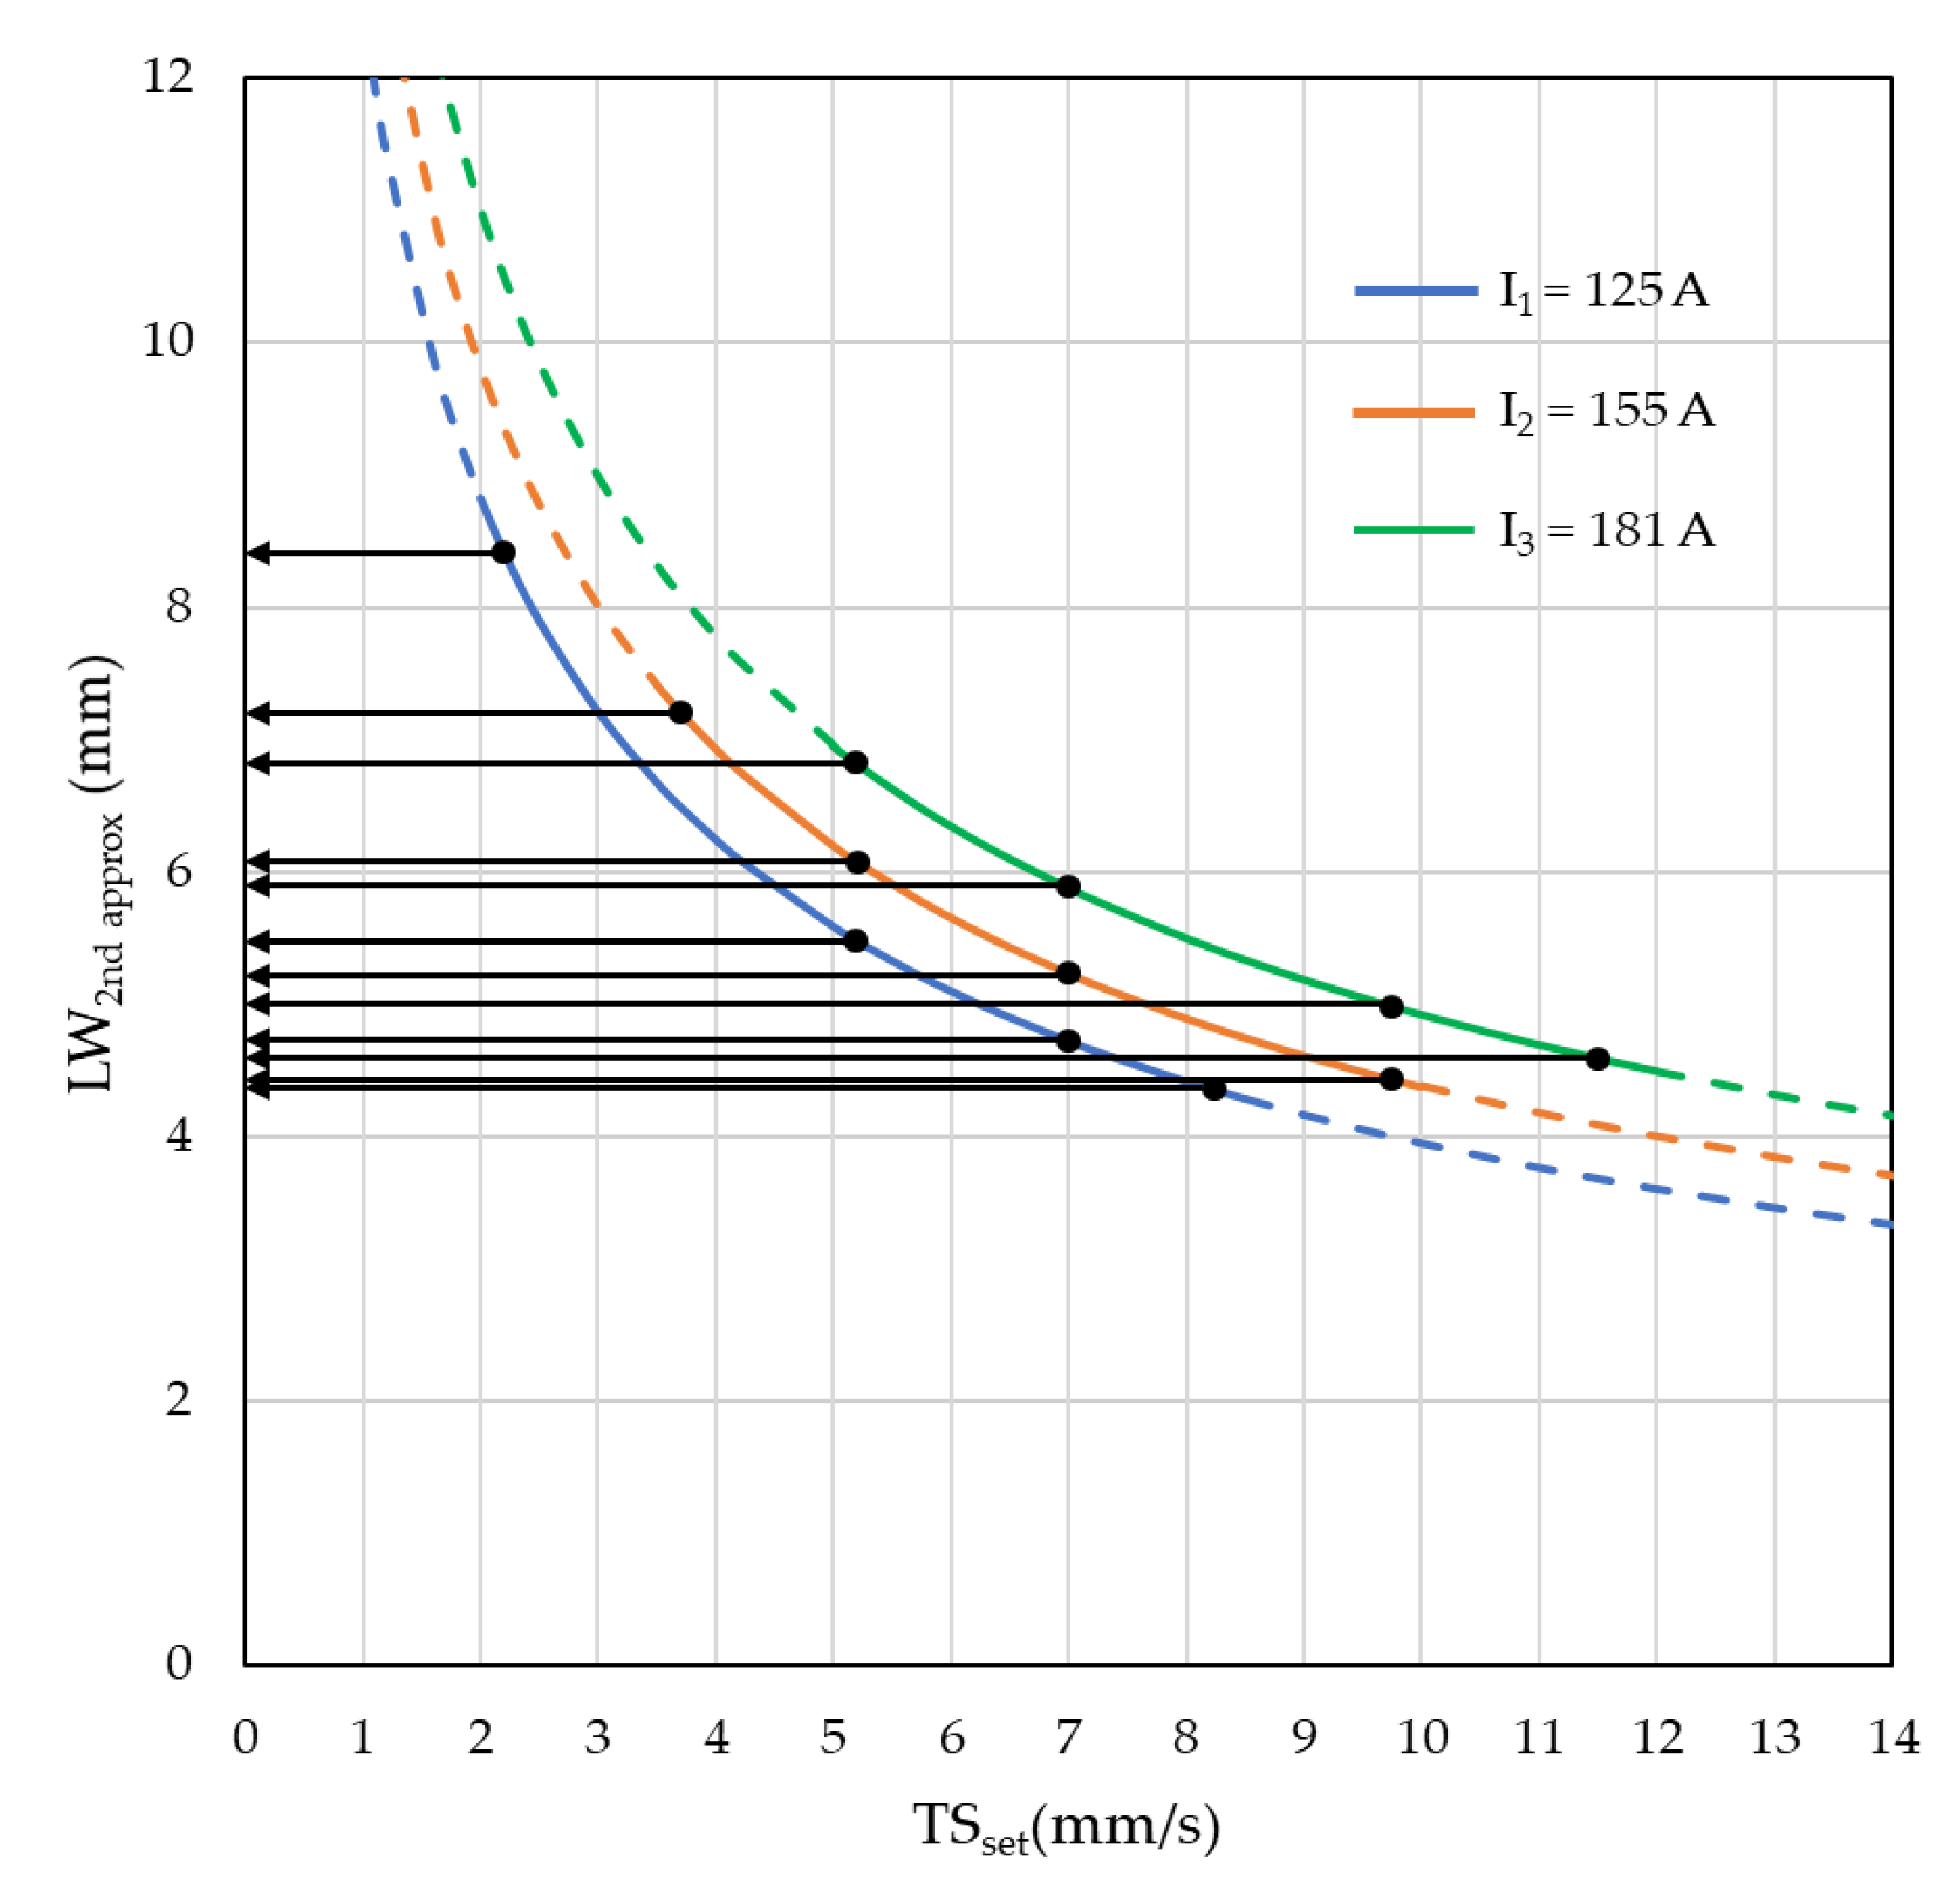
3.2. Pre-Requisite for Realistic Operational Map (Second Approximation Operational Map) and for the Operating Limits of Im and TS (Second Approximation Working Envelope)

The first approximation operational map (Figure 6), as suggested in the previous subsection, although allowing to visualize the geometric trends of the layer widths (LW) as a function of the operational parameters (mean current (Im) and set travel speed (TSset) for a given process-consumable), is still very limited for this work purpose. The first limitation regards to actual values of Im and the limits of TSset, to attend the second commandment. Hence, some experiments were planned and carried out as follows.

3.2.1. Determination of Workable Current Range and Actual Deposition Rate

The objective of this work substage was to determine the workable current range in which one can operate the given process to meet acceptance criterion based on geometry of the beads deposited. The proposed acceptance criterion in this stage was to have no top surface undulations (surface bumps) caused by lower current and relatively higher travel speed [7,8].
Several bead-on-plate depositions (single beads-one layer) were carried out on a plain carbon steel substrate (178 × 75 × 6 mm). After finding a sound bead for a combination of WFS and TS, for each deposit, the set wire feed speed (WFSset), correspondently the mean current (Im), was increased. To keep the same deposition volume of the beads, the set travel speed (TSset) was proportionally increased. The most significant replicated data after exploratory runs is shown in the bead-on-plate deposits illustrated in Figure 7.
From Table 3, the workable I limits were defined as 130 and 180 A and, thus, the chosen currents (Imin, Imid, and Imax) within the workable range are 130, 155, and 180 A. As well known, the set WFS (WFSset) and the displayed average current are not the same as the actual values when CMT® is used, because the equipment self-adjusts the actual WFS for reaching the most stable condition, regardless the WFSset. To find the corresponding actual WFS and Im values, a calibrated procedure was applied. According to this procedure, bead-on-plate deposits were placed over clean plain carbon steel plates by adjusting the three values of WFSset (three beads per plate per each chosen current, as illustrated in Figure 8). The TS was also set for keeping the same deposition volume of the beads. Actual values of Im were acquired by a data logger for calibration purpose. As the plates were weighed before and after the bead-on-plate depositions, and as the time to deposit each bead was taken, deposition rate (kg/h) was determined to each target current (Table 4).
Following, for these Im values and using the calibrated WFS to reach these currents, actual DR were determined. By the actual DR in Equation (5), the second approximation operational map was obtained, as illustrated in Figure 9. One can see the change in position of Im values of the workable current boundaries when Figure 9 is compared to Figure 6, evidencing the importance of using actual values.

3.2.2. Determination of Workable TS Range

Travel speed (TS) is more sensitive than current (Im) concerning WAAM depositions. Therefore, instead of bead-on-plate depositions (one layer) to determine TS operational range, it was used a short wall composed by a sequence of WAAM single layers deposited over the substrate illustrated in Figure 5. Two acceptance criteria were used on visual assessment of the walls, as follows and illustrated in Figure 10:
a)
Accepted level of lateral surface waviness: caused by higher current and/or lower travel speed;
b)
No top surface undulations (humping like): caused by lower current and relatively higher travel speed [7,8];
The scheme followed to determine the workable TS range started from lower TSset to higher TSset, with progressive increase and keeping the interlayer temperature as room temperature (25 ℃). While doing so, the electrical signals were monitored. As the layer width decreases with each increment, two concurrent phenomena take place. First, the heat input is progressively lower, leading to faster cooling of the previous layer. Second, a narrower wall restrains the heat flow through the layers, resulting in higher heat accumulation inside the layers and tending to reduce the cooling rates. The prevalence of one phenomenon on the other governs layer geometry and will mostly depend on the base material, arc energy, and starting wall width. This is the reason to run such incremental WAAM procedures: for every chosen workable Im, the initial TSset used was 2 mm/s and it was incremented by 1 mm/s up to the highest TSset is reached, which is confirmed by formation of top surface undulations (first acceptance criterion mentioned before). If the TSset is too low for a given Im (or for all Im), then, there will be material flow beyond the side walls (second acceptance criterion), so in this case the initial TSset will be increased. However, even if the initial layer is sound, then travel speed lower than initial TSset (2 mm/s) should also be checked so that the lower boundary of workable TSset can be reached.
With this procedure, experiments were carried out to determine the workable TSset for each workable Im, as shown in Table 5.

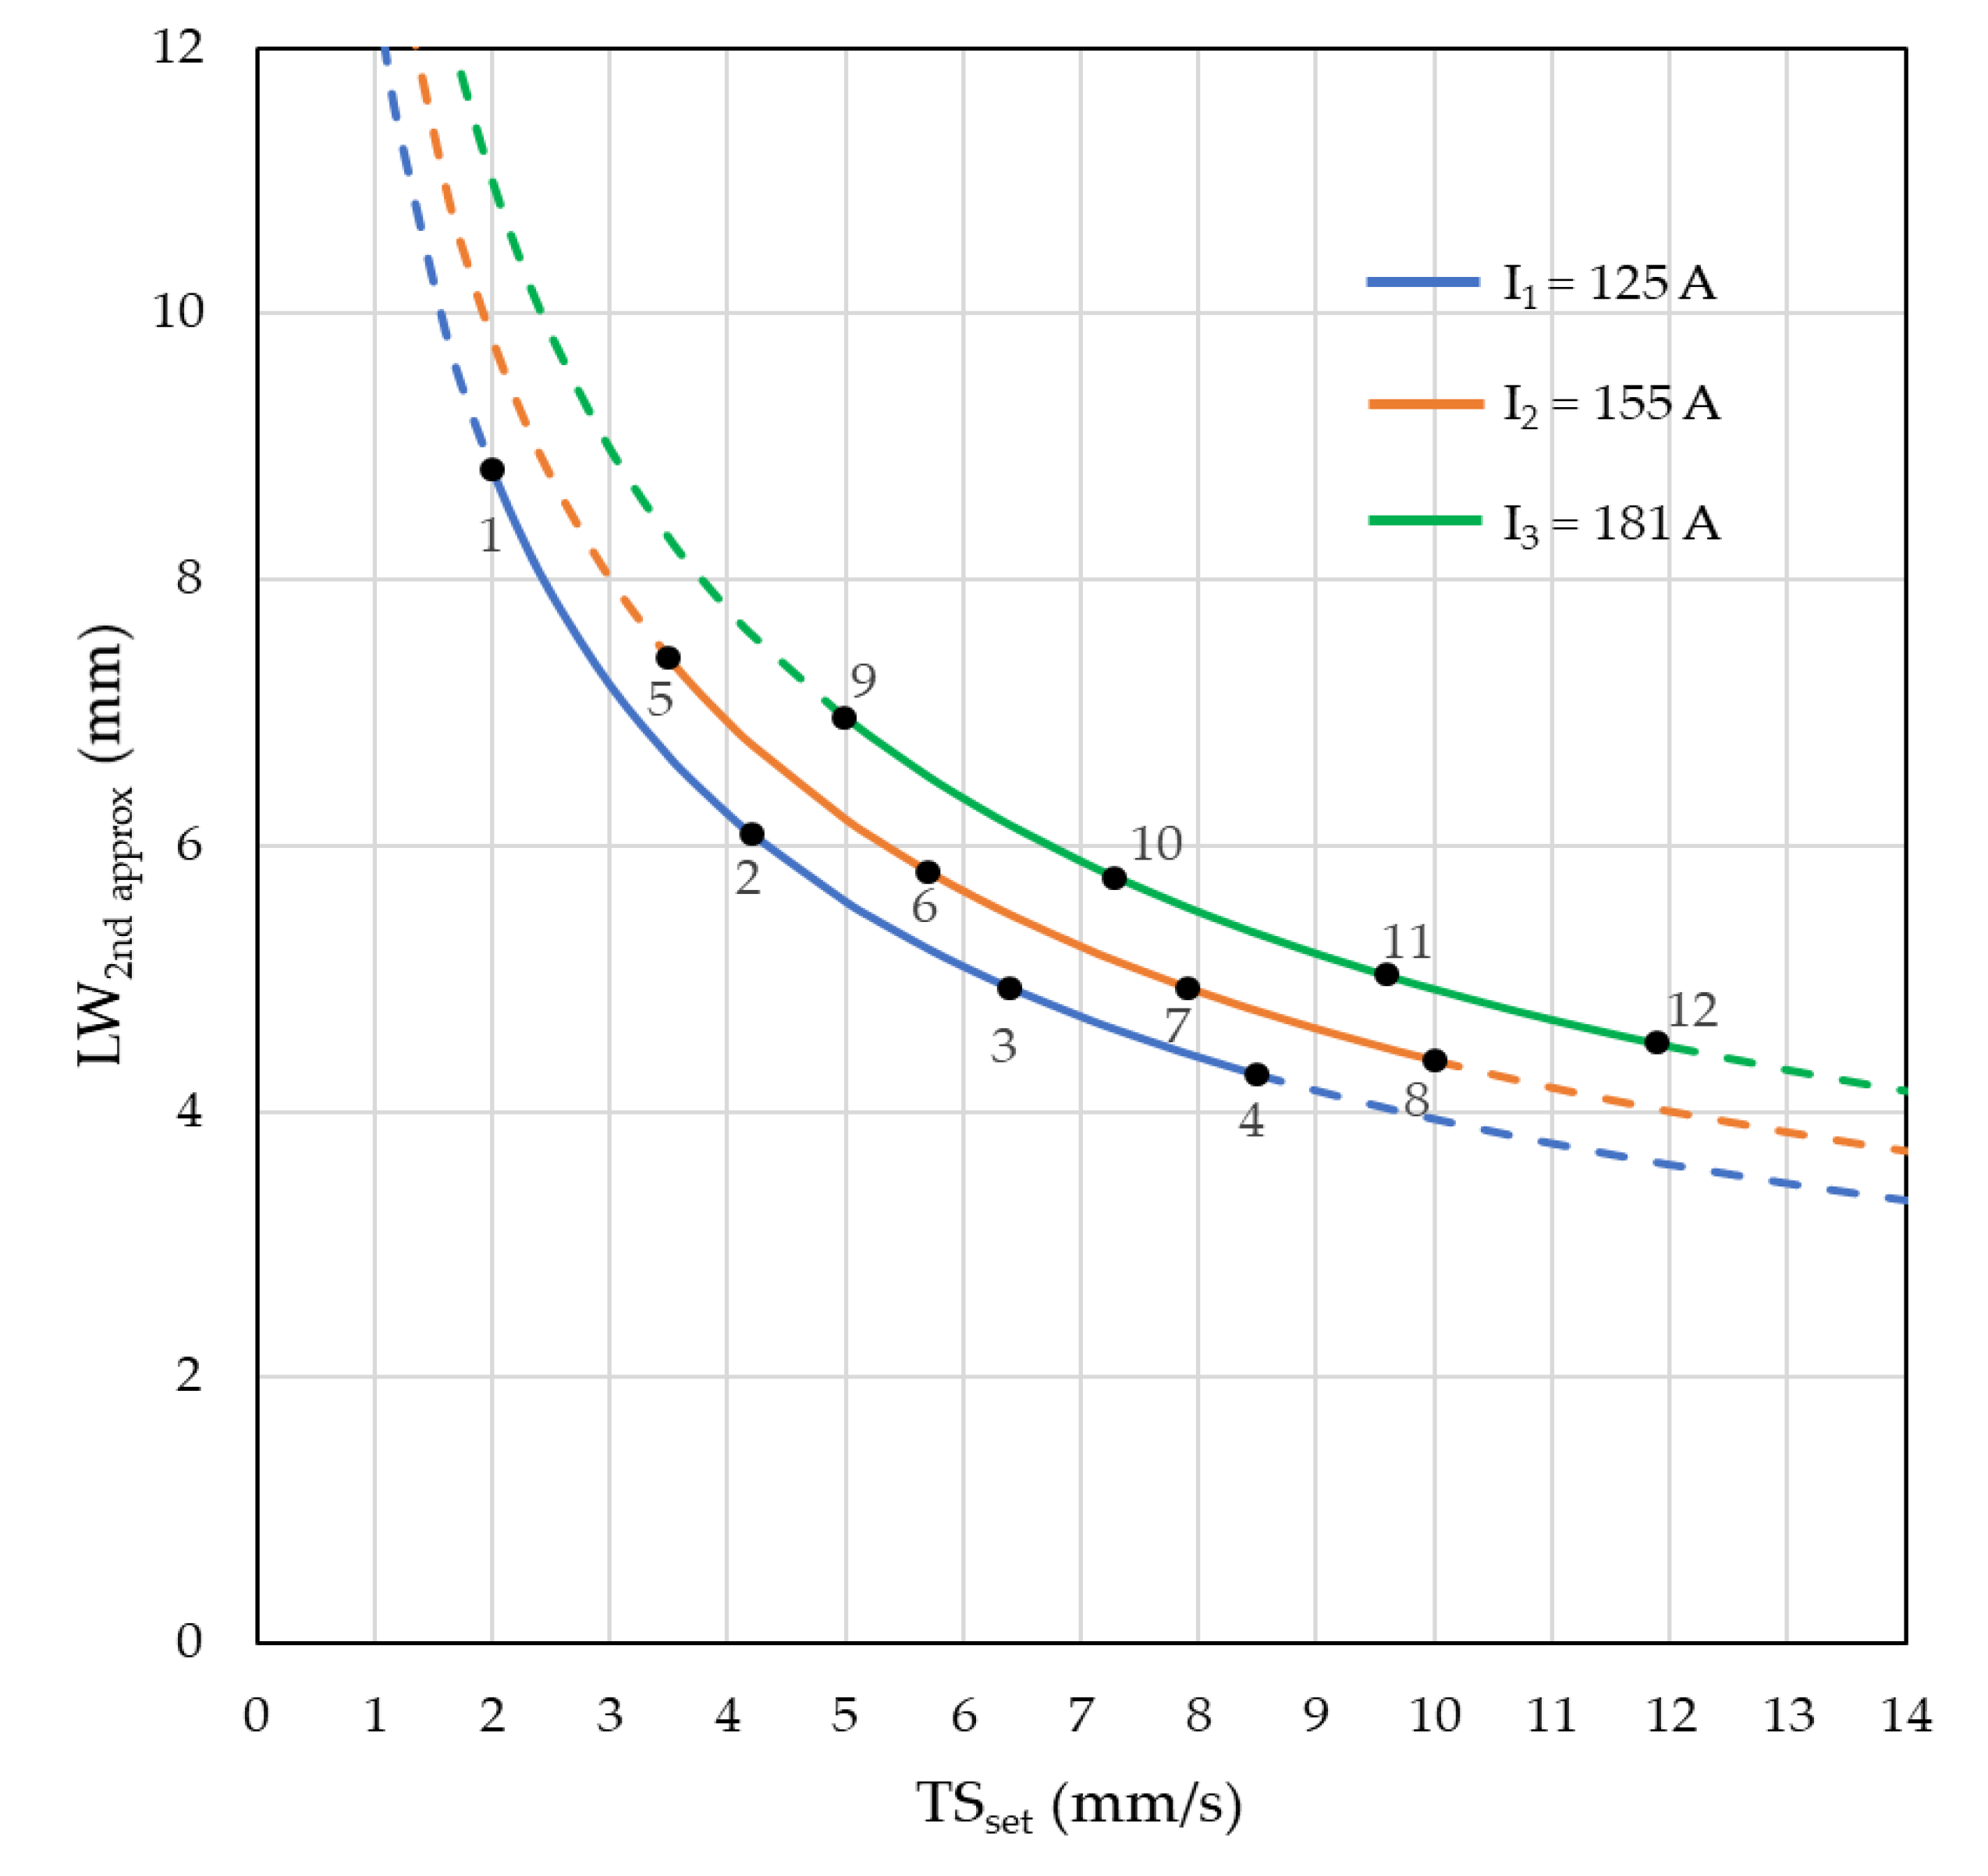
3.2.3. Second Approximation Working Envelope

Based on Figure 9, the second approximation working envelope would involve the whole area circumvented by the outside boundaries of current. Now, after having these constraints defined, one can change Figure 9 into Figure 11, which means to present the whole operational map taking into account the TS constraints. However, Figure 11 still represents approximations related to the layer geometry which are still estimated.
Therefore, more experiments should be performed to get the realistic values of LW and, hence, to get the realistic operational map and respective working envelope. This can be accomplished by choosing a systematic design for the experiments over the Im and TSset operational range presented in the second approximate operational map (Figure 11) and perform the experiments to find out the desired LW of the walls built.

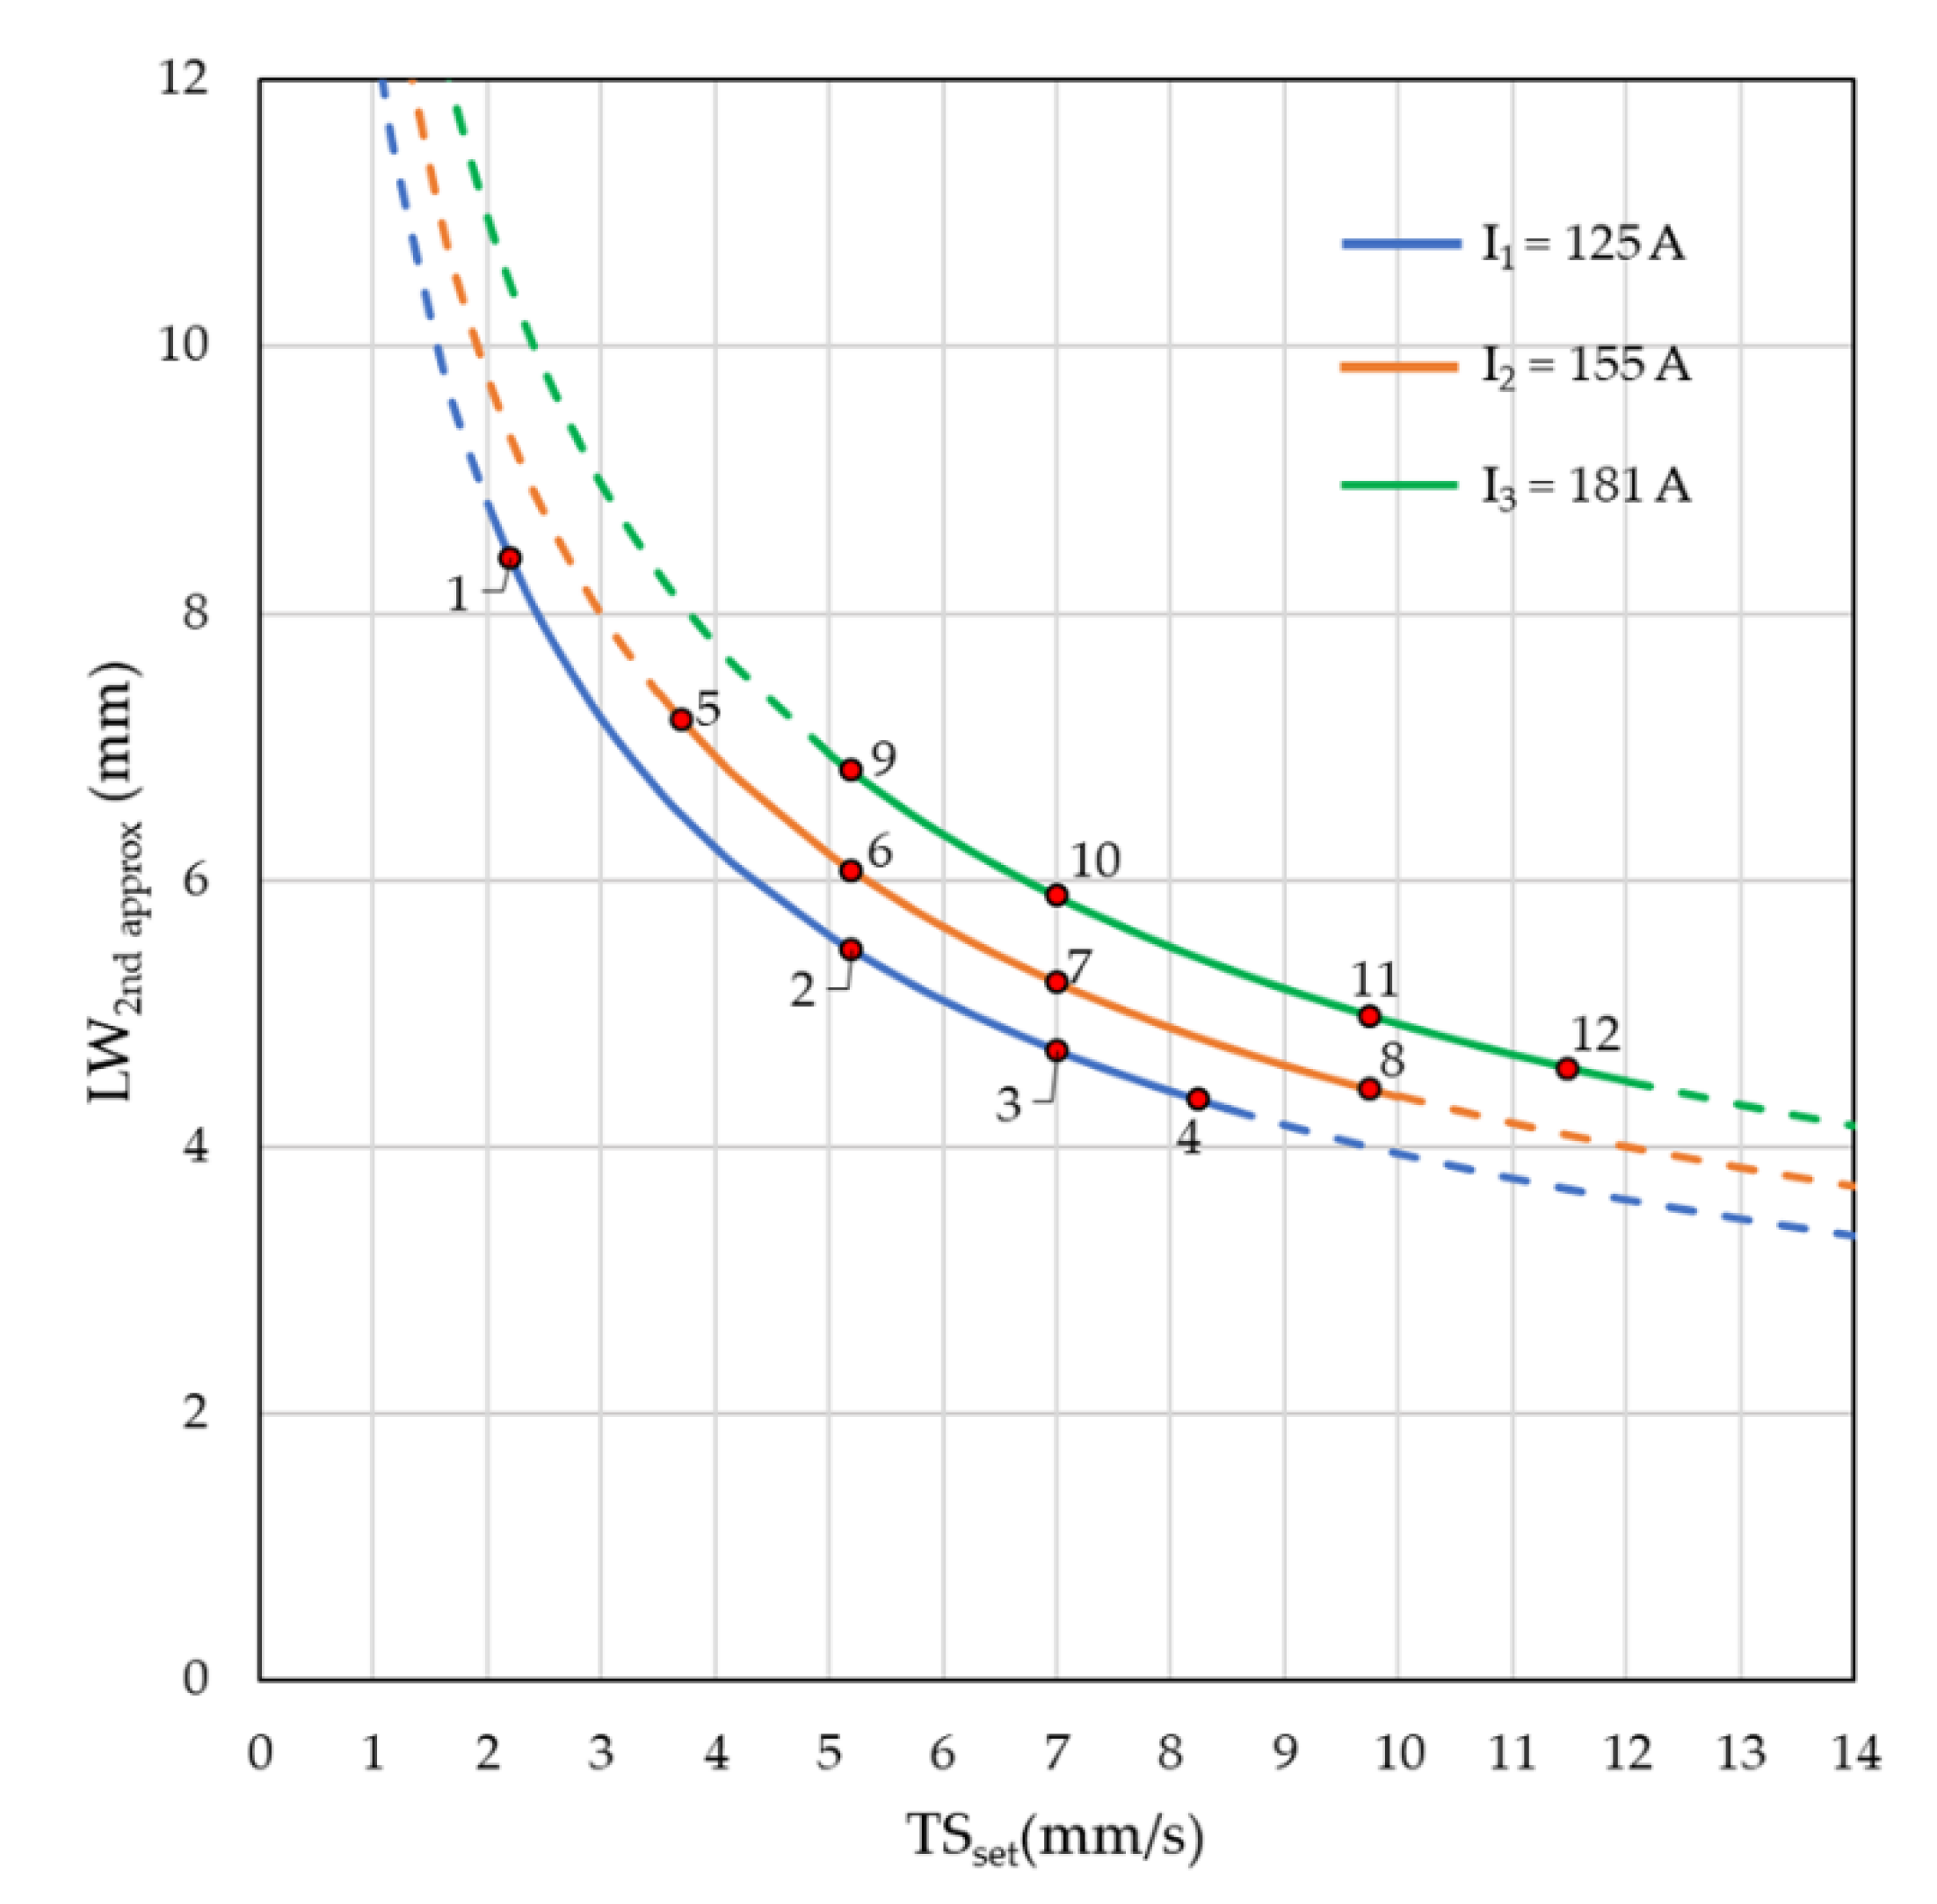
3.3. The ‘Realistic Operational Map’

3.3.1. Experiments for the Generation of the Actual Operational Map and the Working Envelope

The design for the experiments as planned used three blocks (one block representing each Im, i.e., Imin, Imid, and Imax.) rather a typical 31 + 41 factorial design, due to the dependence of the operating TS to the Im level (to avoid statistical bias). These independent variables were chosen because they govern the external layer width (response) during WAAM. Each experimental point was initially laid in such a way that four experiments for each Im were evenly distributed over the workable TSset range. Figure 12 represents the initially proposed design for the experiments.
However, the design of the experiments was further improved to reach the actual experimental set up in such a way that, for some of the experiments, the effect of different Im at same TSset could be observed. To do so, points of the final design were moved along the X-axis such that the points would align each other vertically and standing within the TSset range for each Imin, Imid and Imax as illustrated in Figure 13.
The process parametrization and experimental rig is the same as used in the last section. It is important to mention that Im is not set in CMT® power source, but Im is a consequence of other settings, governed by the WFSset if the other settings are not changed (then, Im was calibrated as a function of WFSset). The experimental matrix for actual design for the experiments is as shown in Table 6. All 12 DoE walls with defined procedures and parameters were built.
However, as mentioned before, the substrate thickness (ST), as presented in Figure 5, should be as close as possible to each LW, to keep a same heat flow through the subsequent layers and avoid bias in relation to geometry. Still using the second approximation operational map, we can predict from 9 to 10 different substrate thicknesses to match the 12 experiments (see Figure 14).
To pick several plate thicknesses, or to machine thicker plates to the required thickness, in order to accomplish this requirement is costly, inefficient, and ecologically incorrect. Therefore, an alternative approach would be to start the deposition on a wider substrate edge with a LW larger than the target one. Then, subsequent intermediate layers would be built progressively with smaller LW, up to achieve the target layer, as illustrates in Figure 15. One can consider that a step of 1 mm for the intermediate layers from the start LW to the target LW would be sensible to keep the same heat flow. In addition, arbitrarily, one can consider it economically reasonable to have a maximum of six intermediate layers over a starting commercially available substrate thickness.
Following the above reasoning, the following procedure was adopted:
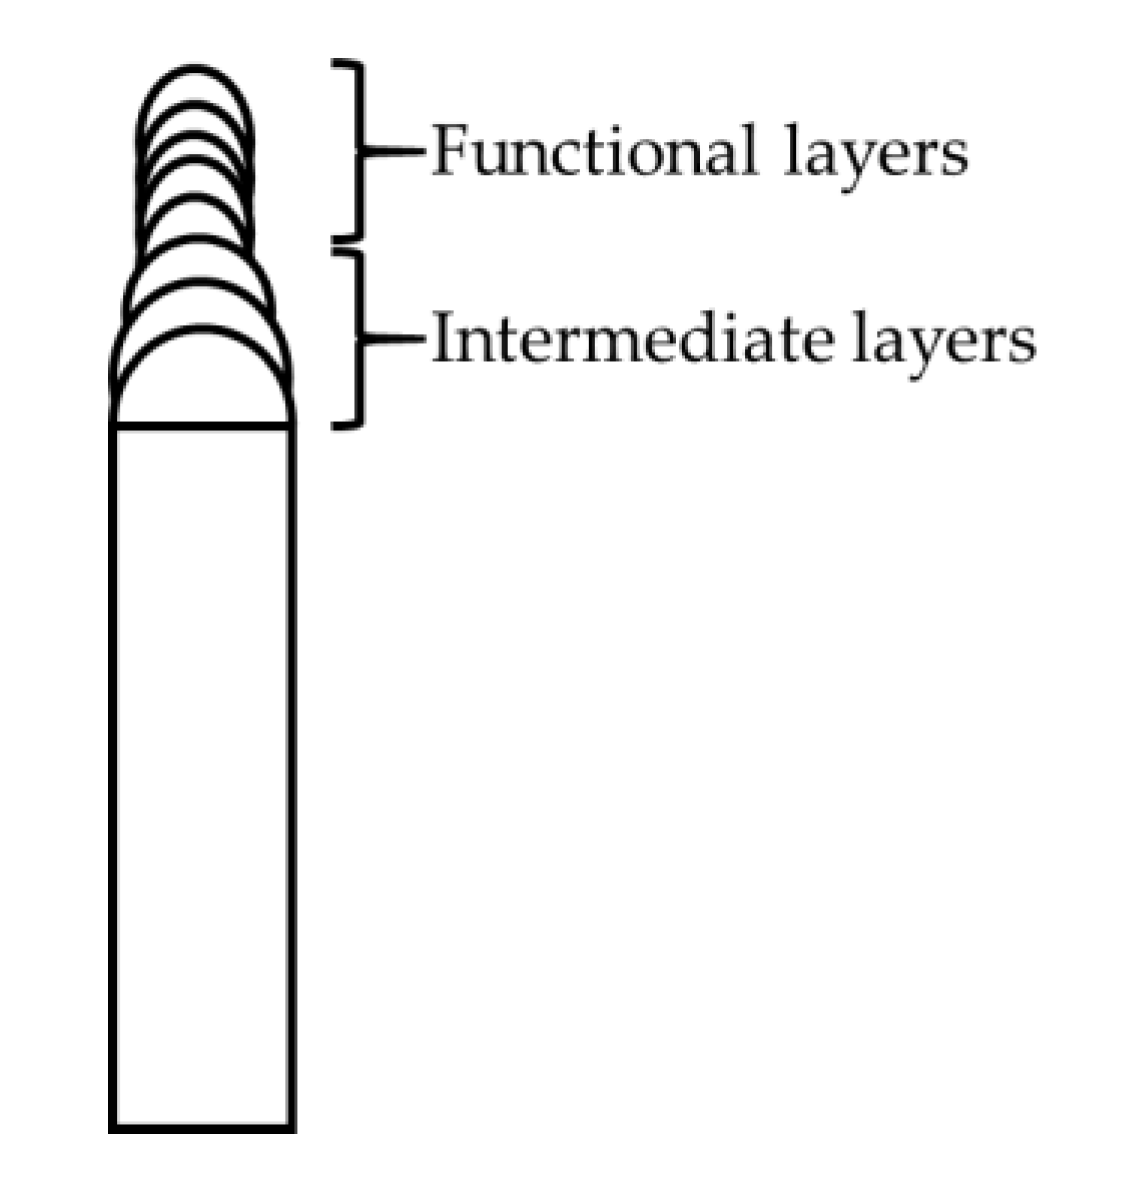
  • If the difference between the two-layer thicknesses (or substrate and layer thickness) in the experiments is less than 1 mm, then there is no need to have intermediate layers;
  • If the difference between the layers (or substrate and layer thickness) is between 1 mm and 2 mm, then one intermediate layer should be built;
  • For layer thickness differences greater than 2 mm, to use arithmetic progression. To do so, keep the difference between the layers as 1 mm (consider negative value while calculating because layer width value is decreasing) and calculate the number of intermediate layers by Equation (6).
a = a + ( n × d ) ,
where a’ is the target layer thickness, a is the initial layer thickness, n the number of layers built including previous layer or substrate width, d the layer width difference (= 1 mm);
4.
If ‘n’ comes out to be fraction, then approximate the value of ‘n’ to a higher whole number;
5.
Recalculate the layer width difference and determine the widths for each intermediate layer.
Table 7 presents the application of the approach of building up intermediate layers to get target layer width from a wider substrate. Considering the thickness of commercially available carbon steel bars, the number of substrate thicknesses reduced to one. The number of intermediate layers needed for each target LW is also presented.

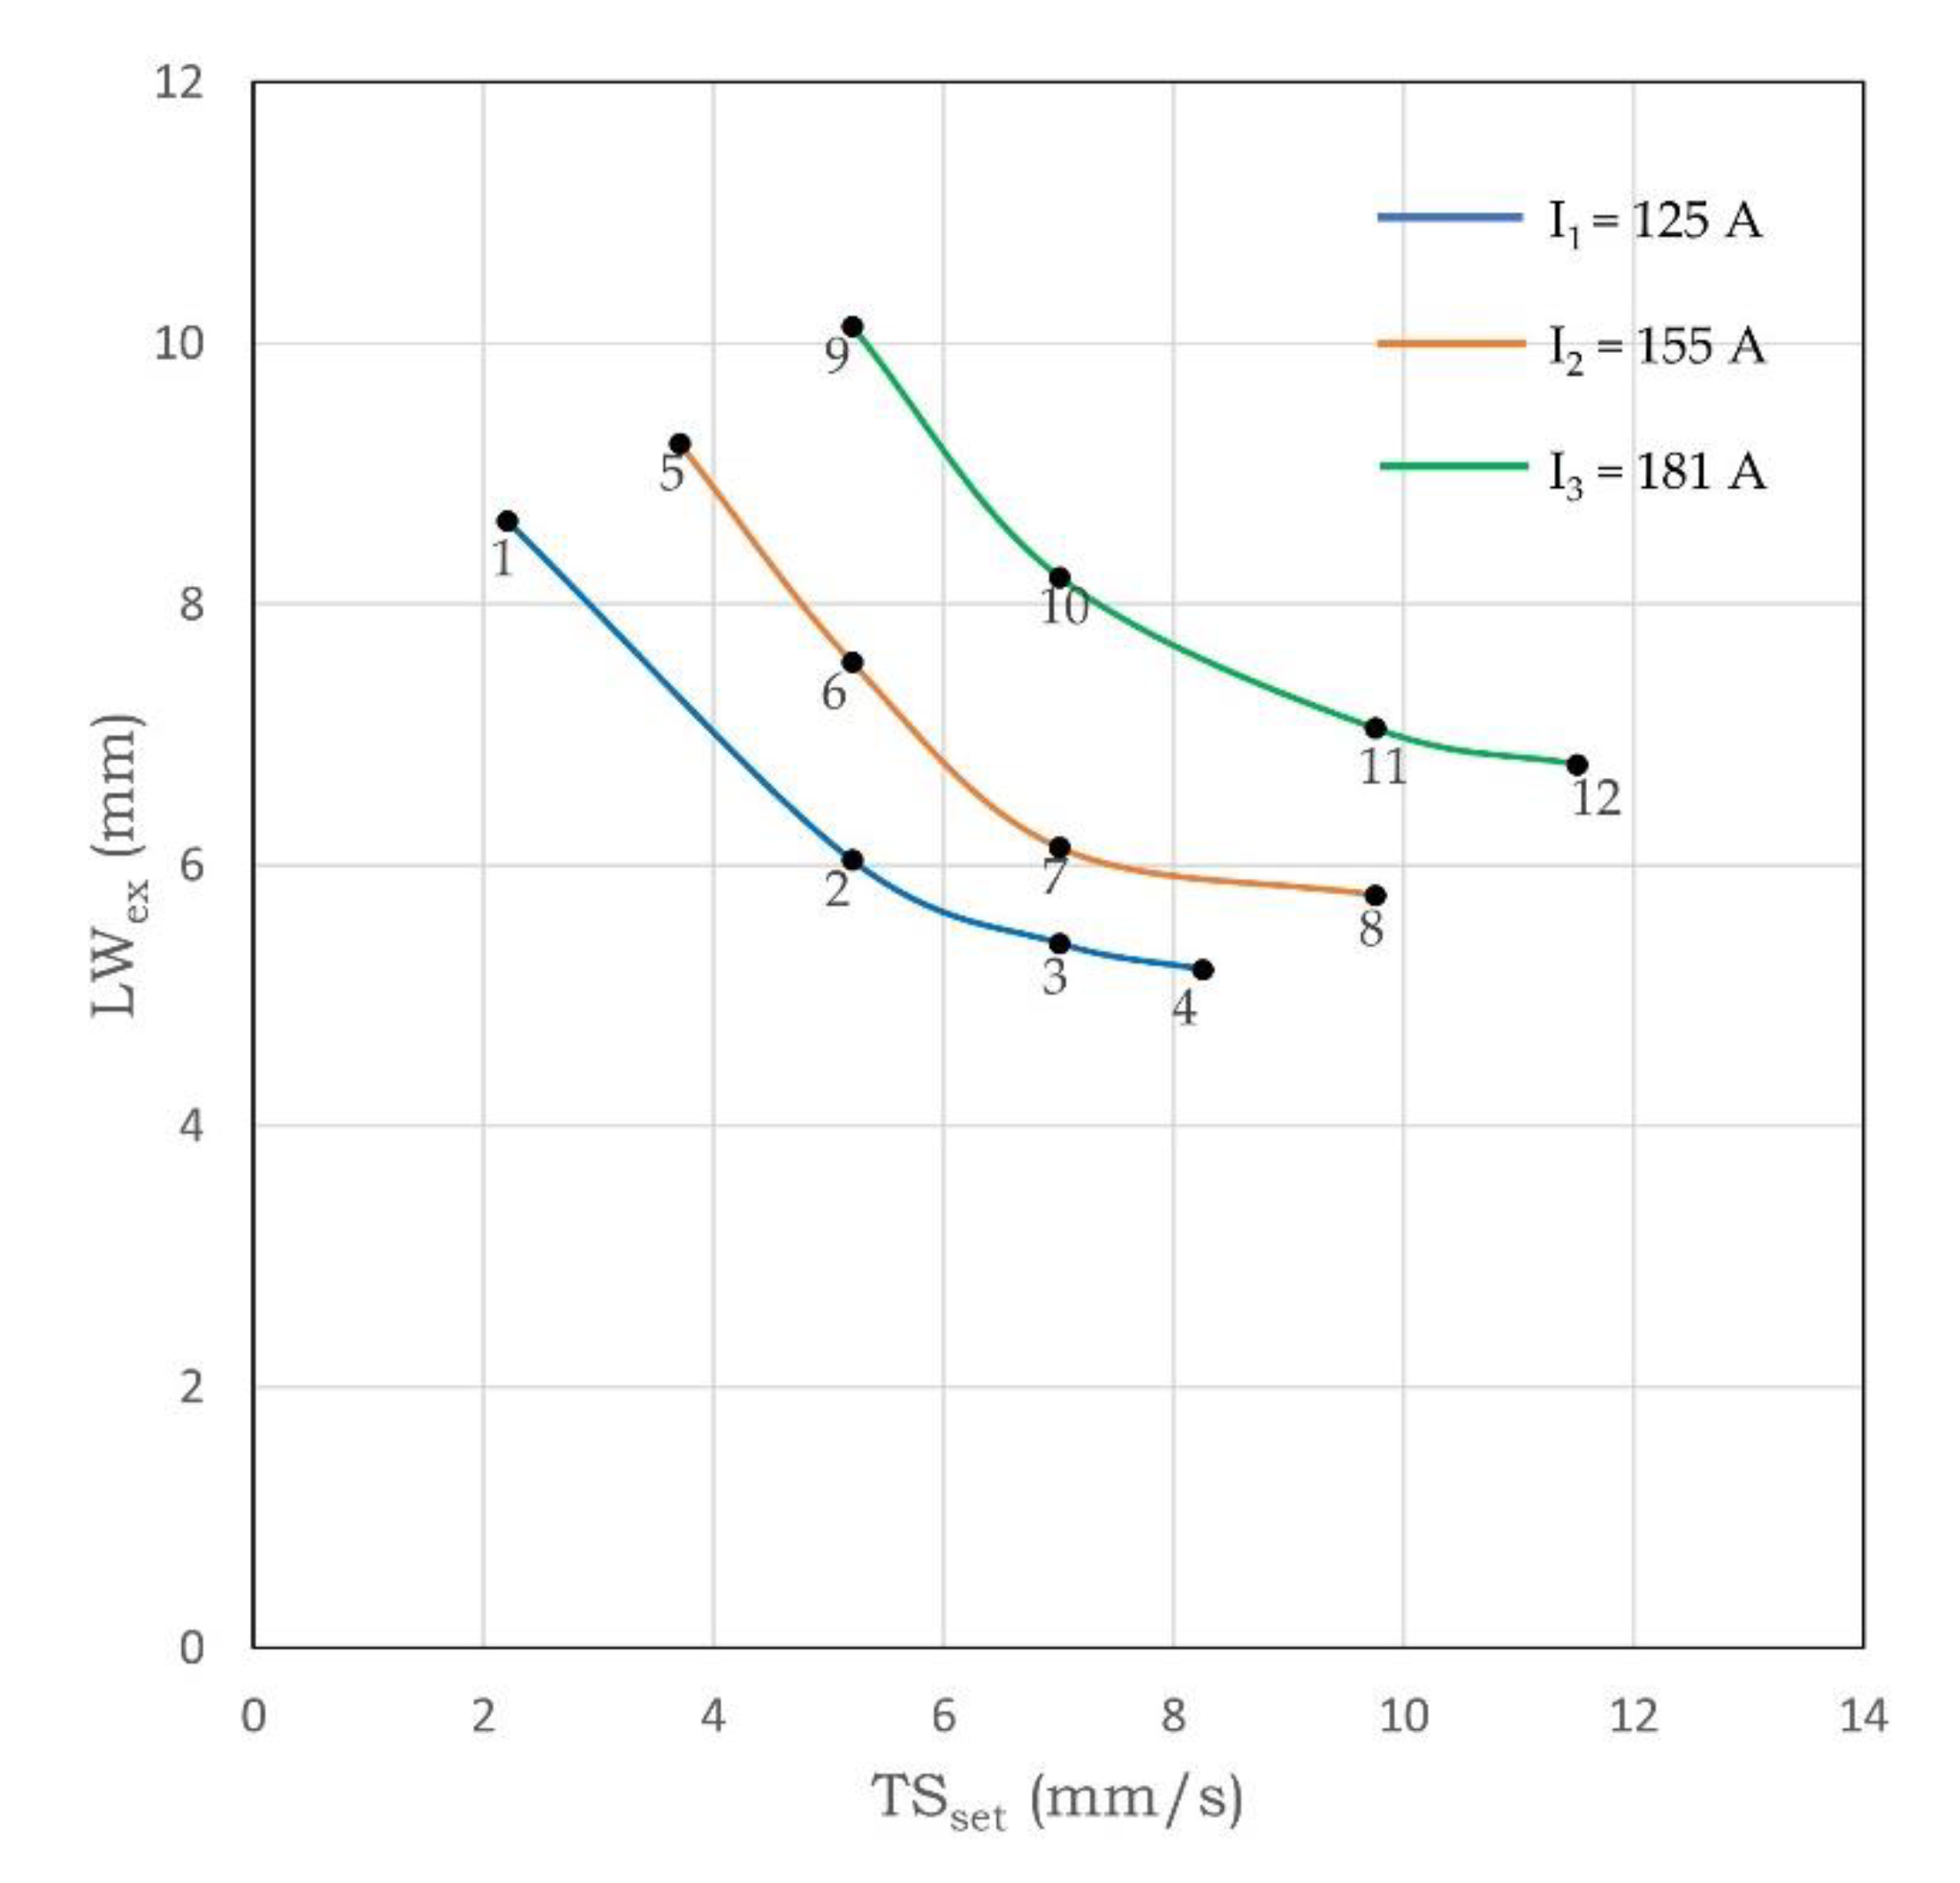
3.3.2. Experimental Responses and the Actual Operational Map

Walls produced by WAAM have lateral surface waviness due to which peaks and valleys are observed when one investigates the cross-section of the walls. Therefore, the response for this experimental design was the layer width (LW), considering that the other macro imperfections were not accepted. As indicated in Figure 16, there are two ways to quantify LW. The external layer width (LWex) is represented by the widest dimension, considering the waviness peaks of the cross-section wall. The effective LW (LWef), in turn, is represented by the narrowest dimension, considering the (waviness valleys) of the cross-section wall.
Table 8 presents the responses for each experiment, which are the average value of three cross-sections. It is important to state that only parameter combinations of the design for the experiments were assessed (within the working envelope, Figure 13). Therefore, the outcome from the response analyses are restricted to the area of the working envelope. However, if this actual working envelope is superposed on the entire operational map area, the meaning would be the same.
To depict the differences of operation maps using either the first approximation approach or the second approximation approach or the realistic map approach, Figure 17 demonstrates in just one graph how the positioning of lines would change when one moves from first approximation to second approximation and to actual operational maps (the response in this example was the maximum external, LW). The importance of having actual values are highlighted is shown, especially from the quantitative point of view.
As far as the working envelope is concerned, Figure 18 and Figure 19 shows the operational map for the two responses, the maximum external widths and minimal effective widths, respectively. As can be seen, the area within the Im and TS workable boundaries (defining the working envelope) is shifted down from external to effective LW, as expected (LWex is larger than LWef). For a same TSset (5 or 7 mm/s), the increase of Im presented an exponential (almost linear) trend towards layer widening. However, the remarkable is that the working envelope changes shape and area from external to effective LW, showing the influence of the pair Im and TS on waviness.

3.3.3. Waviness and the Actual Operational Map

Surface waviness is an inherent character of WAAM built walls. To analyze this character, surface waviness index (SWindex) is introduced which is an important parameter in order to analyze the volume of material to be removed during post-operation (time and cost related), according to Yehorov et. al. [5], amongst others. The higher SWindex, the more material to be removed. SWindex can be quantified as a function of maximum LWex and minimum LWef as by Equation (7)
SW index = Area   based   on   LW ex   -   Area   based   on   LW ef   2   ×   height   analysed
According to Equation (7), the SWindex for all the experimental walls were calculated and the results were plotted on the effective LW working envelope, as shown in Figure 20. The results demonstrated that the SWindex in the middle region of the working envelope is relatively lower than on the extremities of TSset (i.e., for samples 1, 5, and 12). The reason for this lies in the second commandment (refer to Section 2), which resulted in the criterion for selecting TSset range. As these samples (1, 5, and 12) have the TSset closer to the actual border of the working envelope (not totally searched during Section 3.2), so, consequently, these have more surface waviness and hence require maximum material to be removed during post-operation. Therefore, the SWindex also assumes the role of defining refined limit to working envelope. On the other hand, Figure 21 is a powerful visualization tool to identify the regions of minimal SWindex, as wished in WAAM production planning.

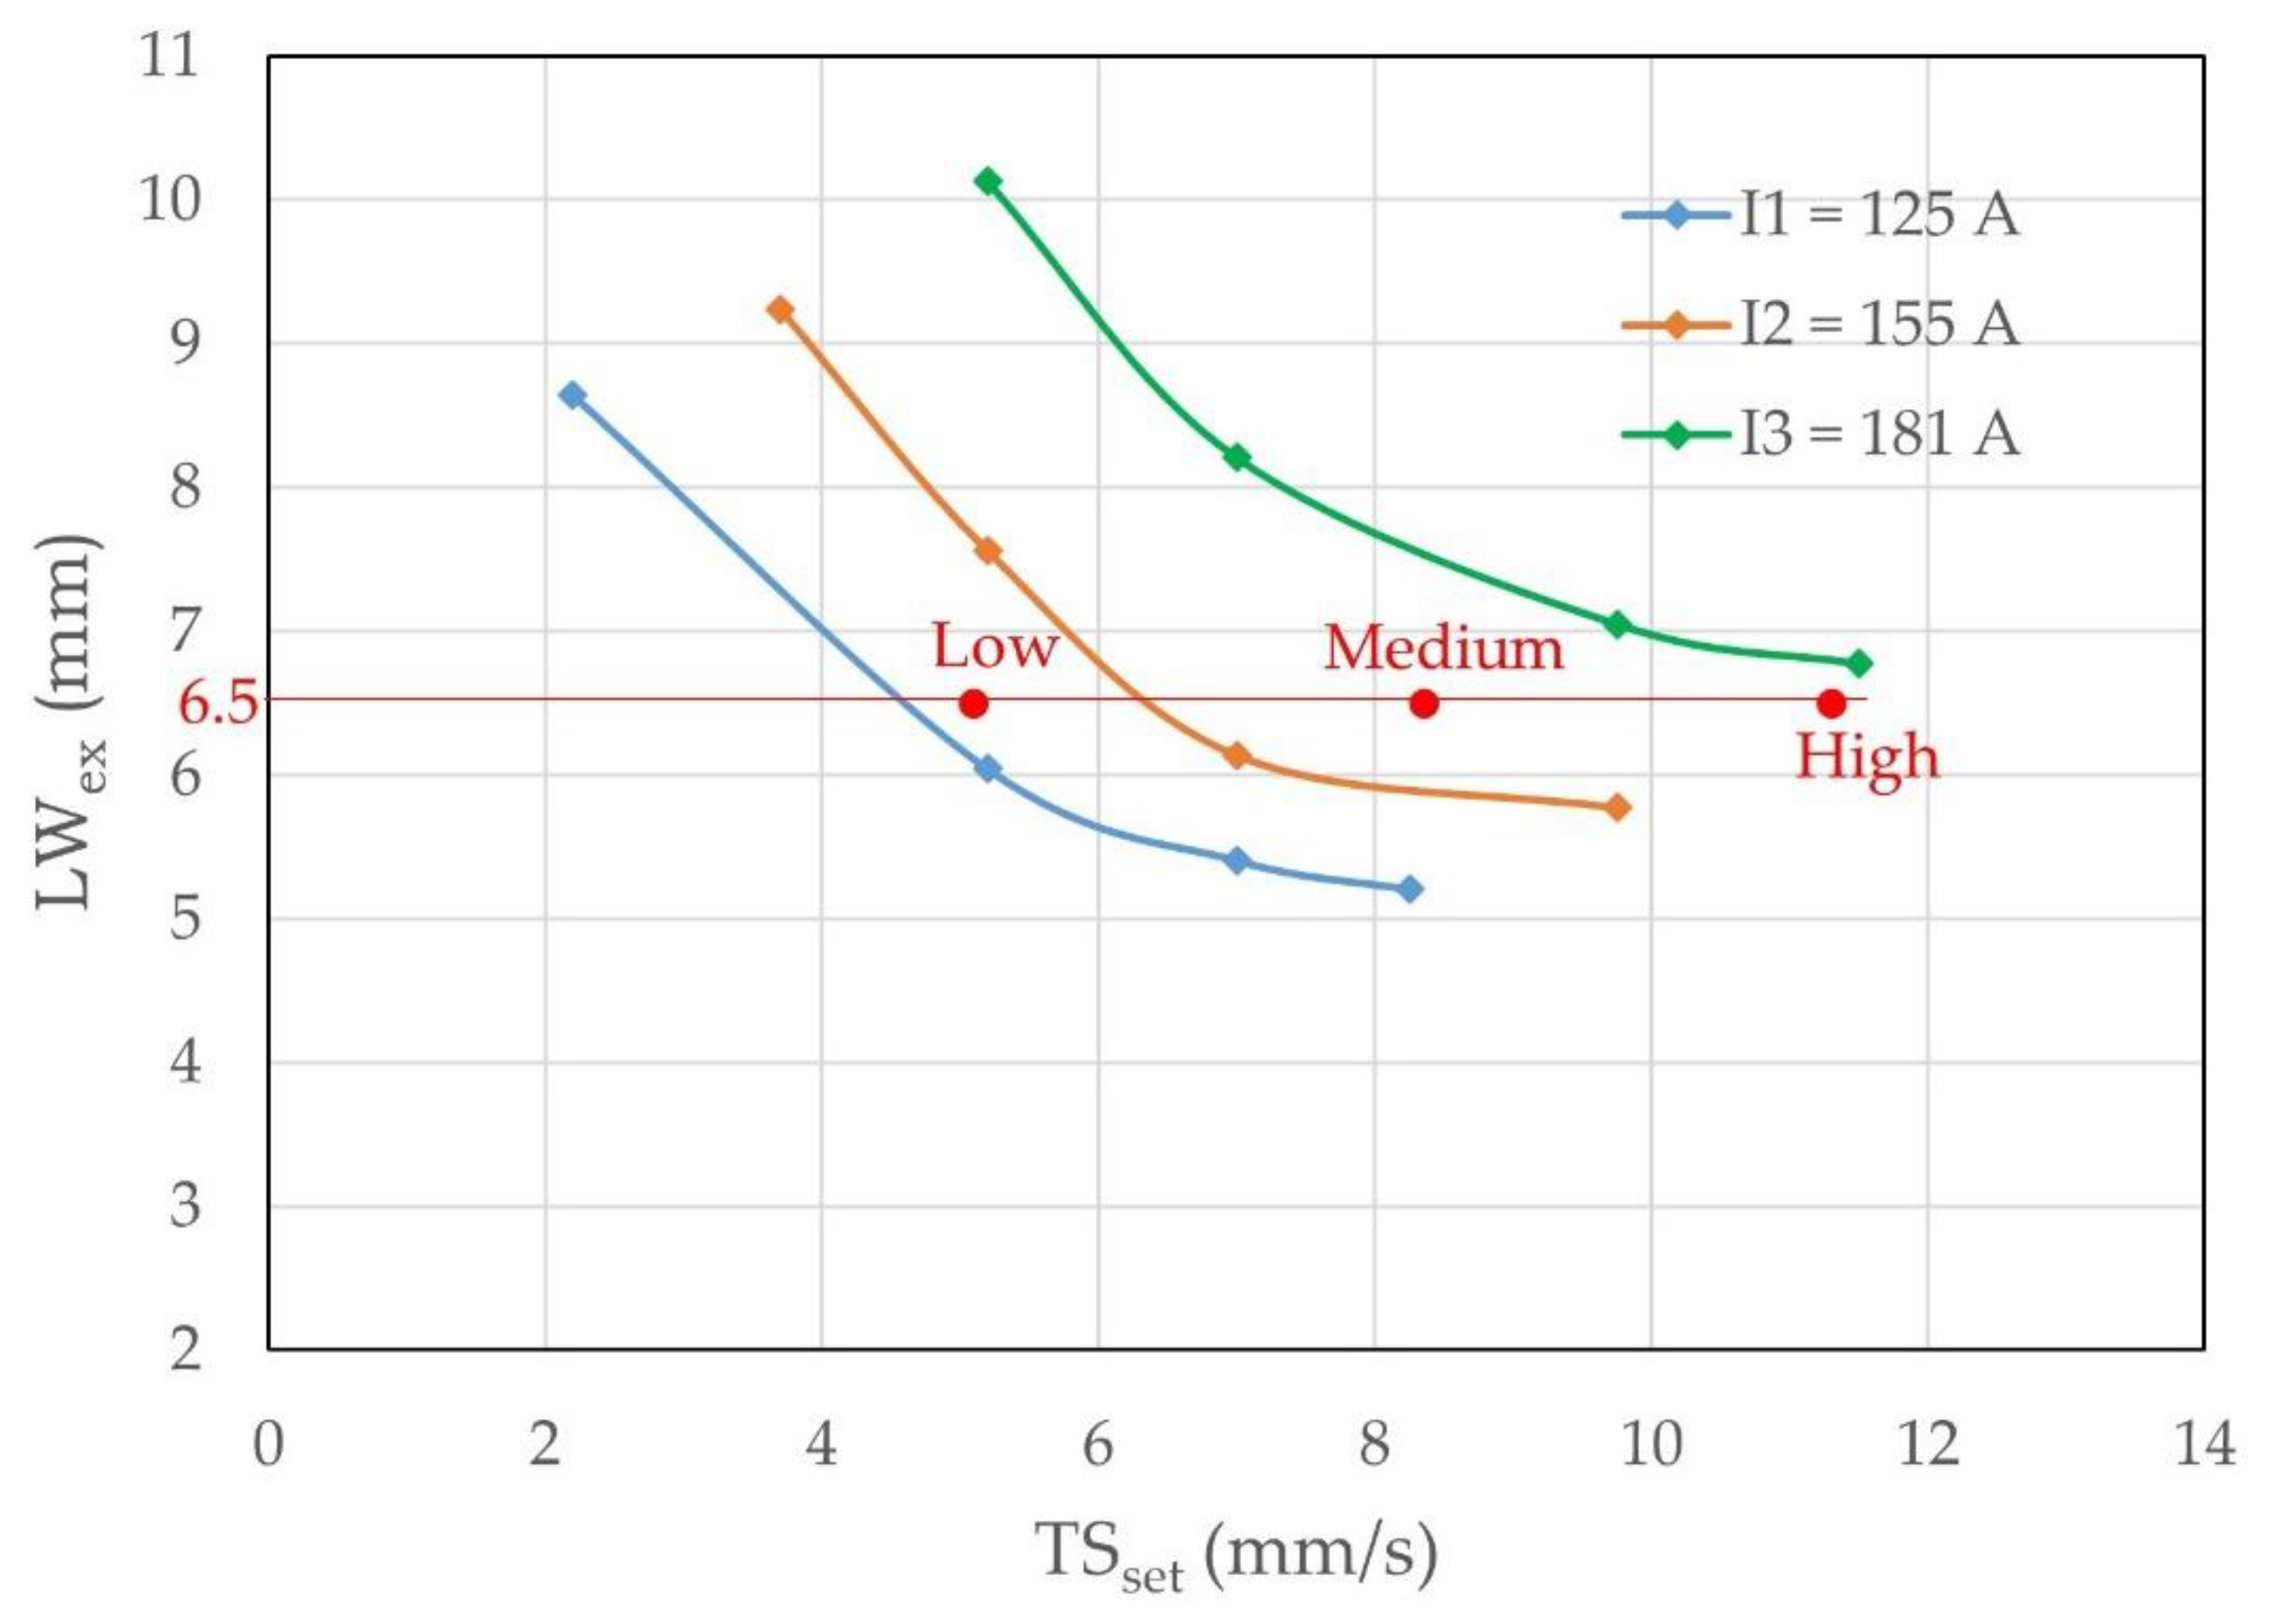
3.4. Operational Map Validation

The validation of the operational map was carried out over the two geometric responses (maximum external LW and minimum effective LW) and the surface waviness index. With this purpose, three parameter conditions (TS and I) were randomly chosen inside the working envelopes, using the three responses, as seen in Figure 22, as an example for the case of external width. The reasoning for validation is to compare the geometric responses (LWex and LWef) and the surface waviness index (SWindex) from the actual walls made with these three parameter combinations to the values found in the operating maps. Figure 22 presents the three parameter combinations randomly chosen, quantified in Table 9. By using the respective working envelopes, the target LWex, LWef, and SWindex were found and displayed in Table 10. Two walls per parametric set were built in order to check the repeatability of the given process with given material and equipment. After manufacturing walls by employing the chosen parametric sets, geometrical characterization using a macrograph of the cross-section was carried out.
From the analysis it was found out that the maximum deviations of measured LW from the chosen target LW were generally low (around ± 0.1 to ± 0.4 mm, except in the case LWef at high current for LW, which case current was very sensitive). The trends confirmed to the SWindex. These values are compatible with defined tolerance for manufacturing processes, such as casting.
It is important to mention that this map could be further completed by adding mechanical characterizations.

4. Conclusions

The above study aimed at proposing and assess a methodology to parameterize wire + arc additive manufacturing (WAAM). The assessment of the methodology was made using a high strength low alloy (HSLA) steel. From the results obtained in this study, it can be concluded that the WAAM process and material used in the case study is robust enough (high repeatability) and that the operational map raised experimentally, even using a low number of experimental conditions and no replications, was sensitive enough to determine in the operating envelope parameter combinations with better or worse waviness.

Author Contributions

Conceptualization and methodology: A.S., J.A., and S.D.; Experimental development: S.D. and K.H.; Formal analysis and writing: A.S. and S.D. All authors have read and agreed to the published version of the manuscript.

Funding

This study was financed KK Foundation, through project Tapertech (no. 20201538).

Acknowledgments

The authors would like to thank the Production Technology Centre of University West for the laboratorial infrastructure. The authors would also like to thank ESAB AB, for having supported the study with the consumables.

Conflicts of Interest

The authors declare no conflict of interest.

References

  1. DebRoy, T.; Wei, H.L.; Zuback, J.S.; Mukherjee, T.; Elmer, J.W.; Milewski, J.O.; Beese, A.M.; Wilson-Heid, A.; De, A.; Zhang, W. Additive manufacturing of metallic components—Process, structure and properties. Prog. Mater. Sci. 2018, 92, 112–224. [Google Scholar] [CrossRef]
  2. Williams, S.W.; Martina, F.; Addison, A.C.; Ding, J.; Pardal, G.; Colegrove, P. Wire + Arc additive manufacturing. Mater. Sci. Technol. 2016, 32, 641–647. [Google Scholar] [CrossRef] [Green Version]
  3. Milewski, J.O. Additive Manufacturing of Metals: From Fundamental Technology to Rocket Nozzles, Medical Implants, and Custom Jewelry; Springer: Berlin/Heidelberg, Germany, 2017; p. 343. [Google Scholar] [CrossRef]
  4. Ding, D.; Pan, Z.; Cuiuri, D.; Li, H. Wire-feed additive manufacturing of metal components: Technologies, developments and future interests. Int. J. Adv. Manuf. Technol. 2015, 81, 465–481. [Google Scholar] [CrossRef]
  5. Yehorov, Y.; da Silva, L.J.; Scotti, A. Balancing WAAM Production Costs and Wall Surface Quality through Parameter Selection: A Case Study of an Al-Mg5 Alloy Multilayer-Non-Oscillated Single Pass Wall. J. Manuf. Mater. Process. 2019, 3, 32. [Google Scholar] [CrossRef] [Green Version]
  6. Alonso, U.; Veiga, F.; Suárez, A.; Artaza, T. Experimental investigation of the influence of wire arc additive manufacturing on the machinability of titanium parts. Metals 2020, 10, 24. [Google Scholar] [CrossRef] [Green Version]
  7. Soderstrom, E.; Mendez, P. Humping mechanisms present in high speed welding. Sci. Technol. Weld. Join. 2006, 11, 572–579. [Google Scholar] [CrossRef]
  8. Nguyen, T.C.; Weckman, D.C.; Johnson, D.A.; Kerr, H.W. The humping phenomenon during high speed gas metal arc welding. Sci. Technol. Weld. Join. 2005, 10, 447–459. [Google Scholar] [CrossRef]
  9. Selvi, S.; Vishvaksenan, A.; Rajasekar, E. Cold metal transfer (CMT) technology—An overview. Def. Technol. 2018, 4, 28–44. [Google Scholar] [CrossRef]
  10. Lin, Z.; Goulas, C.; Ya, W.; Hermans, M.J. Microstructure and mechanical properties of medium carbon steel deposits obtained via wire and arc additive manufacturing using metal-cored wire. Metals 2019, 9, 673. [Google Scholar] [CrossRef] [Green Version]
  11. Purwaningrum, Y.; Triyono; Pu, M.W.; Alfarizi, F. Effect of shielding gas mixture on gas metal arc welding (GMAW) of low carbon steel (LR Grade A). Key Eng. Mater. 2016, 705, 250–254. [Google Scholar] [CrossRef]
Figure 1. Schematic of an operational map and working envelope (workable range within the operational map) to be raised as the objective of this work.
Jmmp 04 00014 g001
Figure 2. Operational map as a means of selecting parametric sets (current, Im, and travel speed, TS) for a target layer width (LW).
Jmmp 04 00014 g002
Figure 3. Hypothesis of effect of the process parameters on the various characteristics of the walls for a target LW.
Jmmp 04 00014 g003
Figure 4. Setup for the WAAM.
Jmmp 04 00014 g004
Figure 5. Proposed substrate configuration (plain carbon steel) and respective fixture.
Jmmp 04 00014 g005
Figure 6. First approximation operational map obtained in the mock design, representing the boundaries for the actual workable currents (LW is still estimated by Equation (5)).
Jmmp 04 00014 g006
Figure 7. Bead-on-plate depositions (one layer) from the experiments carried out while determining the workable current range.
Jmmp 04 00014 g007
Figure 8. Samples used in the experiments to determine DRe for the working currents.
Jmmp 04 00014 g008
Figure 9. Second approximation operational map representing the boundaries for the actual workable currents (LW is still estimated by Equation (5)) superimposed on first approximation operational map (dashed line), already shown in Figure 6.
Jmmp 04 00014 g009
Figure 10. Unacceptable imperfections during WAAM of sequential single layers: (a) material flow beyond the side wall; (b) top surface undulation.
Jmmp 04 00014 g010
Figure 11. Second approximation operational map with actual current range and representing the boundaries for workable limits of current and travel speed (LW is still estimated by Equation (5)).
Jmmp 04 00014 g011
Figure 12. Superimposition of the initial experimental design (4 travel speeds for each of the 3 currents = 12 experiments) over the second approximation operational map.
Jmmp 04 00014 g012
Figure 13. Superimposition of the final experimental design (4 travel speeds for each of the 3 currents = 12 experiments) over the second approximation operational map.
Jmmp 04 00014 g013
Figure 14. Determination of the layer width and, consequently, the substrate thicknesses for each of the experiments.
Jmmp 04 00014 g014
Figure 15. Building up of intermediate layers to get target layer width from a wider substrate.
Jmmp 04 00014 g015
Figure 16. Representation of: (a) maximum external LW (LWex); (b) minimum effective LW (LWef).
Jmmp 04 00014 g016
Figure 17. Comparison of first approximate versus second approximate versus the actual operational maps.
Jmmp 04 00014 g017
Figure 18. Maximum external LW corresponding to the 12 experiments (correspondently numbered), according to the design for the experiments (the lumped area inside the Im and TS workable limits represent the LWex working envelope).
Jmmp 04 00014 g018
Figure 19. Minimal effective LW corresponding to the 12 experiments (correspondently numbered), according to the design for the experiments (the lumped area inside the Im and TS workable limits represents the working envelope).
Jmmp 04 00014 g019
Figure 20. SWindex corresponding to the 12 experiments, according to the design for the experiments (the lumped area inside the Im and TS workable limits represent the working envelope).
Jmmp 04 00014 g020
Figure 21. Surface plot of SWindex for the working envelope.
Jmmp 04 00014 g021
Figure 22. Selection of parameters based on target LW for validation using external LW operational map (macrograph measured).
Jmmp 04 00014 g022
Table 1. Feedstock commercial data sheet (OK TUBROD 14.03).
Dimension (mm)Current (A)Deposition Rate, DRd (kg/h)Wire Feed Rate (m/min)Voltage (V)
MinMaxMinMaxMinMaxMinMax
1.21003201.37.51.812.01632
1.41203801.67.52.09.01634
1.61404501.68.01.58.51836
Note: adapted from ESAB data sheet, reg no. EN006452, 04/07/201.4.
Table 2. Interpolated values of deposition rate (DRd) for different currents.
Current Level (A)DR (kg/hr)
1001.30
1302.14
1602.99
Table 3. Data from workable current range determination.
BeadWFSset
(m/min)
Iset (A)TSset (mm/s)Remarks (Good/Bad)
14.21608.00good
21.41006.00bad
32.01246.00bad
42.21256.00bad
52.61304.50good
65.01808.00good
73.61556.25good
Table 4. Calibration of WFS and determination of DR for each selected current.
Itarget
(A)
WFSset
(m/min)
TSset
(mm/s)
Iactual
(A)
WFSactual
(m/min)
DR
(kg/h)
1302.64.501253.61.72
1553.66.251554.42.12
1805.08.001815.52.67
Table 5. Workable TSset range for Imin, Imid, and Imax values.
Im (A)Lower Limit of TSset (mm/s)Upper Limit of TSset (mm/s)
1252.08.5
1553.510.0
1815.013.5
Table 6. Experimental matrix for the final design for the experiments.
ExperimentFactorsResultant Im (A)
TSset (mm/s)WFSset (m/min)
12.202.6125
25.202.6125
37.002.6125
48.252.6125
53.703.6155
65.203.6155
77.003.6155
89.753.6155
95.205.0181
107.005.0181
119.755.0181
1211.505.0181
Table 7. Memory calculation table of the number of intermediate layers for the 12 experiment.
Experiment NumberExperimentsLW (mm)Substrate Thickness (mm)Number of Intermediate Layers
TS (mm/s)I (A)
12.201258.4291
25.201255.4794
37.001254.7295
48.251254.3595
53.701557.2092
65.201556.0893
77.001555.2494
89.751554.4495
95.201816.8293
107.001815.8894
119.751814.9894
1211.501814.5995
Table 8. Experimental responses: external layer width (LWex) and effective layer width (LWef).
Exp.FactorsResponse
TSset (mm/s)Im (A)LWex (mm)LWef (mm)
12.201258.65.5
25.201256.03.6
37.001255.42.9
48.251255.22.6
53.701559.26.3
65.201557.65.2
77.001556.14.1
89.751555.83.6
95.2018110.17.3
107.001818.26.5
119.751817.14.9
1211.501816.83.6
Table 9. Parametric sets for experiments used in validation of the working envelopes.
ExperimentParameter CombinationsTarget Values
Im (A)WFSset (m/min)TSset (mm/s)LWex (mm)LWef (mm)SWindex (mm)
Low1332.75.106.53.80.60
Medium1684.48.356.54.50.60
High1774.911.306.53.50.60
Table 10. Geometric characterization of the walls built for validations (mm).
Exp.Target ValuesActual ValuesDeviation (Target–Actual)
LWexLWefSWindexLWexLWefSWindexLWexLWefSWindex
Low6.53.80.606.43.90.640.1−0.1−0.04
Medium6.54.50.606.74.90.51−0.2−0.40.09
High6.53.50.606.34.60.600.2−1.10.00

