Article

Hot Extrusion of ZnSb-Based Thermoelectric Materials; A Novel Approach for Scale-Up Production

by
Mohsen K. Keshavarz
1,2,*,
Chun-Wan Timothy Lo
2,
Sylvain Turenne
3,
Yurij Mozharivskyj
2 and
Nathaniel J. Quitoriano
1
1
Department of Mining and Materials Engineering, McGill University, Montreal, QC H3A 0C5, Canada
2
Department of Chemistry and Chemical Biology, McMaster University, Hamilton, ON L8S 4M1, Canada
3
Department of Mechanical Engineering, Polytechnique Montreal, Montreal, QC H3T 1J4, Canada
*
Author to whom correspondence should be addressed.
J. Manuf. Mater. Process. 2019, 3(3), 58; https://doi.org/10.3390/jmmp3030058
Submission received: 25 June 2019 / Revised: 13 July 2019 / Accepted: 16 July 2019 / Published: 19 July 2019

Abstract

:
Hot extrusion is employed to produce bulk ZnSb and Zn13Sb10 thermoelectric materials. The extrusion parameters are optimized to achieve high purity products with high density and acceptable mechanical strength for further fabrication processing. Microstructural analysis is performed to investigate the products. X-ray diffraction, energy dispersive X-ray spectroscopy, and differential scanning calorimetry show high stability of the ZnSb phase during the extrusion that lead to high purity products. However, the Zn13Sb10 compound decomposes during the extrusion, yielding a bulk sample consisting of several other phases. Hot extrusion shows a great potential for scaled up production of high quality ZnSb thermoelectric materials.

1. Introduction

Thermoelectric (TE) devices convert heat into electricity. Since the mid-1990s, there have been significant efforts to discover novel TE materials, improve their performance, and achieve a higher TE conversion efficiency. The figure of merit for a TE material is ZT = α2σT/k, where α is the Seebeck coefficient, σ is the electrical conductivity, k is thermal conductivity of the material, and T is the absolute temperature. ZT is a quantity that measures a competition between electronic transport (known as power factor, PF = α2σ) and thermal transport (i.e., total thermal conductivity; k). TE devices are mostly used in niche applications due to their high production cost, and low efficiencies [1,2]. Usually researchers seek to address the efficiency of TE materials. However, one also needs to develop inexpensive large-scale production methods for the growing market.
TE materials are categorized into three different groups based on the temperature range at which they show their best performance; (1) low or room temperature (up to 450 K), (2) mid-temperature (450–750 K), and (3) high-temperature (>750 K) materials [1]. The Zn13Sb10 (also known as the β-Zn4Sb3) and ZnSb phases, the two most studied Zn-Sb TE materials, exhibit optimal performance at intermediate temperatures. They possess interesting structural and physical properties [3]. Although ZnSb has been a well-known TE material since the 1950s [4,5,6] and demonstrates higher thermal stability than Zb13Sb10, it has been studied less, and during the last couple of decades, researchers lost interest in it. In comparison the Zn13Sb10 has better TE properties at intermediate temperatures, but some studies show it decomposes above 400 K [7]. ZnSb with higher stability can be a compelling alternative for the unstable Zb13Sb10 if its performance and production are optimized. There are also other potential applications of ZnSb such as electrodes for rechargeable Li ion batteries [8] or as phase change memory cells [9].
ZnSb has been synthesized by methods such as stoichiometric melting (SM) and the powder metallurgy method (PM) [6], resulting in polycrystalline materials [10,11,12], or grown as single crystals [4,13,14]. However, the single crystalline material does not show sufficient mechanical strength for further device fabrication, and SM yields a high-porosity product. Although PM techniques are capable of large-scale powder processing, conventional sintering techniques such as hot press or spark plasma sintering (SPS) have a very limited bulk sample production yield. The production of large quantities of bulk ZnSb using both the SM and PM methods has not been reported and bulk samples resulted from these approaches in previous reports are on the scale of a few grams. Hot extrusion is a suitable method for scaled-up production, which can be an alternative powder consolidation technique. This technique is used for the production of other TE materials such as bismuth telluride, lead telluride, and magnesium silicide. Using this technique, bulk TE materials of a few kilograms can be produced in a single batch [15,16,17].
In this work, we demonstrate an industrial-friendly approach for the mass production of bulk ZnSb, a TE compound with great potential to replace common, mid-temperature, TE materials which are toxic (e.g., PbTe), or consist of rare elements [18]. Here we investigate the production of stable, dense, polycrystalline ZnSb, and Zb13Sb10 bulk phases via SM followed by ball-milling and hot extrusion. In this regard, the processing parameters are optimized, and the phase stability and quality of the final products are evaluated.

2. Materials and Methods

ZnSb and Zn13Sb10 samples were prepared by the SM of elemental starting materials. Chunks of pure Zn (99.99 wt.% CERAC) and Sb (99.999 wt.% 5N. Plus) were massed according to the ZnSb and Zn13Sb10 stoichiometries having a total mass of 10 g. The samples were sealed in evacuated silica tubes and heated in box furnaces at 1023 K for 16 h. The samples were shaken in between to ensure proper mixing of the molten elements. For Zn13Sb10, the samples were cooled from 1023 K to 623 K with a cooling rate of 50°/h and then annealed for 2 days at 623 K to achieve phase homogeneity. The Zn13Sb10 samples were finally cooled down to room temperature at a rate of 50°/h. The ZnSb samples were cooled from 1023 K to 723 K with a cooling rate of 50°/h and annealed for 2 days at 723 K. The ZnSb samples were then quenched in cold water.
To identify the phase transition temperatures in the SM and extruded samples, differential scanning calorimetry (DSC) analysis was done (Netzsch STA449 F3 Jupiter) from room temperature to 873 K under an Ar atmosphere and with a 10 K/min heating rate.
The SM samples of both phases were ground to fine particles by means of a planetary ball mill (Fritsch P7) using steel bowls and balls at 250 rpm for 10 min. Twenty grams of the powders were consolidated to achieve bulk samples using hot extrusion. A schematic of the hot extrusion setup made of H13 tool steel is presented in Figure 1. The opening of the extrusion die was blocked using an aluminum plug, the plug and all the surfaces of the extrusion setup were coated by graphite for lubrication and to avoid reaction or joining between the powders and tools. The extrusion cylinder was filled with the ground powders, then the extrusion system was heated to 590 K or 650 K, for Zn13Sb10 and ZnSb samples, respectively. When heated to the targeted temperature, the material was pushed out of the extrusion die using pressures between 450 to 550 MPa. A thermocouple was placed at the middle of extrusion cylinder close to the inner surface of the cylinder. When the thermocouple showed the set temperature, a 20 min soaking period was applied before starting the extrusion process to ensure the homogeneity of the temperature in the whole cylinder.
The variation in pressure was due to three different dies with different extrusion ratios (ERs, A0/A see Figure 1b) that were used to obtain fully dense samples. The grinding and hot extrusion processes were carried out under an Ar atmosphere to avoid oxidation.
Particle size distribution (PSD) analysis of the powders was performed based on a laser diffraction method using a HORIBA LA-920 apparatus (HORIBA, Ltd., Sunnyvale, CA, USA). The SM and extruded samples made from the corresponding SM samples were examined on a PANalytical powder diffractometer with the Cu Kα1 radiation and linear X′Celerator detector. All samples used for the XRD analysis were in powder form. To obtain the powders of bulk samples, they were ground using mortar and pestle. The obtained X-ray diffraction data were analyzed by the Rietveld refinement method using the Rietica V4.0 software.
Micrographs of the samples were obtained using a scanning electron microscope (SEM) (Hitachi SU3500, Blainville, QC, Canada), equipped with Backscattered electron (BSE) and Energy Dispersive X-ray Spectroscopy (EDS) detectors. A 20 kV acceleration voltage and a beam size of 40 nm were employed for the EDS analysis. The interaction volume between the electron beam and sample, and the trajectory of the electrons were simulated by the Monte Carlo method using the CASINO V2.42 software.
The densities of the extruded materials were evaluated via the Archimedes method. Three pieces for each extrusion ratio were analyzed and the average of the measurements is reported.
To evaluate the general TE performance of the hot extruded sample, the PF was assessed from room temperature up to 625 K using ZT-Scanner apparatus (TEMTE Inc., Montreal, QC, Canada).

3. Results and Discussion

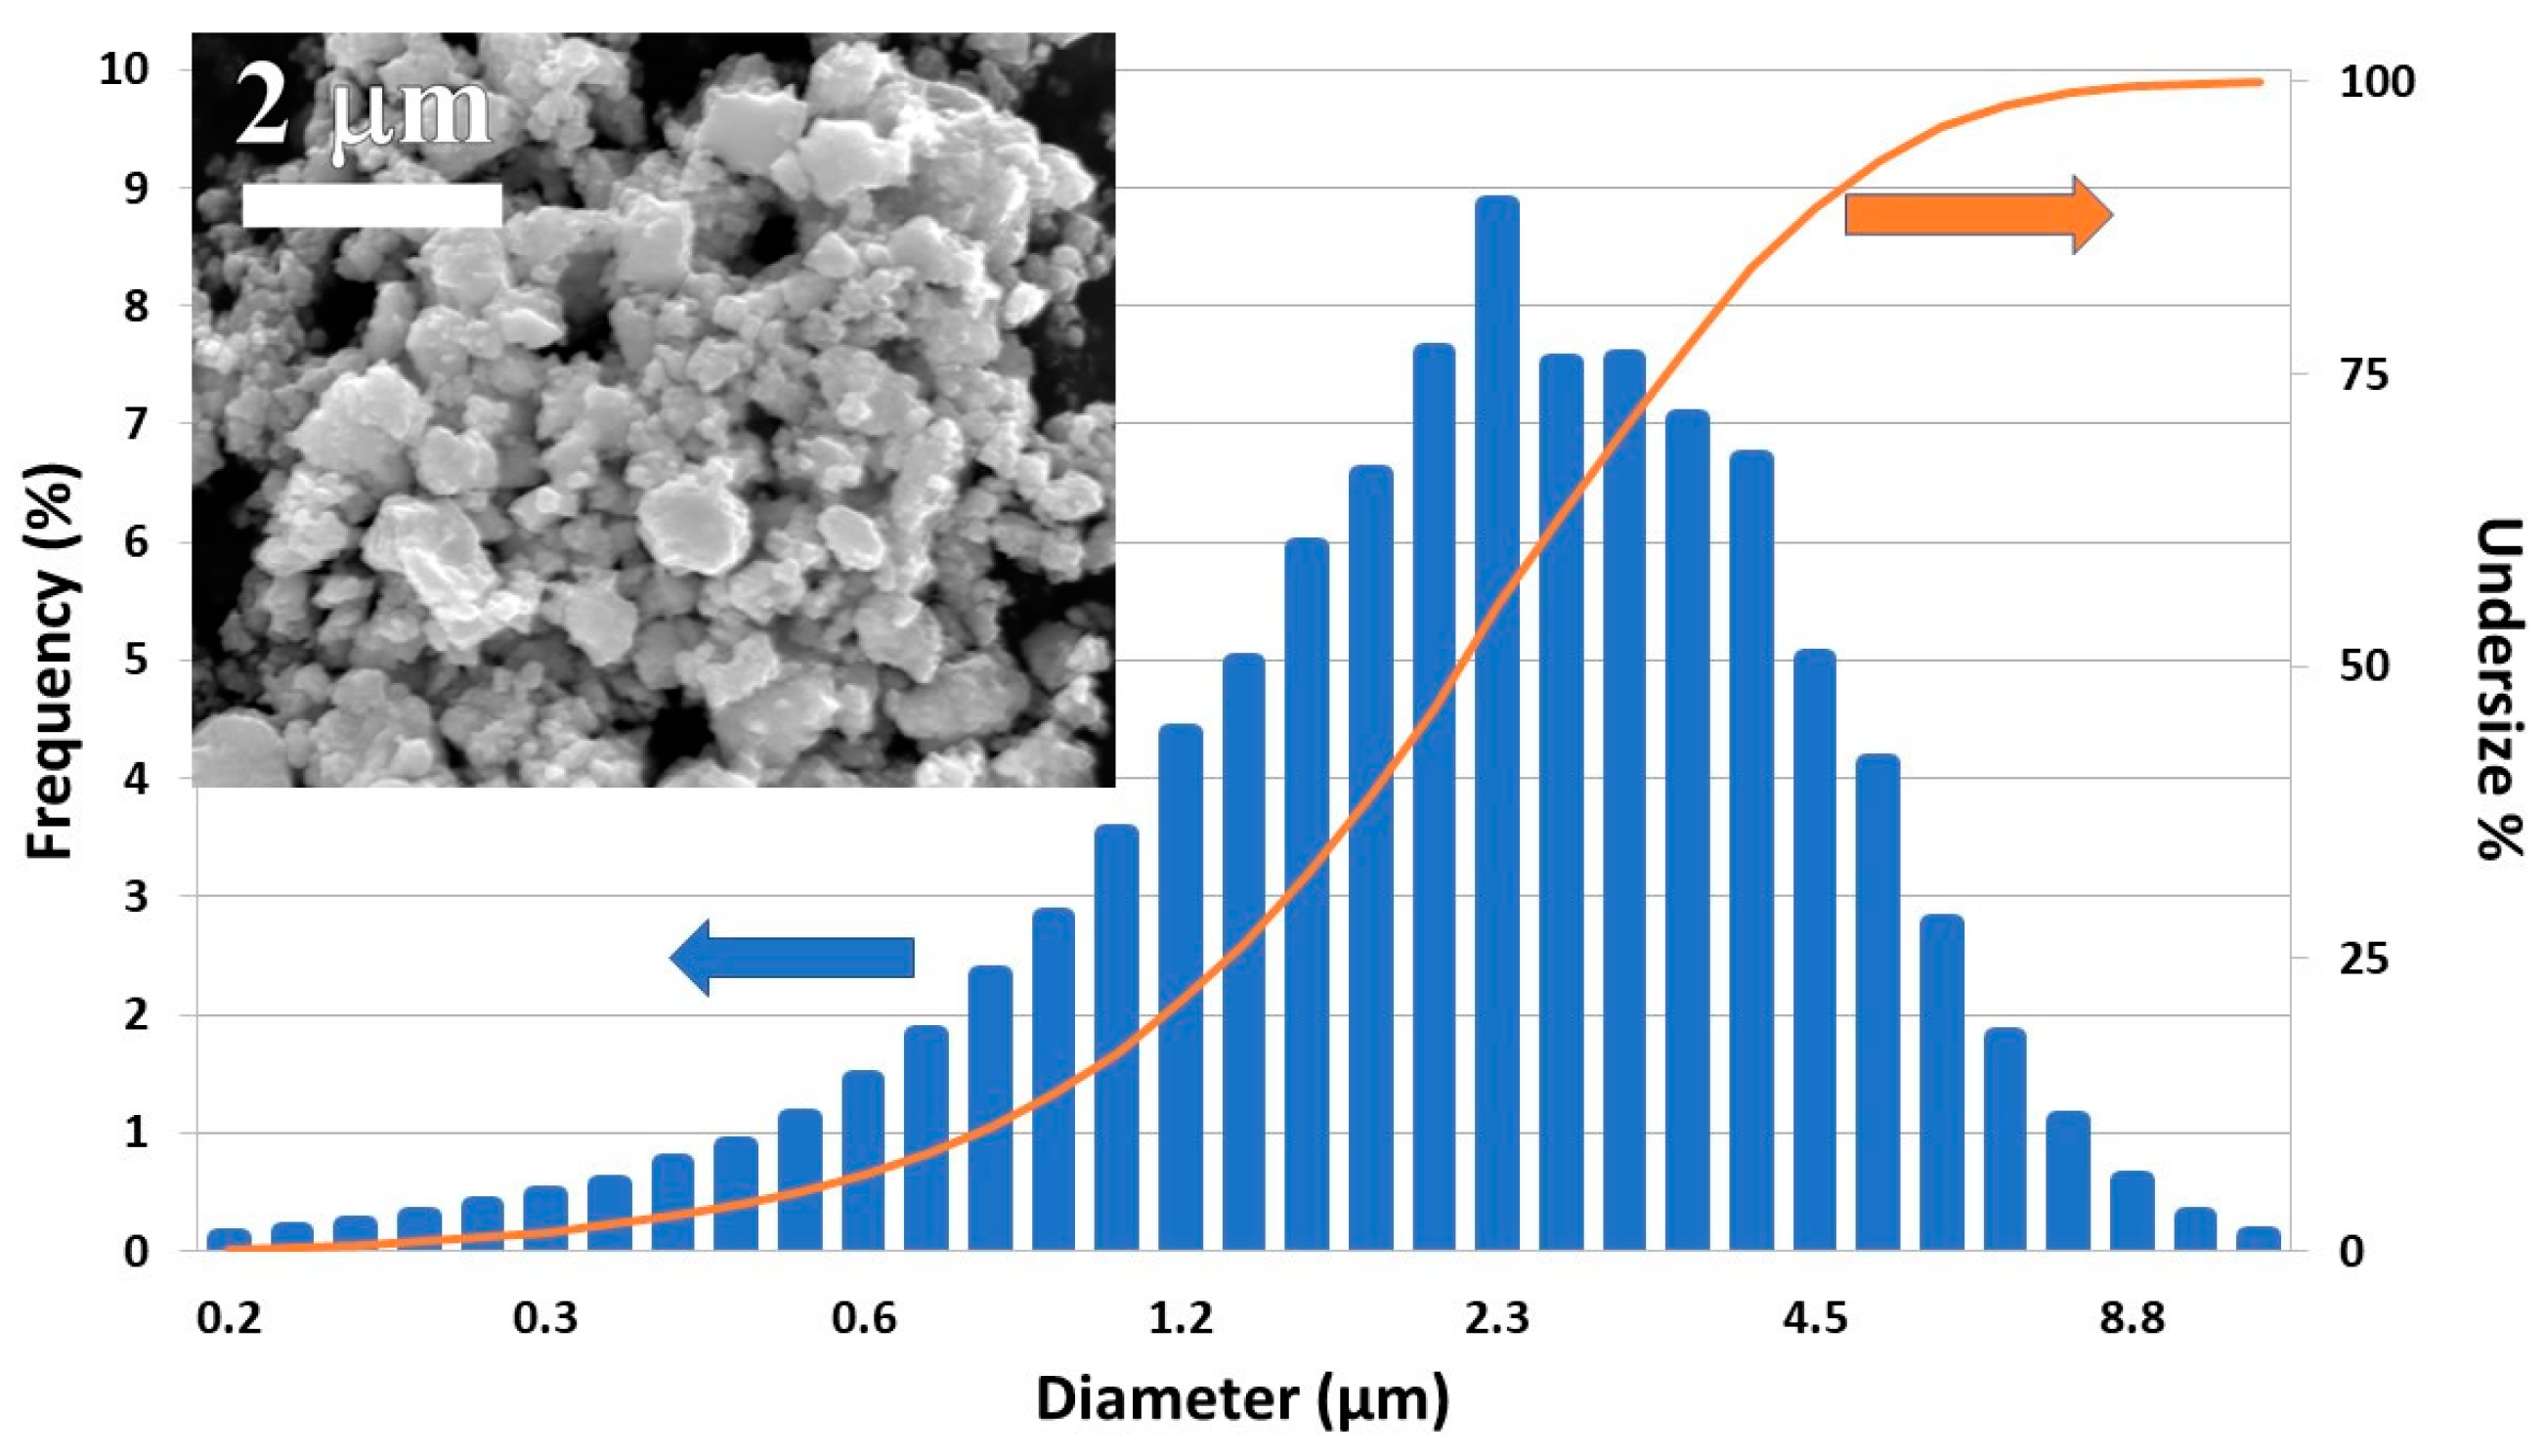
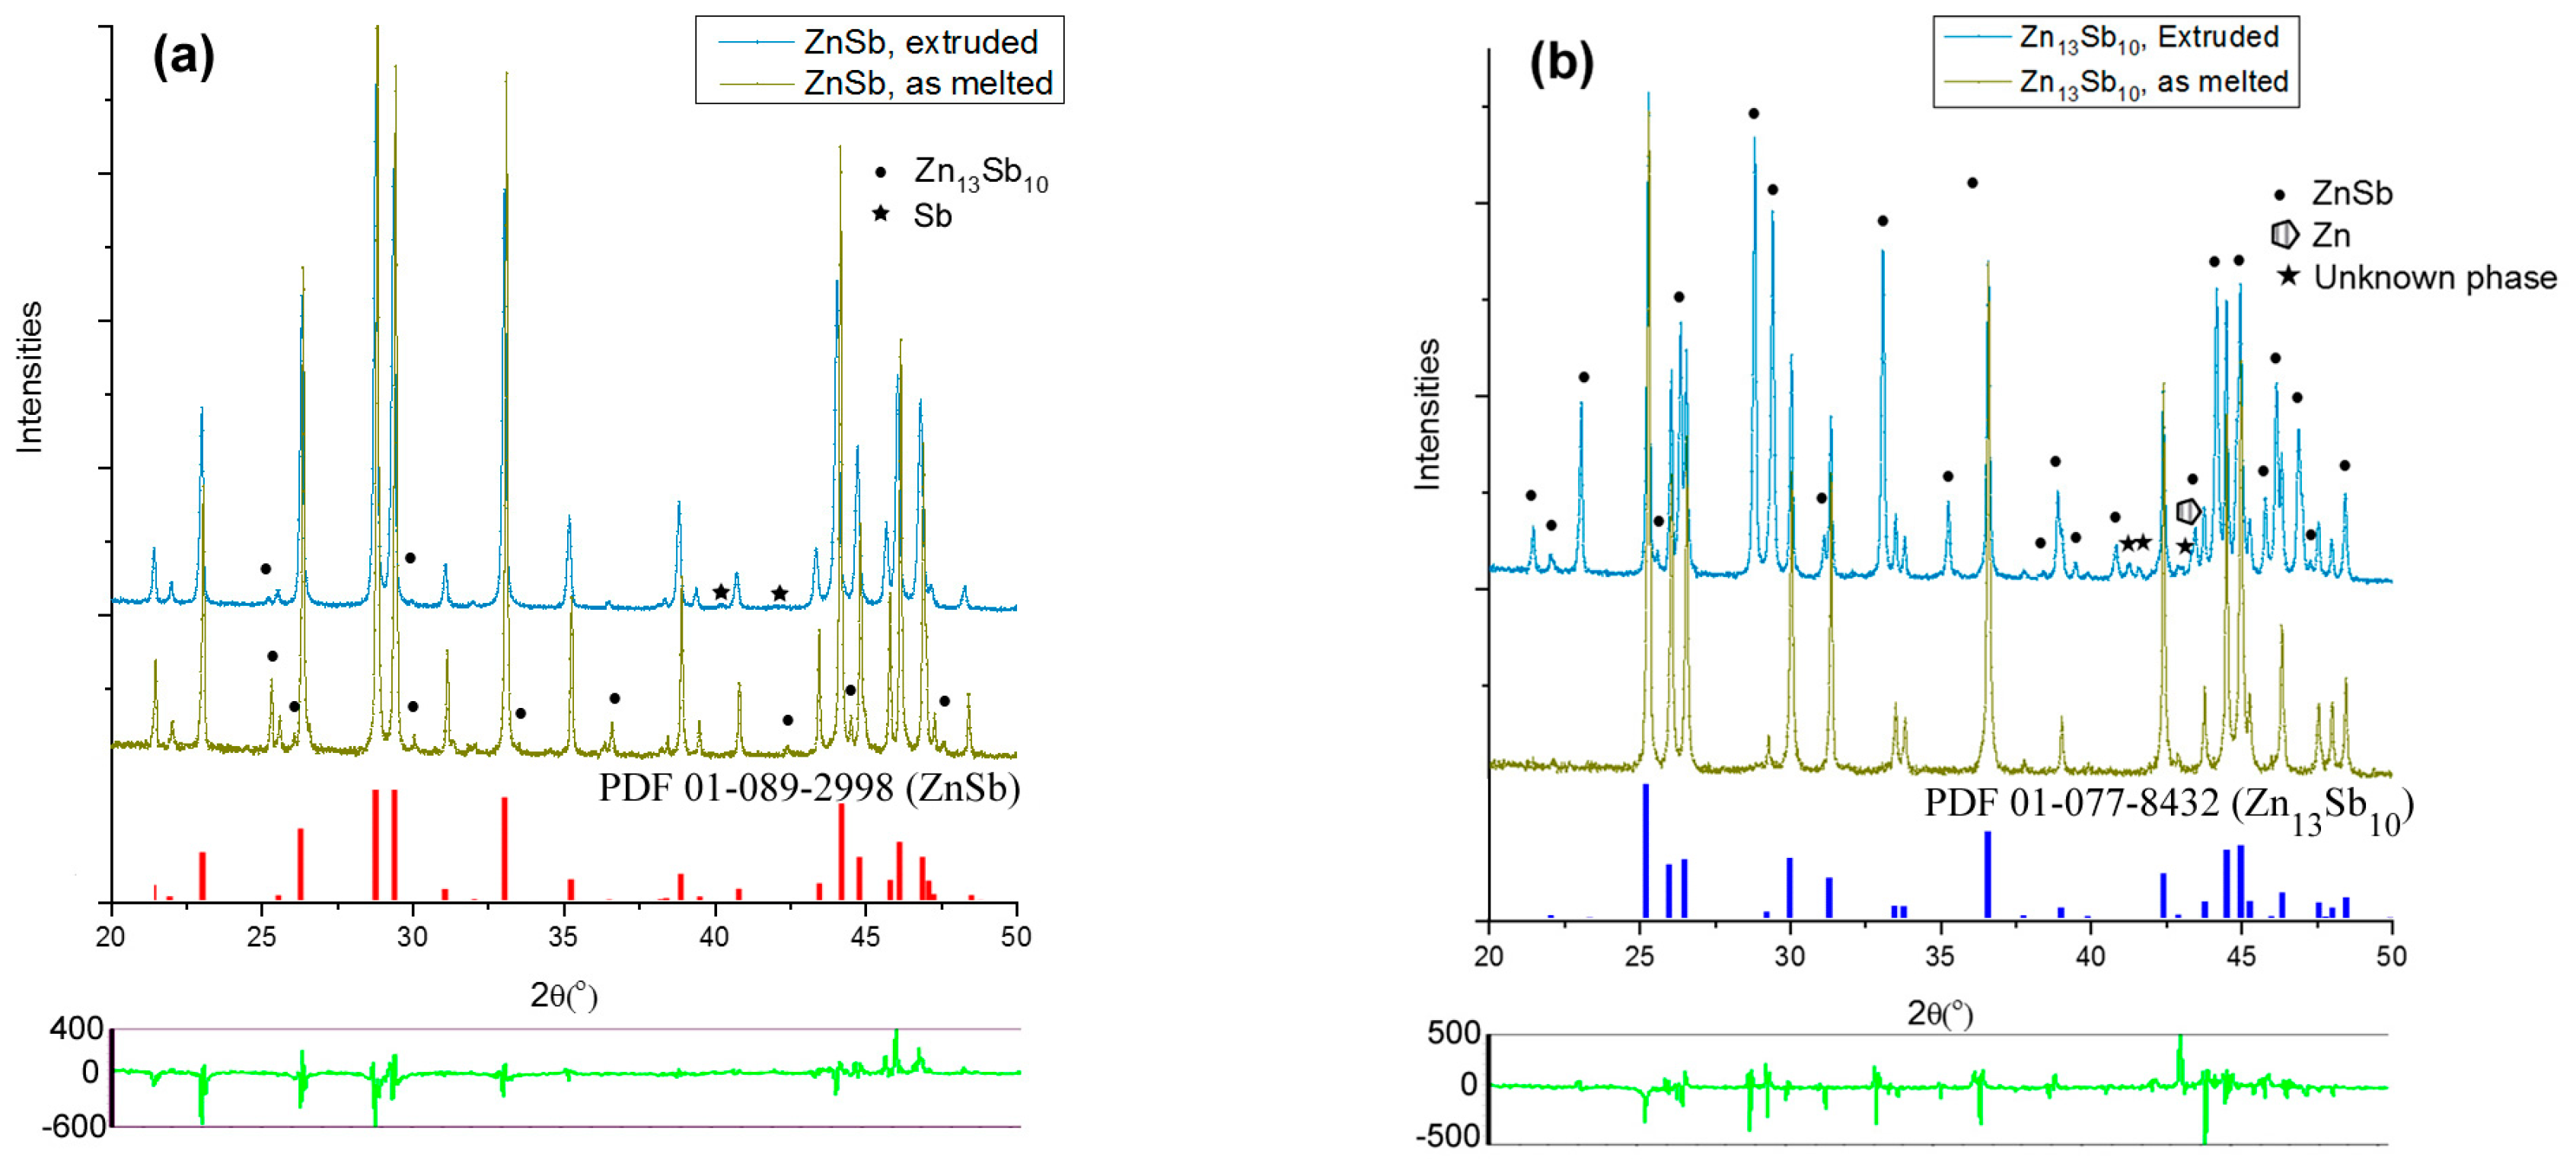
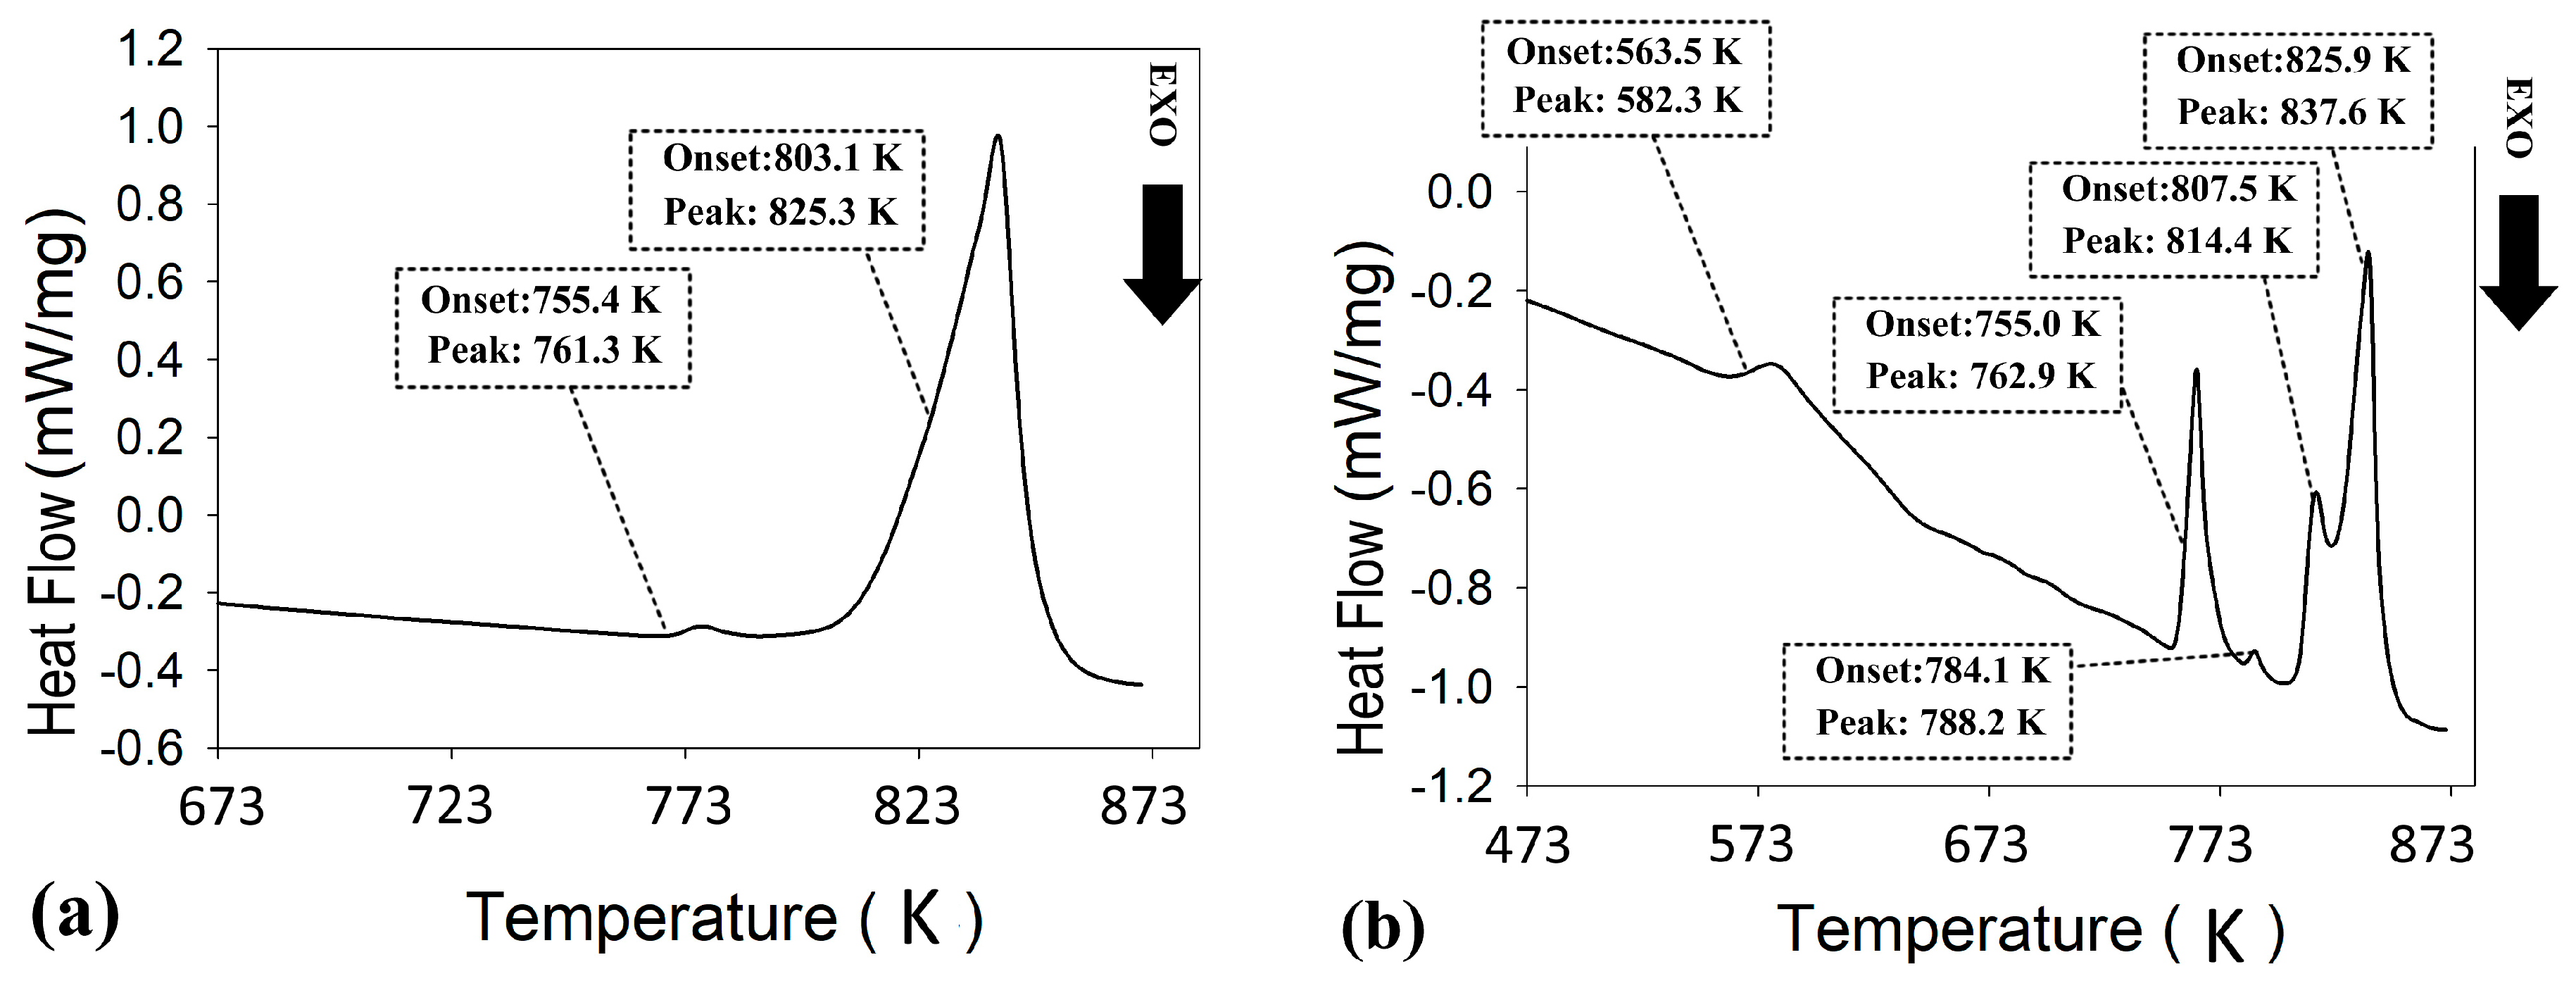
3.1. Pre-Extrusion Analyses of Materials

DSC analysis was used to evaluate the stability of the SM materials and identify phase transition temperatures. The data are used to determine a hot extrusion temperature range that would not cause a phase transition during the densification process. Figure 2 shows the DSC of the SM ZnSb phase. There are two main endothermic reactions with the onset temperatures around 761 K and 805 K. The first event likely corresponds to the melting of a hypereutectic mixture (ZnSb + Sb), whereas the second one matches the liquidus for a composition close to the ZnSb phase. This result implies the presence of secondary phases in the SM material; however, the DSC does not allow for the evaluation of the purity of the major phase (i.e., ZnSb). Instead, XRD was used to estimate the phase purity and the results will be presented later. Based on the DSC result and with the help of Zn-Sb phase diagram, the maximum hot extrusion temperatures were set to be far below any possible phase transition in the materials, yet high enough to reach an acceptable consolidation yield, i.e., 650 K for ZnSb and 590 K for Zn13Sb10.
The PSD analysis of the powders of the ball milled ZnSb and Zn13Sb10 SM samples showed a very large distribution of particle sizes. The particles had diameters from a few hundred nanometers to 9 microns (Figure 3) and D50 (the size that splits the distribution with half of the particles above and half below this diameter) is around 2.4 microns. An SEM micrograph showed particles were irregularly shaped (Figure 3 inset).

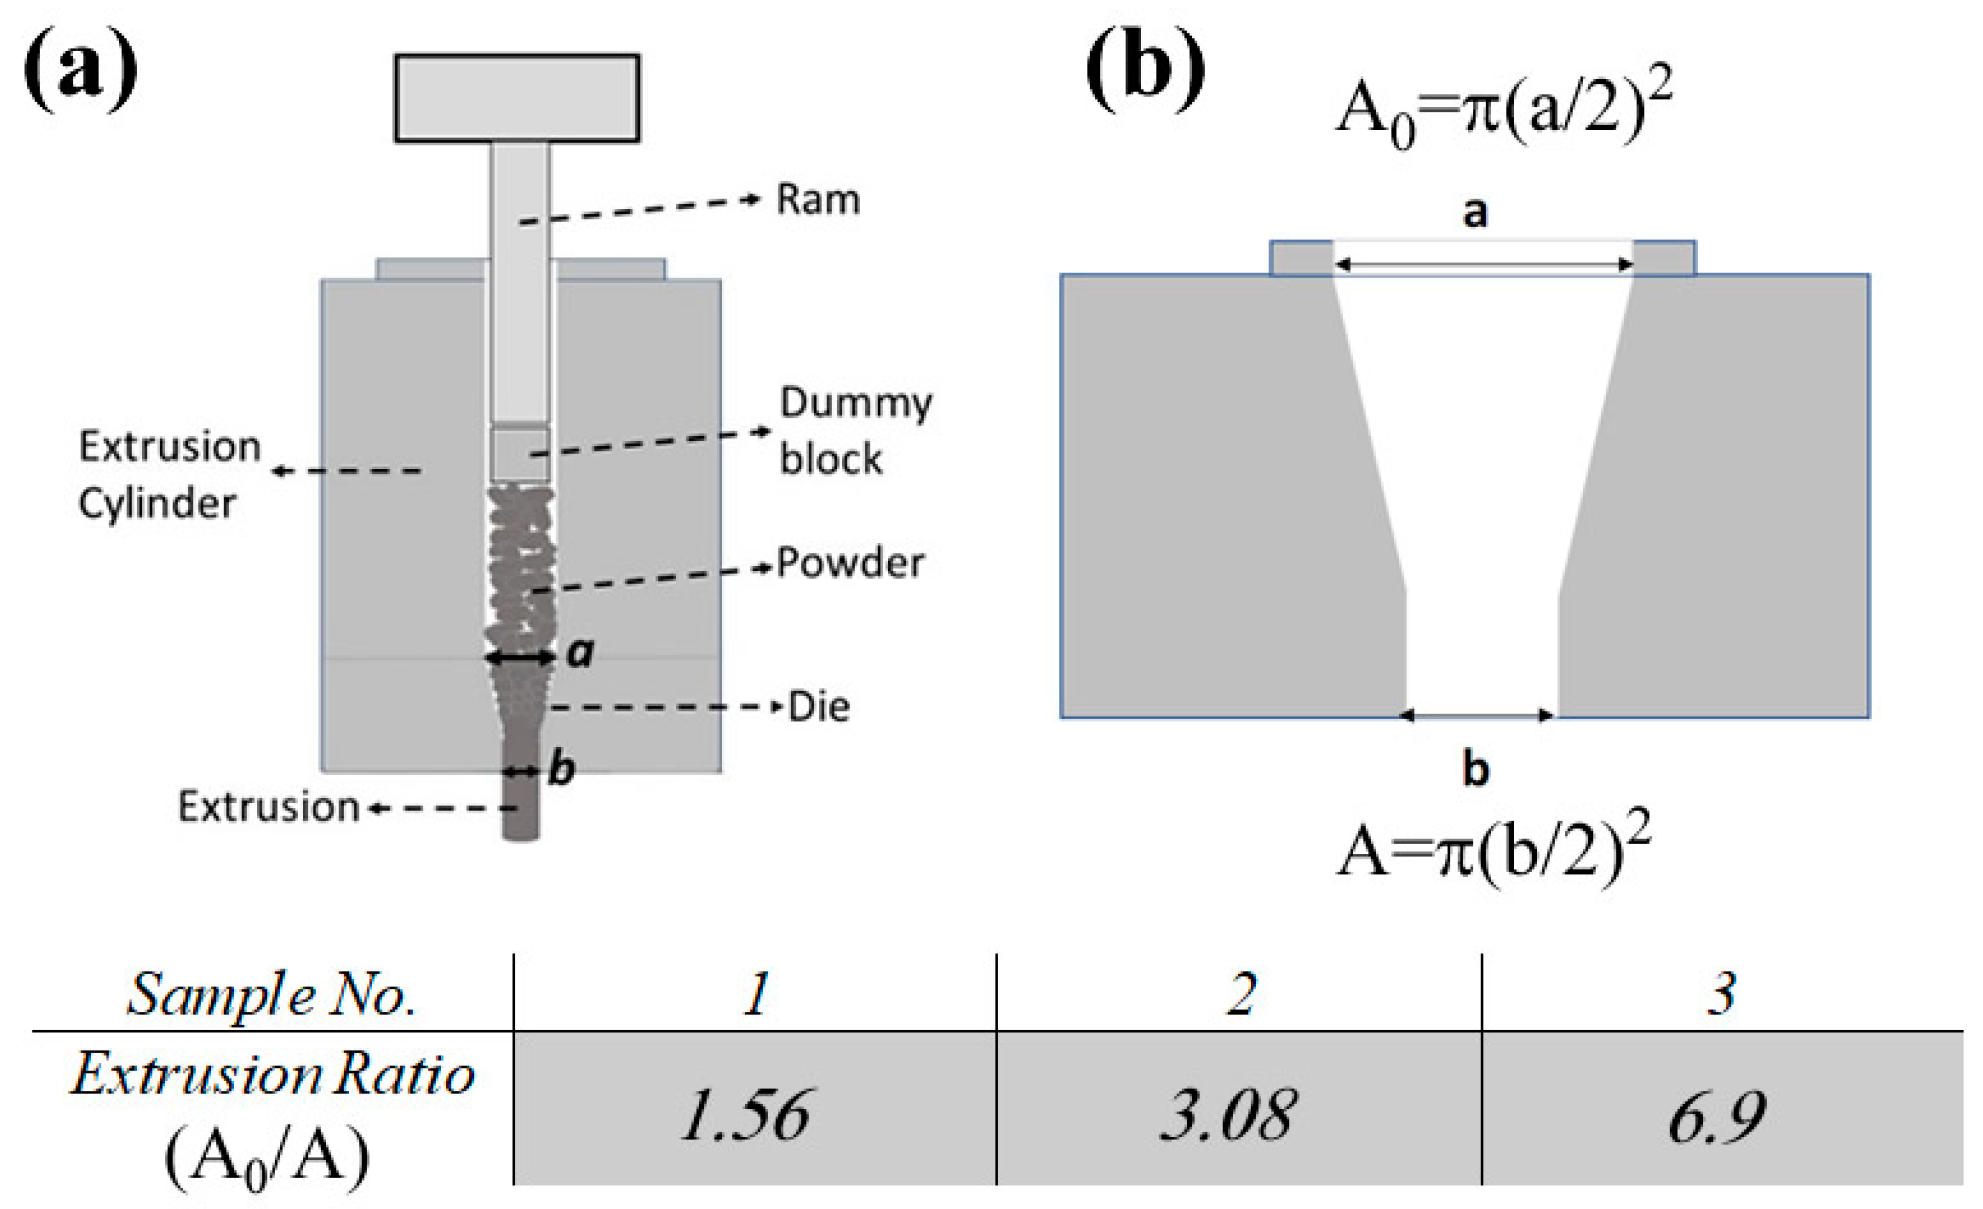
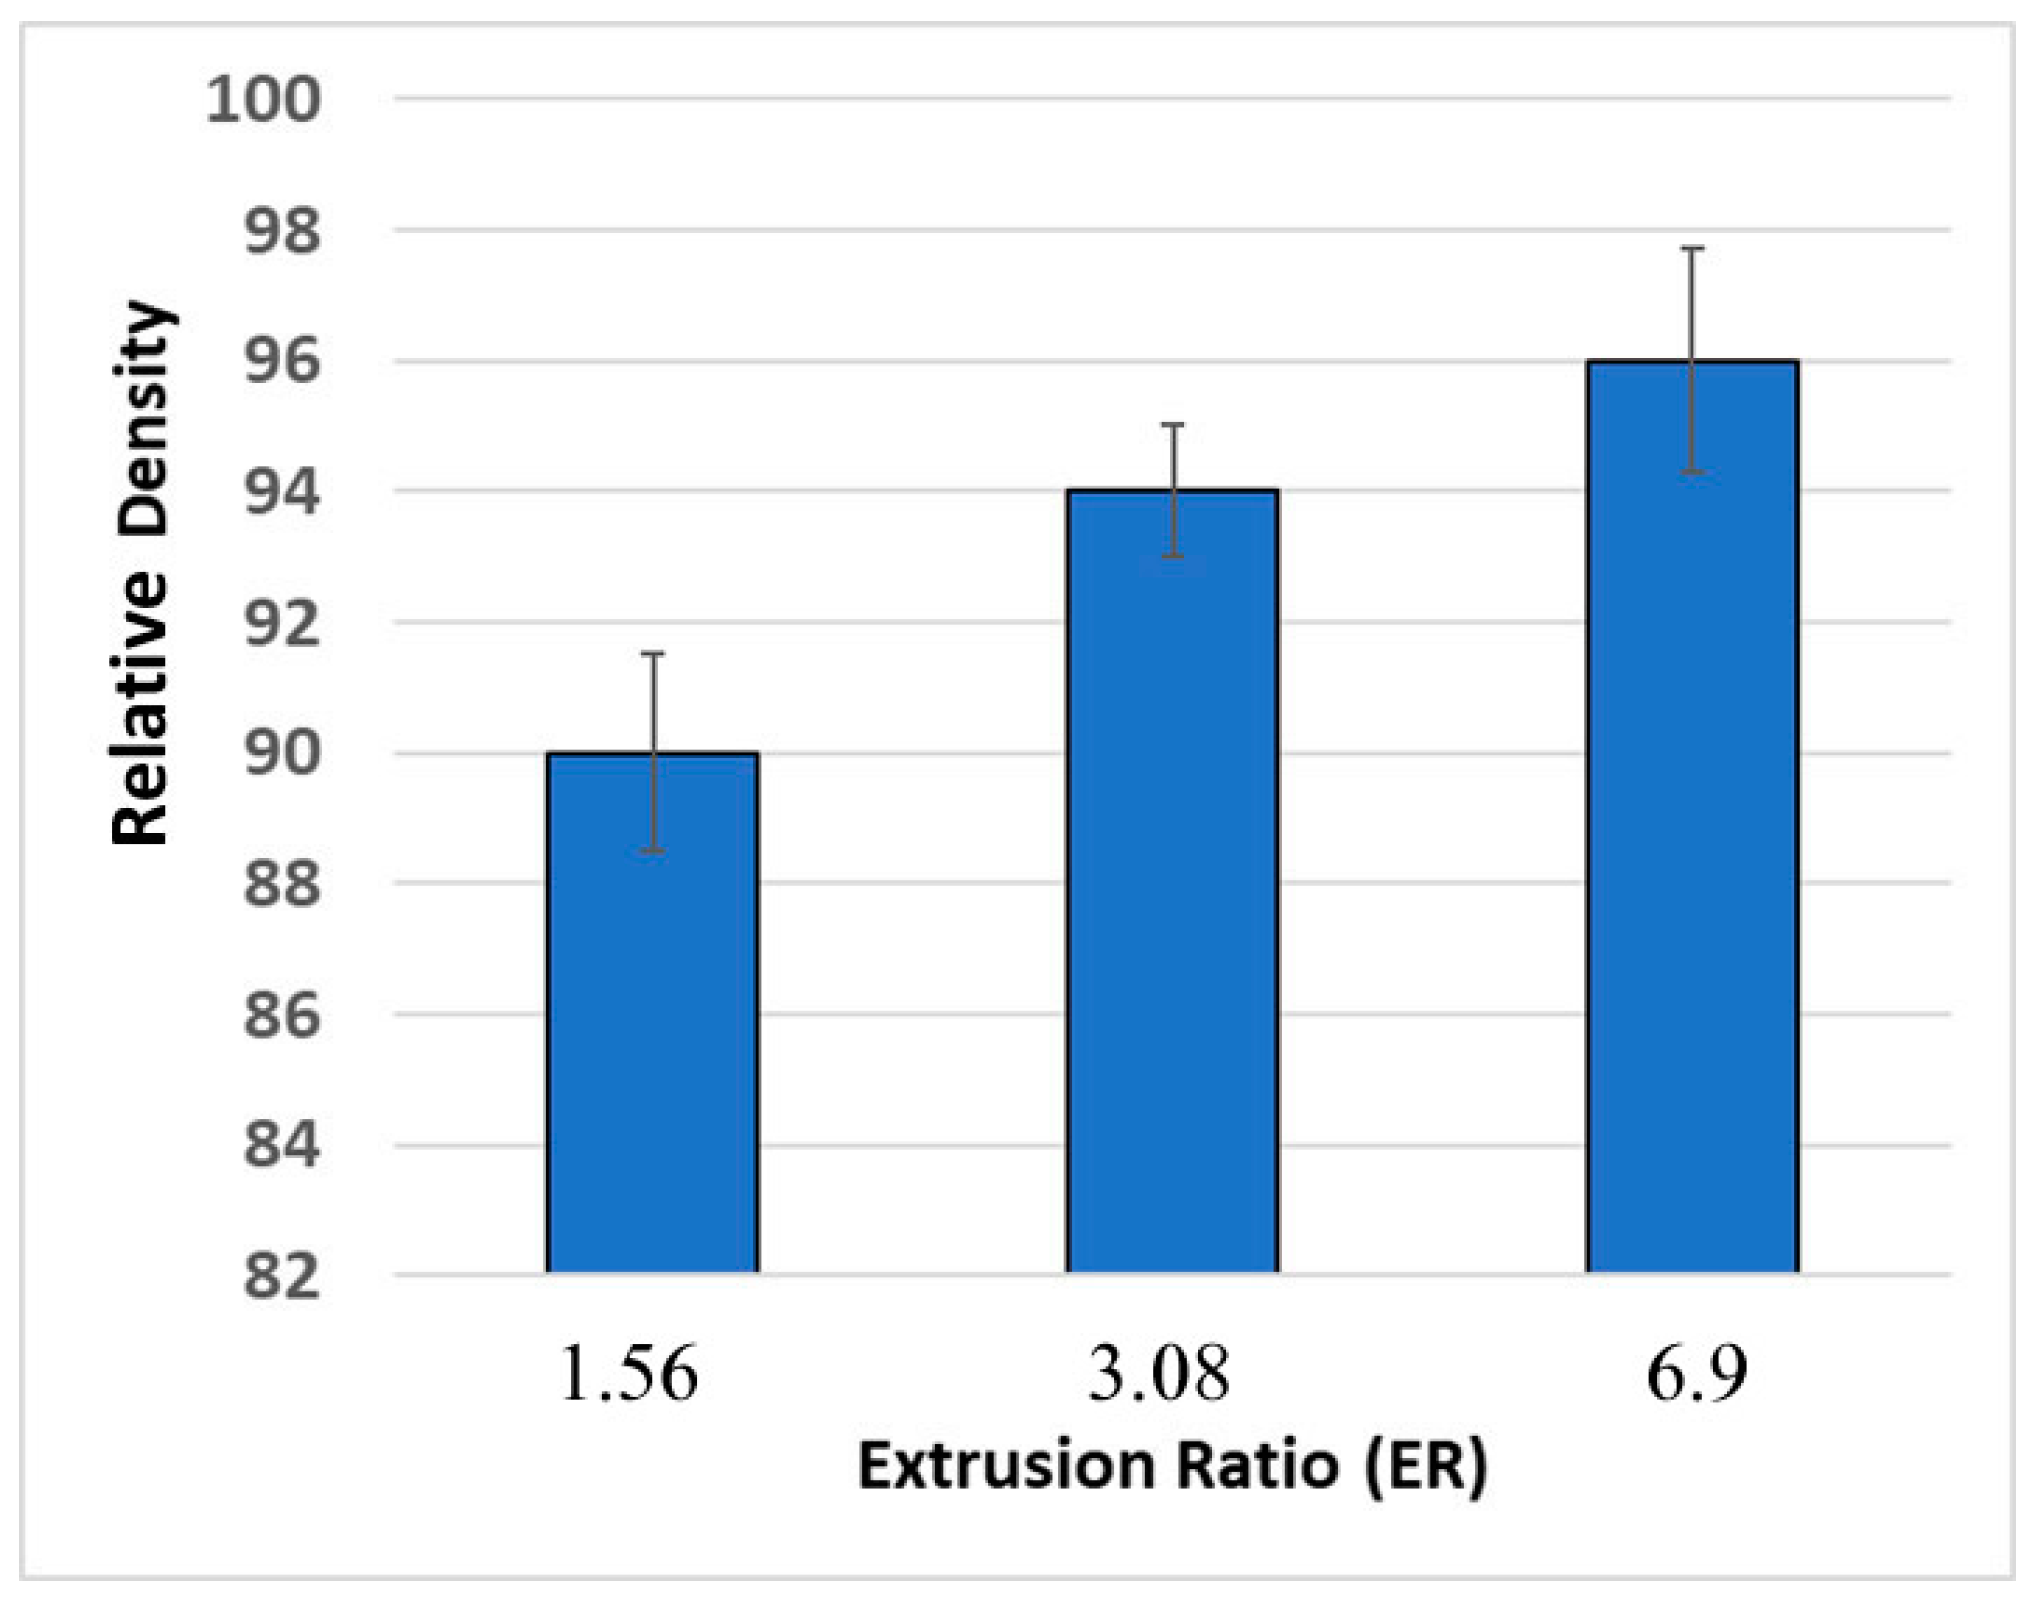
3.2. Optimization of the Hot Extrusion Process

The hot extrusion parameters were optimized to obtain fully dense bulk samples when the initial phase of the powder was conserved. The products were free of cracks that would result in suitable products for further handling and fabrication processes. Considering the industrialization of this approach, parameters such as maximum extrusion speed (i.e., production rate), as well as minimum temperature, and pressure that would still result in the desired properties of the products were optimized. As the extrusion temperature range of each phase was set to avoid any phase transitions during processing, there were three other extrusion parameters to be optimized: The extrusion ratio (ER), the extrusion speed, and the pressure, which are interrelated. Consequently, we used three different extrusion dies (as described in the experimental section and Figure 1), and for each die (i.e., ER) the pressure was adjusted to reach an extrusion speed between 0.5 to 0.6 mm/min. In the preliminary tests, this extrusion speed was found to be the maximum speed that yielded crack-free ZnSb samples. Eventually, the samples were extruded through all three dies (Figure 4), however, when extruding through die #3 (i.e., ER = 6.9), the pressure reached the maximum for the setup (550 MPa) and the extrusion speed was roughly 0.3 mm/min.
The densities of the extruded samples were evaluated to further optimize the process. Figure 5 shows the relative densities of the samples extruded at different ERs, compared to the theoretical density of ZnSb. Considering the large PSD of the powder, which has a negative impact on the densification process [16,19], the samples extruded with ER = 3.08 and 6.9 showed satisfactory densities. SEM analysis confirmed a high degree of consolidation in samples #2 and #3, however sample #1 (ER = 1.56) contained significant porosity and regions that were partially sintered (Figure 6).
The results of the densification efficiency of different dies, combined with consideration of the required pressure and resulting extrusion speed, convinced us that die #2 (ER = 3.08) was the best option resulting in a high-density product with an acceptable extrusion speed. Hereafter, any results presented in the manuscript are from the samples extruded using die #2 (ER = 3.08).

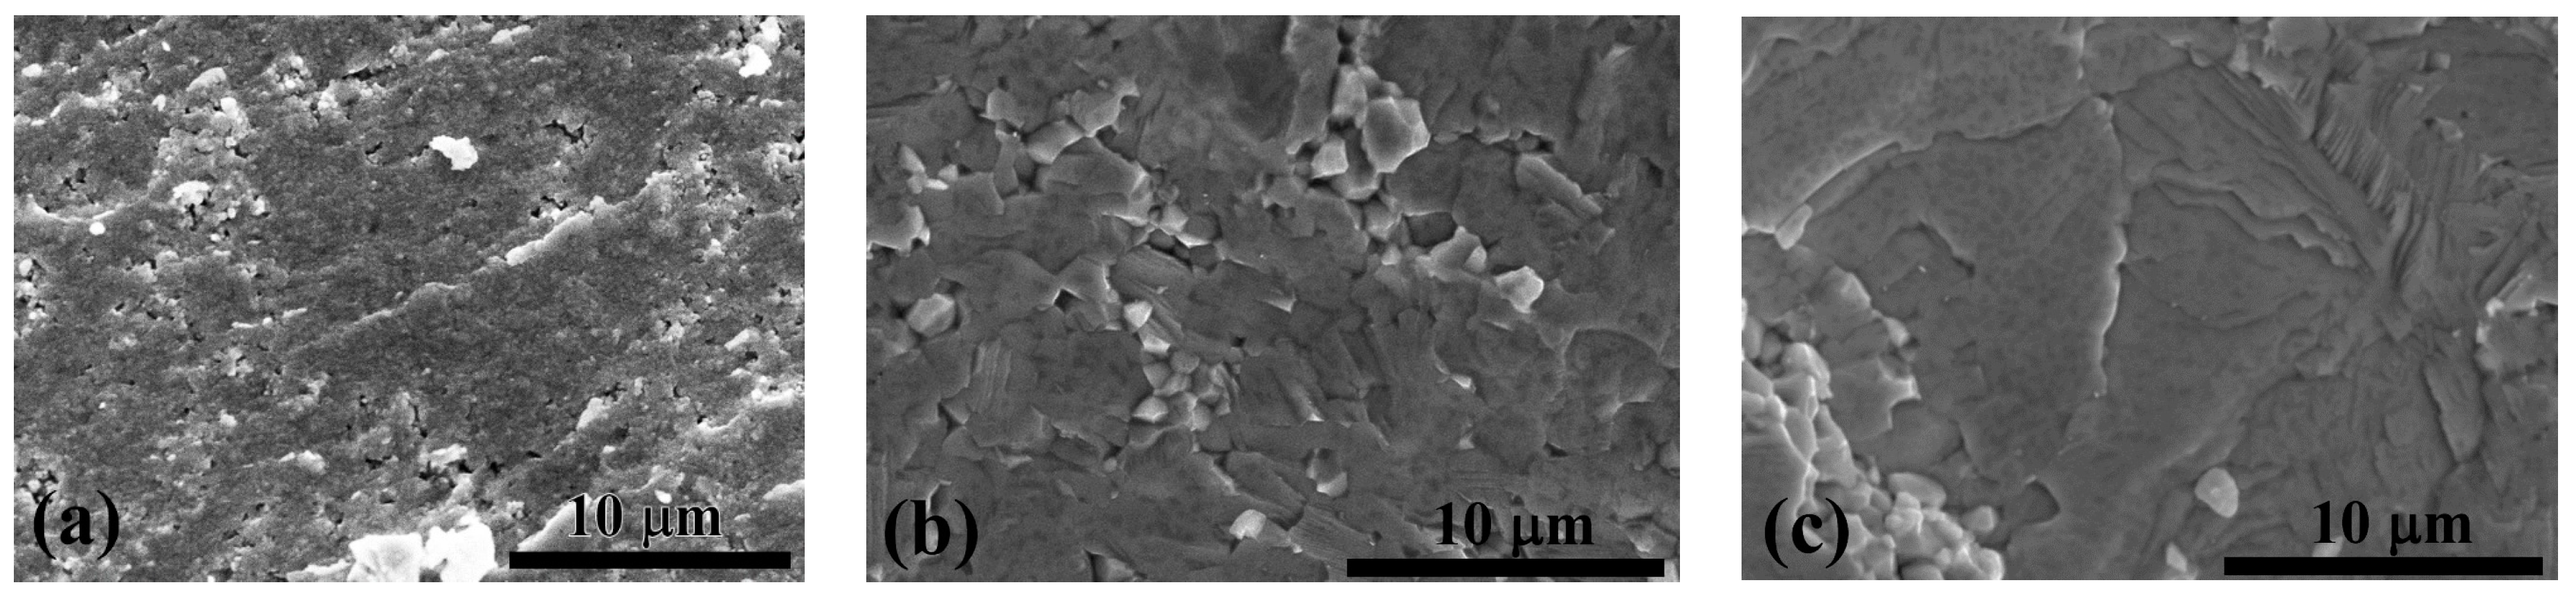
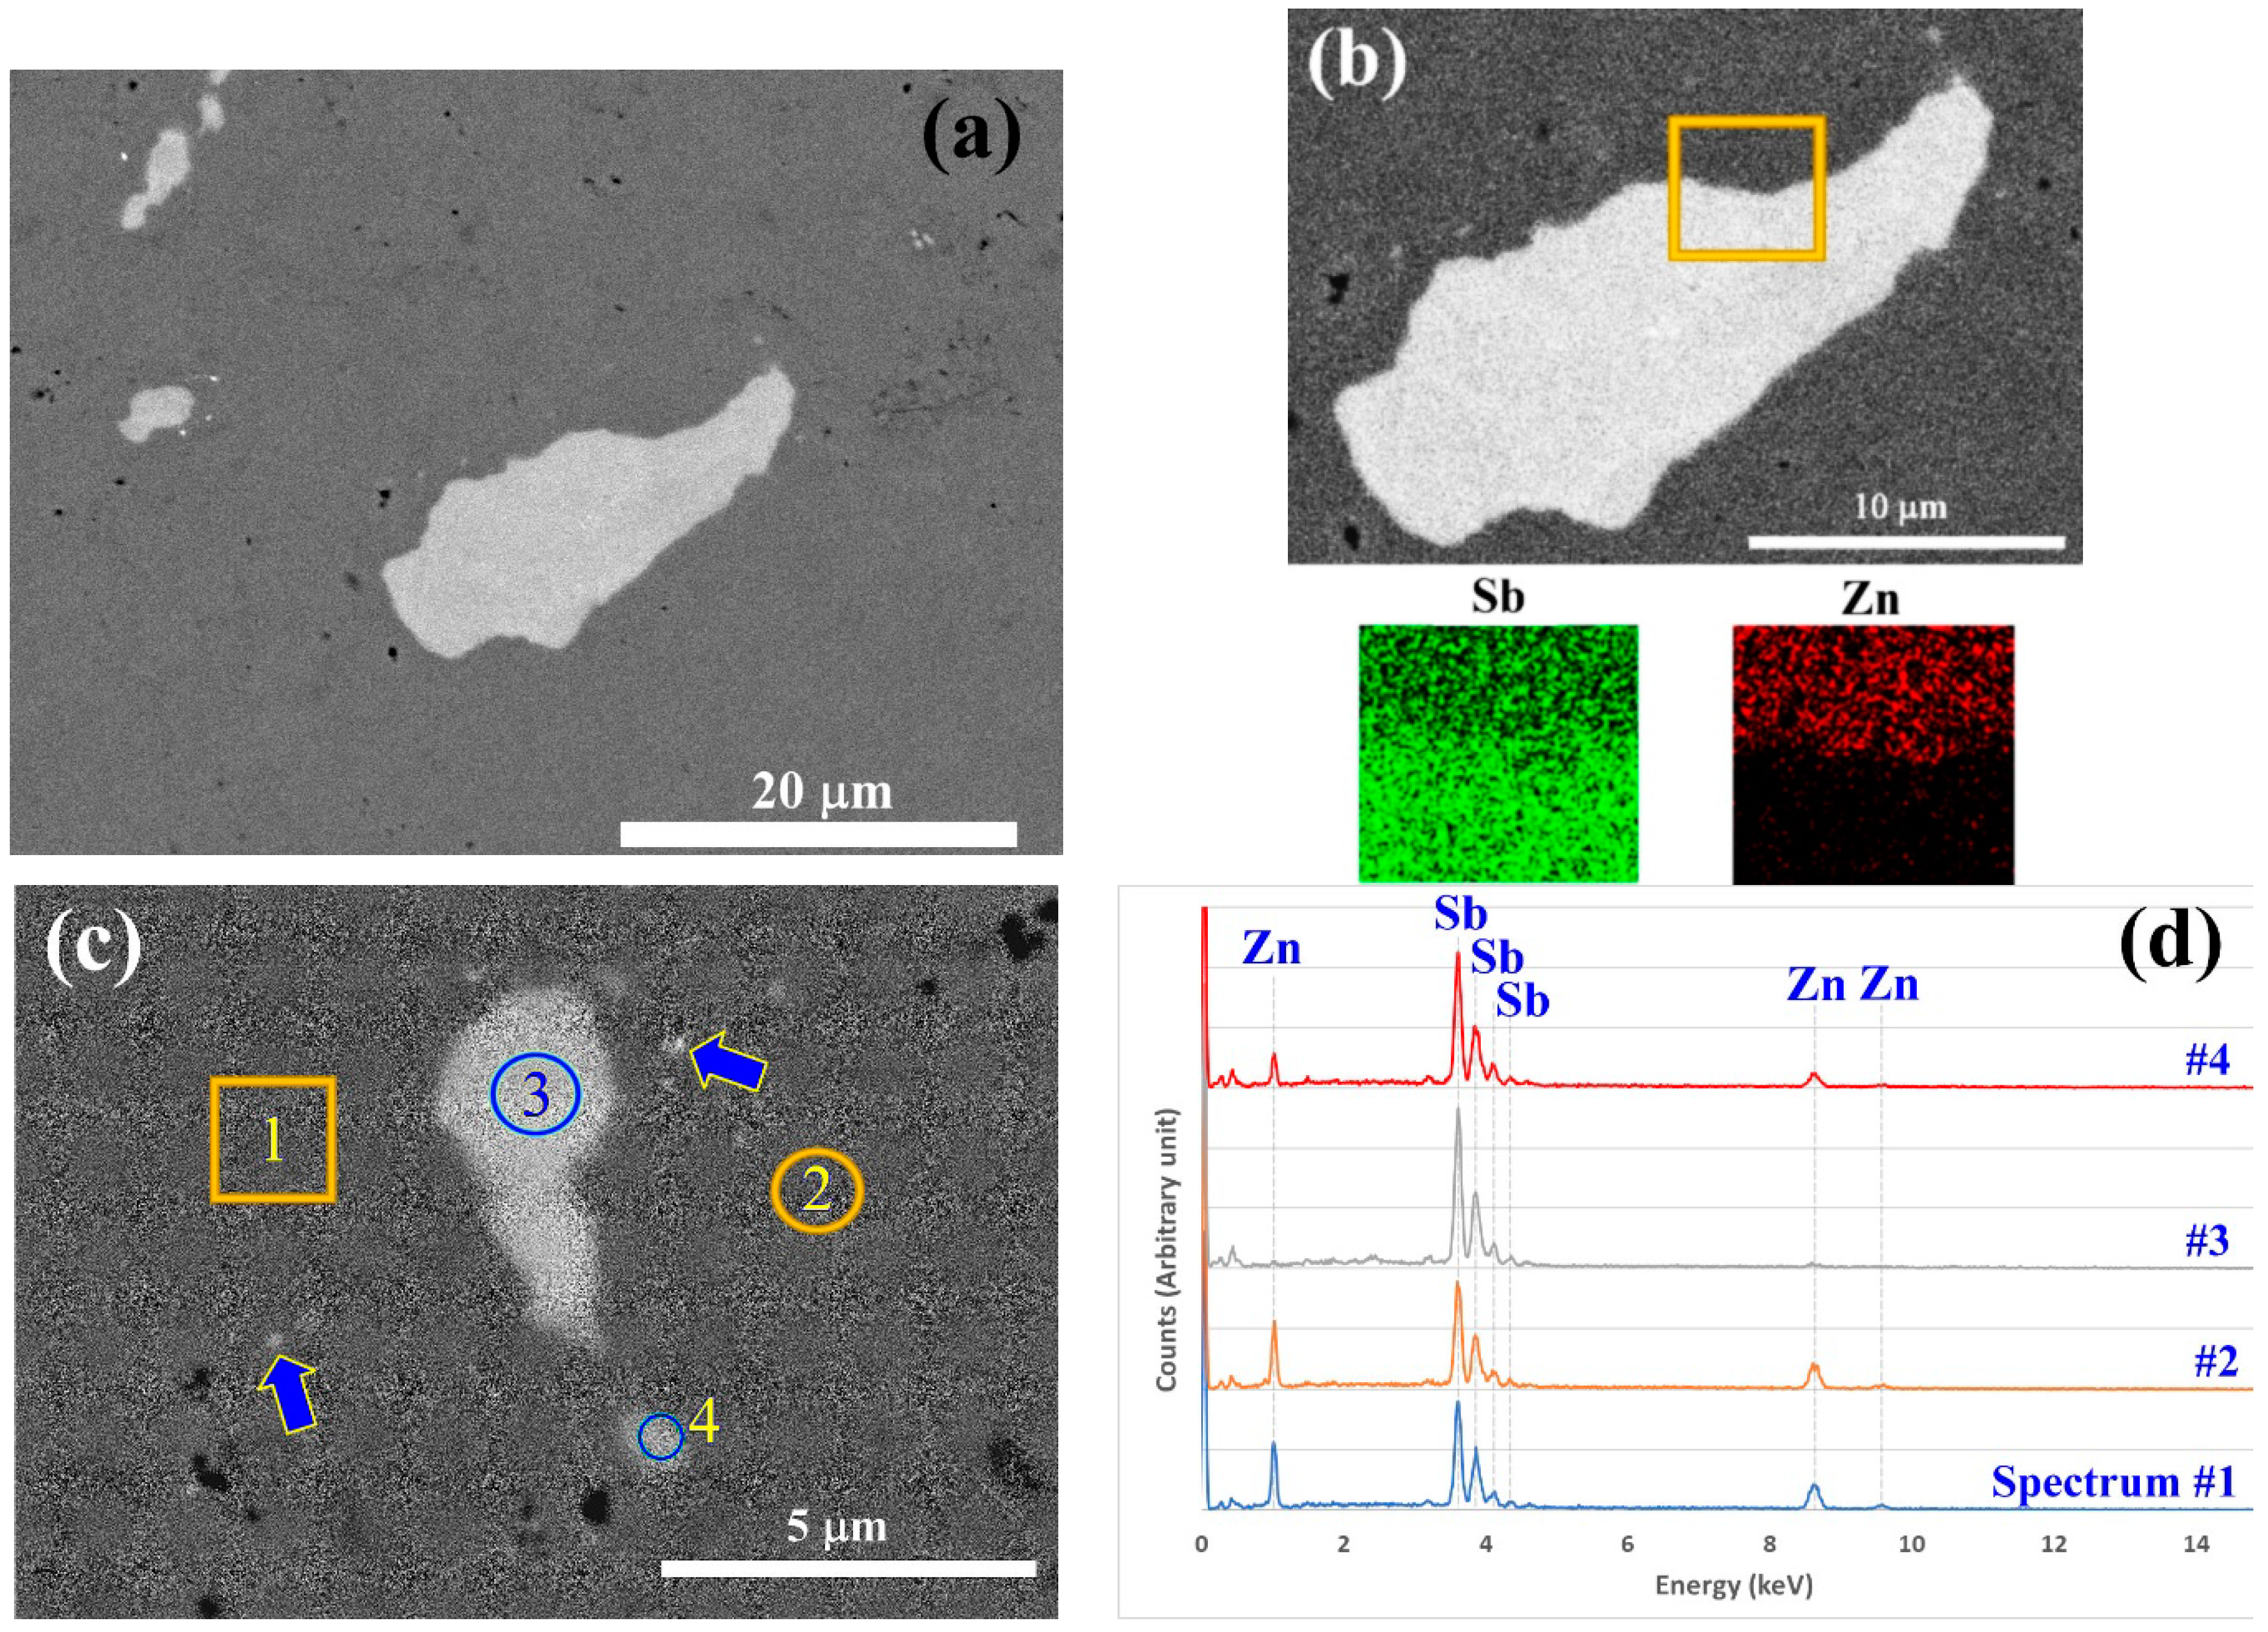
3.3. Microstructural Analysis

XRD analysis was carried out on the SM and extruded ZnSb and Zn13Sb10 samples (Figure 7a,b, respectively). Based on the diffraction data, the SM ZnSb samples were more than 95 wt.% pure and the SM Zn13Sb10 samples were almost 100% pure. The SM ZnSb samples contained a few weight percentages of Zn13Sb10 and pure antimony. The XRD patterns of the extruded ZnSb sample showed a higher percentage of the desired ZnSb phase and a lower amount of the Zn13Sb10 phase (Figure 7a). Although the extrusion of the Zn13Sb10 phase was carried out at a lower temperature compared to the ZnSb extrusion, the XRD analysis revealed significant decomposition of the Zn13Sb10 phase into ZnSb and pure Zn (Figure 7b). More details on the phase percentages of typical SM and extruded samples are presented in Table 1.
Overall, the XRD analysis showed success in producing high purity bulk ZnSb phase using hot extrusion, however, the Zn13Sb10 is not stable under the applied pressure and temperature used during the extrusion process. During the extrusions of SM ZnSb, the Zn13Sb10 impurity present in the sample appears to decompose into ZnSb and Zn, however, no Zn could be identified in the XRD pattern after the extrusion, yet the Sb content was increased. The absence of Zn can be attributed to evaporation during the extrusion process which is a common problem reported during sintering of the Zn-Sb-based materials, especially Zn13Sb10 [7,19].
SEM analysis was performed to survey the phase distribution in the extruded ZnSb sample. Figure 8 shows backscattered electron images of the regions, which contain Sb-rich phases. Sb phases with higher contrast in the images are not homogeneously distributed throughout the sample. On a surveyed surface of about 1 mm2, only a few areas with Sb-rich phases like those in Figure 8a could be observed. The size of the Sb-rich grains ranged from 20 microns to sub micrometer grains (grains highlighted by arrows in Figure 8c). The EDS mapping and point analysis of the Sb-rich grains (Figure 8b,c) showed that they are almost pure Sb. Table 2 presents the weight percentages of the elements in the scanned areas shown in Figure 8c and derived from the spectra presented in Figure 8d. According to the analysis, the matrix is homogeneous and has the composition corresponding to the ZnSb stoichiometry (theoretically there should be 34.9 wt.% of Zn and 65.1 wt.% of Sb).
Using the EDS analysis parameters, the interaction volume between the electron beam and sample, the trajectory of the electrons was simulated using the Monte Carlo approach with the CASINO V2.42 package. In this calculation, it was assumed that the top layer is pure Sb with 1-micron thickness and the substrate is made of ZnSb phase. The simulation results suggested that the interaction volume of the electron beam and the sample is larger than 1 micron for the given assumption and experimental parameters used. Consequently, the elemental analysis results for site #4 will be accurate only if the Sb-rich phase is more than 1.3 microns in diameter. Given that the particle is less than 1.3 microns wide, the composition is derived from the signals originating from both the Sb-rich phase and the matrix.
DSC analyses of the extruded samples are presented in Figure 9. The thermogram of the extruded ZnSb phase (Figure 9a) confirmed the stability of the material during the extrusion process since it is largely identical to the SM ZnSb (Figure 2). The small shift in the first peak of the extruded ZnSb compared to its SM counterpart can be attributed to the change in the composition of the hypereutectic mixture after the extrusion. The DSC analysis of the extruded Zn13Sb10 clearly showed instability of this phase during the extrusion process, where the first event for this material happens around 563 K followed by four other events up to 825 K.

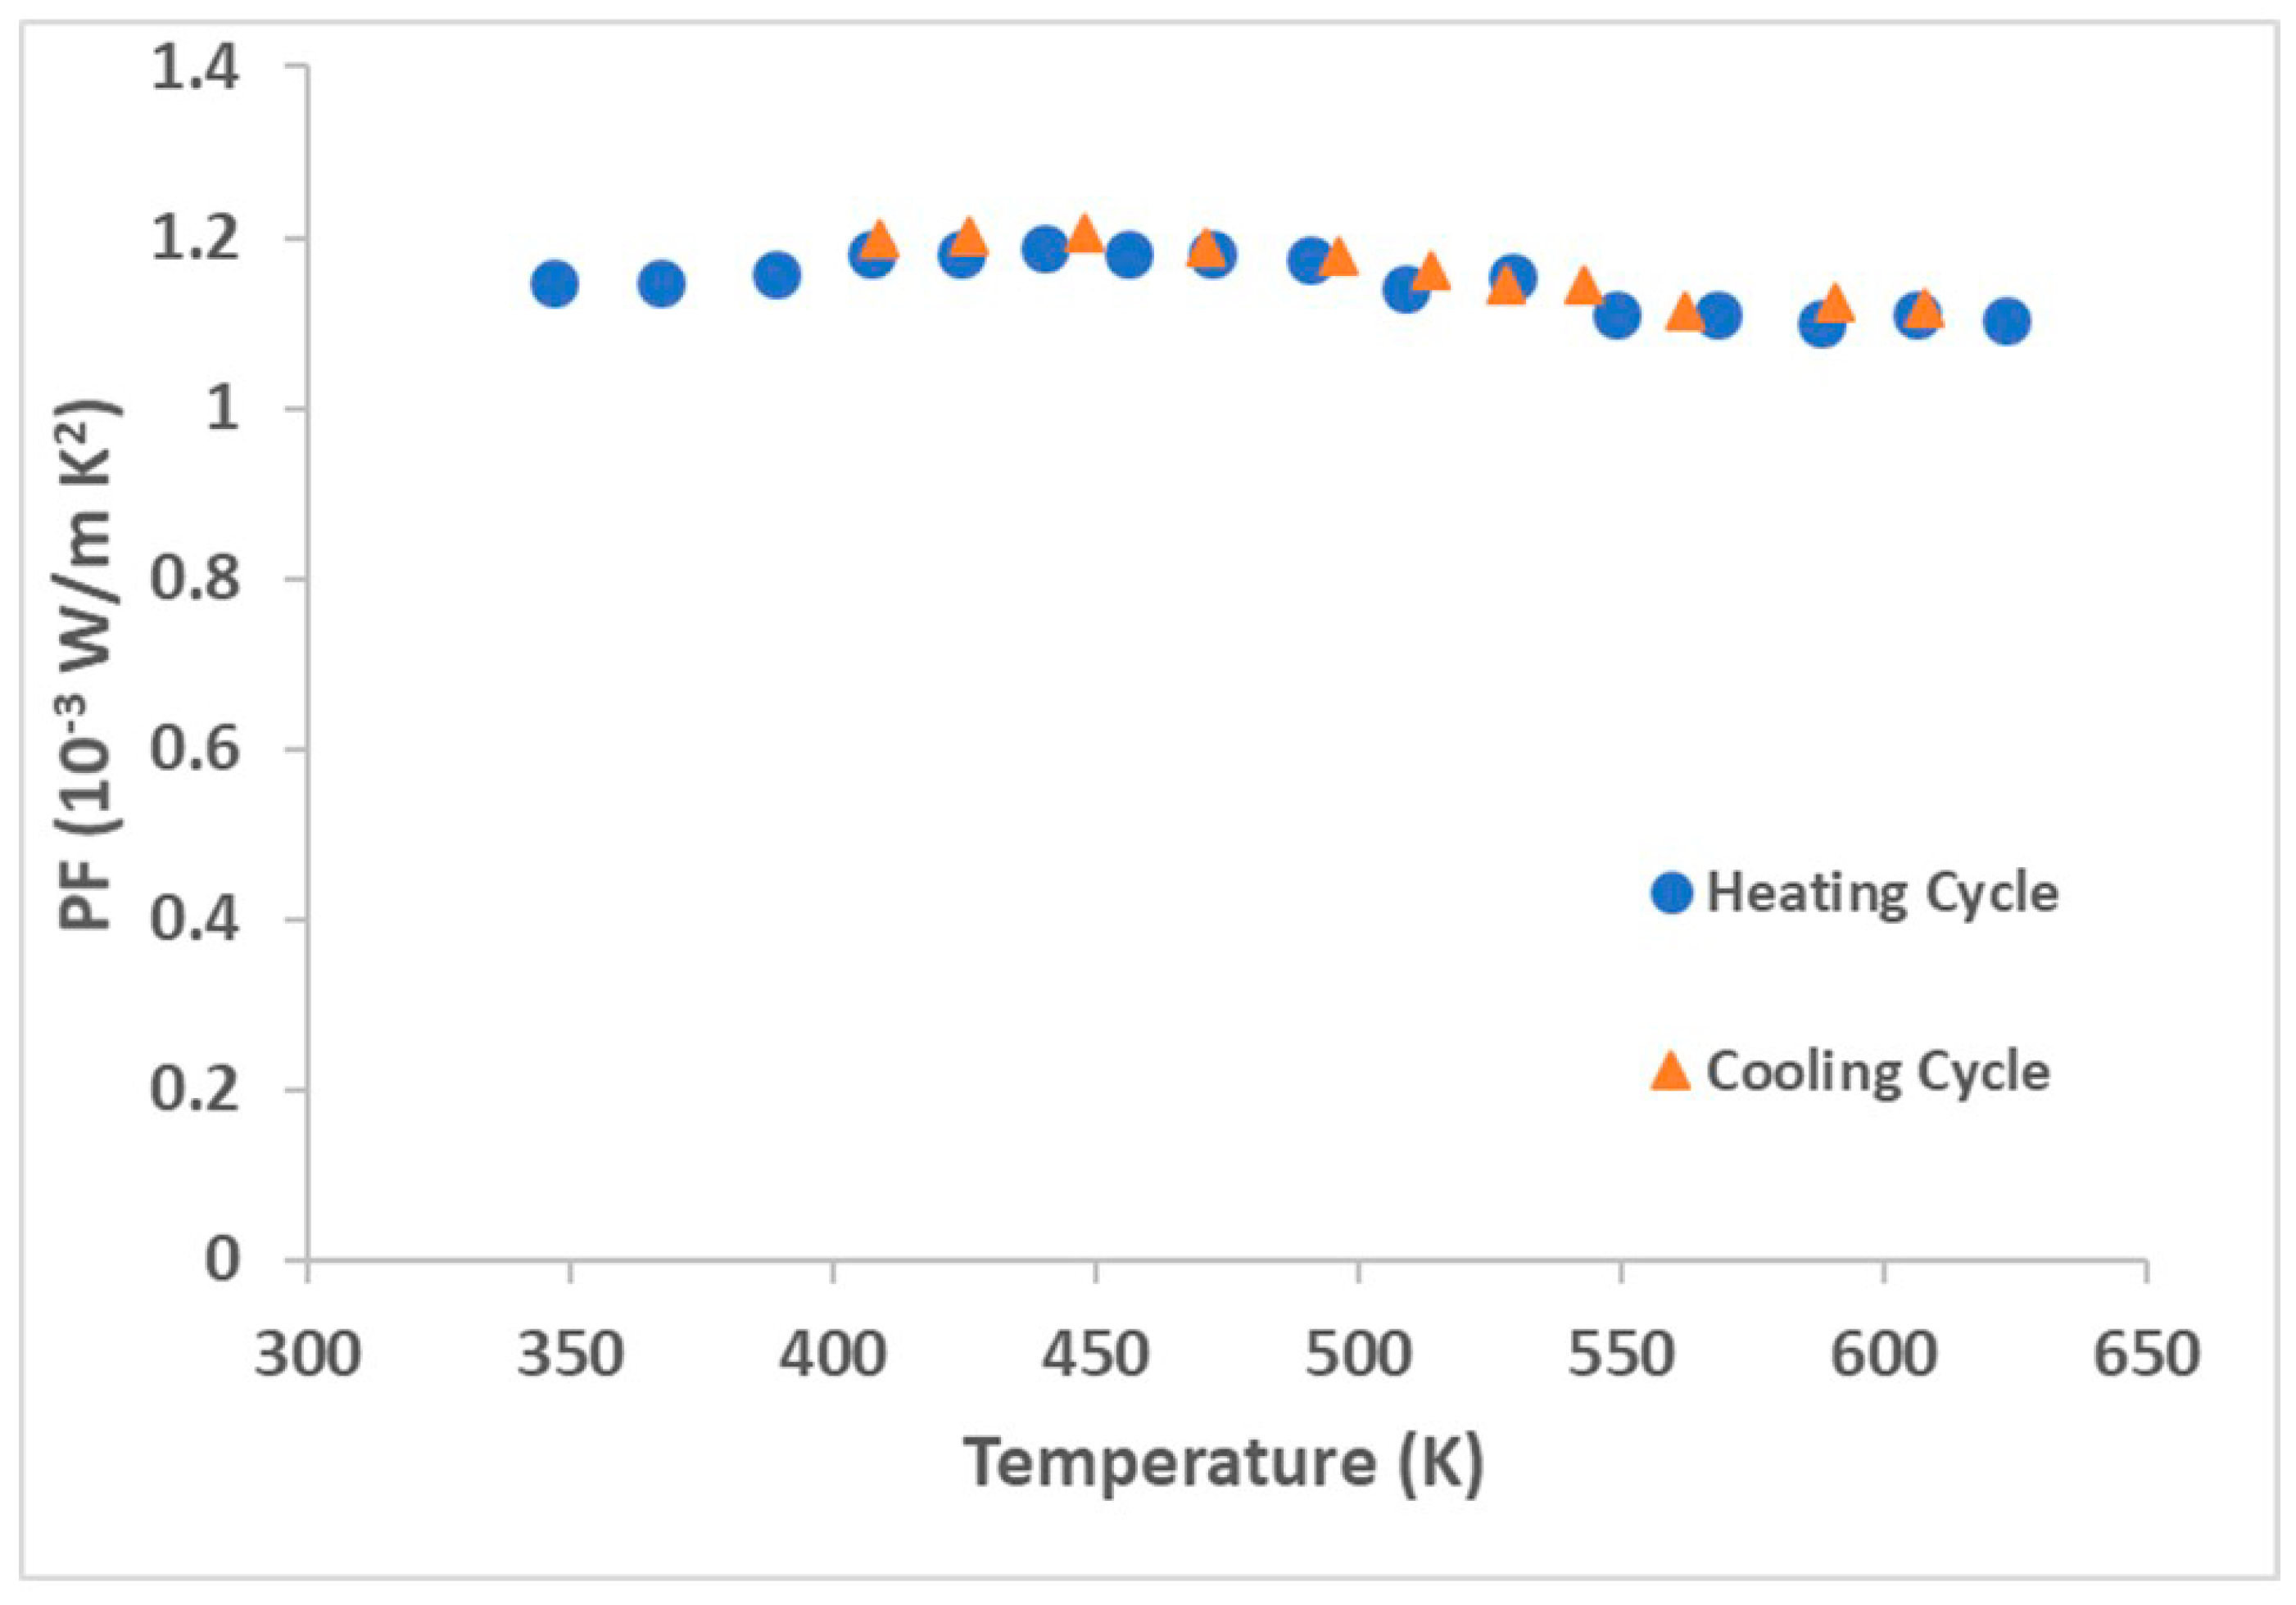
3.4. Thermoelectric Performance

The aim of the present manuscript was to present the technological development and accomplishment of high-quality final products in terms of purity. A demonstration and related discussion of TE properties of hot-extruded ZnSb samples will be presented, in detail, in a separate manuscript. The phase instability of the Zn13Sb10 phase during hot extrusion did not lead to well-intentioned samples for TE properties assessments. But, the PF of the ZnSb phase samples were evaluated in a heating/cooling cycle within a range from room temperature up to 625 K (Figure 10). The hot extruded ZnSb demonstrated a decent PF of around 1.1 × 10⁻³ W/m·K2 at 625 K (0.69 W/m·K) which is a reasonably high value compared to the PF of the well-known Zn13Sb10 compound, which is reported to be 1.3 × 10⁻³ W/m·K2 at 673 K (0.8 W/m·K) [20]. Further study and optimization of dopant and doping level in the hot extruded ZnSb samples can result in TE materials with superior performance. In addition, the PF of the sample at different temperatures during the heating and cooling cycles were identical, which indicates the stability of the material when exposed to thermal cycles. This result confirms the great feasibility of this production approach for producing high-quality and performance ZnSb TE materials.

4. Conclusions

In this work, hot extrusion was employed to produce high purity ZnSb-based thermoelectric materials. The extrusion process was optimized to reach high quality ZnSb products with reasonable production yields and suitable for industrial applications. The optimized process also yielded materials with high density and acceptable apparent mechanical strength required for common TE module fabrication processes such as slicing without cracking, as well as high TE performance. The presented extrusion process allows potential scaling up of the production from the current 20 g to kilogram quantities for this family of thermoelectric materials. In addition, the microstructural analysis showed very high purity of the extruded ZnSb samples, which further supports the feasibility of the current approach for scaled-up production. In contrast to ZnSb, the Zn13Sb10 phase is unstable during the extrusion and thus cannot be prepared by this method under these conditions. X-ray diffraction and microstructural analysis of the extruded ZnSb samples suggest some Zn evaporation during the process. Although the final product has already one of the best reported levels of phase purity, further work on the stabilization of Zn in the lattice by doping and/or alloying is recommended to avoid Zn evaporation and to enhance the quality of the product.

Author Contributions

Conceptualization, M.K.K.; Methodology, M.K.K., and C-W.T.L. (XRD experiment); Formal analysis, M.K.K., C-W.T.L. (XRD analysis); Resources, S.T.; Writing—original draft preparation, M.K.K.; Writing—review and editing, all the authors; Supervision, N.J.Q. and Y.M.

Funding

This research received no external funding.

Conflicts of Interest

The authors declare no conflict of interest.

References

  1. Goldsmid, H.J. Introduction to Thermoelectricity; Springer: Berlin/Heidelberg, Germany; New York, NY, USA, 2010; p. XVI, 242. [Google Scholar]
  2. Mehdizadeh Dehkordi, A.; Zebarjadi, M.; He, J.; Tritt, T.M. Thermoelectric power factor: Enhancement mechanisms and strategies for higher performance thermoelectric materials. Mater. Sci. Eng. R Rep. 2015, 97, 1–22. [Google Scholar] [CrossRef] [Green Version]
  3. Iversen, B.B. Fulfilling thermoelectric promises: β-Zn4Sb3 from materials research to power generation. J. Mater. Chem. 2010, 20, 10778–10787. [Google Scholar] [CrossRef]
  4. Shaver, P.; Blair, J. Thermal and electronic transport properties of p-type ZnSb. Phys. Rev. 1966, 141, 649. [Google Scholar] [CrossRef]
  5. Caillat, T.; Fleurial, J.-P.; Borshchevsky, A. Preparation and thermoelectric properties of semiconducting Zn4Sb3. J. Phys. Chem. Solids 1997, 58, 1119–1125. [Google Scholar] [CrossRef]
  6. Song, X.; Finstad, T. Review of research on the thermoelectric material ZnSb. In Thermoelectrics for Power Generation: A Look at Trends in the Technology; IntechOpen: London, UK, 2016. [Google Scholar]
  7. Ur, S.-C.; Nash, P.; Kim, I.-H. Solid-state syntheses and properties of Zn4Sb3 thermoelectric materials. J. Alloy. Compd. 2003, 361, 84–91. [Google Scholar] [CrossRef]
  8. Saadat, S.; Tay, Y.Y.; Zhu, J.; Teh, P.F.; Maleksaeedi, S.; Shahjamali, M.M.; Shakerzadeh, M.; Srinivasan, M.; Tay, B.Y.; Hng, H.H. Template-free electrochemical deposition of interconnected ZnSb nanoflakes for li-ion battery anodes. Chem. Mater. 2011, 23, 1032–1038. [Google Scholar] [CrossRef]
  9. Wang, G.; Shen, X.; Lu, Y.; Dai, S.; Nie, Q.; Xu, T. Investigation on pseudo-binary ZnSb–Sb2Te3 material for phase change memory application. J. Alloys Compd. 2015, 622, 341–346. [Google Scholar] [CrossRef]
  10. Song, X.; Valset, K.; Graff, J.; Thøgersen, A.; Gunnæs, A.; Luxsacumar, S.; Løvvik, O.; Snyder, G.; Finstad, T. Nanostructuring of undoped ZnSb by cryo-milling. J. Electron. Mater. 2015, 44, 2578–2584. [Google Scholar] [CrossRef]
  11. Okamura, C.; Ueda, T.; Hasezaki, K. Preparation of Single-Phase ZnSb Thermoelectric Materials Using a Mechanical Grinding Process. Mater. Trans. 2010, 51, 860–862. [Google Scholar] [CrossRef] [Green Version]
  12. Eklöf, D.; Fischer, A.; Wu, Y.; Scheidt, E.W.; Scherer, W.; Häussermann, U. Transport properties of the II–V semiconductor ZnSb. J. Mater. Chem. A 2013, 1, 1407–1414. [Google Scholar] [CrossRef]
  13. Kostur, N.; Psarev, V. Electrical properties of alloyed ZNSB single crystals. Izvestiya Vysshikh Uchebnykh Zavedenii Fizika 1967, 2, 39. [Google Scholar]
  14. Komiya, H.; Masumoto, K.; Fan, H. Optical and electrical properties and energy band structure of ZnSb. Phys. Rev. 1964, 133, A1679. [Google Scholar] [CrossRef]
  15. Keshavarz, M.K.; Vasilevskiy, D.; Masut, R.A.; Turenne, S. Mechanical properties of bismuth telluride based alloys with embedded MoS2 nano-particles. Mater. Des. 2016, 103, 114–121. [Google Scholar] [CrossRef]
  16. Vasilevskiy, D.; Masut, R.; Turenne, S. Thermoelectric and mechanical properties of novel hot-extruded PbTe n-type material. J. Electron. Mater. 2012, 41, 1057–1061. [Google Scholar] [CrossRef]
  17. Vasilevskiy, D.; Keshavarz, M.K.; Dufourcq, J.; Ihou-Mouko, H.; Navonne, C.; Masut, R.A.; Turenne, S. Bulk Mg2Si based n-type thermoelectric material produced by gas atomization and hot extrusion. Mater. Today Proc. 2015, 2, 523–531. [Google Scholar] [CrossRef]
  18. Fedorov, M.I.; Prokof’eva, L.V.; Pshenay-Severin, D.A.; Shabaldin, A.A.; Konstantinov, P.P. New Interest in Intermetallic Compound ZnSb. J. Electron. Mater. 2014, 43, 2314–2319. [Google Scholar] [CrossRef]
  19. Shai, X.; Deng, S.; Meng, D.; Shen, L.; Li, D. Thermal stability and electrical transport properties of β-Zn4Sb3 single crystal prepared by Sn-flux method. Phys. B Condens. Matter 2014, 452, 148–151. [Google Scholar] [CrossRef]
  20. Snyder, G.J.; Christensen, M.; Nishibori, E.; Caillat, T.; Iversen, B.B. Disordered zinc in Zn4Sb3 with phonon-glass and electron-crystal thermoelectric properties. Nat. Mater. 2004, 3, 458–463. [Google Scholar] [CrossRef] [PubMed]
Figure 1. (a) A schematic of the extrusion system where the powders get compacted in the extrusion cylinder and then pushed out of the die. (b) Cross-sectional view of a typical die used in this study. The presented table shows the corresponding extrusion ratio (ER) for each sample.
Jmmp 03 00058 g001
Figure 2. Thermogram obtained for the stoichiometric melting (SM) sample with the nominal ZnSb composition.
Jmmp 03 00058 g002
Figure 3. Particle size distribution (PSD) analysis of SM ZnSb milled for 10 min at 250 rpm with a planetary ball mill. Inset shows SEM secondary image of the powder.
Jmmp 03 00058 g003
Figure 4. (a) ZnSb and (b) Zn13Sb10 extruded using extrusion die with extrusion ratio (ER) = 3.08, (c) three ZnSb samples extruded with three dies of different ERs. Arrows show the extrusion direction in each panel.
Jmmp 03 00058 g004
Figure 5. Relative density of the ZnSb samples extruded with different ERs.
Jmmp 03 00058 g005
Figure 6. Fractured surfaces of extruded ZnSb with ER of (a) 1.56, and (b) 3.08, and (c) 6.9.
Jmmp 03 00058 g006
Figure 7. XRD patterns of SMed and extruded (a) ZnSb, and (b) Zn13Sb10 samples. Unlabeled peaks correspond to the major phase of each sample. The patterns at the bottom of each panel show the difference between refined and measured patterns after fitting for extruded samples.
Jmmp 03 00058 g007
Figure 8. Backscattered electron images (ac) of extruded ZnSb that show Sb-rich regions within the ZnSb matrix. (b) The energy dispersive X-ray spectroscopy (EDS) map of the selected area with a high content of Sb and very low amount of Zn. Arrows in panel (c) show sub-micron Sb-rich particles. (d) EDS spectra of the selected areas indicated in panel (c).
Jmmp 03 00058 g008
Figure 9. Differential scanning calorimetry (DSC) analysis of extruded (a) ZnSb, and (b) Zn13Sb10 materials.
Jmmp 03 00058 g009
Figure 10. Power factor (PF) of hot extruded ZnSb sample in a heating/cooling cycle.
Jmmp 03 00058 g010
Table 1. Phase percentage and unit cell volume of the phases extracted from the Rietveld refinement. The numbers in parentheses show the standard deviation of the reported values.
SampleZn13Sb10 (wt.%)ZnSb (wt.%)Zn (wt.%)Sb (wt.%)Unit Cell Volume (Å3)
Zn13Sb10 (SM)100%---------1608.07 (7)
Zn13Sb10 (Extruded)58.53 (3)40.33 (3)1.21 (3)---1609.92 (6)
ZnSb (SM)4.65 (1)95.25 (5)---0.14 (3)388.31 (1)
ZnSb (Extruded)0.83 (1)98.24 (4)---0.26 (5)388.10 (2)
Table 2. Elemental analysis of selected areas in Figure 8c, derived from the spectra in Figure 8d.
Spectrum #Sb (wt.%)Zn (wt.%)
166 ± 134 ± 1
267 ± 1.233 ± 1.2
397 ± 0.83 ± 0.8
483 ± 117 ± 1

