1. Introduction
Wire arc additive manufacturing (WAAM) has become a promising fabrication method, yet has seen limited use in industry. In WAAM, a directed energy deposition (DED) additive manufacturing process derived from arc welding is used as the heat source and a metallic wire directly feeds the process as the main feedstock. The power source and shielding gases are usually the same as used in arc welding. Several works have been dedicated to property evaluations of the manufactured parts and aggregated technologies (path programming, grain texture refinement, thermal and/or mechanical post processing, non-destructive examination, etc.) have reached the level to have WAAM be technically applicable, even though there is still room for operational process characteristics and feedstock improvements. However, as a disruptive technology, the cost of the produced parts compared to the traditional competing manufacturing methods (casting, forging, and machining, mainly) is the key issue that will determine the market share of this manufacturing method. According to Cunningham et al. [
1], cost is usually the key point for decision making and cost modelling, as is a break-even analysis for determining manufacturing process selection.
Some papers about cost modelling applied to additive manufacturing are already found in the current literature. Martina and Williams [
2], for instance, presented a cost model which compared the cost of a part produced via the traditional route (machined from solid) to a finished part made using WAAM. The aim was to provide a tool to make informed decisions when assessing the convenience of one from the two manufacturing routes for a particular part, as well as to assess the sensitivity of process cost, material, or machine parameters. By demonstrating that a powder-based process has a cost of deposition higher than machining from solid, they showed the importance of the low deposition rate of powder-related methods in the cost analysis. Fera et al. [
3], in turn, presented a novel approach to classify and analyze the production of specific products using additive manufacturing (AM) or subtractive manufacturing (SM), applying complexity as a decision guide and not only the number of products to manufacture. They observed that the traditional cost formulation approach is conservative in favor of SM. However, the cost related to the production with SM grows as a function of the part complexity. Other aspects, such as the environmental impact of WAAM, was examined in Bekker and Verlinden’s publications [
4]. Results indicate that the environmental impact of WAAM production is comparable to green sand casting. When the casting, machining, and WAAM are compared in an environmental sphere, they state that the outcome can vary significantly based on product shape, function, materials, and process settings.
Cunningham et al. [
1] state that the activities of the WAAM production process chain are identified according to the major production processes. Adapting their statement slightly, these processing-related activities can be listed as substrate preparation, setup, deposition processing, cooling, post operation, machining, substrate removal, and inspection. As seen, WAAM has several facets, making a comprehensive cost model still a challenge. Further work in this direction is still demanded. By focusing on process setting (only part of deposition processing), the number of published studies in the current literature which relate parametrization and costs are not so broad, contrary to the relationship parameters-resulting parts. In recent years, several WAAM review papers have been published by leaders in the field, covering the state of the art and some future perspectives of the technology. Williams et al. [
5], for instance, discuss strategies on how to manage residual stress, improve mechanical properties, and eliminate defects, such as porosity. Ding et al. [
6] believe that poor accuracy and the surface finish of the process limit the applications of wire-feed AM technologies. For Xiong et al. [
7], the surface quality of parts deposited in Gas Metal Arc Welding (GMAW)-based additive manufacturing is worse than the one with parts fabricated in selective laser melting, for instance. From Ding et al. [
6], it can be complemented that the surface accuracy of wire-based AM processes cannot match the resolution offered by powder-based AM processes. However, it has been demonstrated that the relatively low surface accuracy can be improved by appropriate path planning (Ding et al. [
8]) or high accuracy machining between each deposition layer, as shown by Ruan et al. [
9]
Definitely, the dimensional precision, top surface regularity (undulations), and lateral surface finish (also labeled in the dedicated literature as surface roughness, waviness, and stair-stepping) affect the cost of deposition processing. Thereafter, these three factors, when grouped, will be referred in this work as wall quality. Xiong et al. [
7] studied the effects of main WAAM process parameters on the wall quality. They observed that, with other parameters being constant, the interlayer reduction temperature is associated with the increase of the surface quality of thin-walled parts. They indicated that the wire feed speed (WFS) is the major influence factor for the forming appearance of thin-walled parts. In addition, by maintaining the ratio of wire feed speed to travel speed (TS) constant, the surface roughness increases with the increasing wire feed speed (a lower wire feed speed matching a lower travel speed can decrease the surface roughness). In another publication, Xiong et al. [
10] affirmed that the quality of wall formation decreases with the arc mean current (Im) increase.
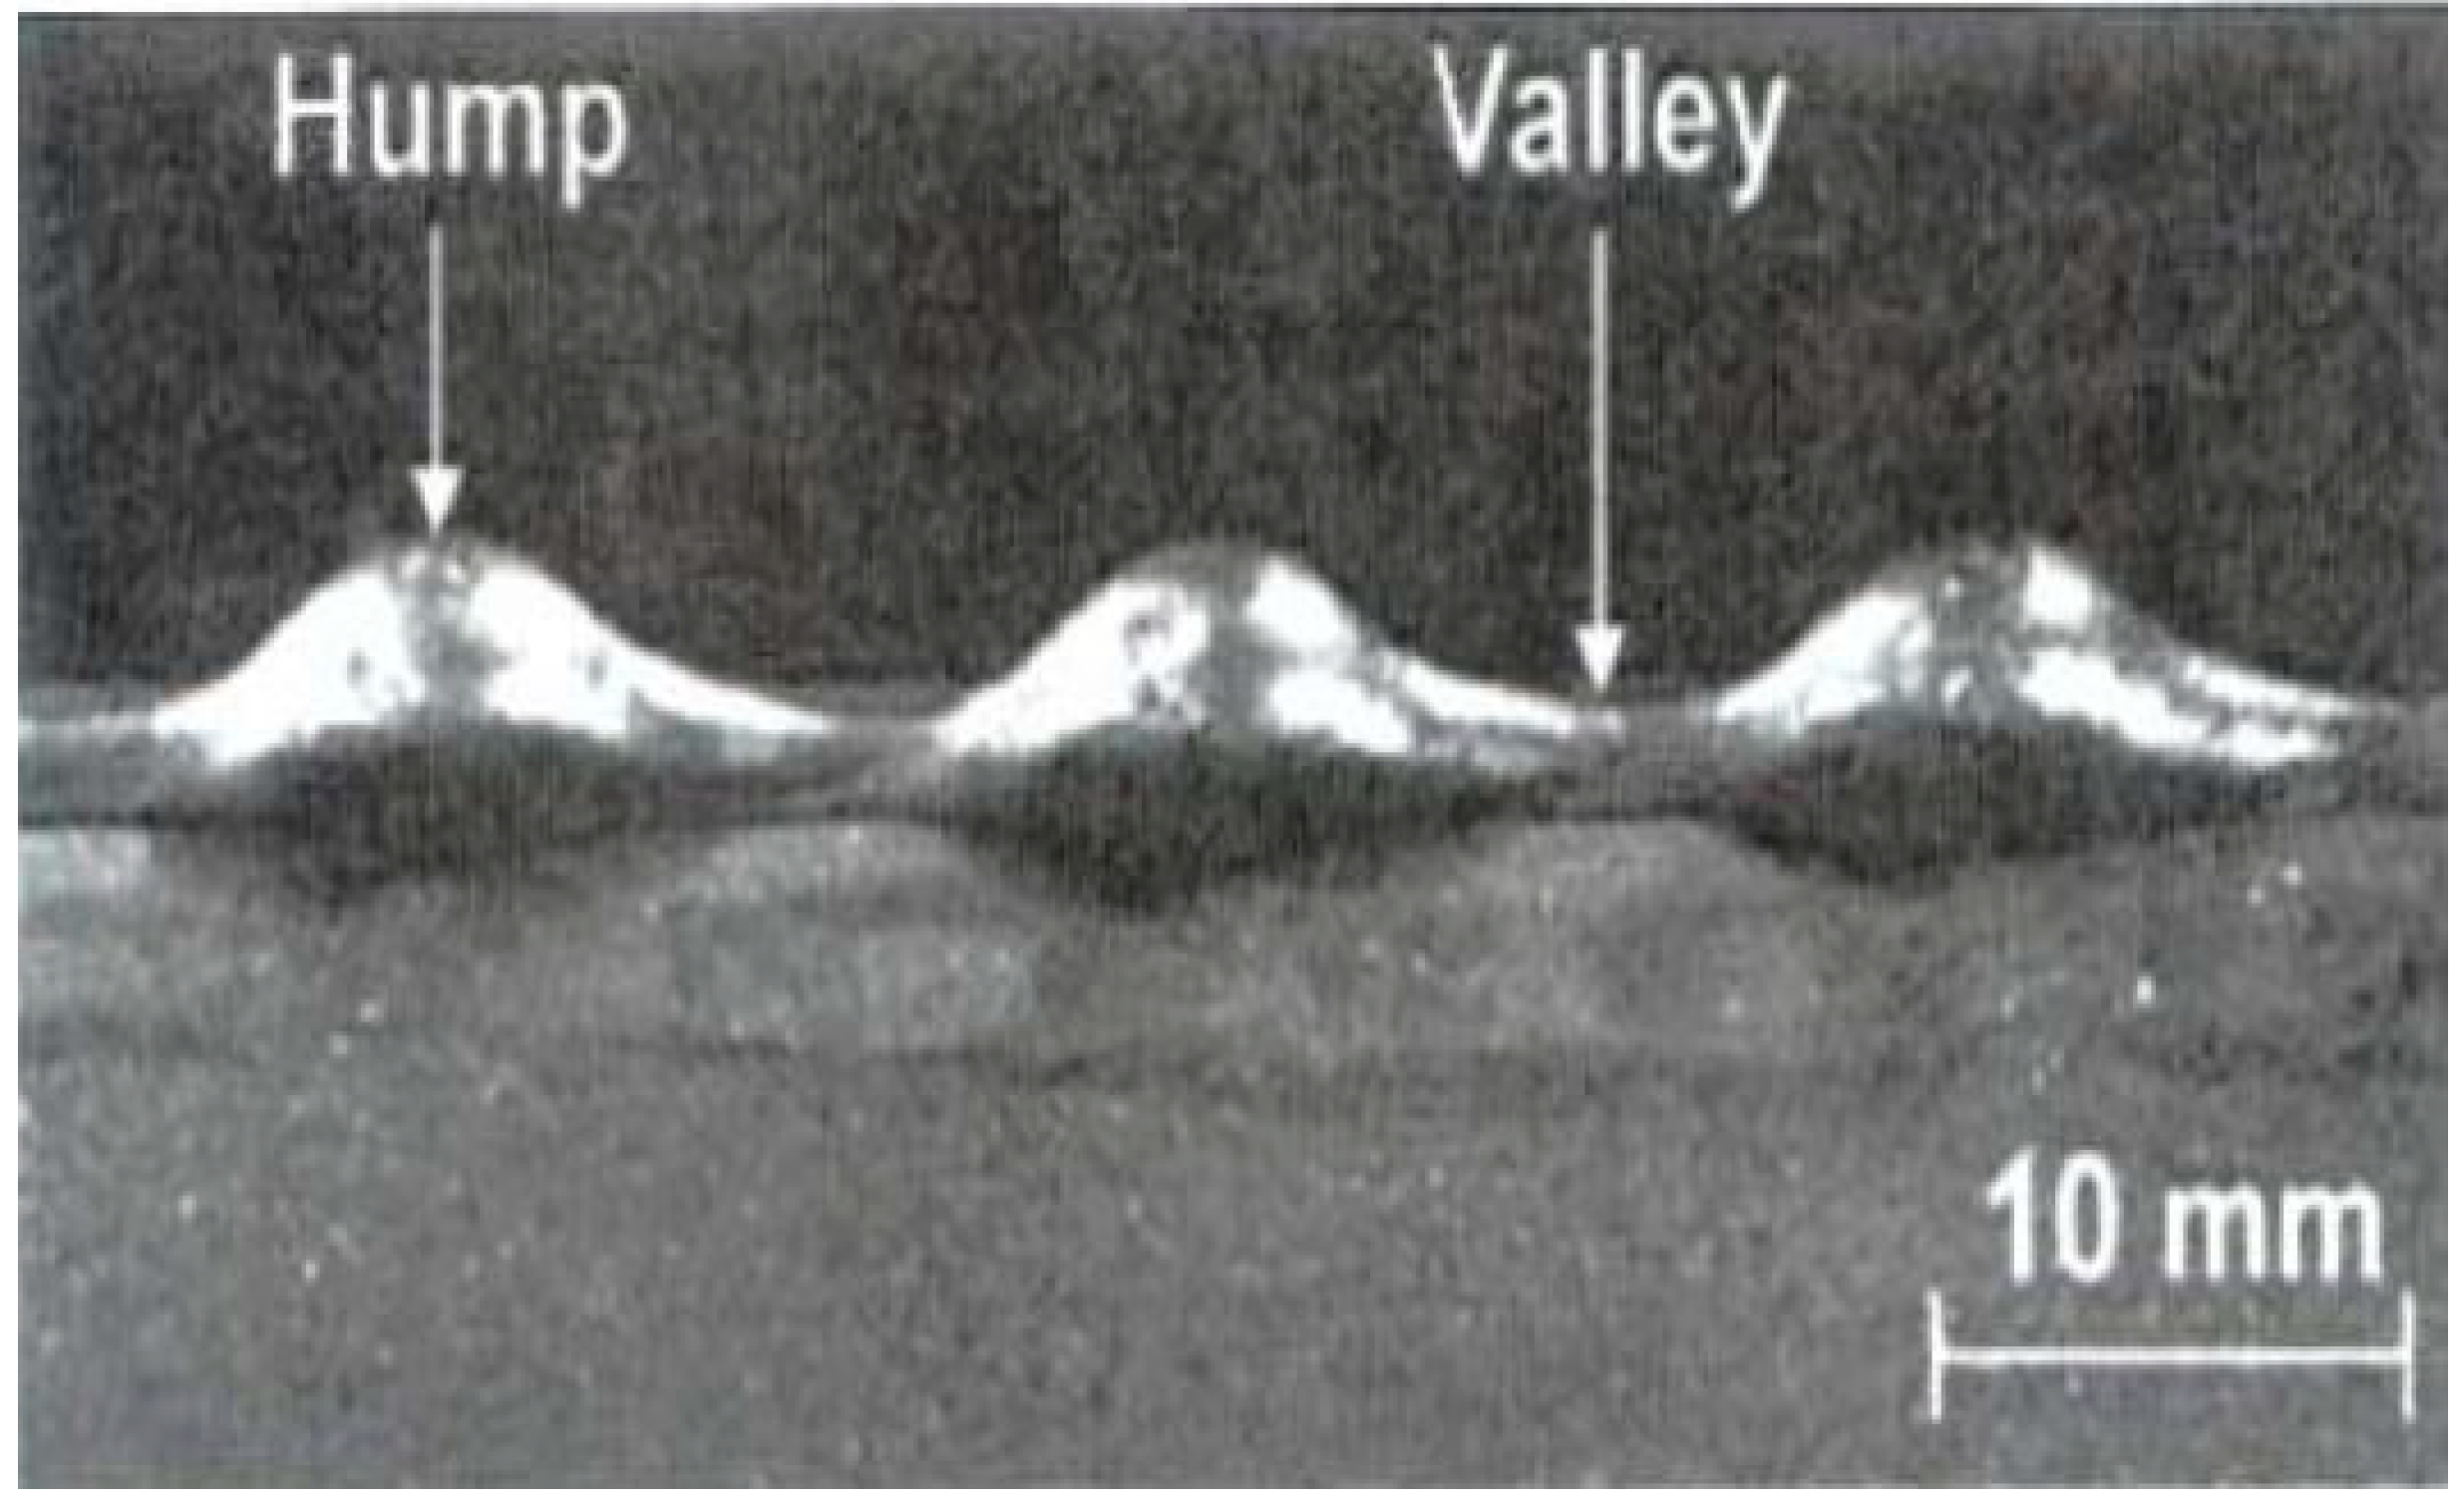
On one hand, as suggested above, WFS, Im, and TS, amongst others, affect the wall quality. On the other hand, they also affect the cost analysis (cost of quality). Carrying out the same additively manufactured part using higher travel speeds would mean, at first glance, low production time. However, at a critical value of travel speed, the deposited layer does not form properly. The main characteristic of the layer disfigurement is the formation of humps and valleys over the layer top surface at almost regular intervals during welding (
Figure 1). There is no consensus about the nature of the humping phenomenon, yet different models have been proposed and published to describe the mechanism of humping formation in welding. These models were described in detail by Soderstrom and Mendez [
11]. To summarize their work, there would be five main models that describe humping formation, namely, the Marangoni model, compound vortex model, hydraulic jump model, capillary instability humping model, and arc-induced humping model.
Unfortunately, there are not enough experimental works to confirm or refute any of these theoretical models. Despite this, there is consensus that this undulation phenomenon happens mainly at high travel speeds (for instance, Wu et al. [
12] and Ye et al. [
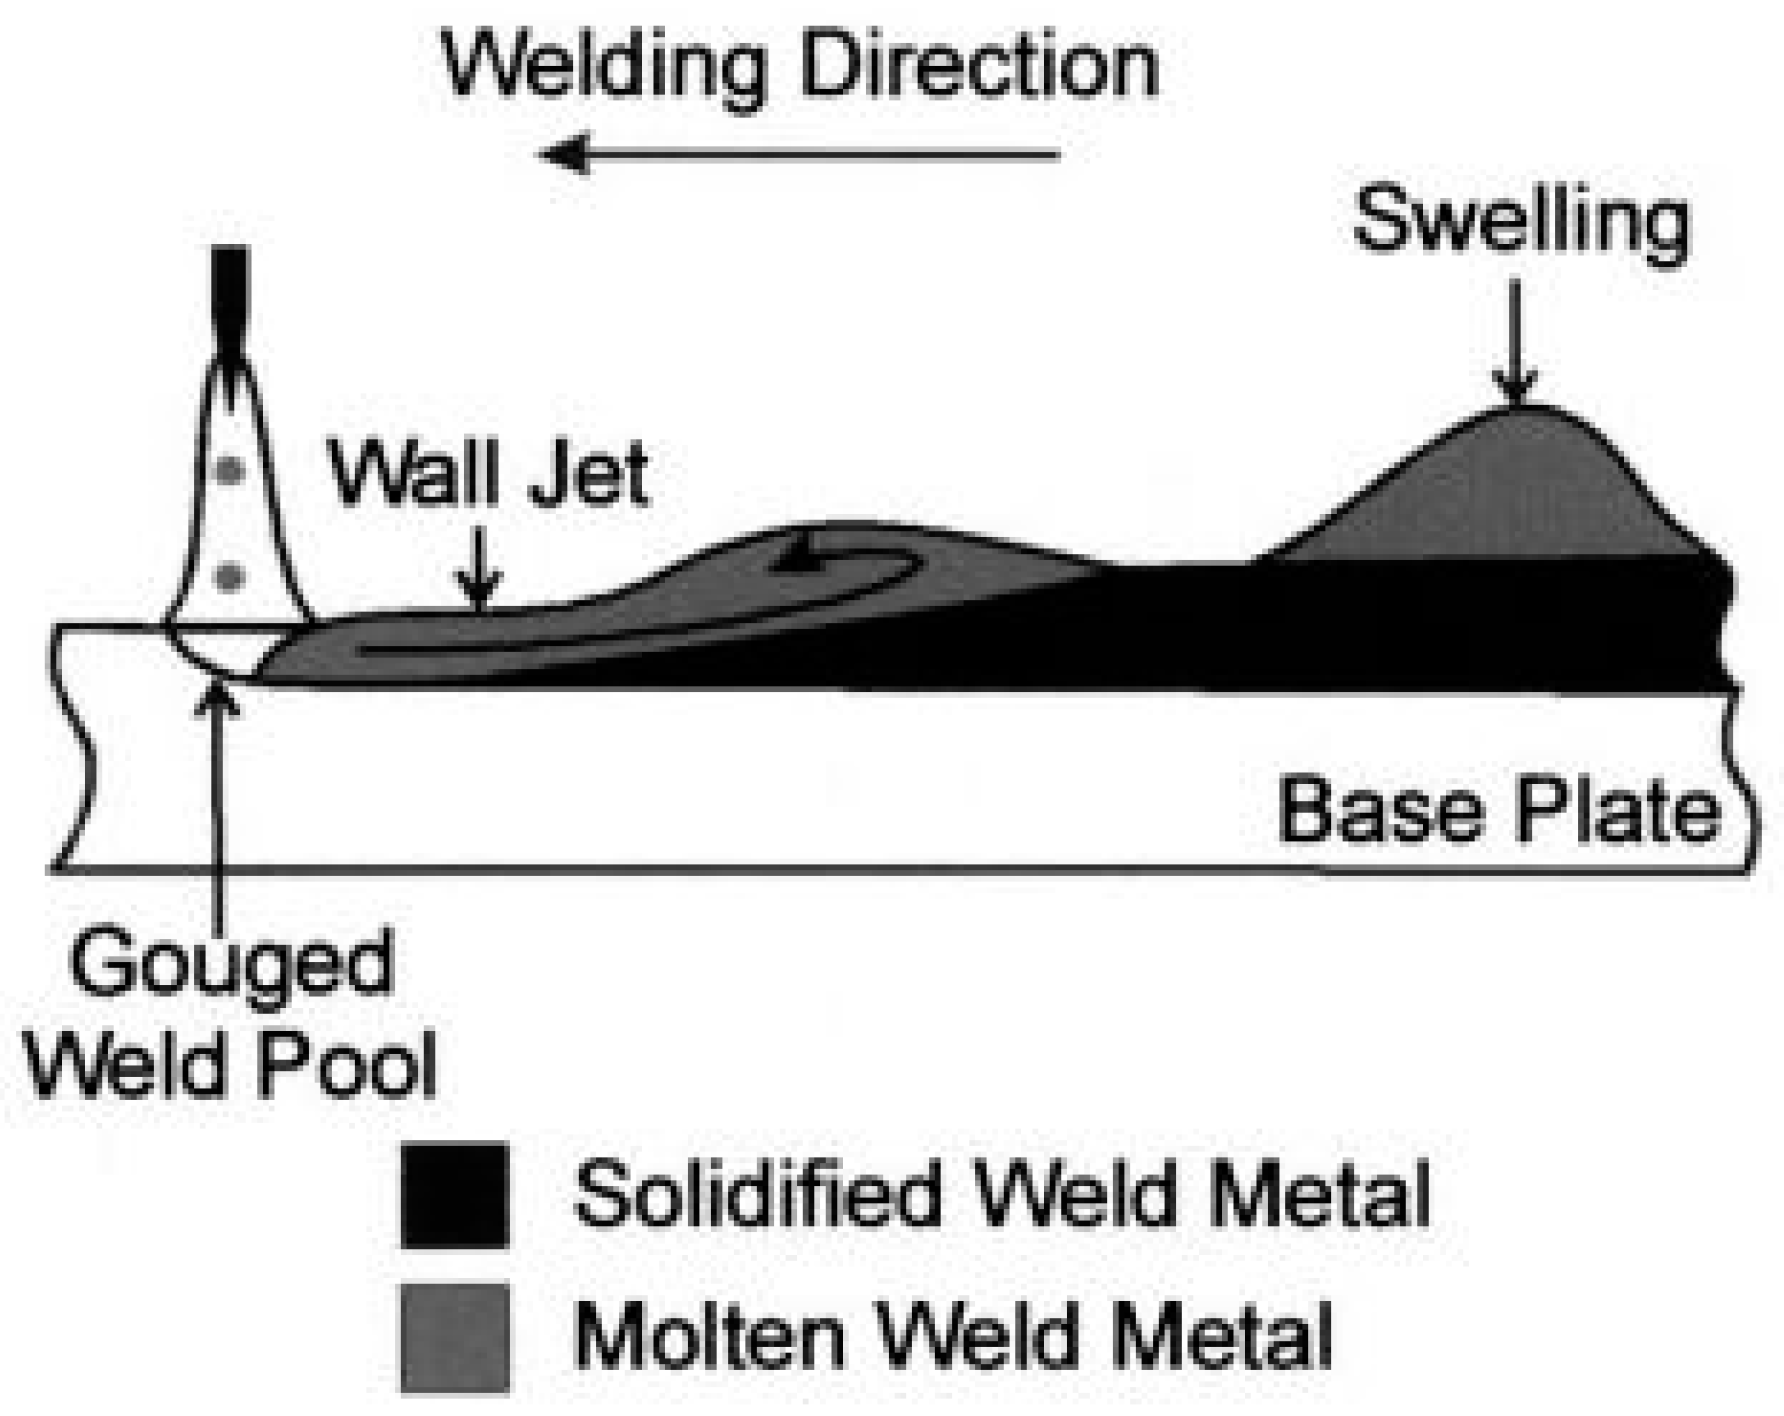
13]). Nguyen at al. [
14] cite that the occurrence of humping limits the range of usable travel speeds in most fusion welding processes and prevents further increases in productivity in a welding operation. Their proposal was to identify and experimentally validate the physical mechanisms responsible for the humping phenomenon during high speed gas metal arc welding of plain carbon steel. The mentioned authors credited this to a strong momentum of the backward flow of molten metal in the weld pool that typically occurred during high speed welding as the major factor responsible for the phenomenon, as illustrated in
Figure 2.
Therefore, in theory, it is essential for production cost optimization to identify travel speed limits for layer depositions in WAAM. However, there are other wall quality aspects besides top surface undulations to define the built-up part functionality and cost, such as dimensional precision and lateral surface finish roughness, which affect the cost of deposition processing. In agreement, Ding et al. [
6] cite that there is a trade-off between the high deposition rate and high resolution while selecting which type of AM process to use for a certain component. In addition, to make the same part with lower travel speed, yet with the same deposition rate, would mean a lower number of layers to complete a wall. “Dead time” between subsequent layers can be a strong parameter to reach break-even. Finally, same deposition time can be obtained by increasing the deposition rate (higher current), once the wall quality is preserved.
Unfortunately, lower cost is not necessarily correlated to quality. Furthermore, cost and wall surface quality are aspects not usually treated together in articles about wire+arc additive manufacturing (WAAM). Insufficient attention has been given to the wall surface quality in the cost analysis of WAAM parts. Thus, this work aimed, through a case study of a multilayer-non-oscillated single pass wall made of an Al-Mg alloy, to propose, apply, and evaluate a strategy to assess the potential reduction of production cost during WAAM based on the combination of travel speed (TS) and wire feed speed (WFS). A complementary objective is to identify the effect of TS and WFS on the wall surface quality, inside and outside the range of TS that provides sound layers.
2. Methodology and Methods
The methodological ground for developing this work was the assumption that in WAAM the molten metal pool must present a proper volume for a given deposition rate and current. If this volume is too large, the pool tends to flow out of the precedent deposited layer. If this volume is too small, the conditions for the existence of humps take place (low heat transferred to the prior layer). It can be expected to always exist an adequate range of pool volumes (for a given material, wall thickness, and arc energy) for WAAM, and not just one pool volume. This pool volume range can be determined by increasing progressively the travel speed for several wire feed speeds previously defined. However, pool volume is difficult to measure. Therefore, in this work travel speed will be taken as the comparation parameters.
The experimental rig is shown in
Figure 3. A customized computer numerically controlled (CNC) three-axis worktable was chosen instead of a robotic system for torch manipulation, because it can be easily programmed by G-Code to weld any geometrical configuration if needed. The welding torch moved only in the Z-axis (layer height increments and contact tip-to-workpiece distance—CTWD—settings), while an X-Y slide table, with a fixture for the substrates over the table, was designed to move on the horizontal plane. This implement allowed to program straight line beads, one over the others. The contact tip distance to the surface top of the previous layer was set and kept constant by the worktable at fixed distance (15 mm, checked before starting each layer). To protect the heated zone (ahead and behind the pool), a home-designed trailing gas device was used.
WAAM walls were built through sequential deposited layers of an aluminum-magnesium alloy (no torch oscillation). A GMAW Fronius CMT equipment (Fronius International GmbH, Wels, Austria, CMT standing for Metal Cold Transfer) was chosen for the deposition process, due to its regular deposition (Wang, et al. [
15]), low heat input (Selvi et al. [
16]) per deposition rate and weaker arc pressure. The authors of the present work consider that a commandment to reach wall surface quality (low waviness) is to minimize heat input/heat accumulation under the layer and to use lower arc pressure, to avoid pool lateral sag (downward lateral running). This can be achieved, for a given material and wall thickness, by using short arc, lower current-travel speed ratio, lower and constant interlayer temperature, and gas composition that favors cathodic emission concentrated in the arc center line. Therefore, the synergy line for AlSi5-1.2 mm-100% Ar was used (the line for the Al-Mg5 was not available, but it is very similar), with arc voltage correction 13% and hotstart time of 0.2 s.
The common set parameters for all the experiments were:
Welding wire = AWS/SFA 5.10 ER5356 (Al-Mg5);
Contact tip-to-workpiece distance (CTWD) = 15 mm;
Shielding and trailing gas = Ar 4.5 at a shielding gas flow (GFR) of 15 L/min; and
Set Wire feed speed (WFS) = 4.9 m/min.
It is important to mention that in the CMT operational mode the output values of WFS may not be the same as the setting value, because the control adapts this value accordingly to the synergy line. Current and voltage values are a consequence of the other parameters for the given synergic line. They were monitored by a digital datalogger (5 kHz, 12 bits), current through a Hall sensor surrounding the ground cable and voltage collected between the contact-tip (adapted torch) and the fixture. However, the oscillation of these values is very small when CMT is properly operated.
Each printed wall consisted of 15 layers on the substrate, which was made from commercially-pure aluminum bars (190 mm × 50 mm × 6 mm). Each layer was deposited in an inverse direction, i.e., bi-directionally, to maintain higher uniformity of the wall dimensions at both wall ends, as already demonstrated in the literature (for instance, by Graf et al. [
17]). Substrate bucking and uneven heat concentration during the deposition would interfere in the layer formation, impairing the comparisons. Therefore, one methodological approach related to the substrates was to have them positioned upright in relation to the lateral of the bar, as indicated in
Figure 3, rather than laying on the horizontal position as most used. Therefore, the first layer was deposited over the longitudinal lateral surface of the bar. An advantage of this approach is to reduce thermal buckling of the substrate, considering the higher moment of inertia of this substrate positioning. Another advantage of this approach was to reach, with a few layers, the steady state thermal distribution in the Z direction (perturbations caused by the thermal effect of the horizontal-positioned substrate on the first four layers have been reported, for instance, by Martina et al. [
18]). In addition, a final criterion was to keep the same interlayer temperature, i.e., cooling down the walls after each layer deposition with the aid of compressed air until the different parts of the walls could be grasped with bare hands. Otherwise, the building of multilayer walls would require a progressive increase of the travel speed to keep a constant layer width, as demonstrated by Ortega et al. [
19]. This latter approach would interfere in the current work analysis.
2.1. Determination of the Travel Speed Limits
Subjectively, the lower speed limit was considered the speed that gave a wall 6 mm of width (the same as the thickness of the plates used as substrate). This lower limit was found experimentally with a speed of 42 cm/min. Below this limit, as the depositions were carried on the top surface of the substrate/previous layer, the molten metal would flow down the plate. The upper speed limit was also determined experimentally. The criterion to reach the upper speed limit would be when undulated wall surface (tending to humping) was reached, regardless the layer width (naturally, by keeping constant the other parameters and making faster the deposition, the layer turns narrower. The experiments to determine the upper limit was carried out in two stages, to minimize the number of experiments:
- (1)
Determination of a rough range within which the upper speed limit would be laying; and
- (2)
Refinement of this range to determine the upper speed limit
At the first stage, the substrate length was divided into four segments. The worktable was programmed with increasing travel speeds (arbitrary steps of 50 or 52.5 cm/min) at each segment and the other deposition parameters kept the same. The deposition during the first stage was carried upon two previously deposited layers on a substrate at a constant speed of 42 cm/min. This was made to provide conditions similar to the ones which had presented stable layers of a printed wall. As the first travel speed that led to undulated wall top surface (appointed as a humping phenomenon) was considered to be outside the operational range, the travel speed upper limit would stand between the segmented speed of free of undulations layer and the segmented speed of the first non-conformity deposition. In the case an undulated layer was not reached with one segmented substrate, or not cleared upon reaching the last segment, another deposition would be started on a new substrate, yet with the travel speed of the first segment set at the value of the second segment of the previous substrate (always starting after a second layer was already deposited). This latter approach would, at the same time, assure a repeatability aspect to the approach. This experimental reasoning is repeated until an upper travel speed limit is found.
Once the upper travel speed (within the segment prior to the undulated one) is roughly determined, the refinement of this range (2nd stage) is implemented by building 14-layer-high walls with a given travel speed. This speed is arbitrarily and conservatively chosen from a value close to the speed of the segment with undulated surface, let us say, 15 cm/min lesser. In the case of surface in conformity, this travel speed value would be taken as the upper limit. Otherwise, other 14-layer-high walls with recursive decreased travel speed (small steps, such as 5 cm/min) would be tried until successful builds are reached.
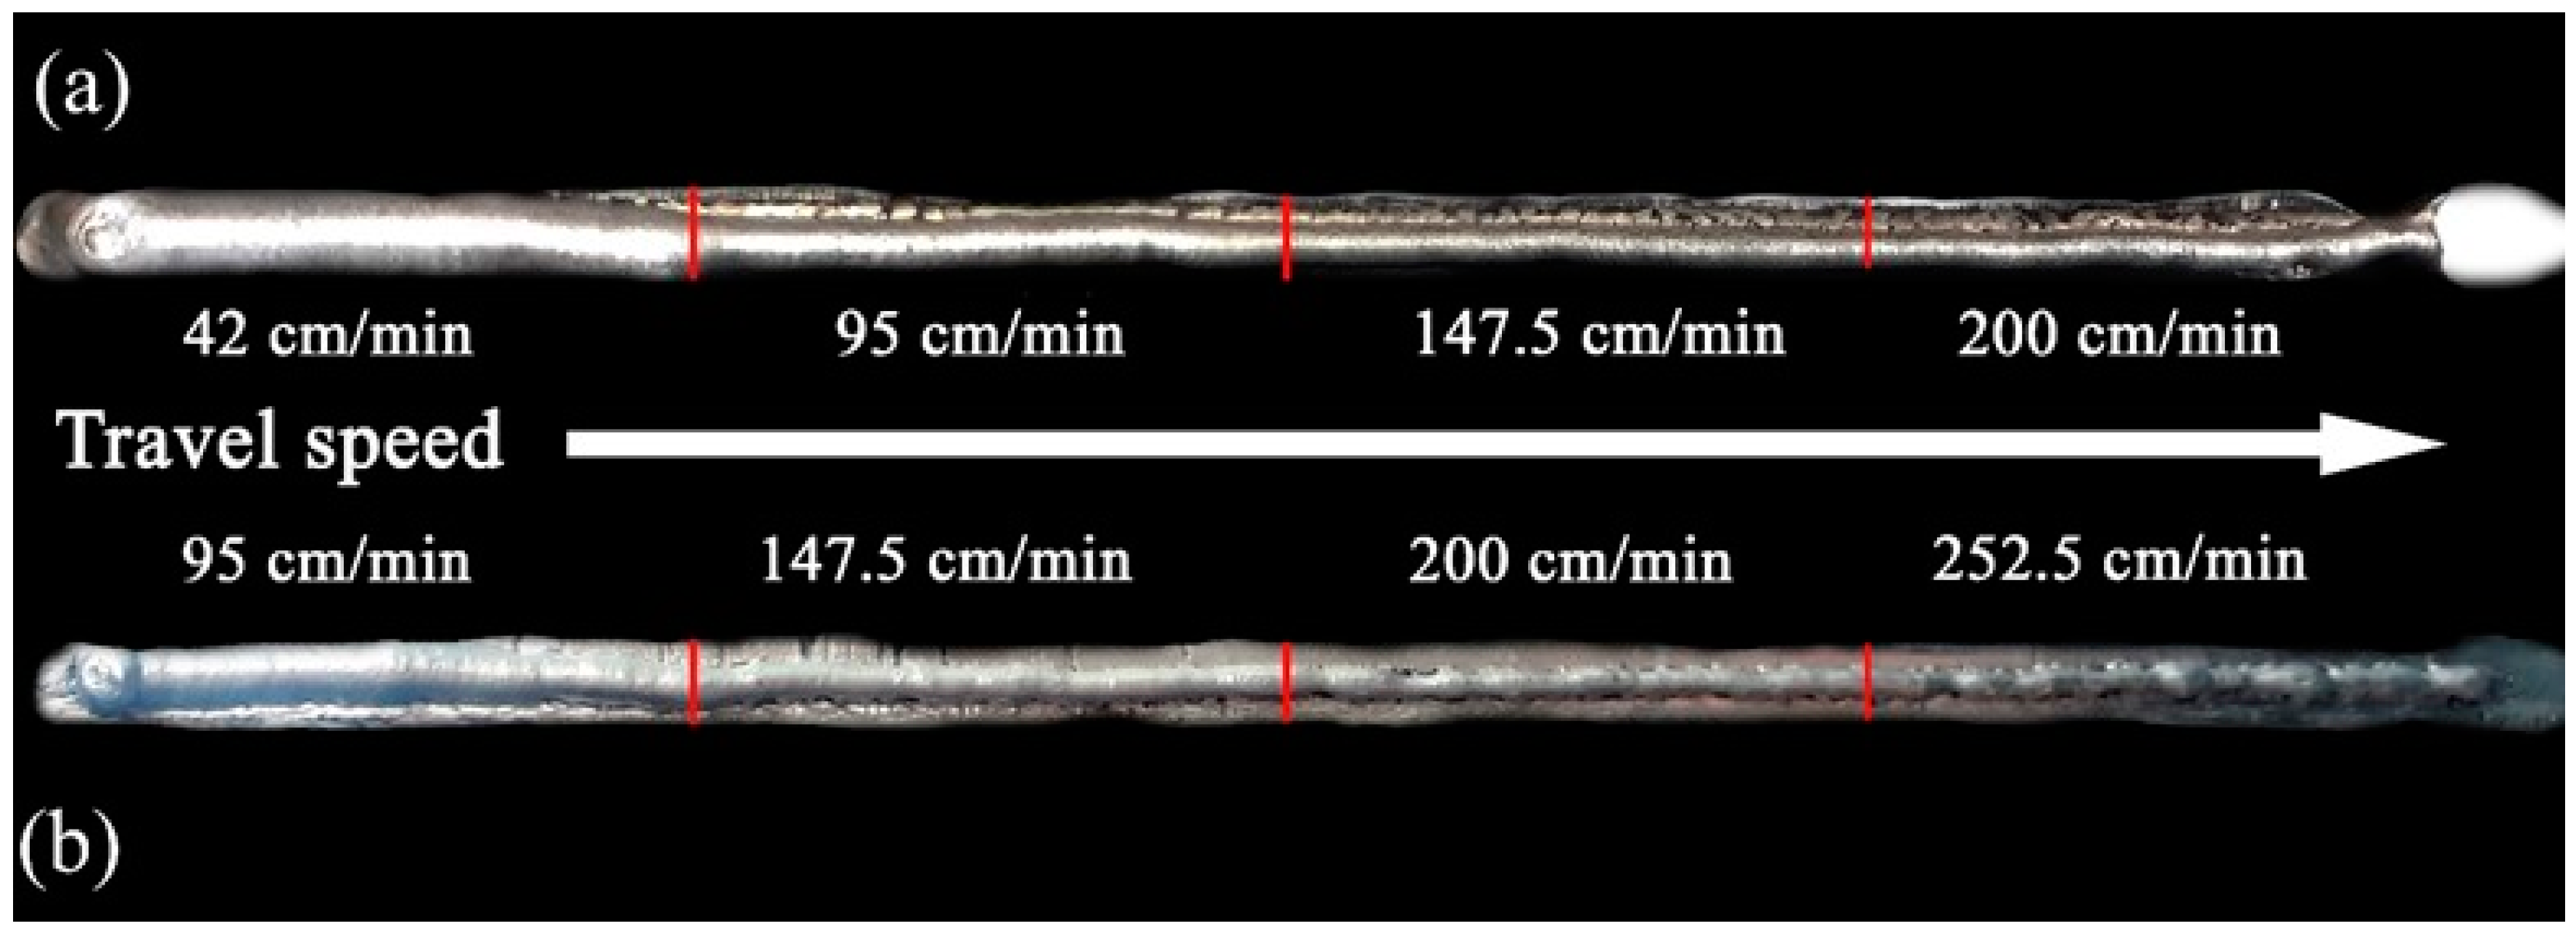
During the first stage of this experiment, layers on two different substrates were obtained, as shown in
Figure 4. As one can see in
Figure 4a, slight undulations is observed at the segment with travel speed of 200 cm/min. However, as this feature was not very clear, it was decided to carry out one more wall on a new substrate (
Figure 4b). From this second substrate, one can clearly see that the travel speed upper limit lays between 147.5 and 200 cm/min.
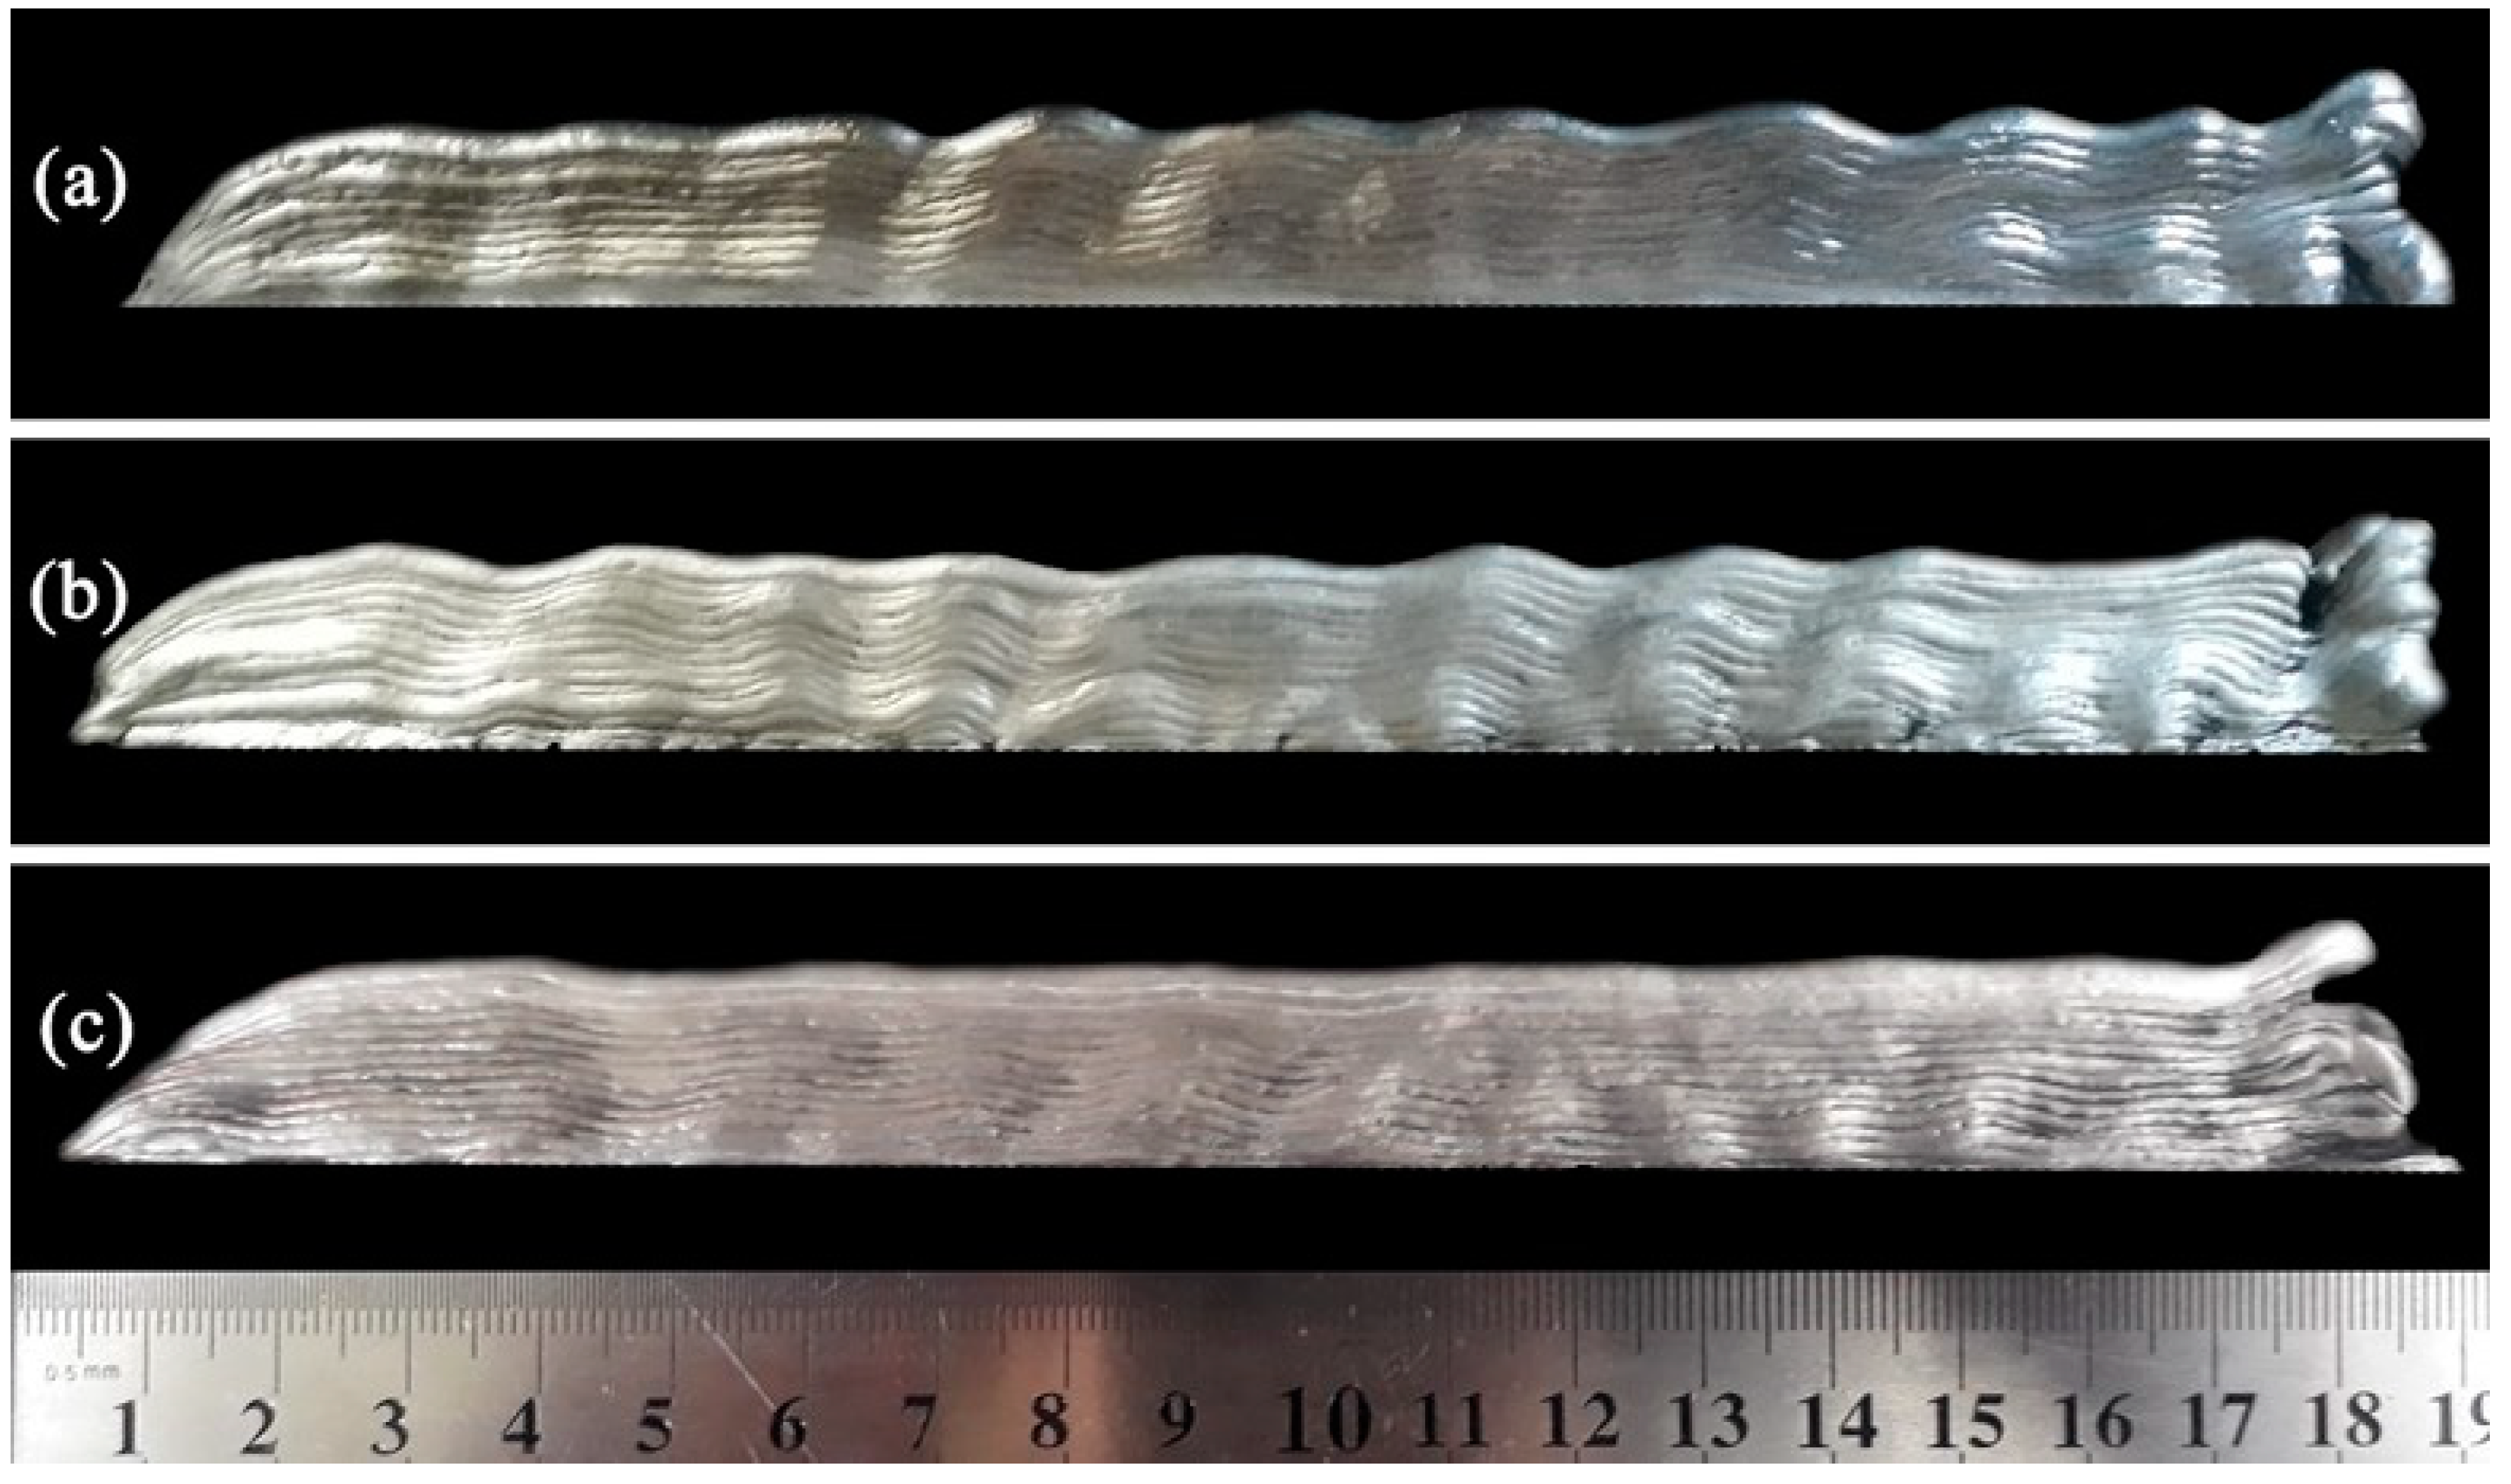
To constrict the above range (second stage of the experiment), three walls were deposited, as shown in
Figure 5. The travel speed was slowed down progressively in steps of 5 cm/min, starting from 185 cm/min (the closest to the 200 cm/min found in the first stage as already presenting undulation). From this figure, one can see that only with the third trial that an in-conformity wall (no undulation on the top surface) was reached. Thus, it can be assumed that for such used deposition configuration and parameters, the WAAM process can be carried out with travel speeds from 42 cm/min to 175 cm/min.
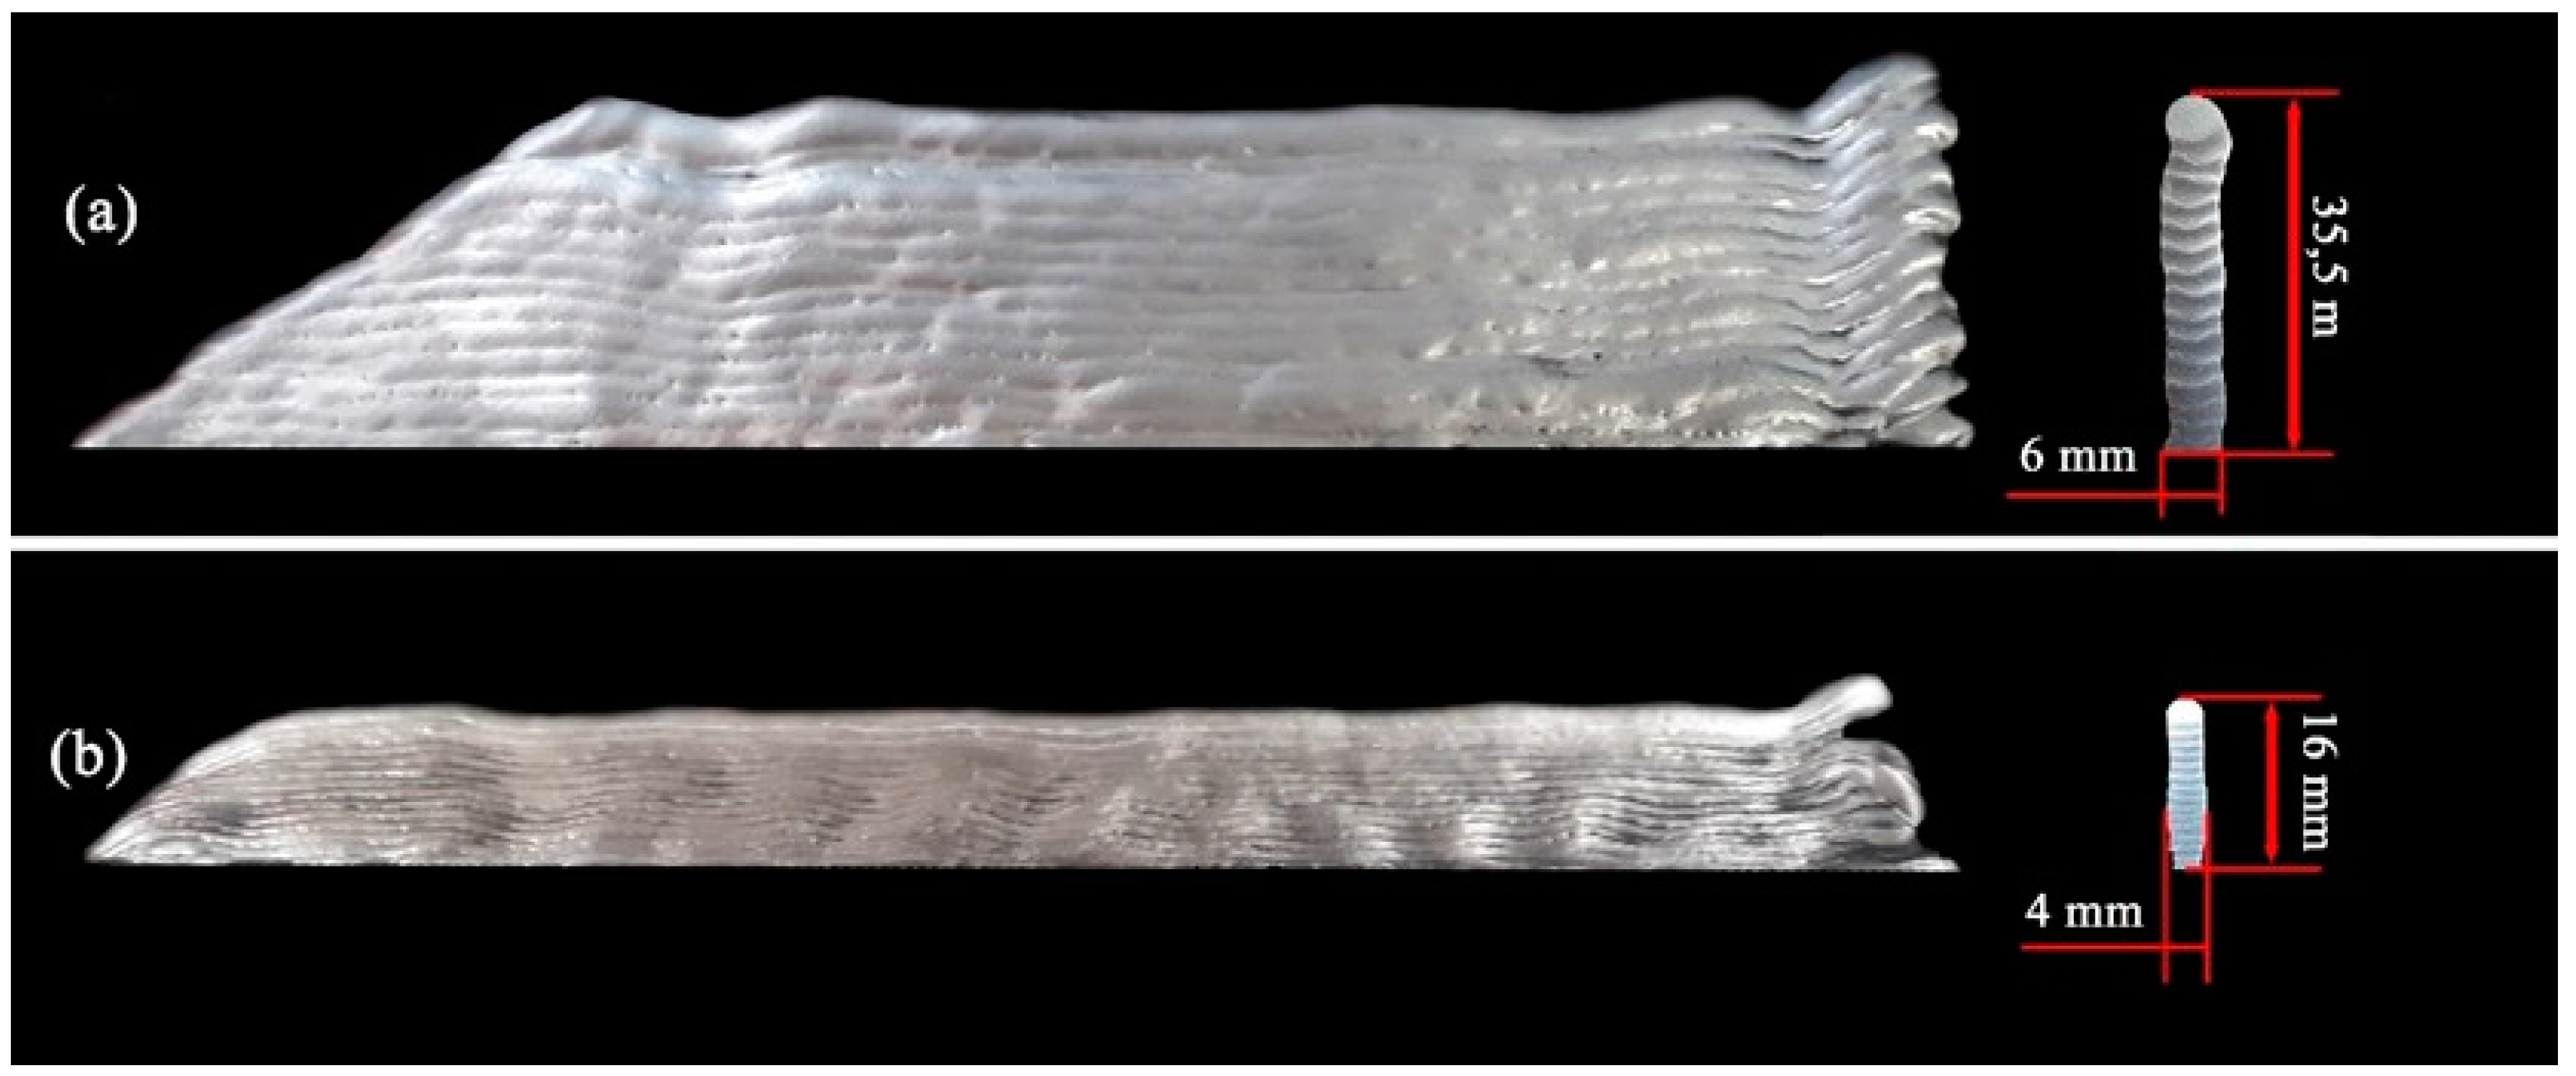
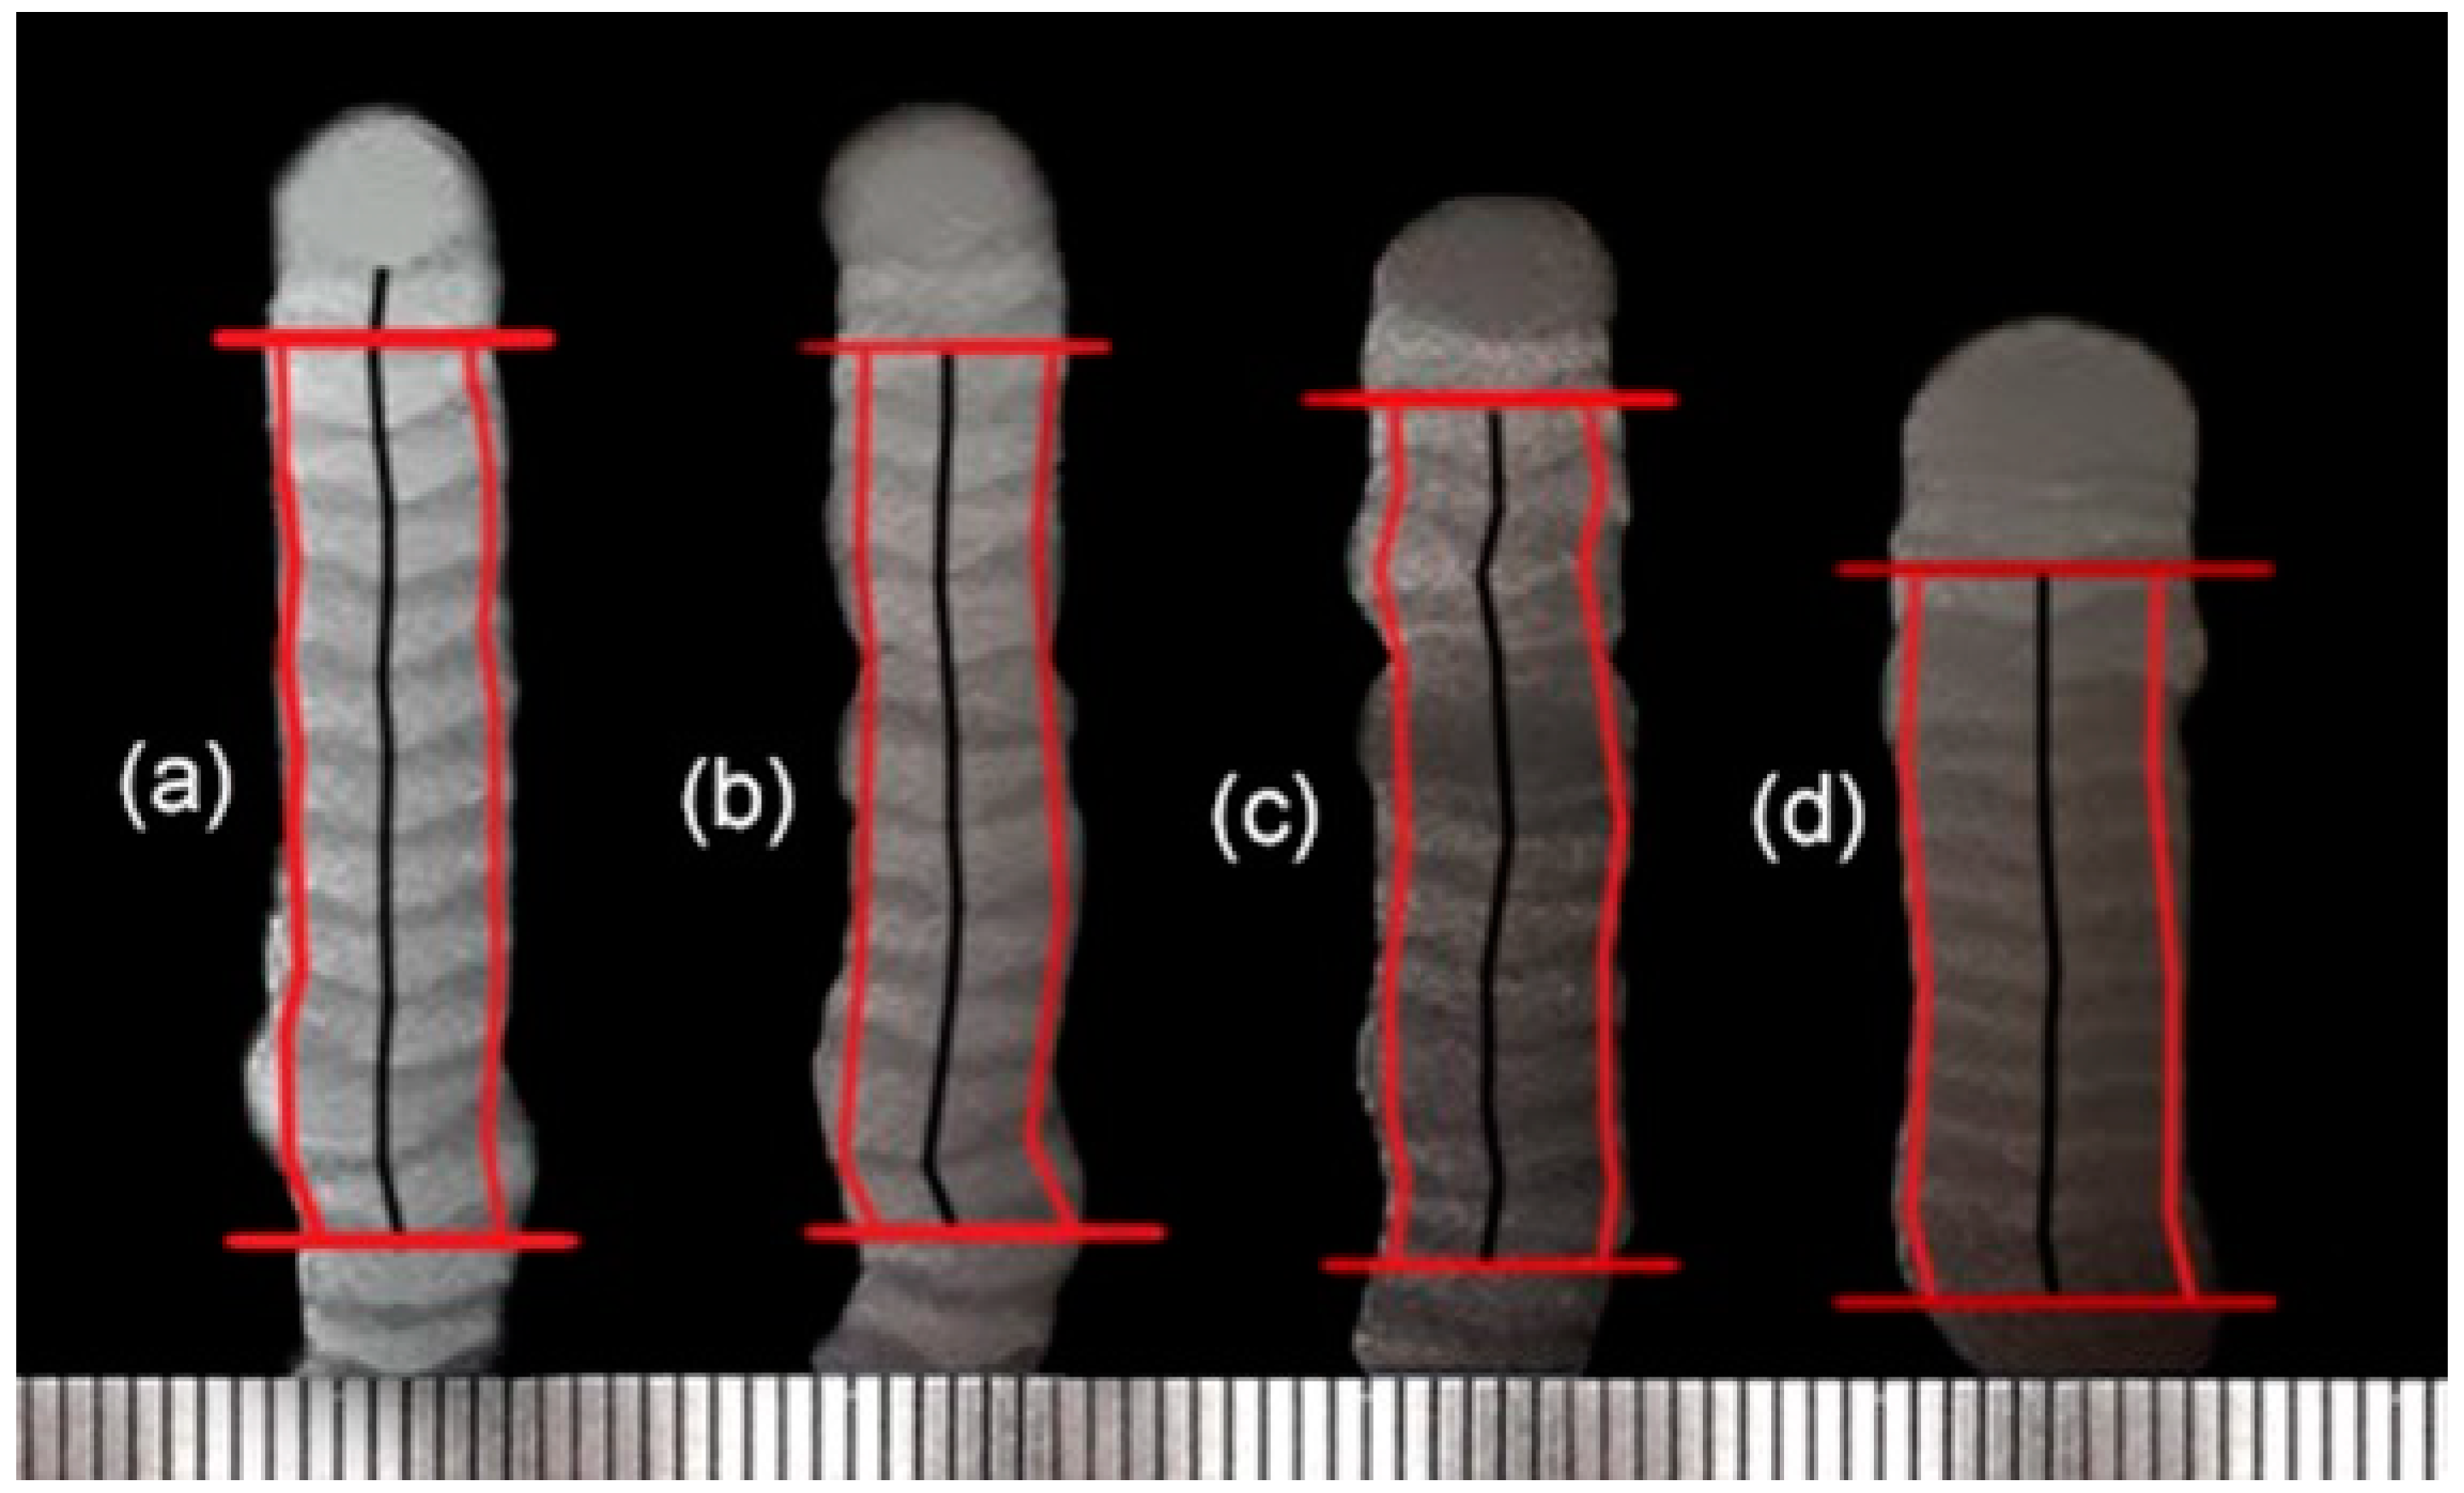
A comparison of the wall profiles and the cross-section geometries from the operational range extremes is shown in
Figure 6 (the wall cross-sections were taken at similar positions of the samples for longitudinal sectioning). As seen, stair steps, typical of AM depositions, are present on the side face of the part, although not remarkably characterized.
2.2. Determination of the Wall Geometry Quality
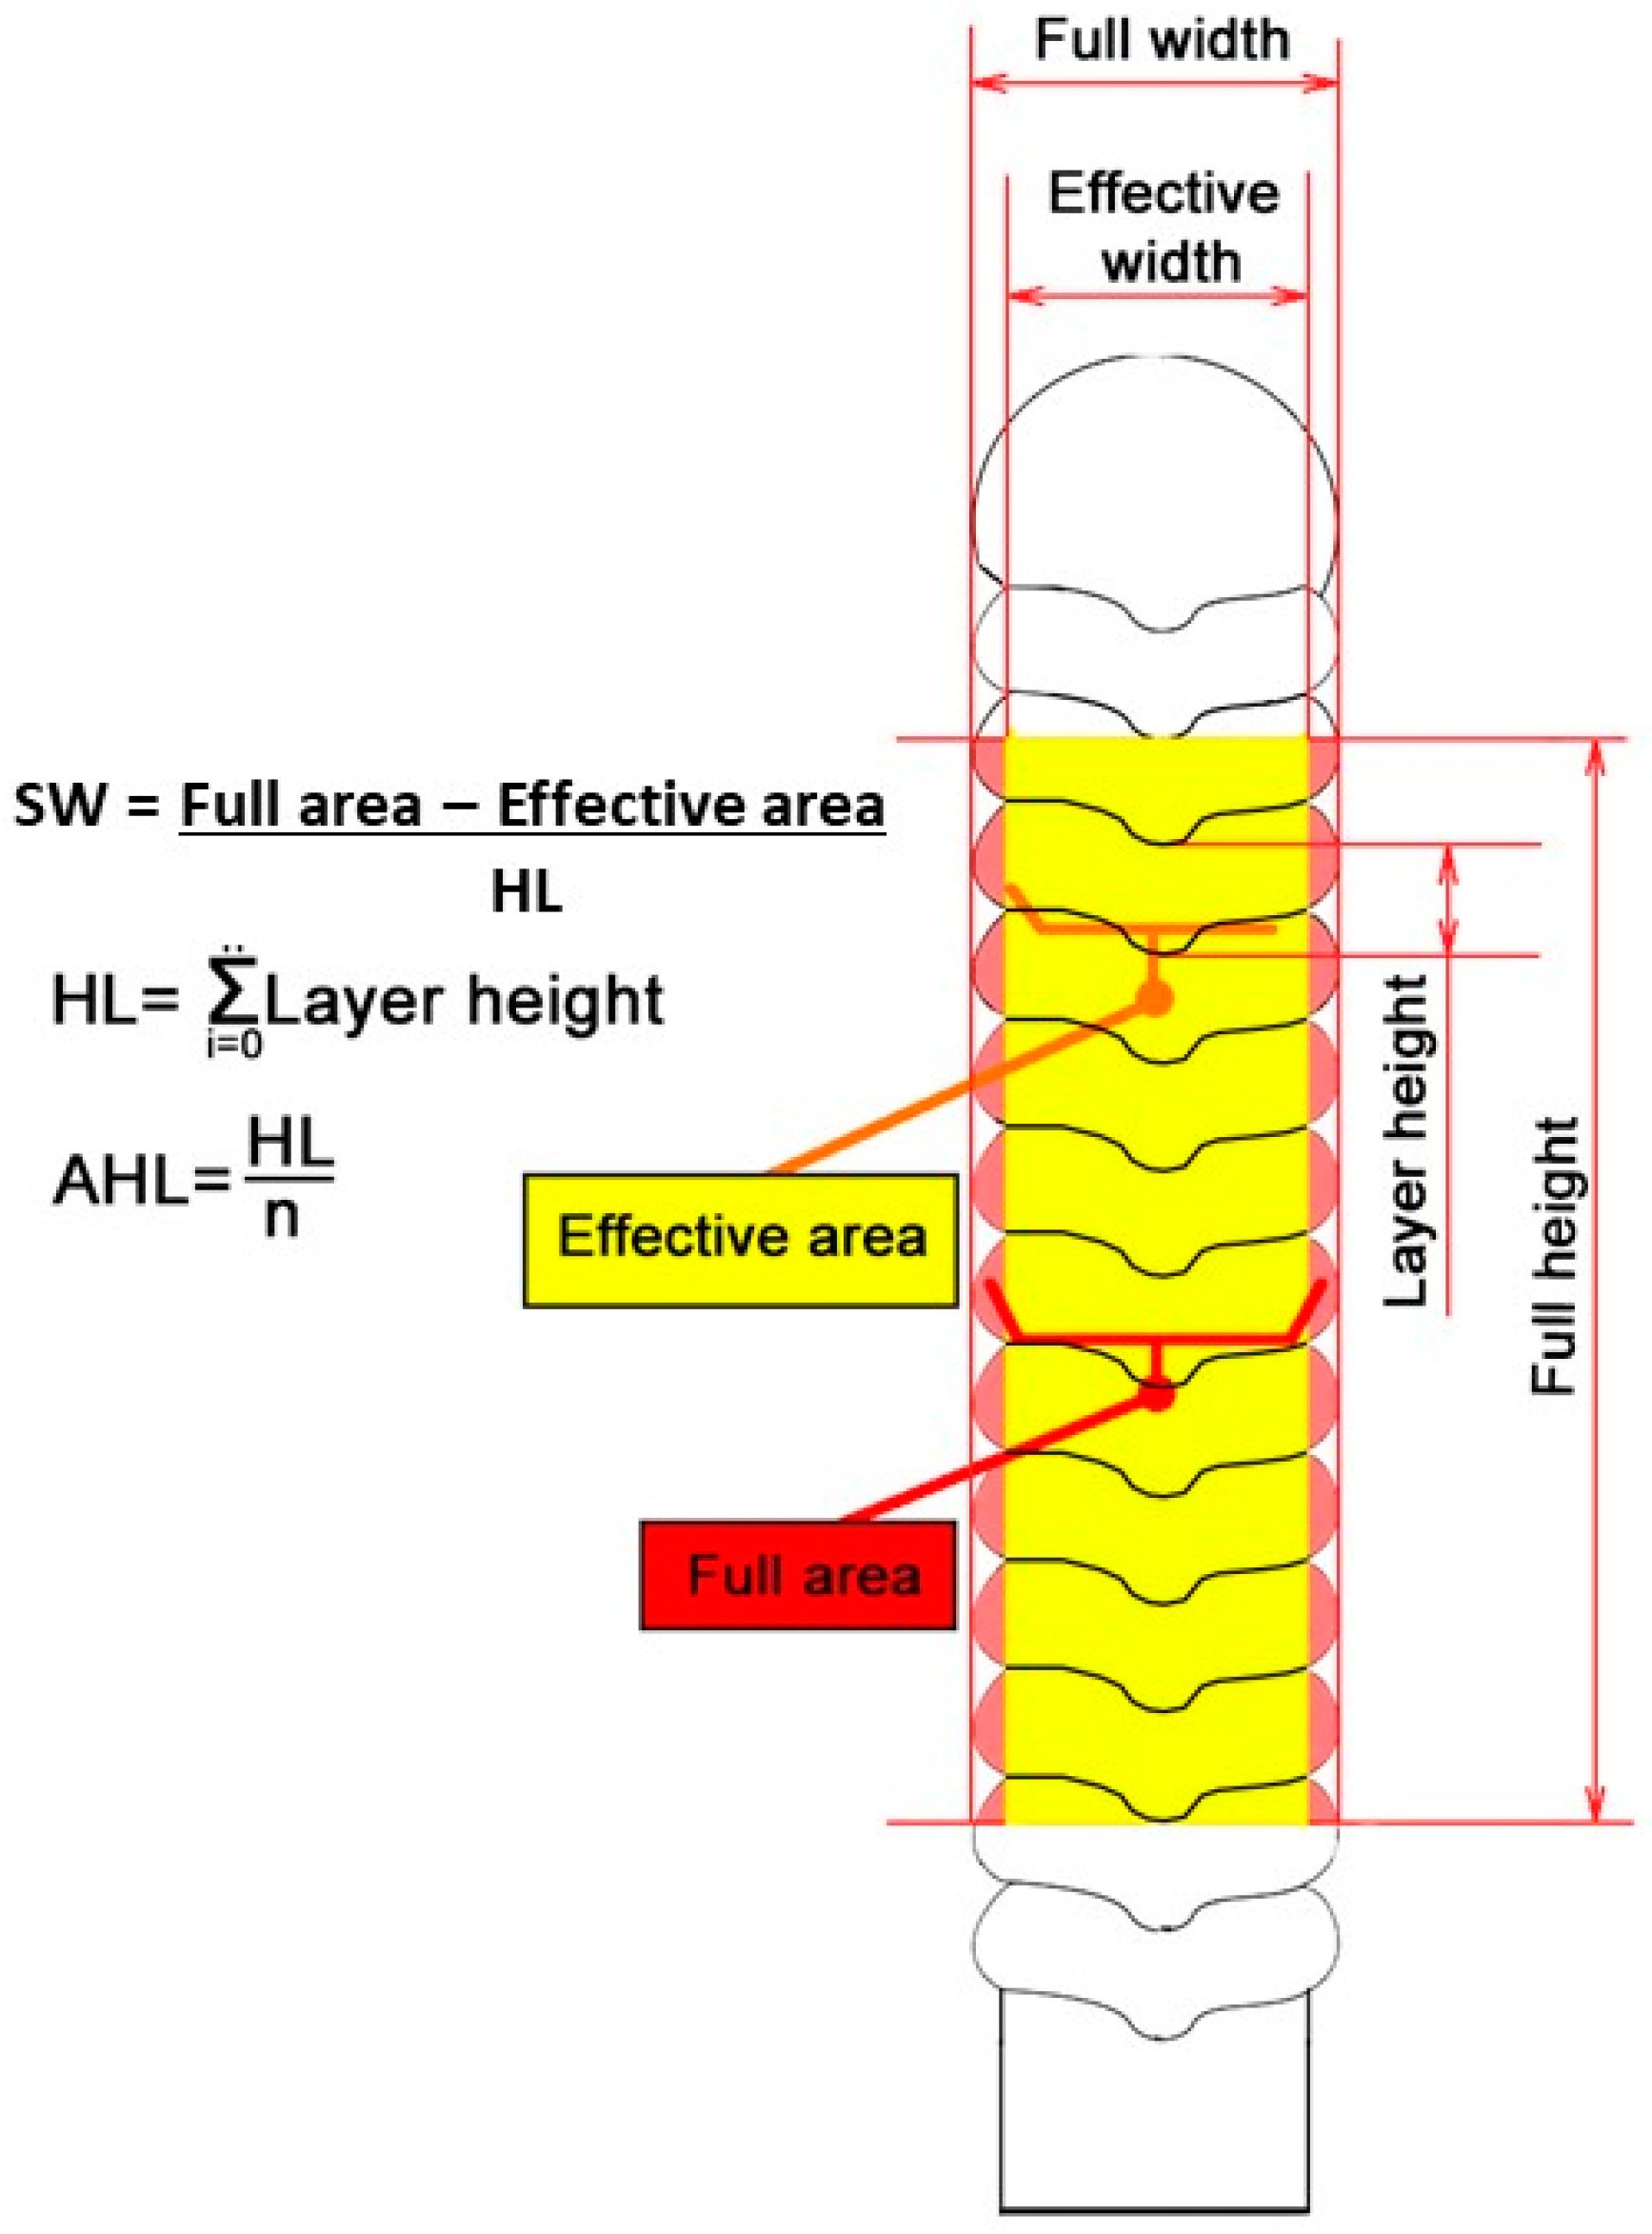
After defining the range of the travel speed that leads to walls with no top surface irregularity for the given deposition parameters, the geometric quality of the walls was assessed. The most important geometric parameters were the height of layers, the average height per layer, full area of the layers, effective area of the layers, and average widths of the wall, as illustrated in
Figure 7. To allow comparisons and minimize the effect of the first and last layers, only 11 of the layers, starting from the third layer, were used in the analysis. The effective area of the layers is the useful amount of deposited material, while the full area of the layers is the amount of material deposited to reach the effective area. If the target wall width is not concerned, one can say that the minimum difference between full area and effective area of the layers for a given layer height would mean the least amount of material to be machined to reach a flat wall lateral surface. This parameter is defined here as “surface waviness” index (SW), quantified by the difference between the full cross-section area and the effective cross-section area of the layers, divided by the summation of the layer heights considered in the measurements of each areas. Therefore, this index is related to the wall surface quality. The desirable wall must have a minimal SW index (the higher the index, the larger is the material to be machined to smooth the wall surface). However, as both sides of a wall must be machined to eliminate the waviness, the quantity represented by SW index to be removed at each side must be divided by 2.
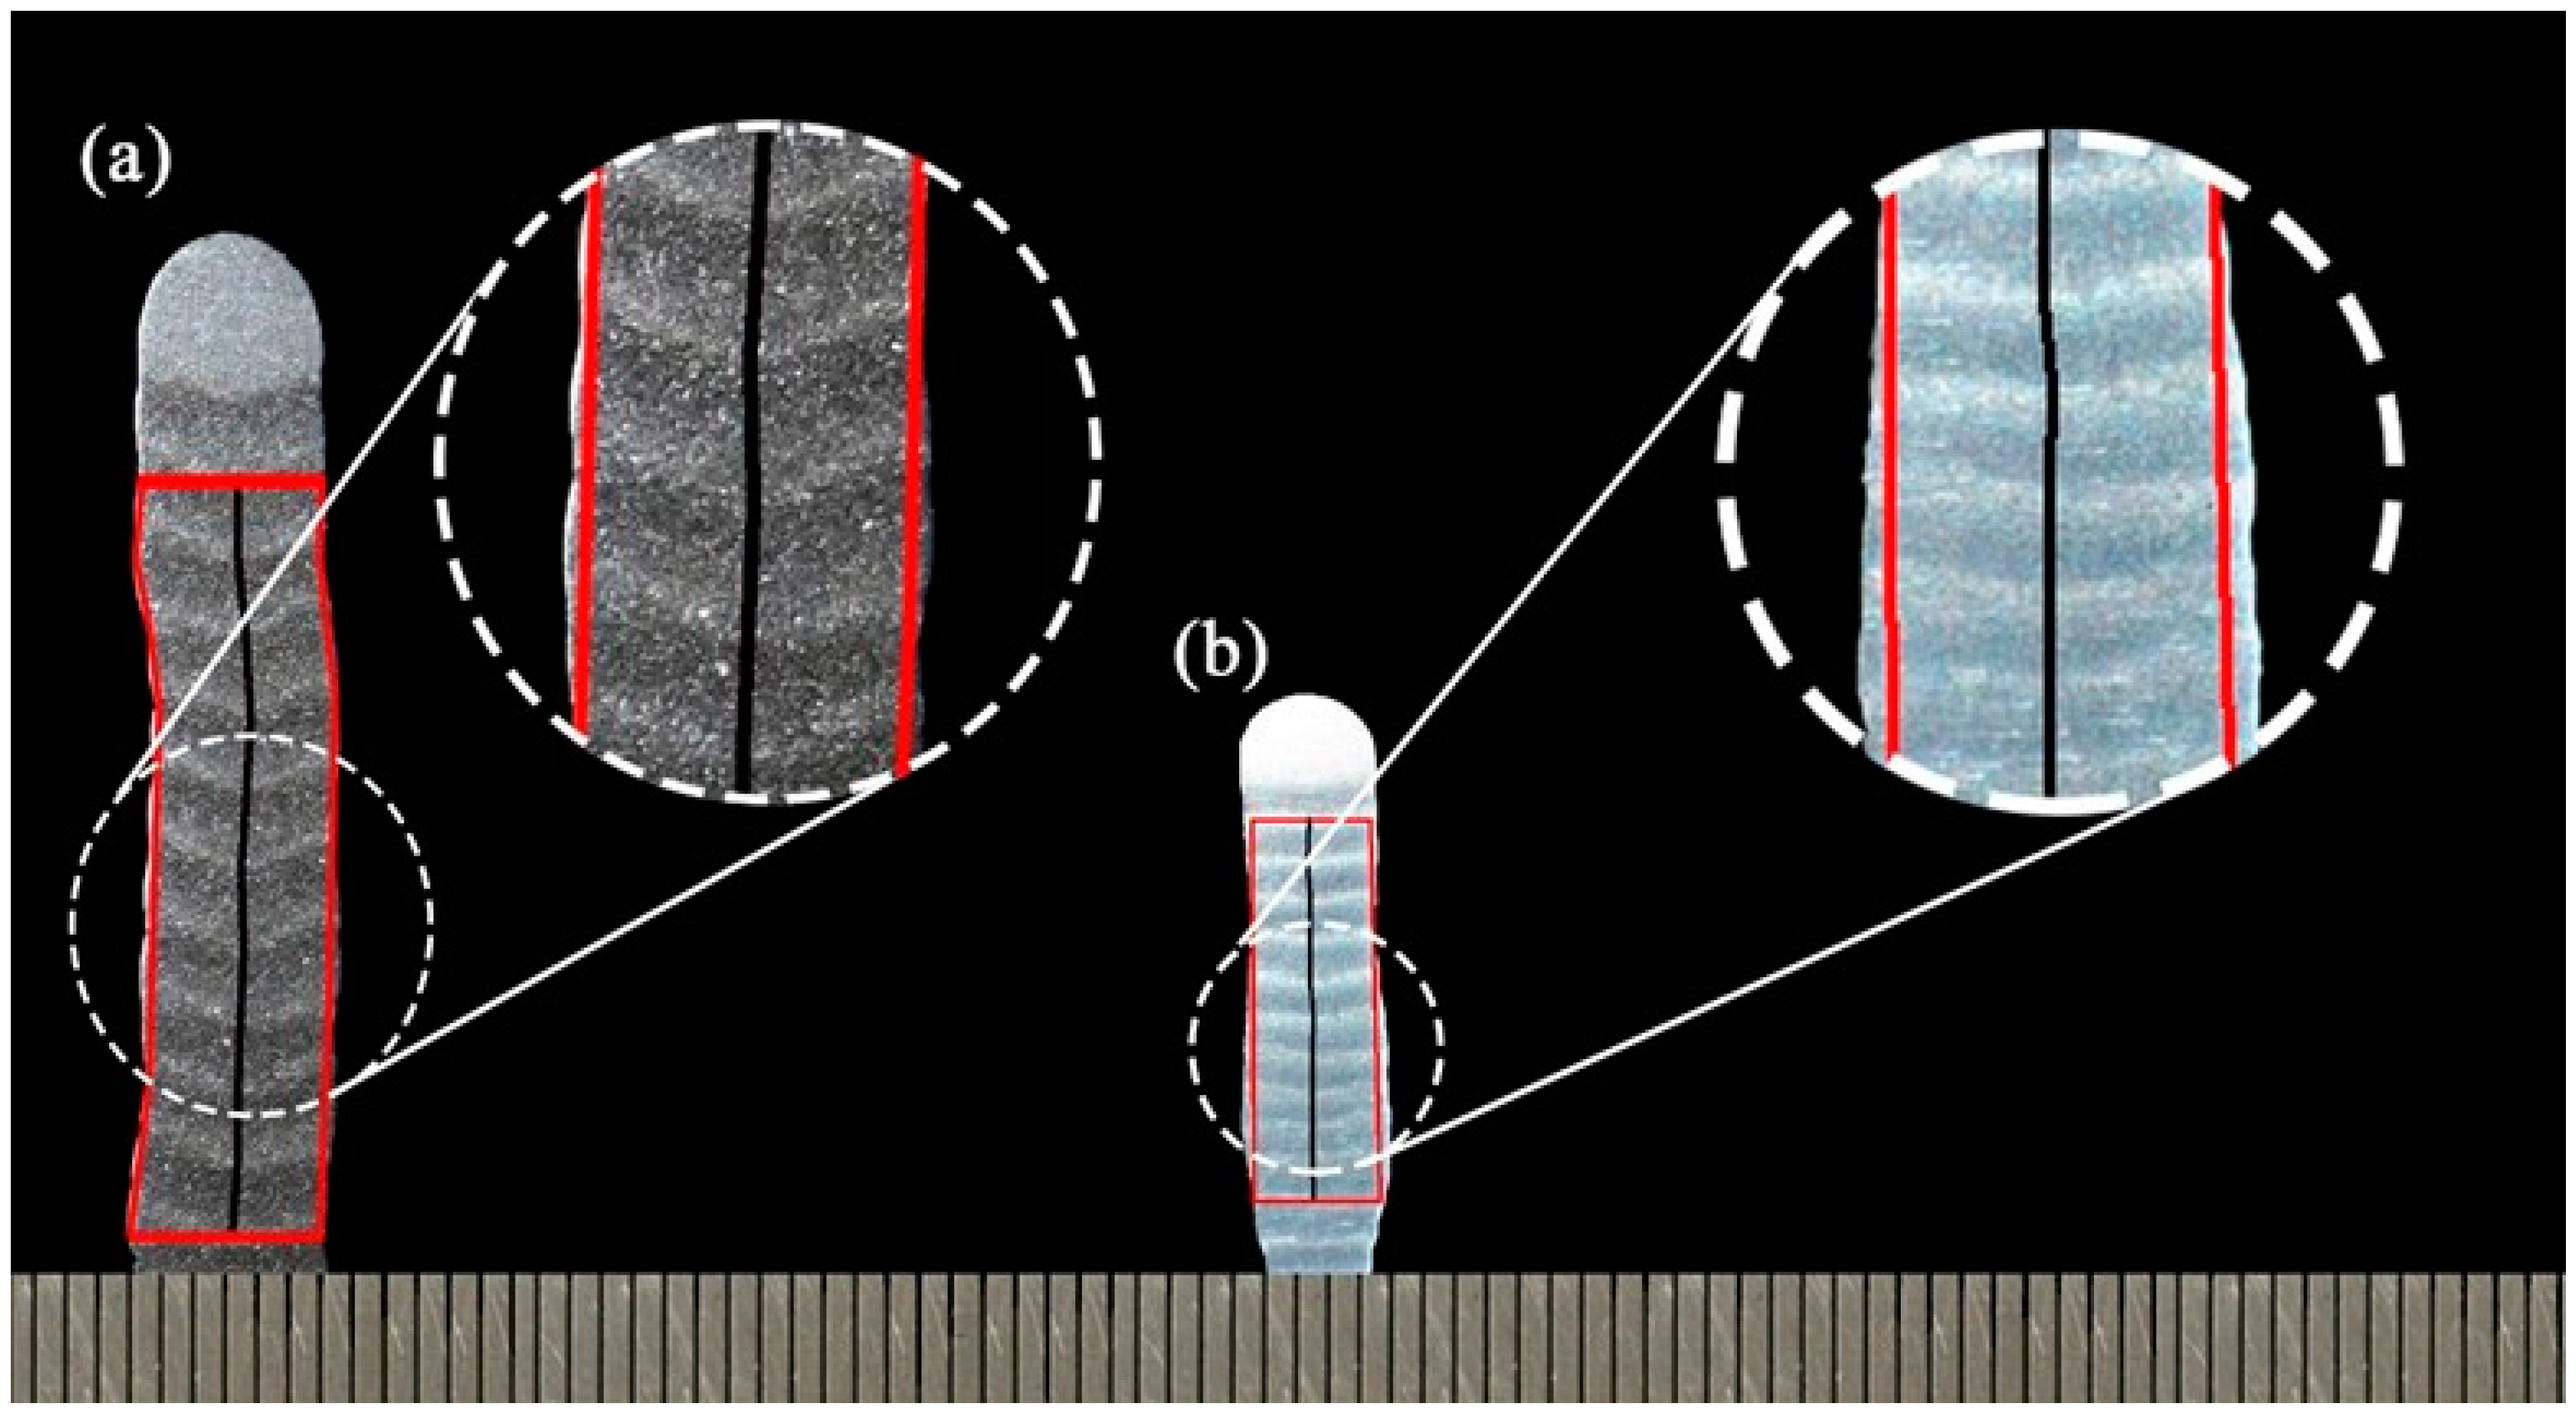
Amplifications of the cross-sections are presented in
Figure 8, highlighting the 11 layers under analysis. It is important to note that during the wall build-ups, a degree of nonconformity was apparent, i.e., walls showed layer deviations in relation to the Z-axis (the probable reason is a still high interlayer temperature for aluminum alloys, considering that this effect was more pronounced for low travel speeds). Even though working with carbon steel rather than aluminum alloy, Xiong et al. [
7] noted that molten pool overflows randomly in the layers at high interlayer temperatures. In addition, it is known that interlayer temperature is a very sensitive parameter in WAAW of aluminum alloys. Geng et al. [
20], for instance, showed that the humping effect for a given travel speed can be eliminated by increasing the interlayer temperature. Moreover, they have figured out that the range of interlayer temperatures can be used with other parameters fixed, and they still showed that different non-conformities appear both below lower limit and above upper limit of the interlayer temperature. For Geng et al. [
20], when interlayer temperature is too low, undulated surface of the deposit is observed, while when too high, the layer width will gradually increase while the height decreases simultaneously.
Therefore, to eliminate the influence of this Z-center line deviation on the results, regardless of the travel speed, it was necessary to adopt a compensation procedure and criterion, as follows:
- (a)
Considering only the 10 layers, to define the center points of each of the deposited layers based on the deepest dimension of each layer cross-section;
- (b)
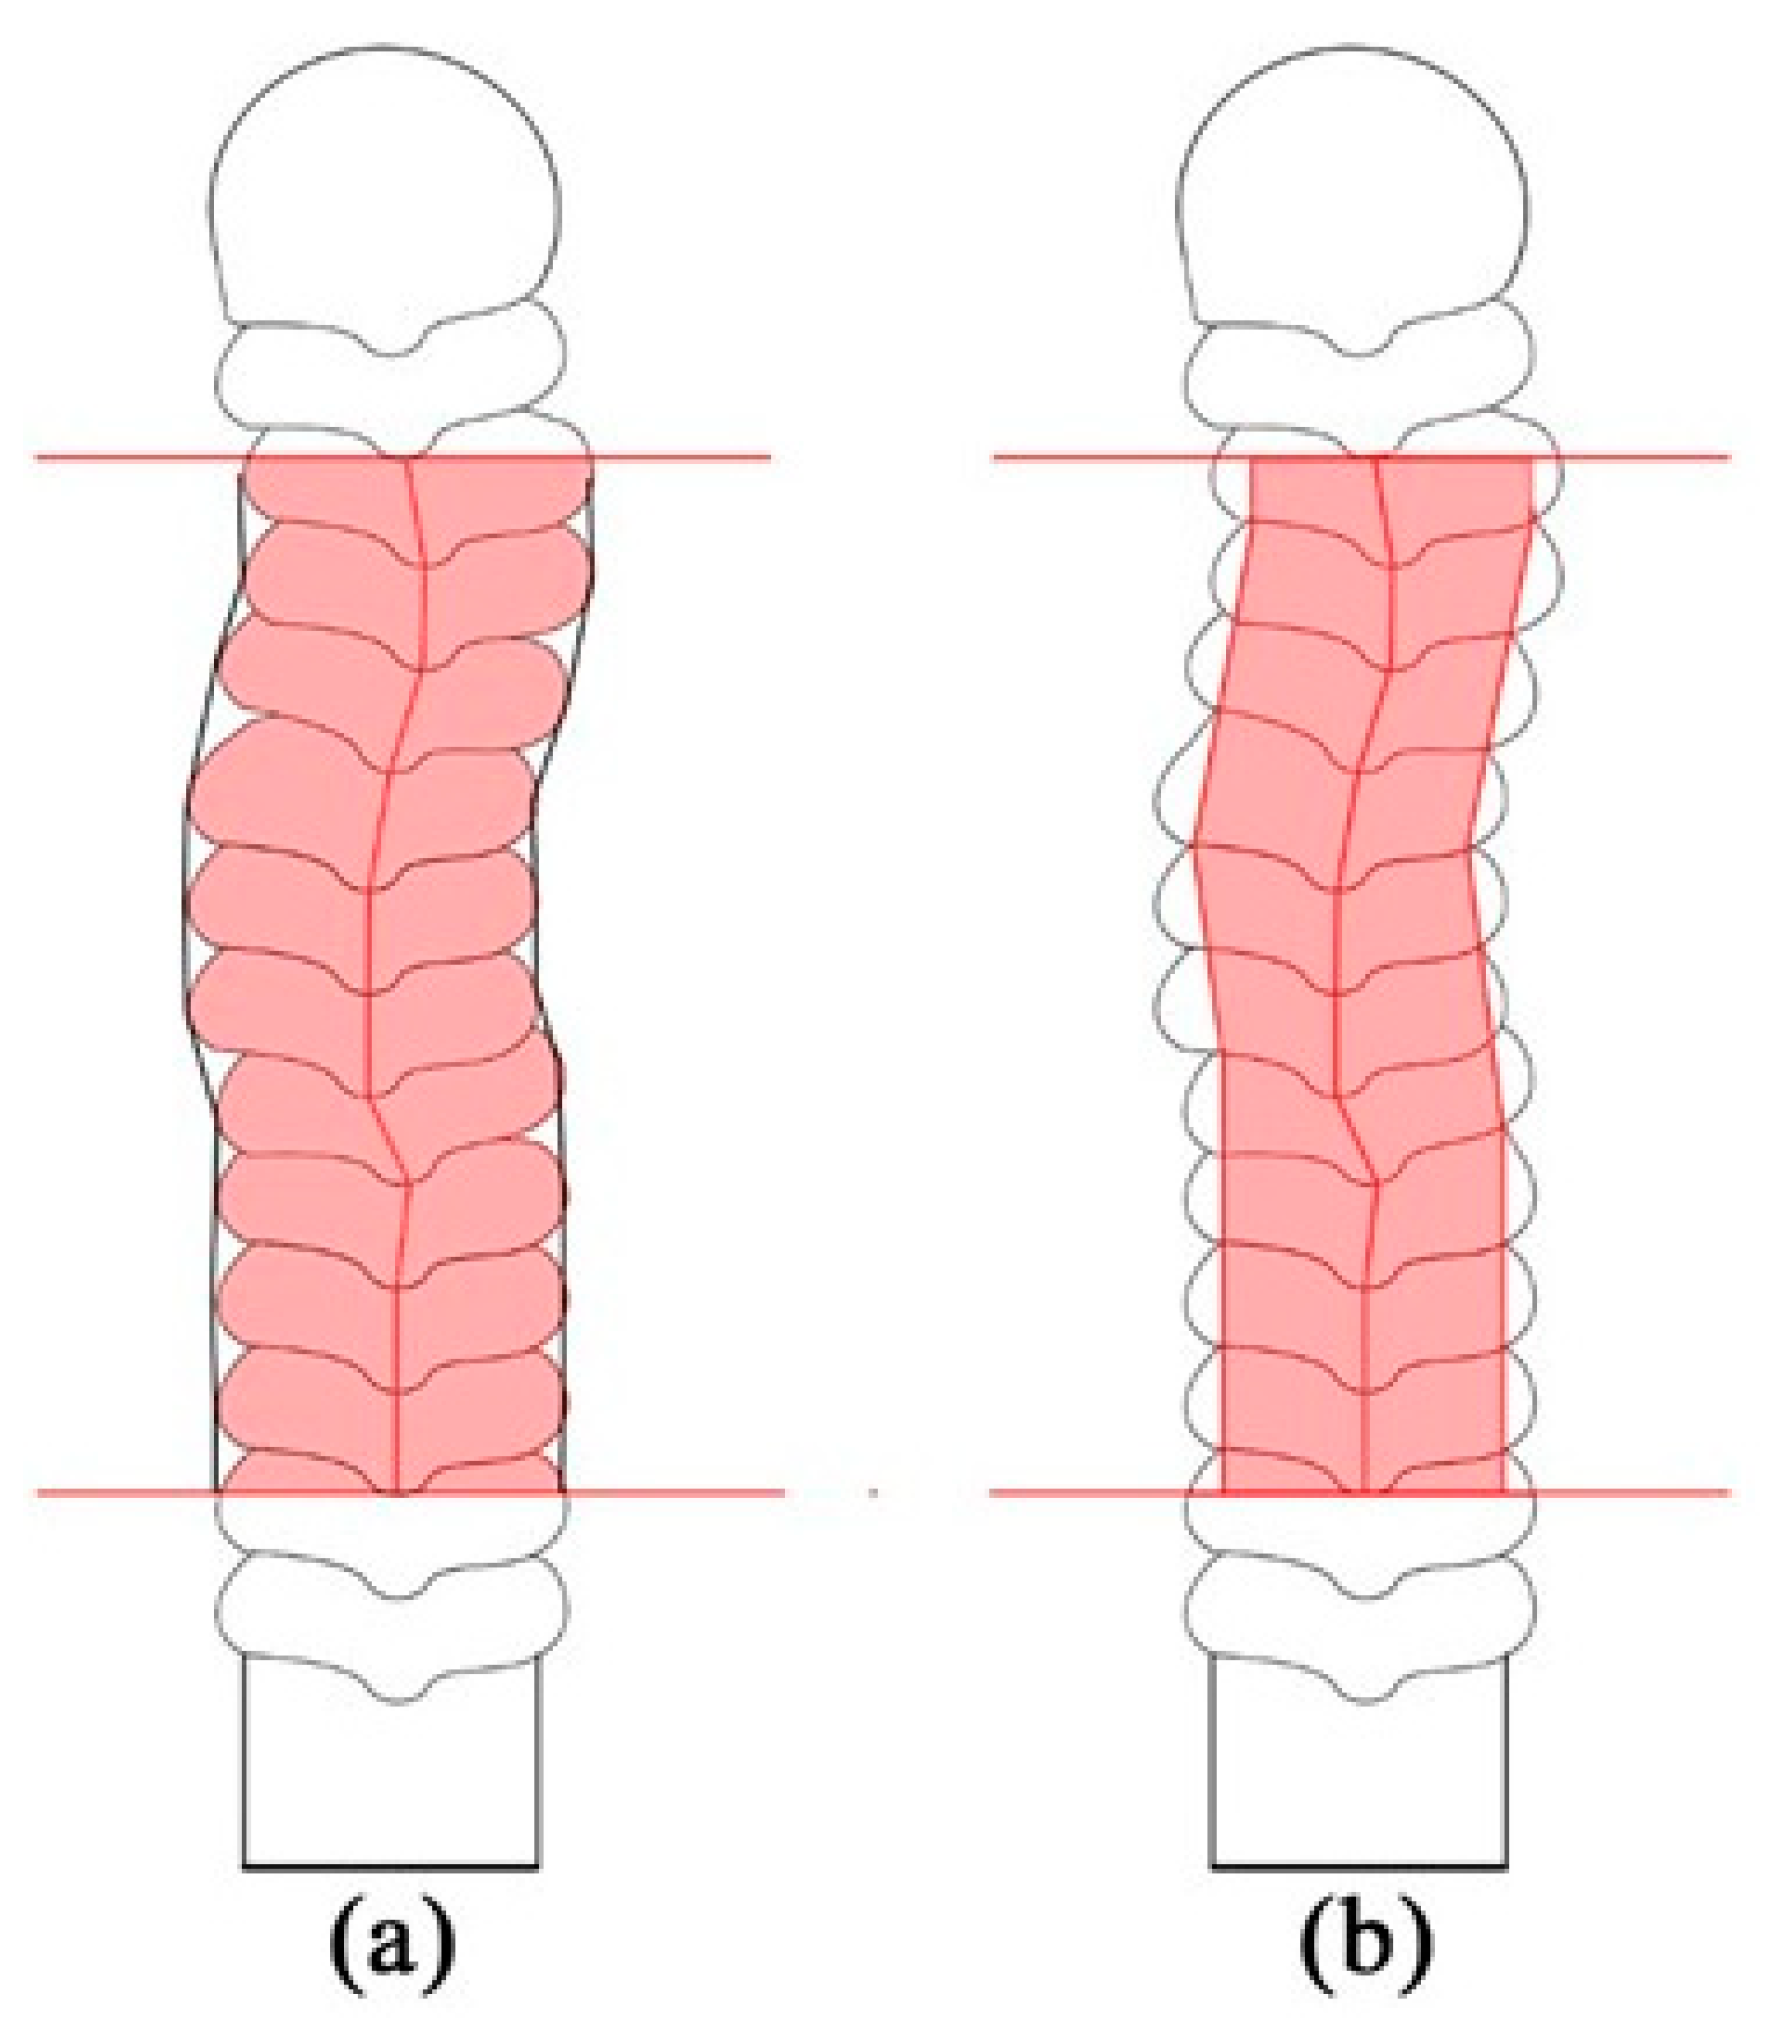
Simulating a rectification of the wall centerline (wall straightening), by a line passing through each deposited layer center point (as illustrated in
Figure 9);
- (c)
The wall height is determined based on the rectified centerline; and
- (d)
The full and effective wall widths and areas would follow the rectified centerline, as suggested in
Figure 10, in the shape of the inscribed polygons.
Following the above procedure, the geometry parameters of each wall are presented in
Table 1. The slower the travel speed, the higher the deposition rate per unit of layer length. This set results in higher layers (ALH) and wider effective wall width (WW
ef) with larger areas. However, the most important is that the surface quality of the wall, assessed by the surface waviness index (SW), is slightly smaller for the travel speed at the lower limit. It is worth noting that by applying the subjective criterion to compensate for the
Z-axis deviations (
Figure 10), the values of SW index represent an ideal situation for measuring waviness (by eliminating distortions or deviations from the
Z-axis). Although looking unrealistic, this approach retracts more the effect of the parameters on this quality aspect and makes the SW indices more comparable.
2.3. Increase of Production Capacity of the Process
Up to this part of the work, all layer depositions were made varying only the wire feed speed set (WFS
set), keeping constant the actual wire feed speed (consequently current) constant. The reason is based on the fact that travel speed has been taken as the comparison parameter (because the metal molten pool volume is difficult to measure). On the other hand, it is well known that higher current, consequently faster WFS, increases the deposition rate per unit of layer length for a given travel speed (TS). Therefore, still considering as valid the assumption of the existence of a range for the pool volume to have geometrically sound deposits, it is reasonable to think that WFS can be increased as long as TS is increased at the same time (WFS/TS = constant), maintaining the pool volume range indirectly determined in
Section 2.1. (i.e., production increases while retaining the same layer dimension).
In order to experimentally evaluate this reasoning, four values of WFS
set were chosen, corresponding to four different values of mean current (Im). The same experimental rig and remaining parameters were kept the same, as described and listed in the introduction of
Section 2. Remembering that the set values of WFS do not correspond to the actual ones in the welding equipment used, it was important, firstly, to determine the actual deposition rate for each set parameter that will be used further in the experiments. For this determination, four walls of four layers were built, keeping the TS arbitrarily the same at 42 cm/min. Each substrate was weighed before and after the deposition of the layers to obtain the mass of the deposited metal (W). Then, the deposition rates (DR), given in kg/h after manipulating the units of each quantity, were calculated by Equation (1):
where L is the total length of each layer and TS is the travel speed of the disposition. The actual wire feed speed (WFS), given in m/min after manipulating the units of each quantity, is estimated by using Equation (2).
where r is a radius of the feeding wire and ρ is the density of a 5356 aluminum alloy. The summary of the experimental procedure to determine the deposition rates (DR) and the actual wire feed speed (WFS
ac) as a function of the set wire feed speed (WFS
set) and, consequently, the mean current (Im), are given in
Table 2.
Once the deposition rates and actual wire feed speeds are determined as a function of the WFS
set, four new WAAM walls, now with 15 layers, were built. The travel speed to keep approximately the same deposition rate per unit of wall length was changed correspondently (WFS/TS = constant). The set of parameters used for each wall are presented in
Table 3. The monitored wire feed speed (WFSm) was based on the weight difference between each substrate before and after depositions, just to keep track of occasional experimental error (of which no evidence was found). As one can see, the objective of keeping WFS/TS = constant was reasonably reached. The increase of the mean voltage (Um) as the mean current is increased (Im) is expected and explainable in arc welding theory (static U × I curve for a same arc length). This increase led to an arc energy augment, which does not necessarily mean an increase of heat input. This is the reason for also calculating the ratio Im/TS (which showed a slight, yet not significant and consistent, increasing trend).
The appearances of the four walls are shown in
Figure 11, while the comparison of the cross-sections and geometry characteristics are presented in
Figure 12. Again, stair steps are present on the side face of the part, yet not remarkably characterized.
Geometrical parameters of the walls are shown in
Table 4. As expected, the full cross-section areas of the walls were almost the same, considering that the ratio WFS/TS was kept the same (≈12.2). However, it does not mean that the pool volume was the same (it depends also on the pool longitudinal and transverse dimensions, to a first approximation).
Table 4 also shows that there are trends for the concomitant increase of the WFS (and Im) and TS on the wall geometry, as follows:
- (a)
Height decreases (in agreement with Xiong et al.’s results [
7], working with carbon steel);
- (b)
Width increases; and
- (c)
Slight increase on surface waviness index (surface quality of the wall).
The trends of reducing the wall height, of coarsening the waviness and of wall widening as WFS (and Im) is increased, even though the ratio WFS/TS was kept constant, can be explained by a combination of influencing factors:
- (a)
Arc energy also increased (
Table 3), making heat to accumulate more on the previous layer during deposition (heat dissipation mainly towards Z-down-direction), facilitating the pool volume increase;
- (b)
Arc pressure increase with the current rise, pushing down the molten pool while liquid (making it wider and shorter).
This behavior is just a characteristic, not necessarily adverse, as long as the wall finish and the geometric tolerances are not affected. In the present case, this characteristic suggests that the potential increase of production capacity (faster TS, i.e., less time to build the same layer) is counterbalanced by wall shortening and widening and with higher waviness (
Table 4).
3. Economical Strategies for WAAM of a Multilayer-Non-Oscillated Single Pass Wall
The possibility of working in a range of TS and keeping good wall quality, as demonstrated in
Section 2 for the given conditions and other set parameters, is an interesting yet tricky attribute, since everything will depend on the target wall width. If 6.0 mm is the wall width target value and there is the demand for depositing just one pass per layer, the lower travel speed limit would be the only choice (
Table 1). However, if a narrower wall width is targeted, two options could be evaluated, either using a lower travel speed to make the final wall height with less layers, at the expenses of more machining time, or using an interpolated travel speed to have less machining time, yet a larger number of layers, at the expense of longer deposition time and shielding gas consumption.
To quantify the assumptions from the WAAM process point of view (and not counting time/cost of machining and other post-processes), it will be considered that the target is a 6-mm thick and 100-mm high WAAM wall made of an aluminum alloy, with a length of 500 mm, with no dead time between each layer (for instance, to build a cylinder). Using simple calculations, it is easy to demonstrate that if a current of 81 A and the lower travel speed limit (42 cm/min) is used, 42 layers (one pass per layer) would be needed to be deposited, lasting 49.4 min. If the highest limit speed (175 cm/min) is used, 84 layers with two parallel passes per layer (168 passes) would have to be performed, which would take 48 min to be accomplished. Anyhow, one could argue that the difference in deposition time of using these two speeds is minimal (regardless that even a difference of approximately 3% could be significant in terms of high scale manufacturing). However, if the needed wall to be built up were wider, for instance, 15-mm thick walls, the use of the lower speed limit (three passes per layer = 126 passes) would allow finishing the build after 148.2 min, while using the higher travel speed limit (four parallel passes per layer = 336 passes), the part would be produced after 96 min. These figures would make the difference in favor of using faster speeds to reach approximately 50% of time saving.
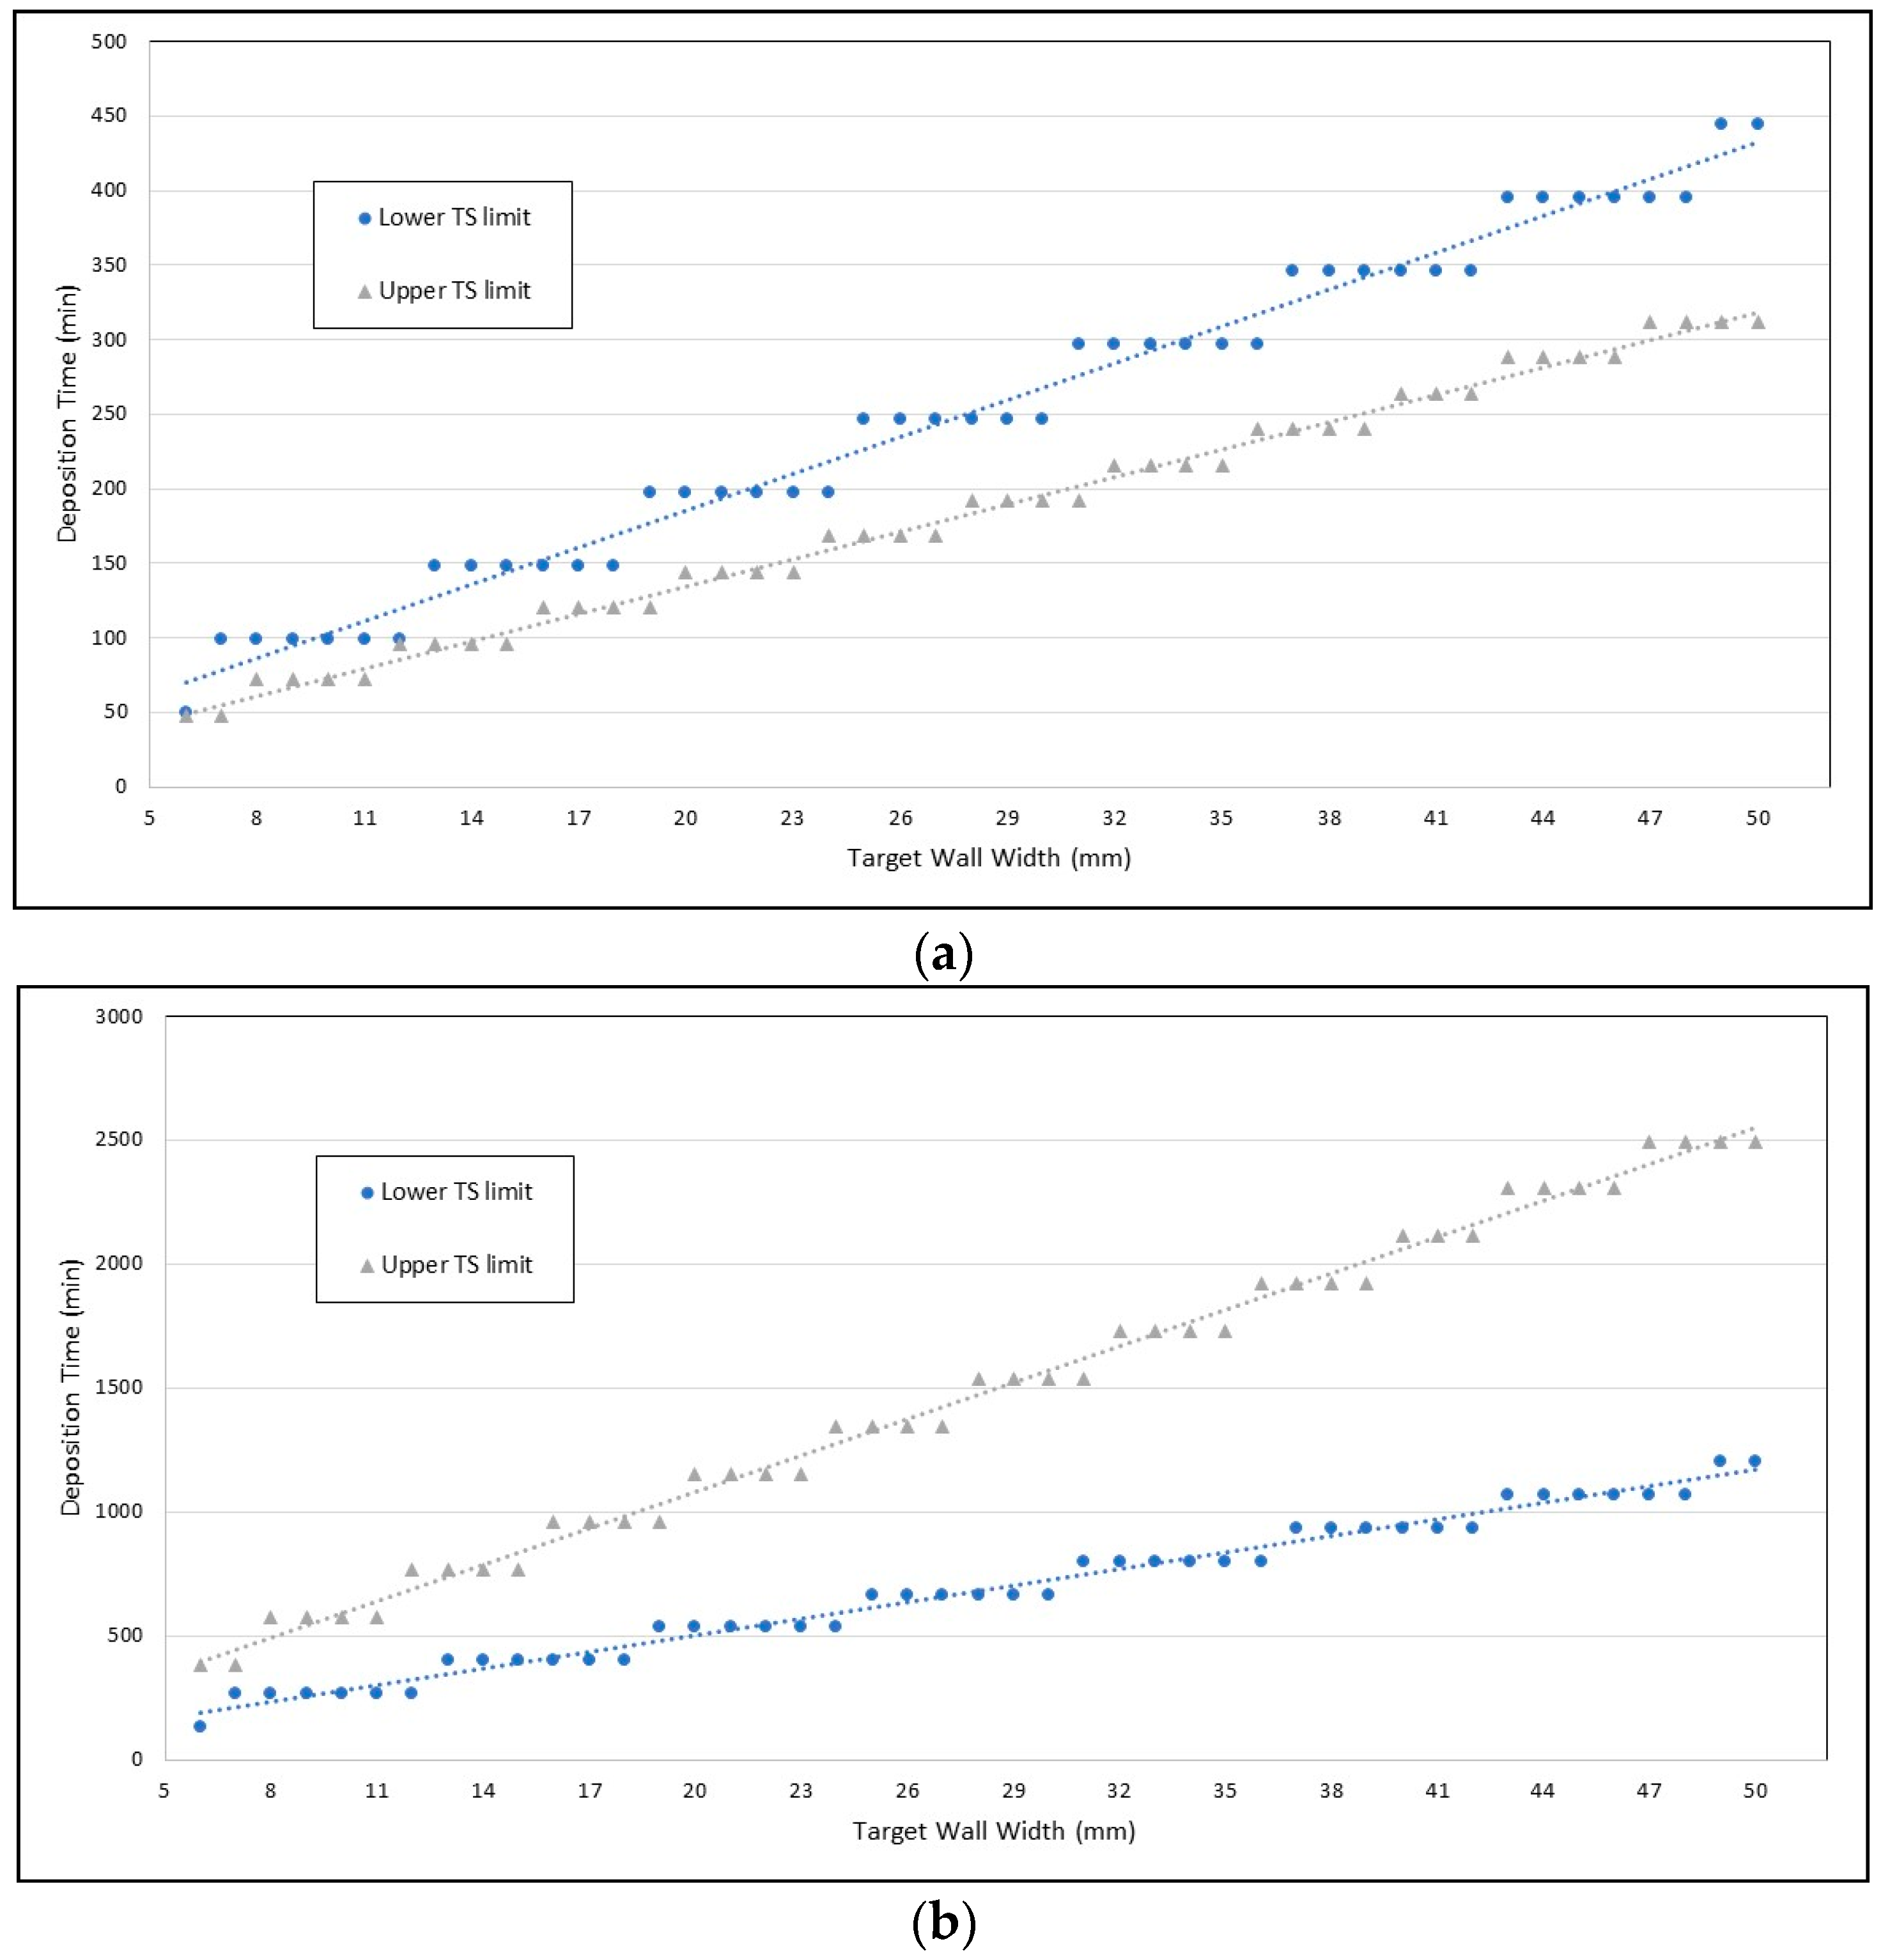
The graph presented in
Figure 13a shows the simulated time that would be spent to produce walls of a wide range of thickness with lower and higher travel speed limits as resulted in
Section 2.1. The reason for the shelves on the chart is that fraction of number of passes is not possible. One can deduce that the upper TS limit would be the best option and that the wider the target wall thickness is, the larger the difference between the deposition times. It could also be demonstrated that an increase or decrease of the wall length and/or height does not change the trends. It is important to remember that no dead time during stops and starts of a pass was considered in this demonstration. A higher number of passes would take longer total dead times, which, in turn, is less expensive than the deposition time (no material and energy consumed). However,
Figure 13 shows an interesting characteristic if a dead time, even as short as 120 s, is considered in the same situation (typically needed with, for instance, bi-directional layer depositions). Although the trends to enlarge the difference of deposition times still exist, the lower TS limit becomes the most economical option (explained by the reduction of starts and stops between layers). More interesting is the fact that the inverse tendency is minimized, or even reversed again, whether wall length or height is significantly lengthened (dead time has less weight in the total time).
However, it was demonstrated in
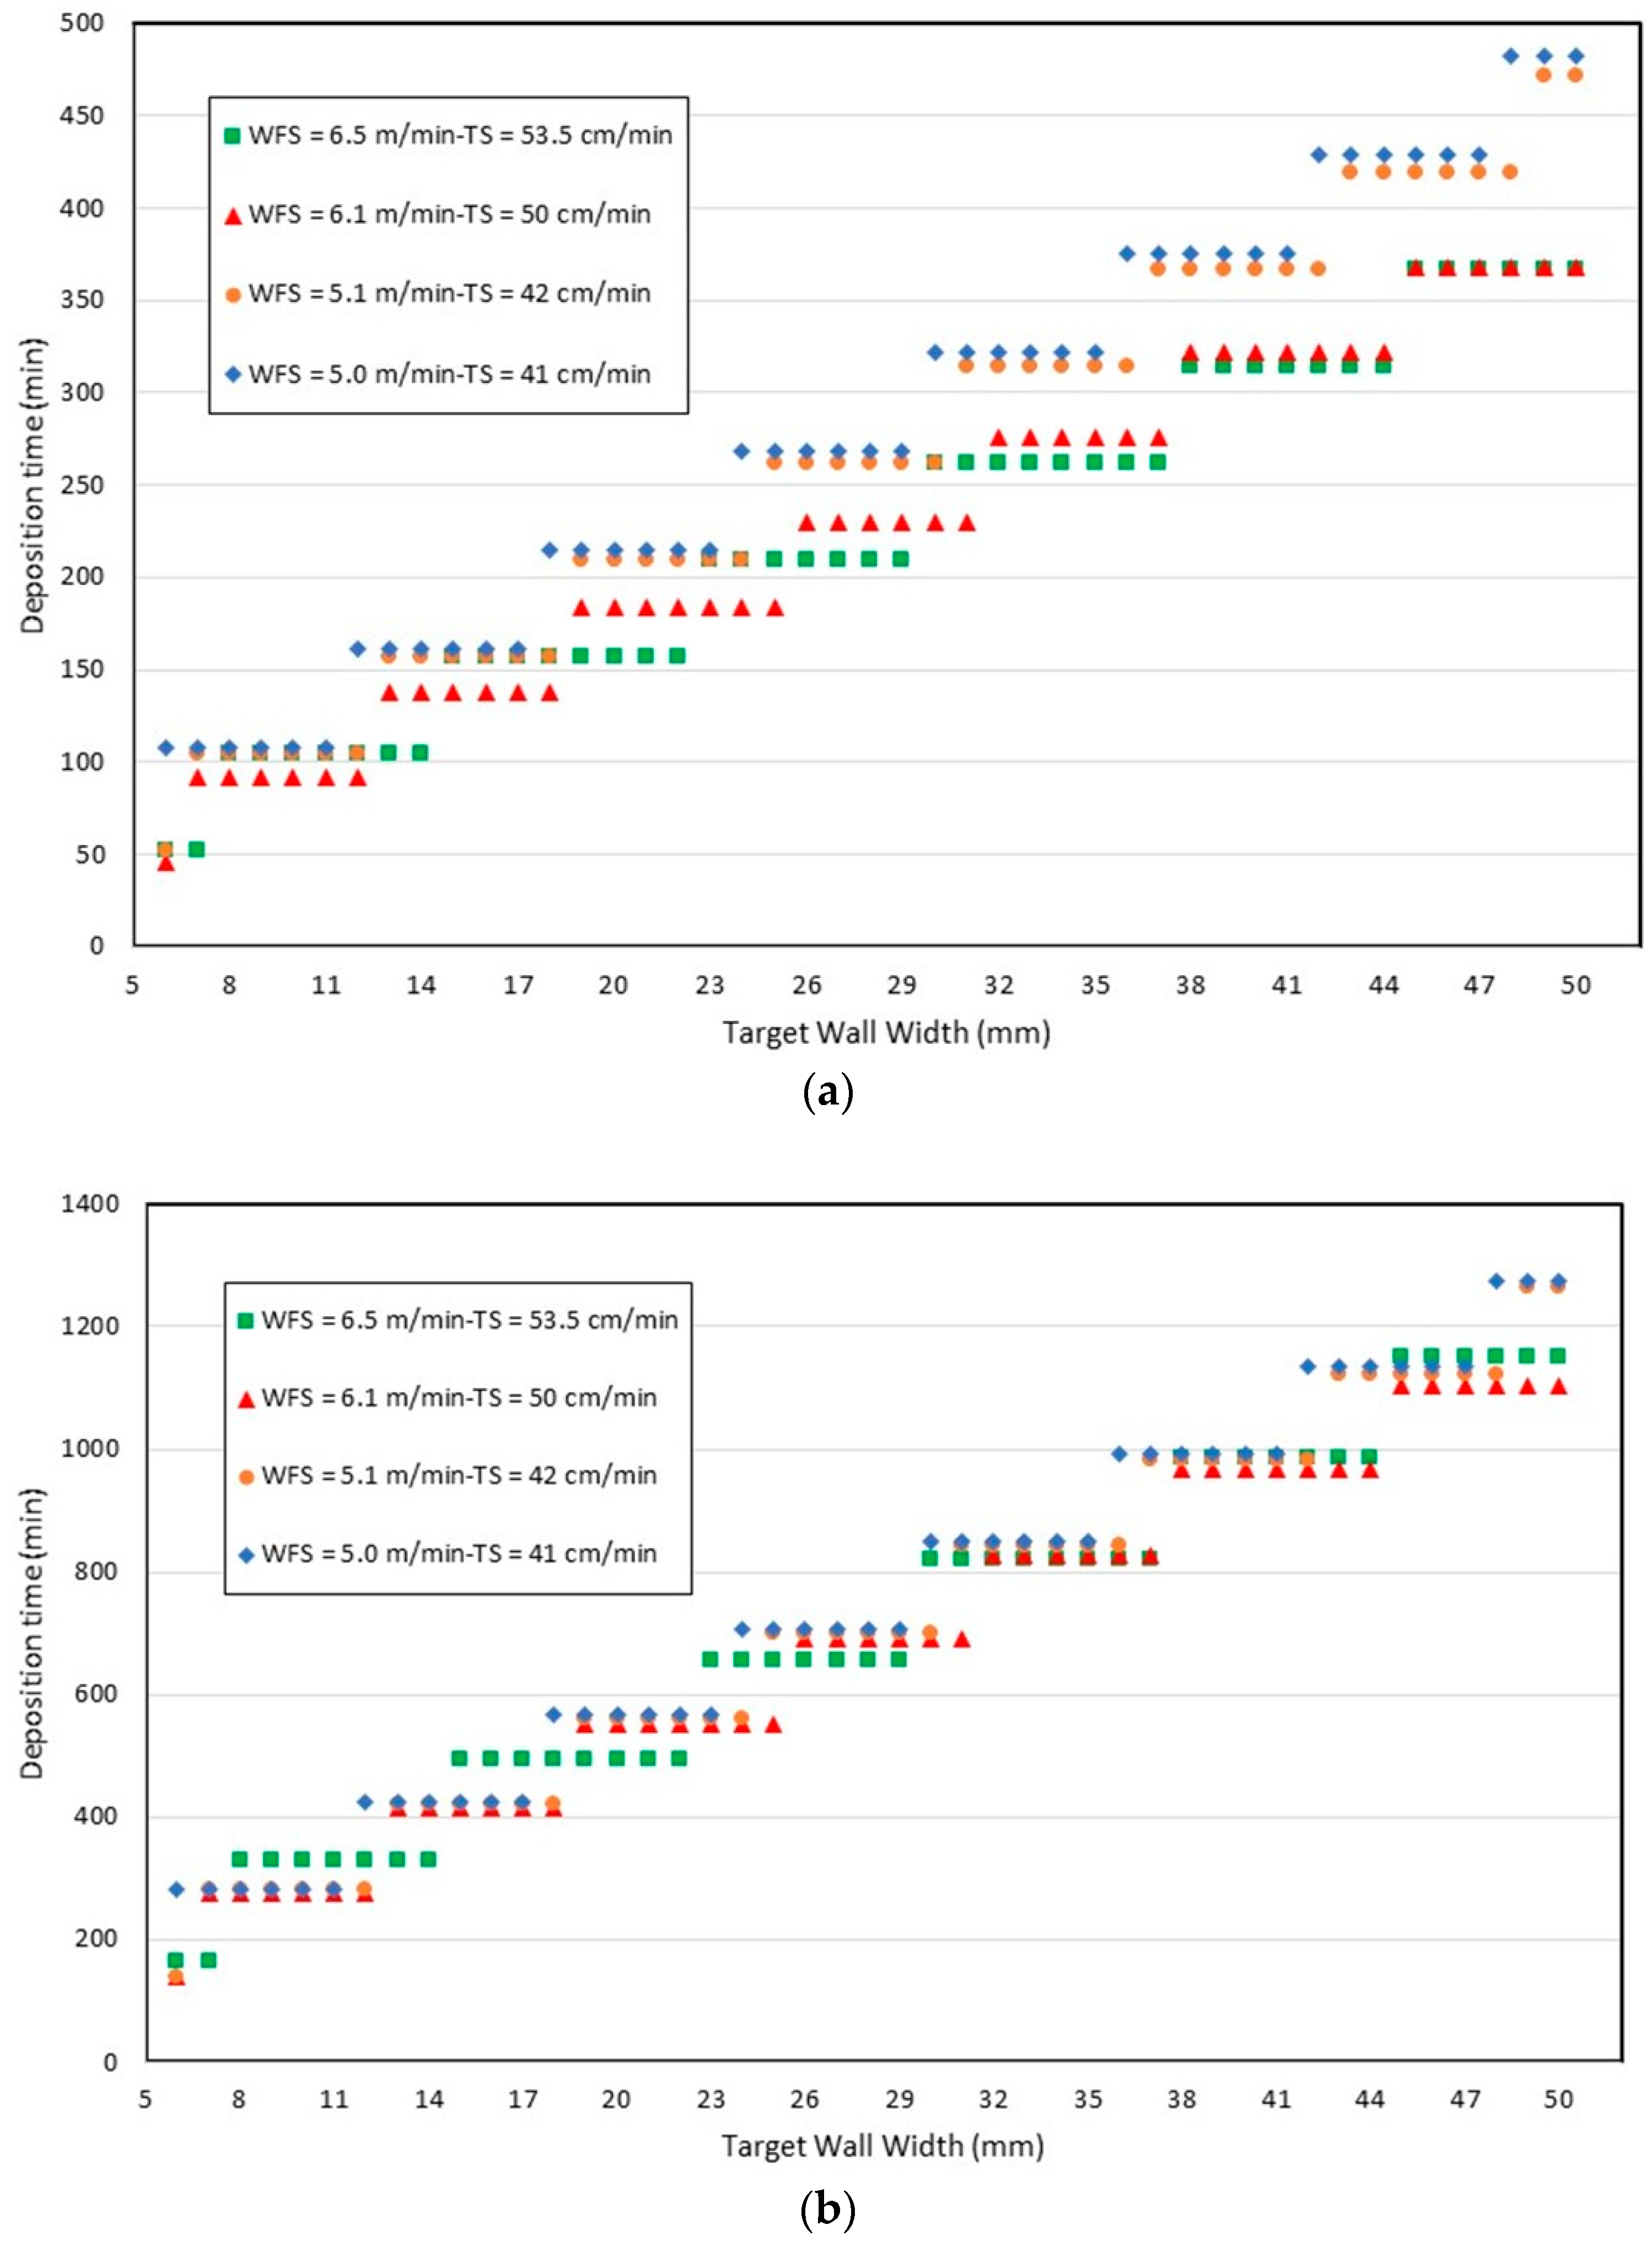
Section 2.3 that travel speed can be increased if WFS is also proportionally increased (keeping the same wall cross-section area per layer). As seen in
Table 4, there was no change in the wall surface quality (assessed by the wall quality surface waviness index) in the evaluated WFS range, suggesting a potential for production increase. Using the same reasoning as above (based on the number of passes per layer to reach the desired wall width),
Figure 14a shows that, for this condition, only for some thicknesses the deposition time is reduced by the choice of faster TS (53.5 cm/min) with the same ratio WFS/TS, intercalating the position with the second fast speed (50 cm/min). On the other hand, the longest deposition time happens for the slowest speed (41 cm/min). This trend keeps the same, regardless the length and/or height of the wall. Nevertheless, the deposition time difference between the fastest and slowest TS turns progressively smaller when dead times is included in the simulations, as seen in
Figure 14b.
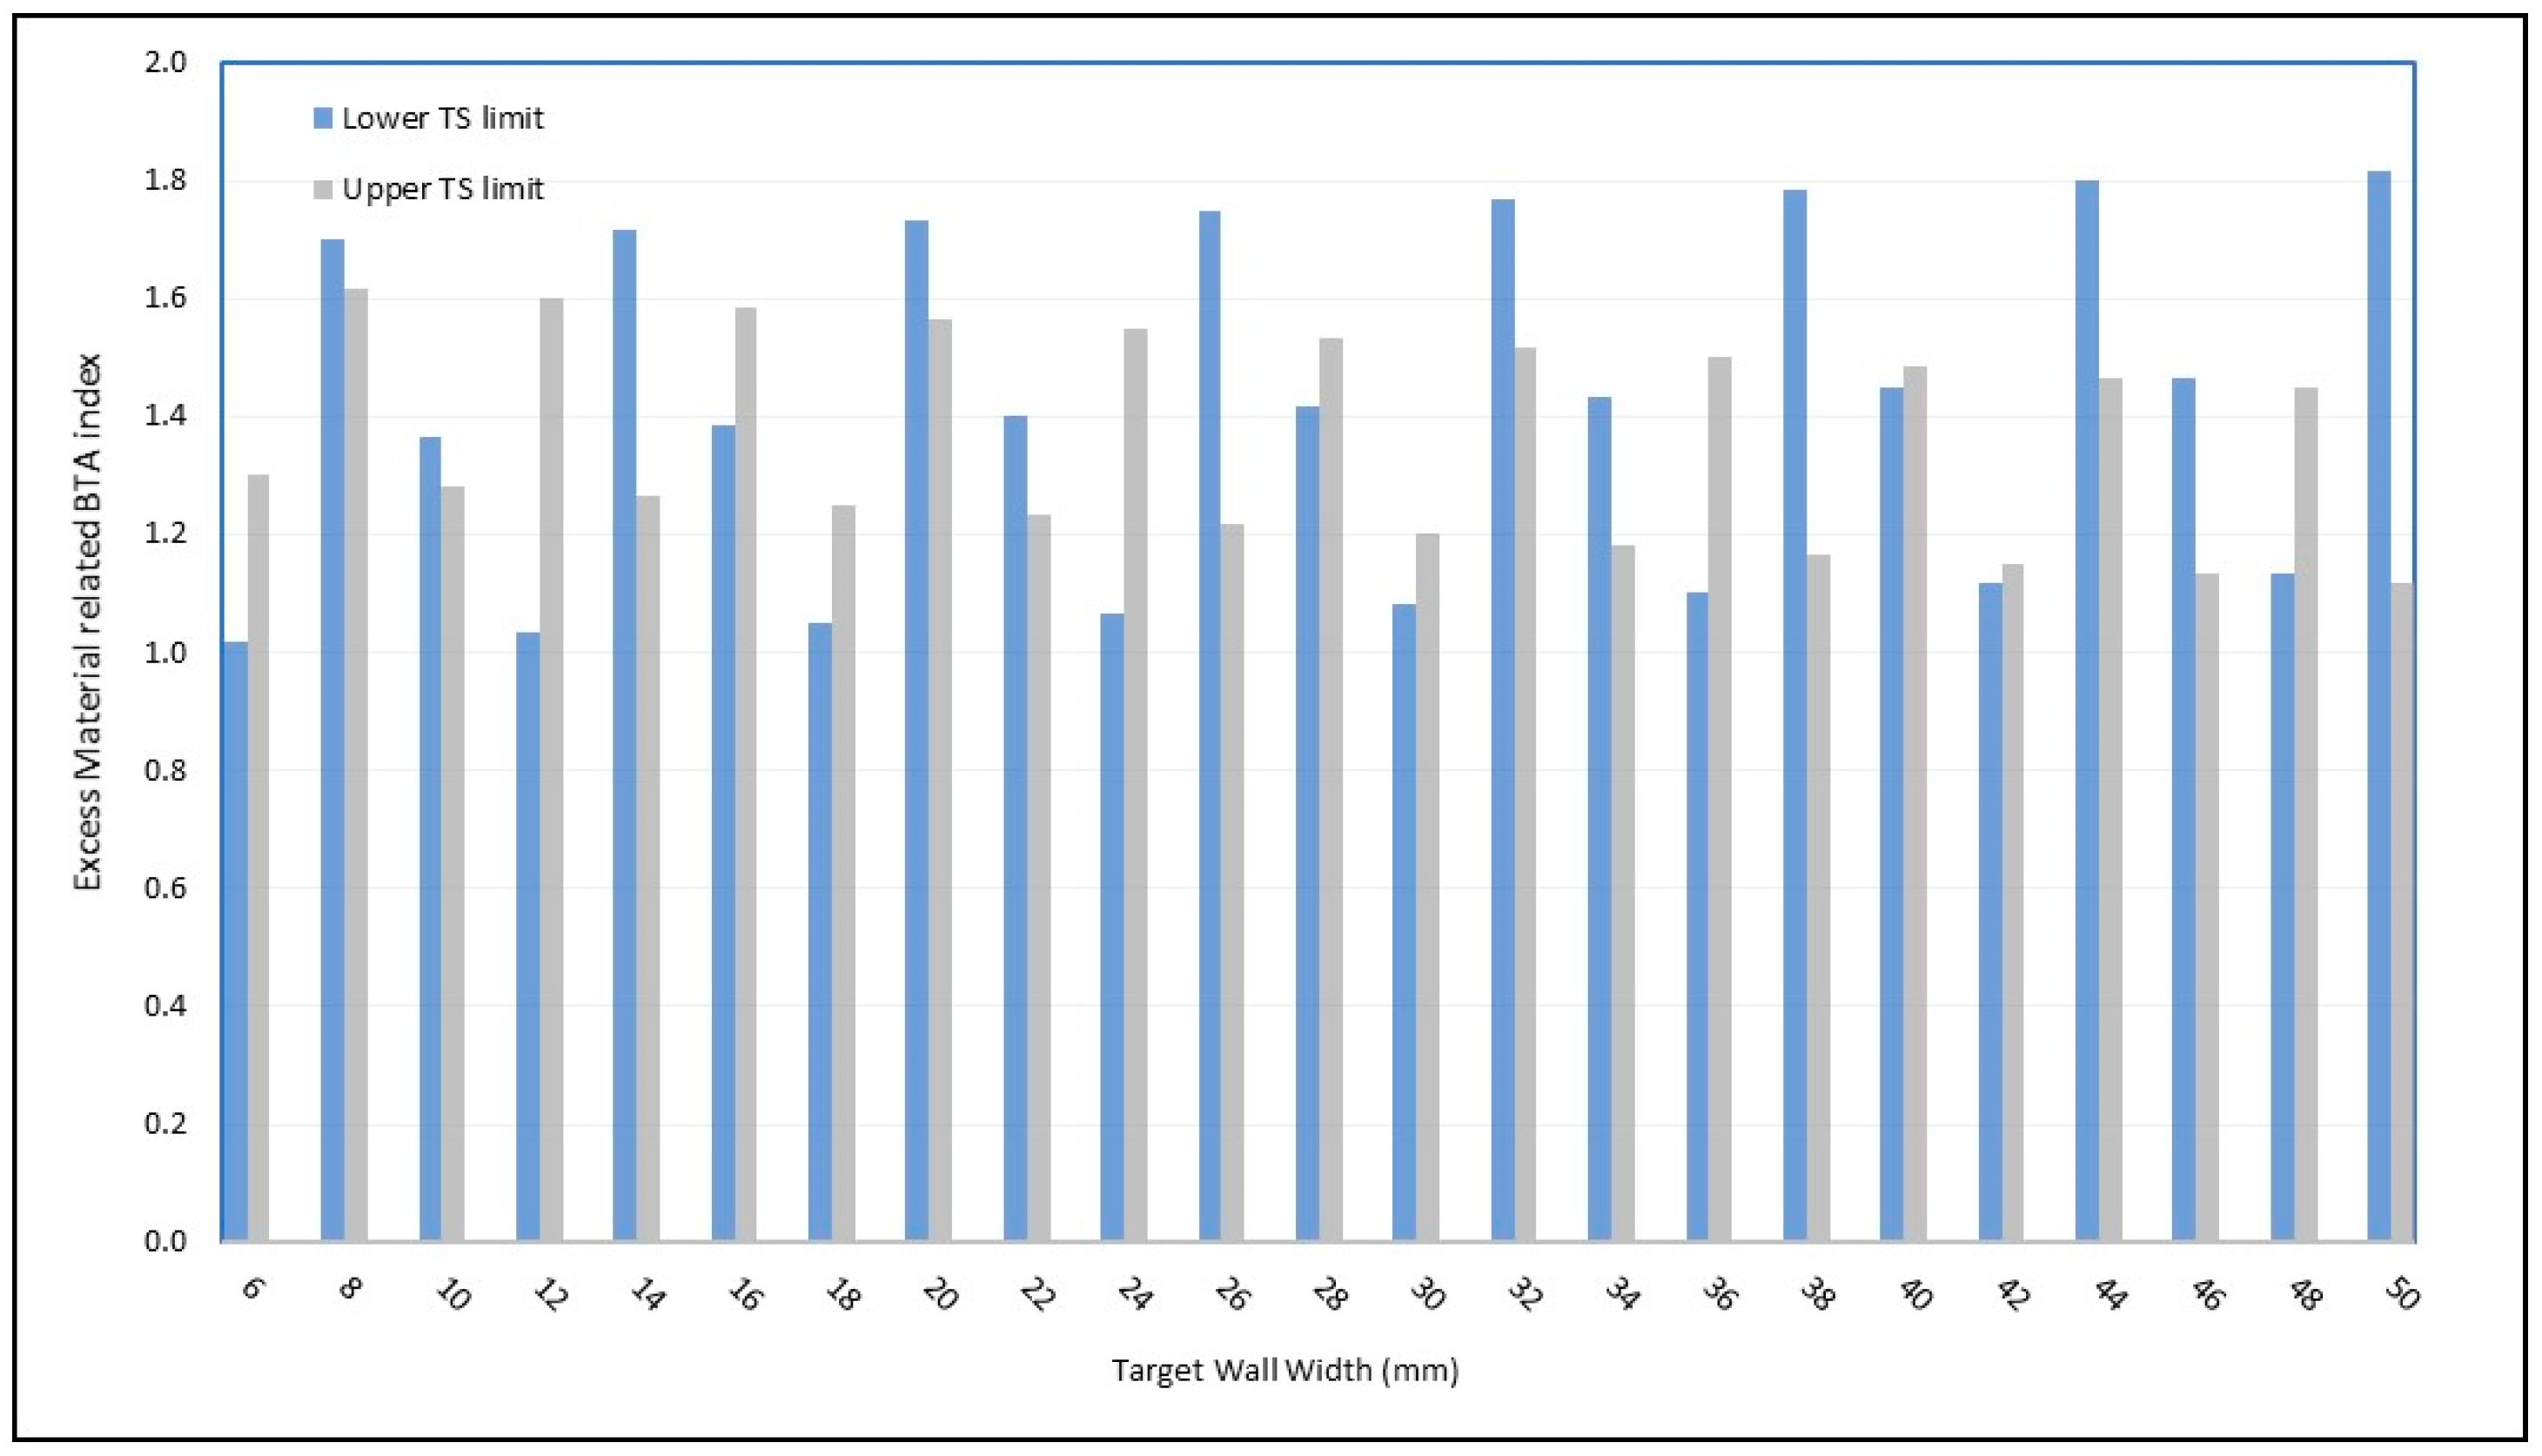
When there is a target width defined in the component design, the choice of the optimum TS can lead to a wall wider than the targeted one. This means that, including the wall waviness (quantified by the SW index), this width excess must be machined. At this point, another conceptual index must be introduced, in addition to the surface quality related SW index. The “buy-to-apply” index is a cost-related index, to account for the excess of material. This index quantified by the ratio between the full cross-sectional area of the layers and the target cross-sectional area of the walls (using the similar concept to “buy-to-fly” applied in aeronautic studies). Thereafter, this index is referred here as BTA. The purpose of establishing two indices (SW and BTA) is that each one has a different cause (the solutions to minimize each of them are dissimilar).
Figure 15 presents the variation of the BTA index as a function of the target wall width for the case of
Figure 13a. As seen, depending on the target thickness of the wall, the choice of the TS can lead to higher or lower excess of material to be removed. For instance, for a target of 14-mm thick wall, from the deposition time point of view (
Figure 13a), longer time would be spent by using the lower TS limit. From the BTA perspective (
Figure 15), more material to be removed would also happen by using the lower TS limit. Thus, for 14-mm thick target wall, upper TS limit should be selected. On the other hand, for a target of 18-mm thick wall, from
Figure 13a, longer time would still be spent by using lower TS limit, but from
Figure 15 less material to be removed would happen by using the upper TS limit. Therefore, the decision should counterbalance the costs related to deposition time (which will be reduced with faster TS) and the costs related to post-operation machining (which, in this case, would be lesser with slower TS), considering that the wall quality is assured within the travel speed limits.
It is important to remember that this work aimed to present and evaluate a methodology. In order to reach a more comprehensive view on the subject, new tests must be carried out to complete the operational map, including incidences of discontinuities (porosities, cracks, etc.) and low mechanical properties. The travel speed limits should be searched to other current levels, too. In addition, the increase of process production capacity should be searched using other WFS/TS ratios.


