Article

Interlaced Laser Beam Scanning: A Method Enabling an Increase in the Throughput of Ultrafast Laser Machining of Borosilicate Glass

by
Krystian L. Wlodarczyk
1,2,*,
Amiel A. Lopes
2,
Paul Blair
3,
M. Mercedes Maroto-Valer
1 and
Duncan P. Hand
2
1
Research Centre for Carbon Solutions (RCCS), Institute of Mechanical, Process and Energy Engineering, School of Engineering and Physical Sciences, Heriot-Watt University, Edinburgh, EH14 4AS, UK
2
Institute of Photonics and Quantum Sciences, School of Engineering and Physical Sciences, Heriot-Watt University, Edinburgh, EH14 4AS, UK
3
PowerPhotonic Ltd., 5a 1 St David’s Drive, St David’s Business Park, Dalgety Bay, KY11 9PF, UK
*
Author to whom correspondence should be addressed.
J. Manuf. Mater. Process. 2019, 3(1), 14; https://doi.org/10.3390/jmmp3010014
Submission received: 23 December 2018 / Revised: 17 January 2019 / Accepted: 21 January 2019 / Published: 23 January 2019
(This article belongs to the Special Issue High-Speed Machining)

Abstract

:
We provide experimental evidence that the laser beam scanning strategy has a significant influence on material removal rate in the ultrafast laser machining of glass. A comparative study of two laser beam scanning methods, (i) bidirectional sequential scanning method (SM) and (ii) bidirectional interlaced scanning method (IM), is presented for micromachining 1.1-mm-thick borosilicate glass plates (Borofloat® 33). Material removal rate and surface roughness are measured for a range of pulse energies, overlaps, and repetition frequencies. With a pulse overlap of ≤90%, IM can provide double the ablation depth and double the removal rate in comparison to SM, whilst maintaining very similar surface roughness. In both cases, the root-mean-square (RMS) surface roughness (Sq) was in the range of 1 μm to 2.5 μm. For a 95% pulse overlap, the difference was more pronounced, with IM providing up to four times the ablation depth of SM; however, this is at the cost of a significant increase in surface roughness (Sq values >5 μm). The increased ablation depths and removal rates with IM are attributed to a layer-by-layer material removal process, providing more efficient ejection of glass particles and, hence, reduced shielding of the machined area. IM also has smaller local angles of incidence of the laser beam that potentially can lead to a better coupling efficiency of the laser beam with the material.

1. Introduction

Process productivity, machining speed, and precision are key features of any manufacturing process. There are many products, e.g., optics, micro-optics, electronics, opto-electronics, medical tools, sensors, and automotive and aerospace components, that require high-throughput machining at micron-scale resolution and accuracy. Laser processes offer such capabilities, combining speed, precision, and resolution to an extent that is often not possible using ordinary mechanical methods [1]. Moreover, since the laser is not in physical contact with a workpiece, there is no tool wear, unlike in mechanical processes where a tool bit must be sharpened or replaced.
Efficient and precision machining of transparent materials, such as optical glass, quartz, and sapphire, is not a trivial task. These materials are hard and brittle; hence, conventional mechanical processes, such as cutting, drilling, and milling, are very challenging and often do not provide satisfying results, as they typically result in cracks and jagged edges, together with contamination from a coolant. Chemical etching, in turn, requires additional, time-consuming steps related to the preparation of bespoke masks in order to achieve the final goal. Lasers, in particular ultrafast lasers that emit femtosecond and/or picosecond laser pulses, are very attractive tools in manufacturing because a single laser of this type is capable of machining a wide range of materials [2,3,4,5,6,7,8,9]. The very short interaction time of individual laser pulses with the workpiece means that the heat-affected zone (HAZ) can be minimized, providing so-called “cold” machining with very high precision and spatial resolution (even below 1 µm). Nonlinear optical effects, such as multi-photon absorption and electron avalanche ionization, induced by the very high peak intensity of such laser pulses, enable micromachining of glass and diamond, both at the surface and inside the material volume. By focusing the laser beam inside glass, it is possible to modify locally and permanently some physical properties of the material, e.g., its refractive index. This, in turn, allows the fabrication of two- and three-dimensional microstructures, such as optical waveguides, Bragg gratings, voids, and microchannels [8,9,10,11,12,13], as well as an “adhesive-free” joining of glass to another glass, silicon, or even metals [14,15].
The interaction of laser pulses with matter is a complex phenomenon that is strongly dependent on the various laser machining parameters, such as wavelength, fluence, pulse duration, pulse repetition frequency, and scan speed, as well as the physical properties of the workpiece, such as the reflectivity, absorptivity, thermal conductivity, and coefficient of thermal expansion [5,16]. In this article, we study picosecond laser micromachining of borosilicate glass (Borofloat® 33, SCHOTT Technical Glass Solutions GmbH, Jena, Germany). This material is commonly used for manufacturing a wide range of products, e.g., optics, microelectronics, and photovoltaics, as well as scientific glassware (beakers, flasks, etc.). Recently, we demonstrated that this glass can also be used for the rapid laser manufacturing of bespoke microfluidic devices [15]. The objective of this article was to investigate the influence of laser parameters and laser beam scanning strategy on the machining throughput and the resulting surface roughness of the laser-machined glass workpiece. Here, we compare an unconventional laser beam scanning strategy, namely an interlaced scanning method (IM), with a conventional approach, typically called laser beam raster scanning or sequential scanning method (SM). Our earlier experiments performed on fused silica demonstrated that IM can provide significantly higher material removal rates [17]. A similar approach was also followed by Neuenschwander et al. [18] to provide improved surface finish of metals using ultrafast laser machining. In this work, we extend our investigation of IM to Borofloat® 33 glass. Along with the results, we suggest potential mechanisms for the significant increases in material removal rate.

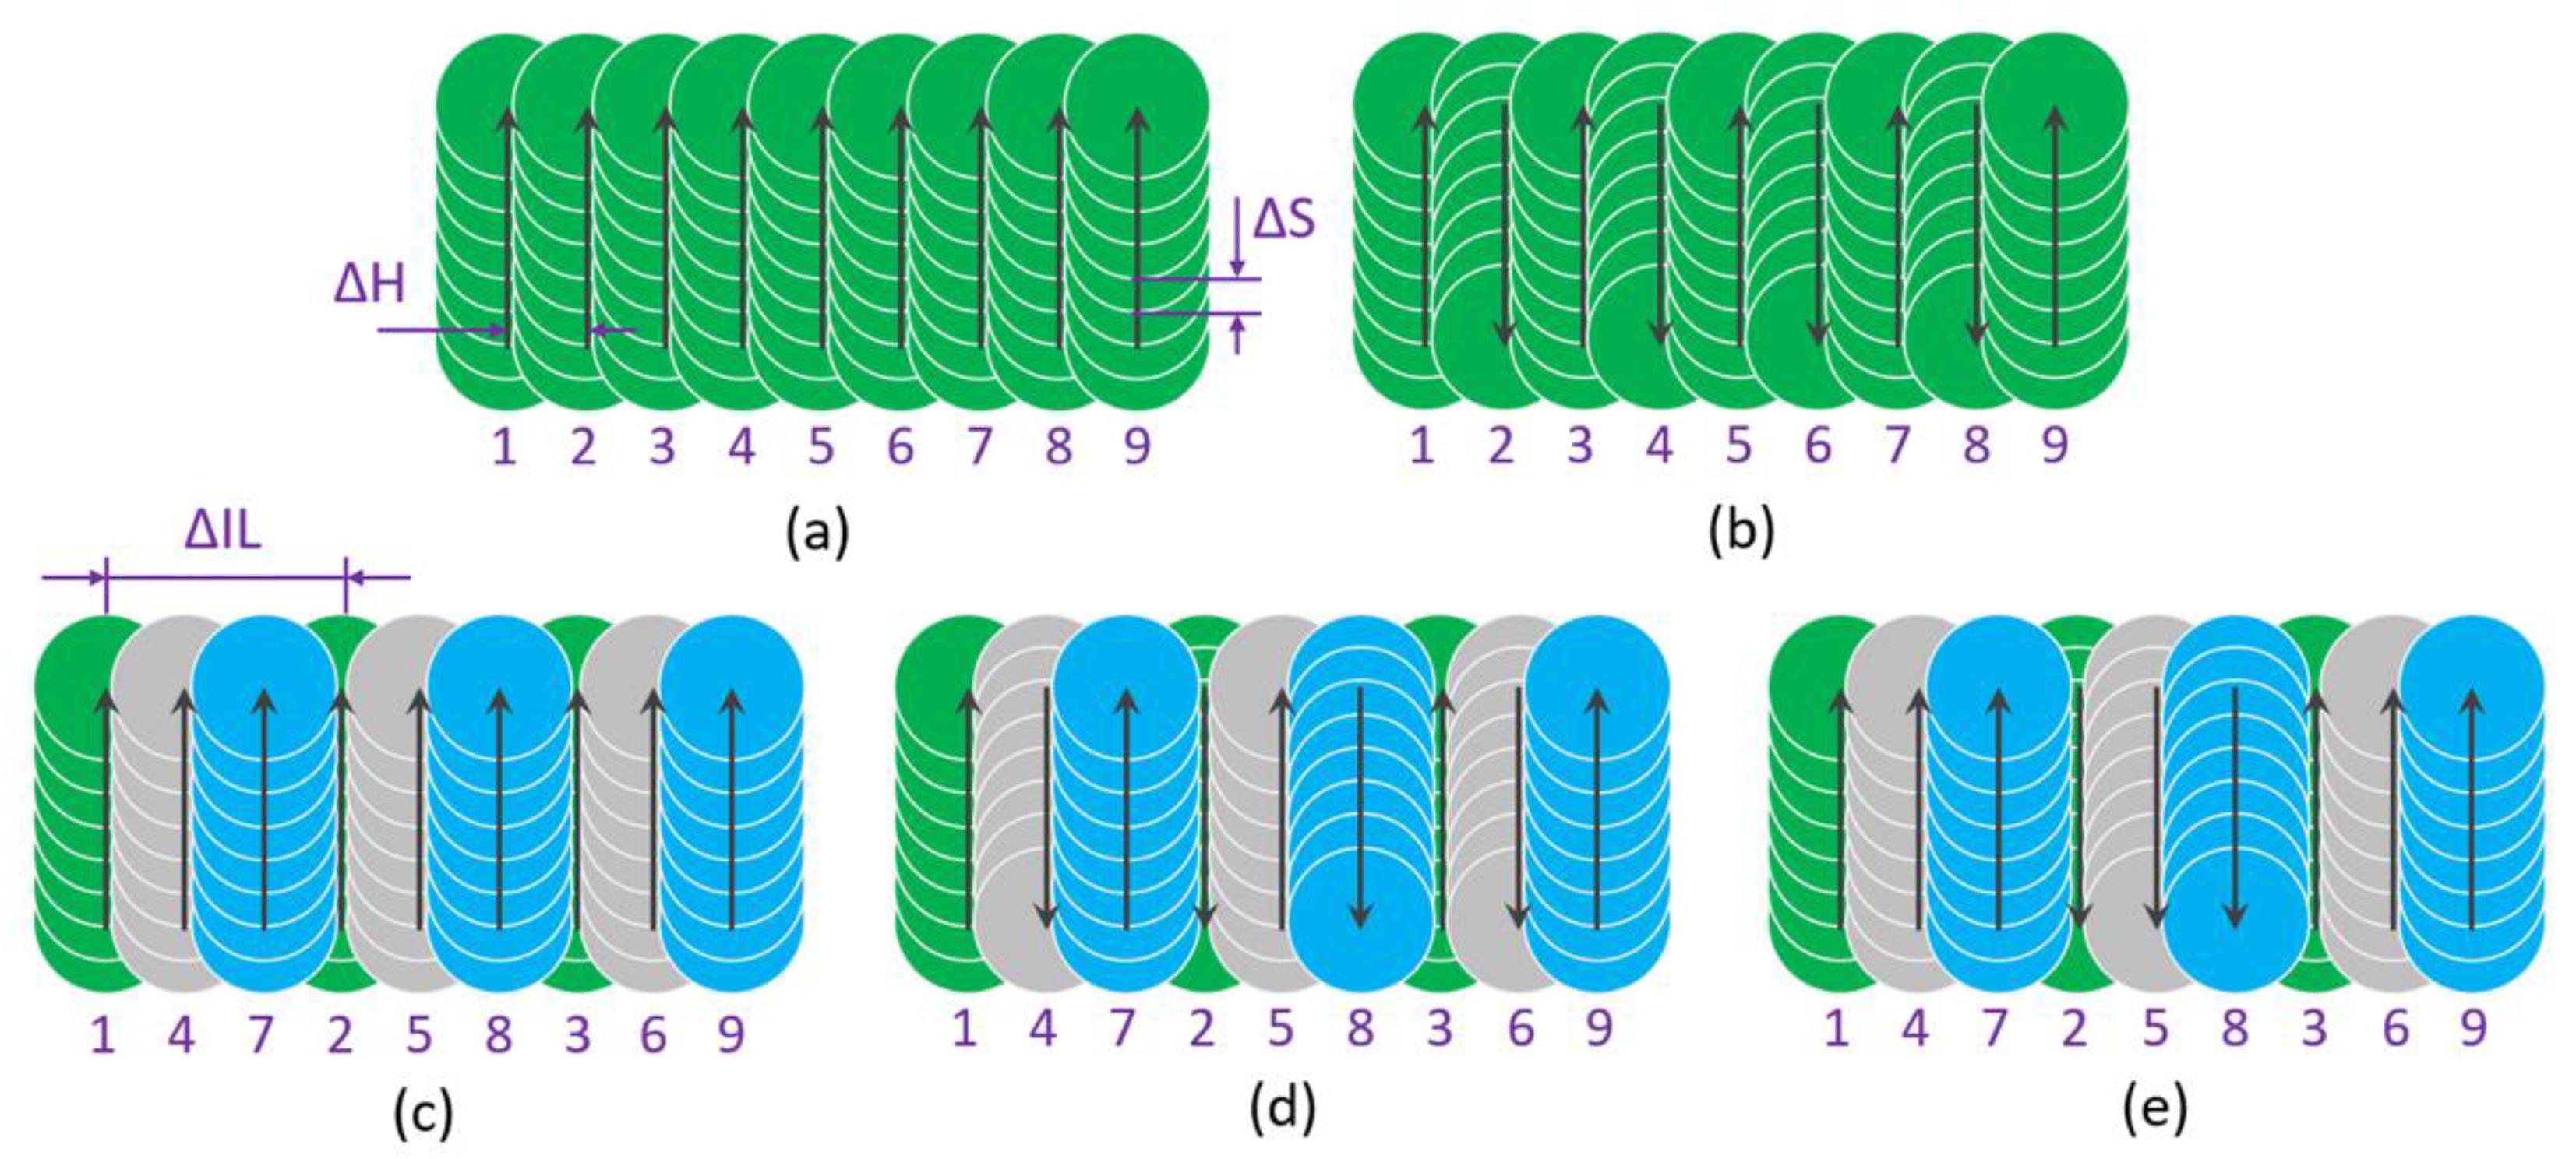
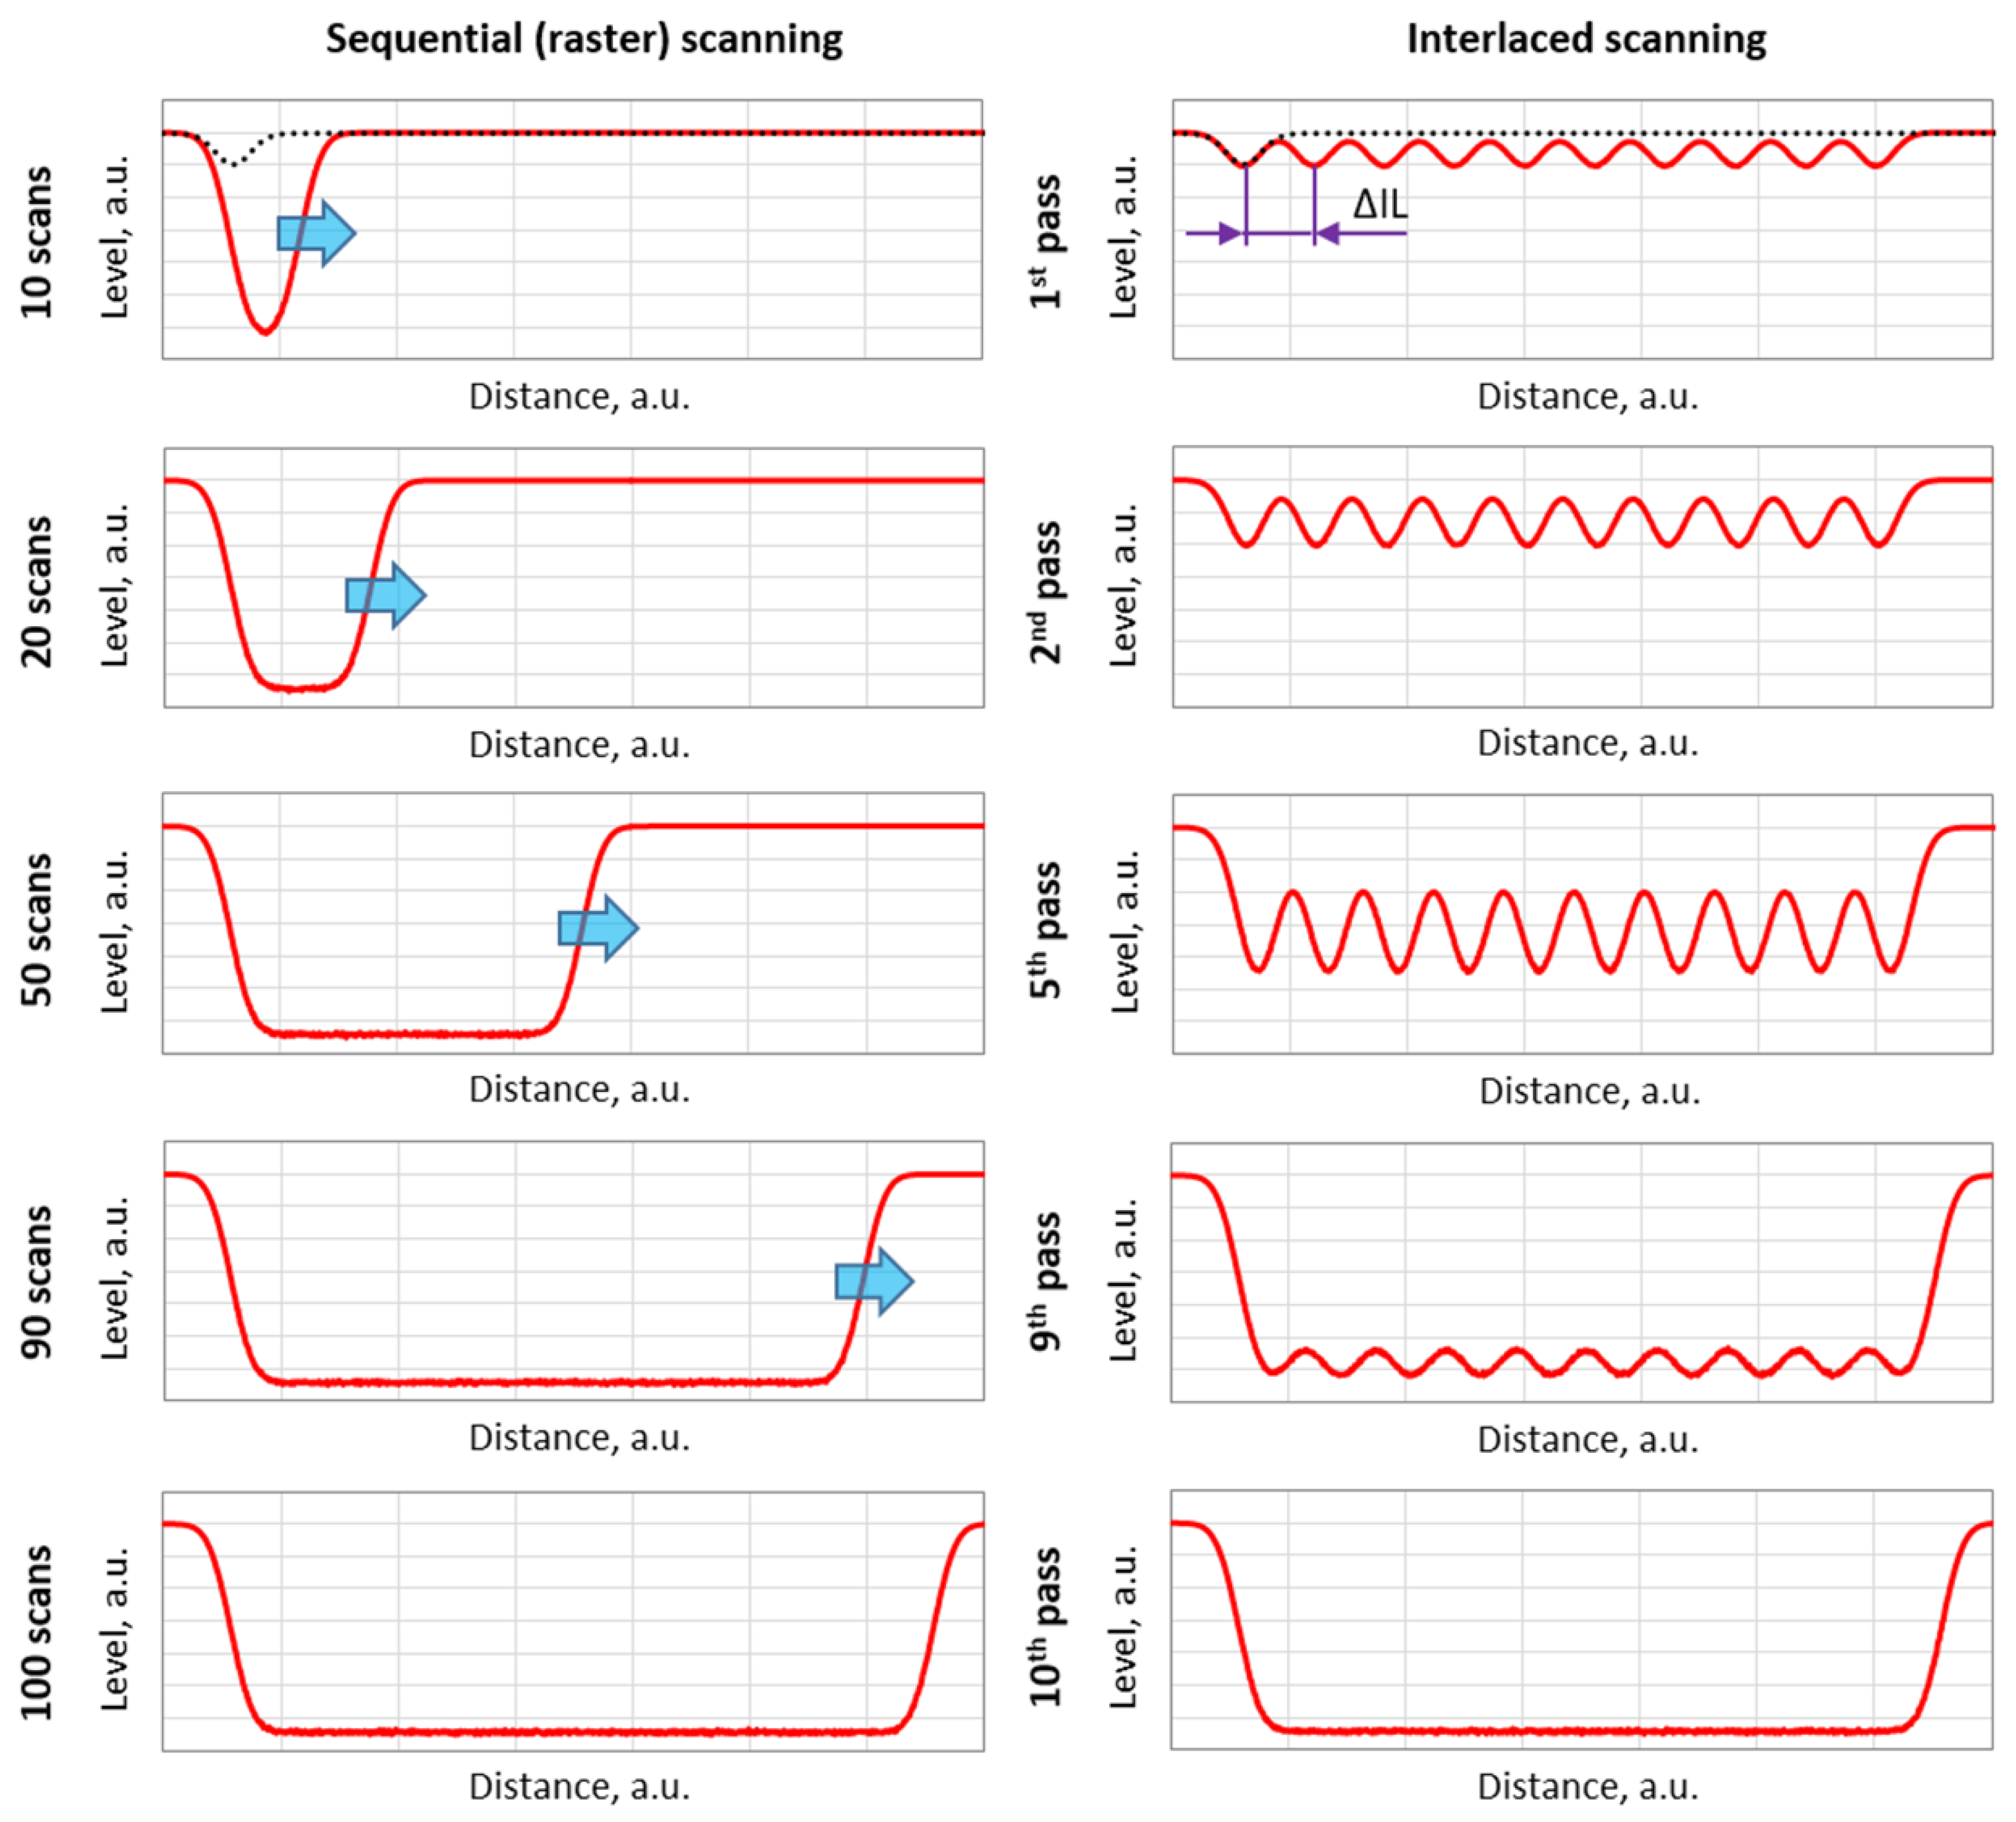
2. Interlaced Scanning Method

Figure 1 shows two variations of SM (see (a) and (b)) and three variations of IM (see (c), (d), and (e)). In SM, the laser beam is moved following a raster pattern, i.e., it is translated in the directions as indicated by arrows and following the numbered sequence. The distance between subsequent scanning lines is called the hatch distance (ΔH) and, normally, it is significantly smaller than the laser spot diameter (2ω) used for machining. SM is the most common scanning method used in laser micromachining applications, such as engraving, marking, and milling.
IM, in turn, relies on the scanning of the laser beam with an interlace distance (ΔIL) that is a multiple of ΔH. This means that some scanning lines are regularly skipped during the first pass. When the laser beam reaches the end of the machined area, it goes back to start the next pass. This time, however, the laser beam starts the scanning with an offset equal to ΔH in relation to the previous pass, skipping the same number of lines as before. In this way, some previously missing lines are filled in. The interlacing is repeated M times, every time with the same offset (ΔH) in relation to the previous laser beam pass, until the point when all missing lines are filled in.
Figure 1 shows three different variations of IM. In each case, for simplicity, the interlace distance (ΔIL) is equal to 3 × ΔH. Figure 1c illustrates unidirectional interlacing in which the laser beam always moves in the same direction, and Figure 1d shows bidirectional interlacing (called Type 1) in which the laser beam at the beginning of each pass moves in the opposite direction to the direction from the previous pass, whereas Figure 1e shows bidirectional interlacing (called Type 2) in which the laser beam at the beginning of each pass moves in the same direction.

3. Methodology

3.1. Laser Set-Up

The machining of Borofloat® 33 glass plates was performed using a picosecond laser (TruMicro 5X50, TRUMPF GmbH, Ditzingen, Germany) that provides approximately 6-ps pulses (measured at full-width-half-maximum) at the wavelength of 515 nm. The laser beam diameter (2ω) in the focus was 24 ± 1 μm, as measured at 1/e2 of its peak intensity, using a scanning slit beam profiler (DataRay Beam-Map 2 sensor). Such a small laser spot was obtained by focusing an expanded output laser beam through a 163-mm focal length F-theta lens. The maximum pulse energy (EP) was 65 μJ, which corresponds to a peak laser fluence (F) of 28.7 ± 2.5 J/cm2, as calculated using the following equation:
F = (2 × EP)/(π × ω2),
where ω is the laser beam radius.

3.2. Laser Machining Procedure

The thickness of the borosilicate glass plates was 1.1 mm. Laser machining was performed in ambient air without using any additional gasses. The laser beam was focused on the top surface of the glass. Prior to the laser treatment, all glass surfaces were cleaned with isopropanol and wiped with lens tissue. For machining, the samples were placed in a customized holder that provided a clear aperture underneath the laser machining area (to prevent damage to the back surface of the glass). The nozzle of a fume extraction system was placed close to the glass sample to collect the loose particles ejected from the glass surface.
The experiments consisted of laser micro-machining of small areas 2 mm × 2 mm. The squares (test areas) were generated using different, pre-determined combinations of four laser machining parameters (variables: pulse energy (EP), pulse repetition frequency (PRF), scan speed (v), and hatch distance (ΔH)), for both bidirectional SM and IM (type 2).
The EP values were in the range of 21 µJ to 65 µJ, PRF was either 20 kHz or 100 kHz, whilst the ΔH and v values were selected in such a way to obtain the pulse overlap values of 75%, 80%, 85%, 90%, and 95%, according to the following equations:
ΔH = 2ω × [1 − (OH/100%)],
v = PRF × 2ω × [1 − (OS/100%)],
where 2ω is the laser spot diameter, OH is the pulse overlap in the hatch direction, and OS is the pulse overlap in the laser beam scan direction (see Figure 1). In our experiments, during the generation of individual test areas, the pulse overlap values were the same in the hatch and scan directions (i.e., OH = OS). The full list of parameters used for the generation of the test areas is provided in Table 1.
The interlace distances (ΔIL) were chosen in such a way to be multiples of ΔH and were equal or similar to the laser spot diameter (2ω). For most of the pulse overlap values, the ΔIL value was 24 µm. The only exception was the pulse overlap of 85% for which the ΔIL was 21.6 µm. Since the ΔH and ΔS values were equal in both scanning methods, the total number of laser pulses (N) used for machining was also the same in both scanning methods. The N values defined for the 1-mm2 areas were calculated as follows:
N = (1 mm/ΔH) × (1 mm/ΔS),
where (1 mm/ΔH) and (1 mm/ΔS) are rounded to the nearest integers.
The total time (tM) required for the generation of 1-mm2 areas using selected values of pulse overlap (O) and PRF can be calculated using the following formula:
tM = (1 mm2/ΔH) × (1/v).
Using Equation (5), it is possible to estimate the material removal rate for different combinations of EP, O, PRF, and scanning method. Since the scan speeds (v) for a given value of O and PRF were the same in both scanning methods, the calculated tM values were also the same (see Table 1). In reality, however, the tM values may slightly vary from each other due to the time required to move the laser beam between different components of the scan.

3.3. Post-Process Cleaning

Following the laser machining process, the glass plates were cleaned by placing them in an ultrasonic bath (filled with deionized water) for 5 min at room temperature to remove any loose debris. Following cleaning, the glass surfaces were dried using a jet of oxygen-free nitrogen.

3.4. Sample Analysis

The test areas were measured with a three-dimensional (3D) surface profilometer (InfiniteFocus®, Alicona Imaging GmbH, Raaba/Graz, Austria) to obtain qualitative and quantitative information about the topology of the laser-machined areas. The measurements were performed using a ×10 objective that provided a field of view of 1.43 mm × 1.08 mm and a lateral resolution of 0.88 µm. After capturing the surface profiles, the Alicona data were used to determine an ablation depth (D) and root-mean-square surface roughness (Sq) of the laser-machined areas. These two parameters were calculated for 0.5 mm × 0.5 mm areas.

4. Results and Discussion

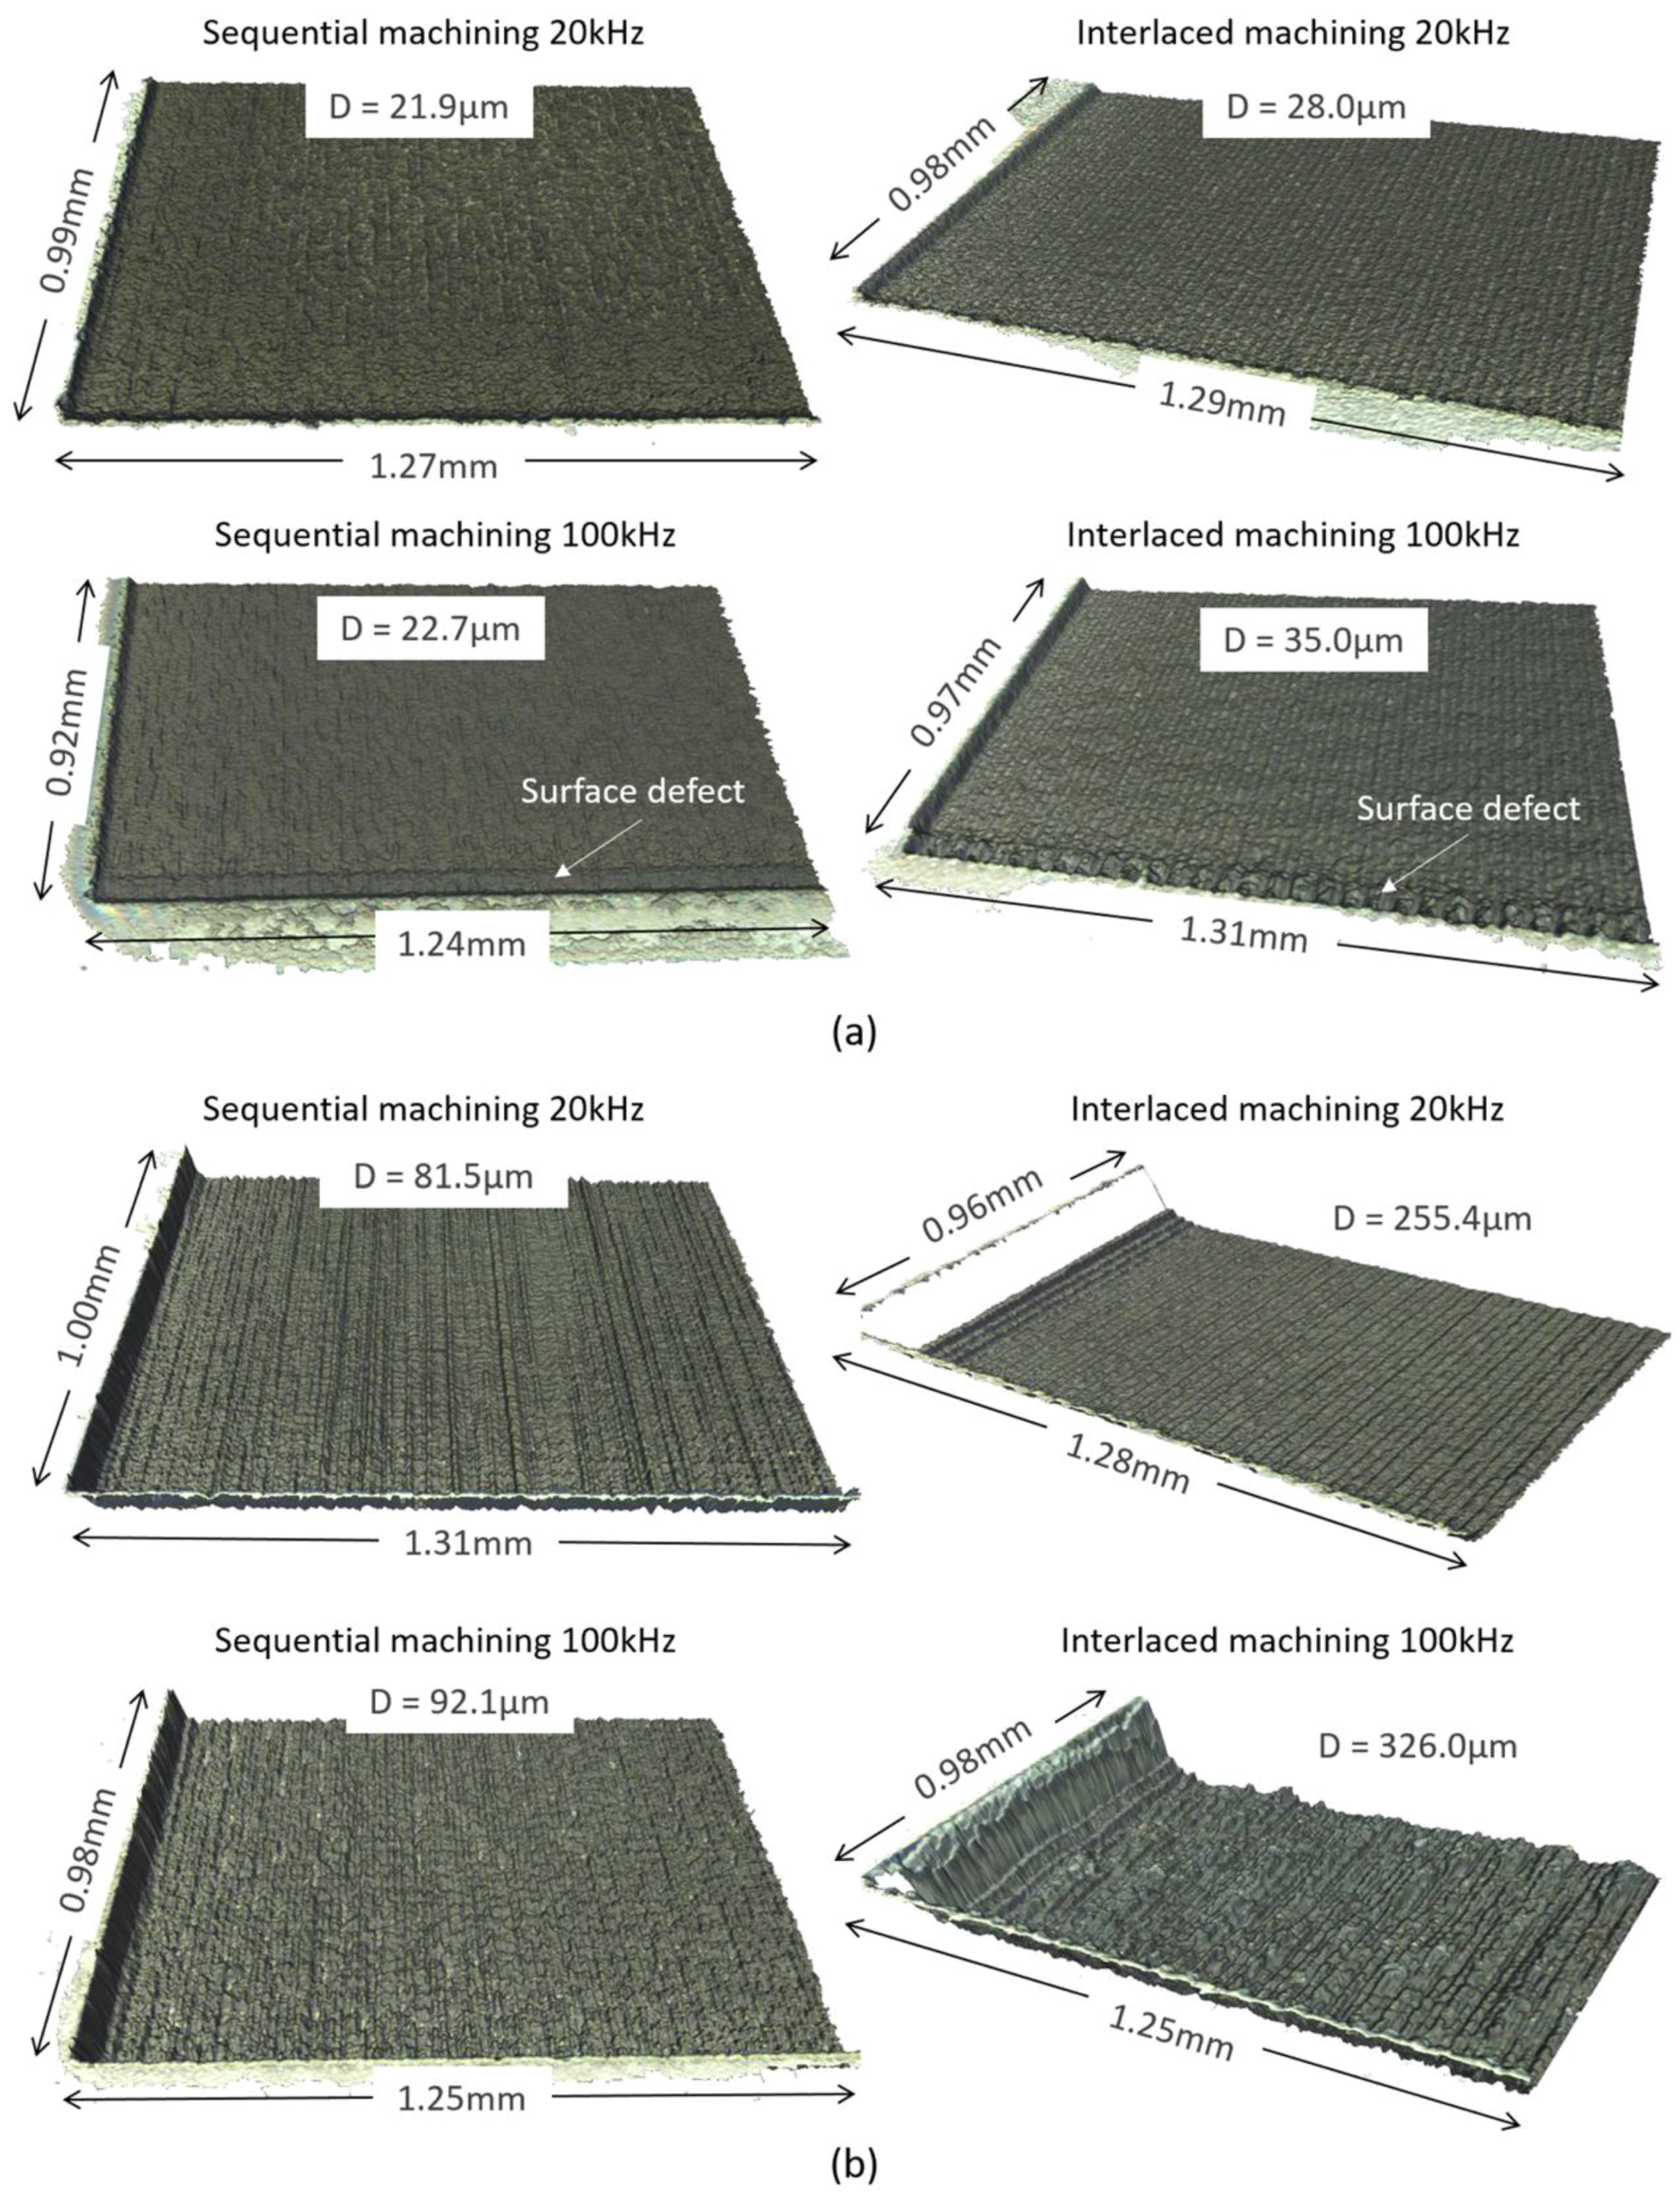
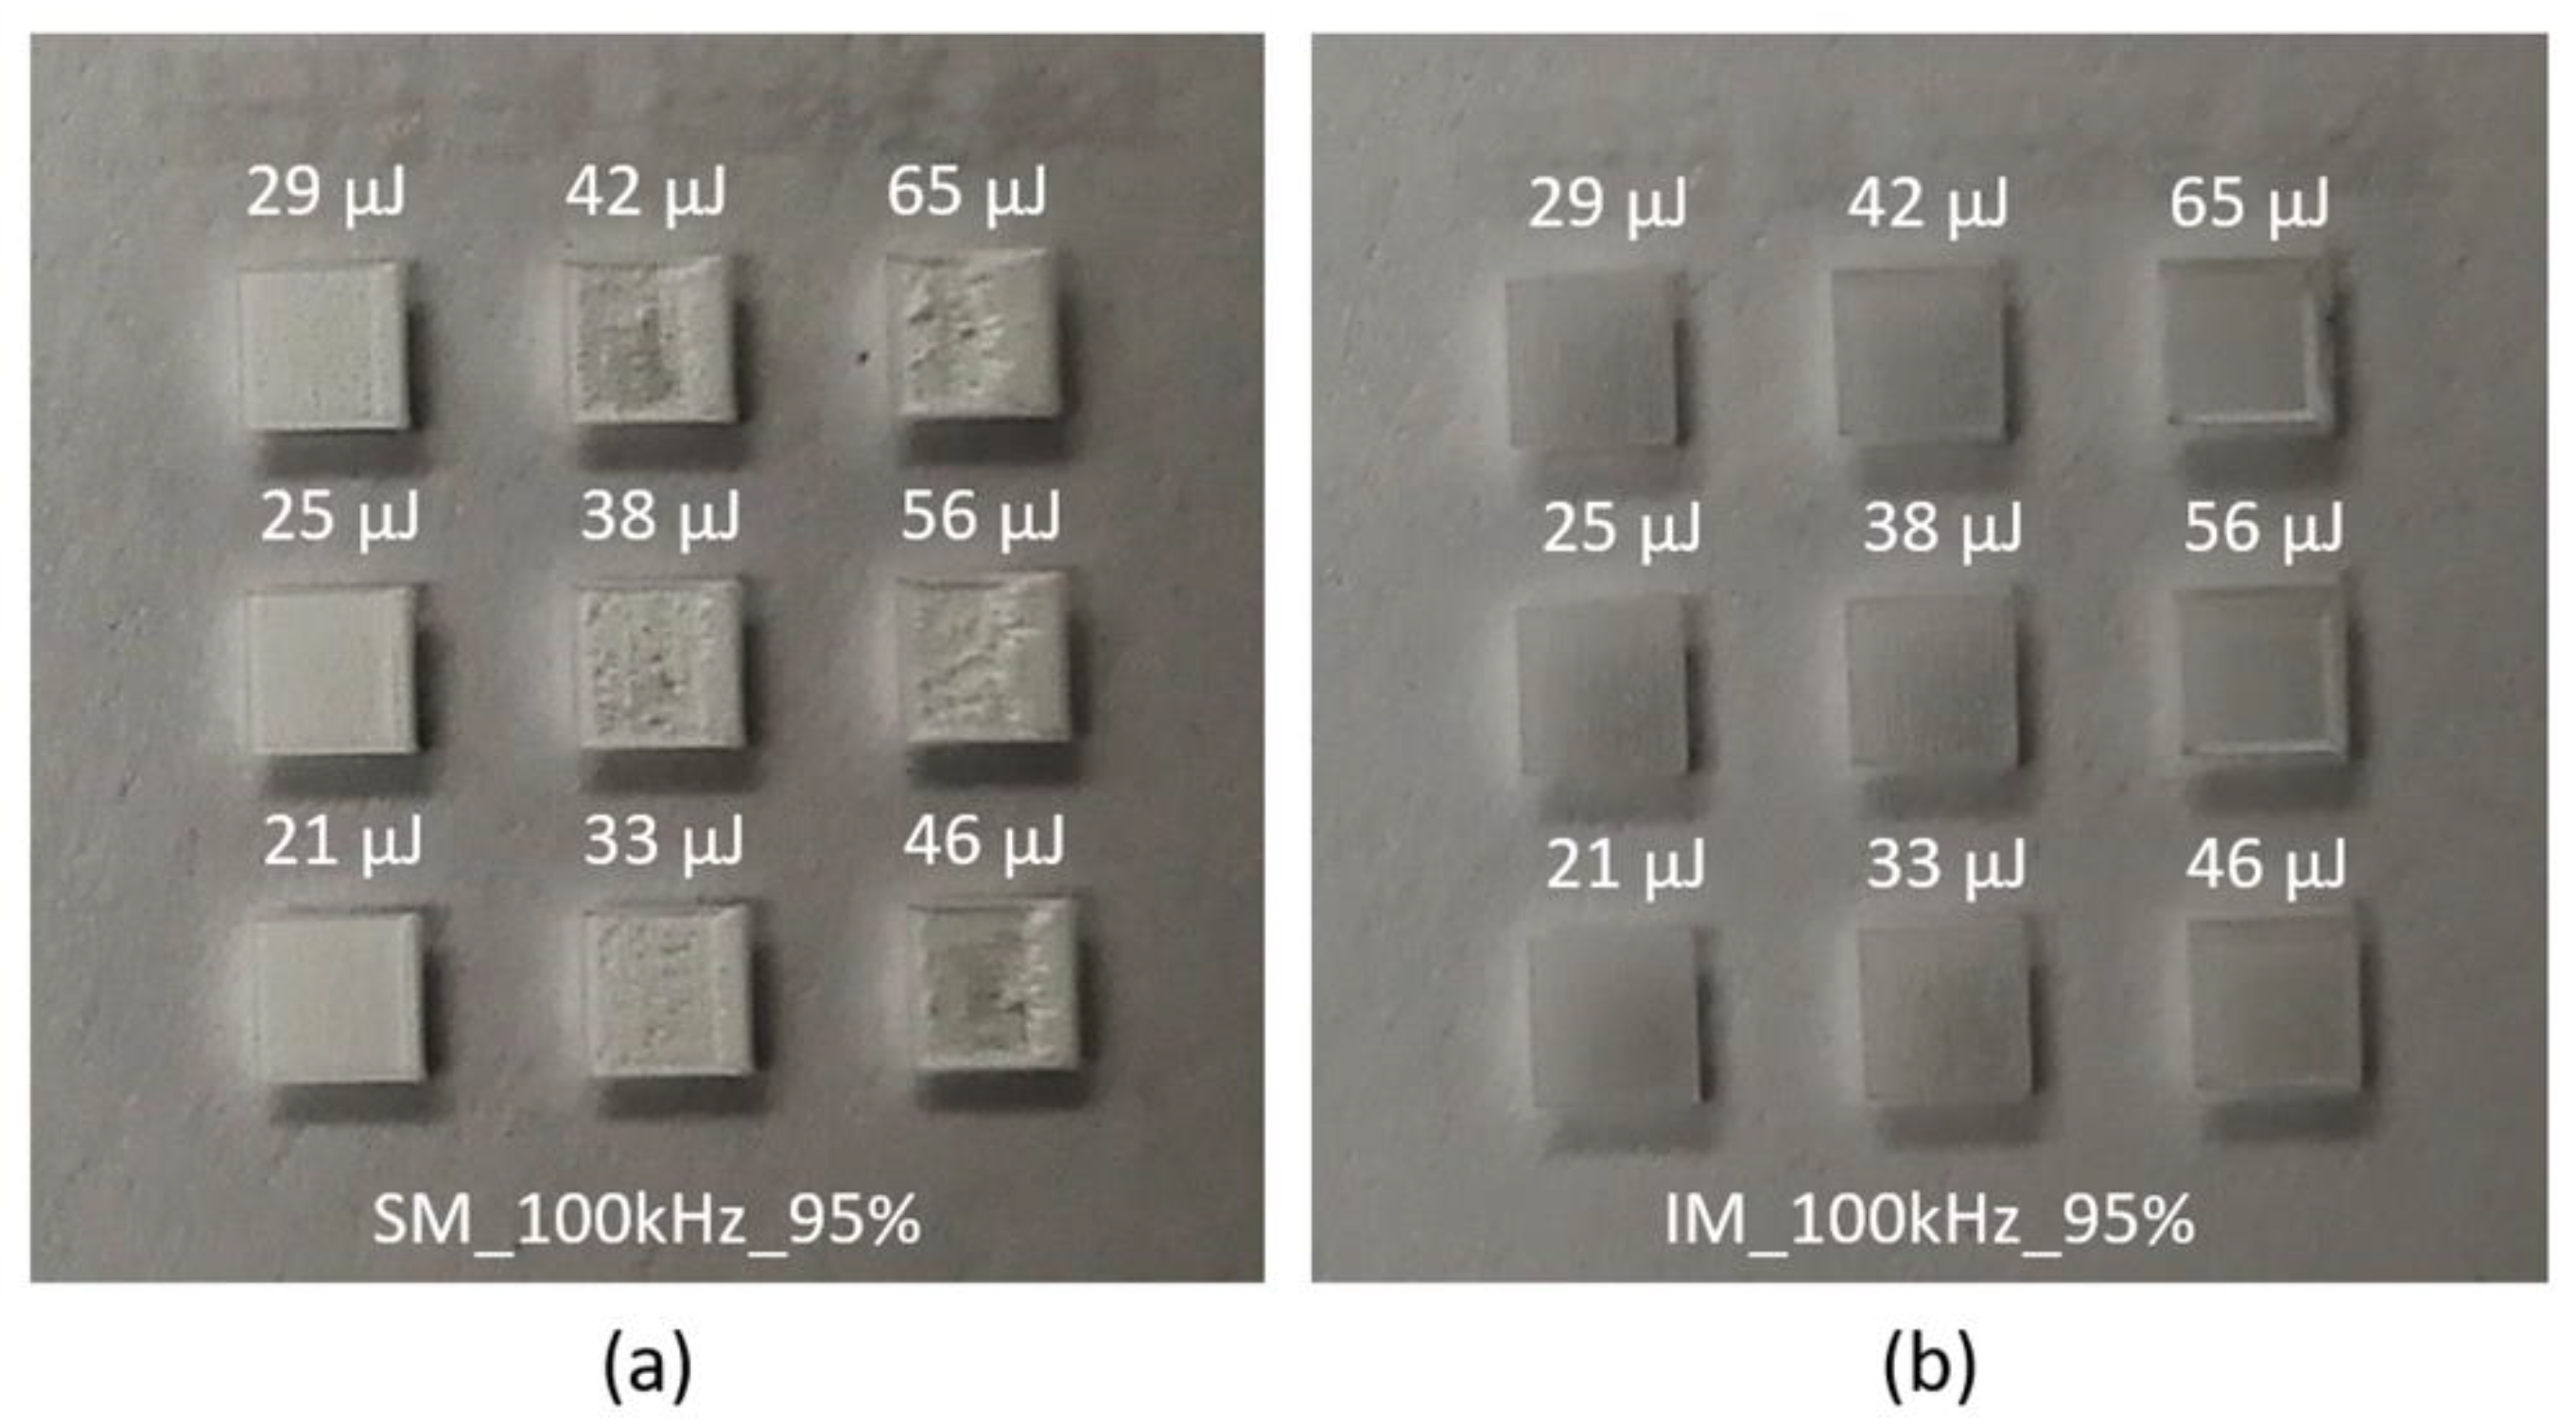
4.1. Qualitative Analysis

Laser machining parameters, such as pulse energy (EP), pulse overlap (O), pulse repetition frequency (PRF), and the laser beam scanning strategy, were observed to have significant influence on the ablation depth (D) and the root-mean-square surface roughness (Sq) of the machined areas, as can be seen in Figure 2. The multiple pulse ablation threshold for Borofloat® 33 glass was found to be EP ≈ 21 µJ, which corresponds to a laser fluence (F) of 9.3 ± 0.7 J/cm2.
For O = 75%, the test areas were only partially machined; hence, they were not analyzed any further. Meanwhile, the test areas generated with O = 95% were observed to have significant surface irregularities along the hatch direction, as shown in Figure 2b. The only exceptions were the surfaces generated using IM with PRF = 20 kHz. These areas had a regular texture containing parallel grooves whose spatial periodicity was approximately 24 μm (as measured by analyzing the power spectra), corresponding to the interlace distance (ΔIL). In general, regularly spaced grooves are characteristic features of all areas generated using IM, independent of the pulse overlap used (see Figure 2a as the example) apart from those generated using O = 95% and PRF = 100 kHz (see Figure 2b).
Partial machining of the front surface of glass resulted from changes in the ablation threshold. Initially, when the glass is cold and optically smooth, the ablation threshold is high, so the laser beam penetrates into the material and focuses to a smaller spot on the rear surface of glass as a result of the thermal lensing effect [19]. When the laser fluence reaches the ablation threshold for cold glass, machining of the rear surface starts. However, the material absorption may also increase due to the incubation effect [20], and this can lead to the decrease of the ablation threshold, which can result in initiation of ablation at the front surface of glass, further reducing the ablation threshold and, hence, making it possible to maintain the machining of the front surface.
The test areas generated using SM were covered with a large amount of white powder, as can be seen in Figure 3a. Interestingly, this was not observed in the areas generated using IM, as shown in Figure 3b. The white powder, in general, consisted of glass particles (debris) that were generated during the laser process, and it was more apparent in the areas machined with the PRF of 100 kHz. Following the cleaning process (described in Section 3.3), some machined areas were still contaminated, in particular the corners.
Even with further cleaning, it was not possible to completely remove the white powder, which suggests that some of the glass debris fused to the glass surface during the machining process. Finally, it should be noted that the areas generated with scan speeds (v) >100 mm/s consisted of small surface defects at the edges, as pointed out in Figure 2a. These resulted from a lack of proper synchronization between the laser and the galvo-scanning system; hence, they were not included in the calculation of D and Sq values.

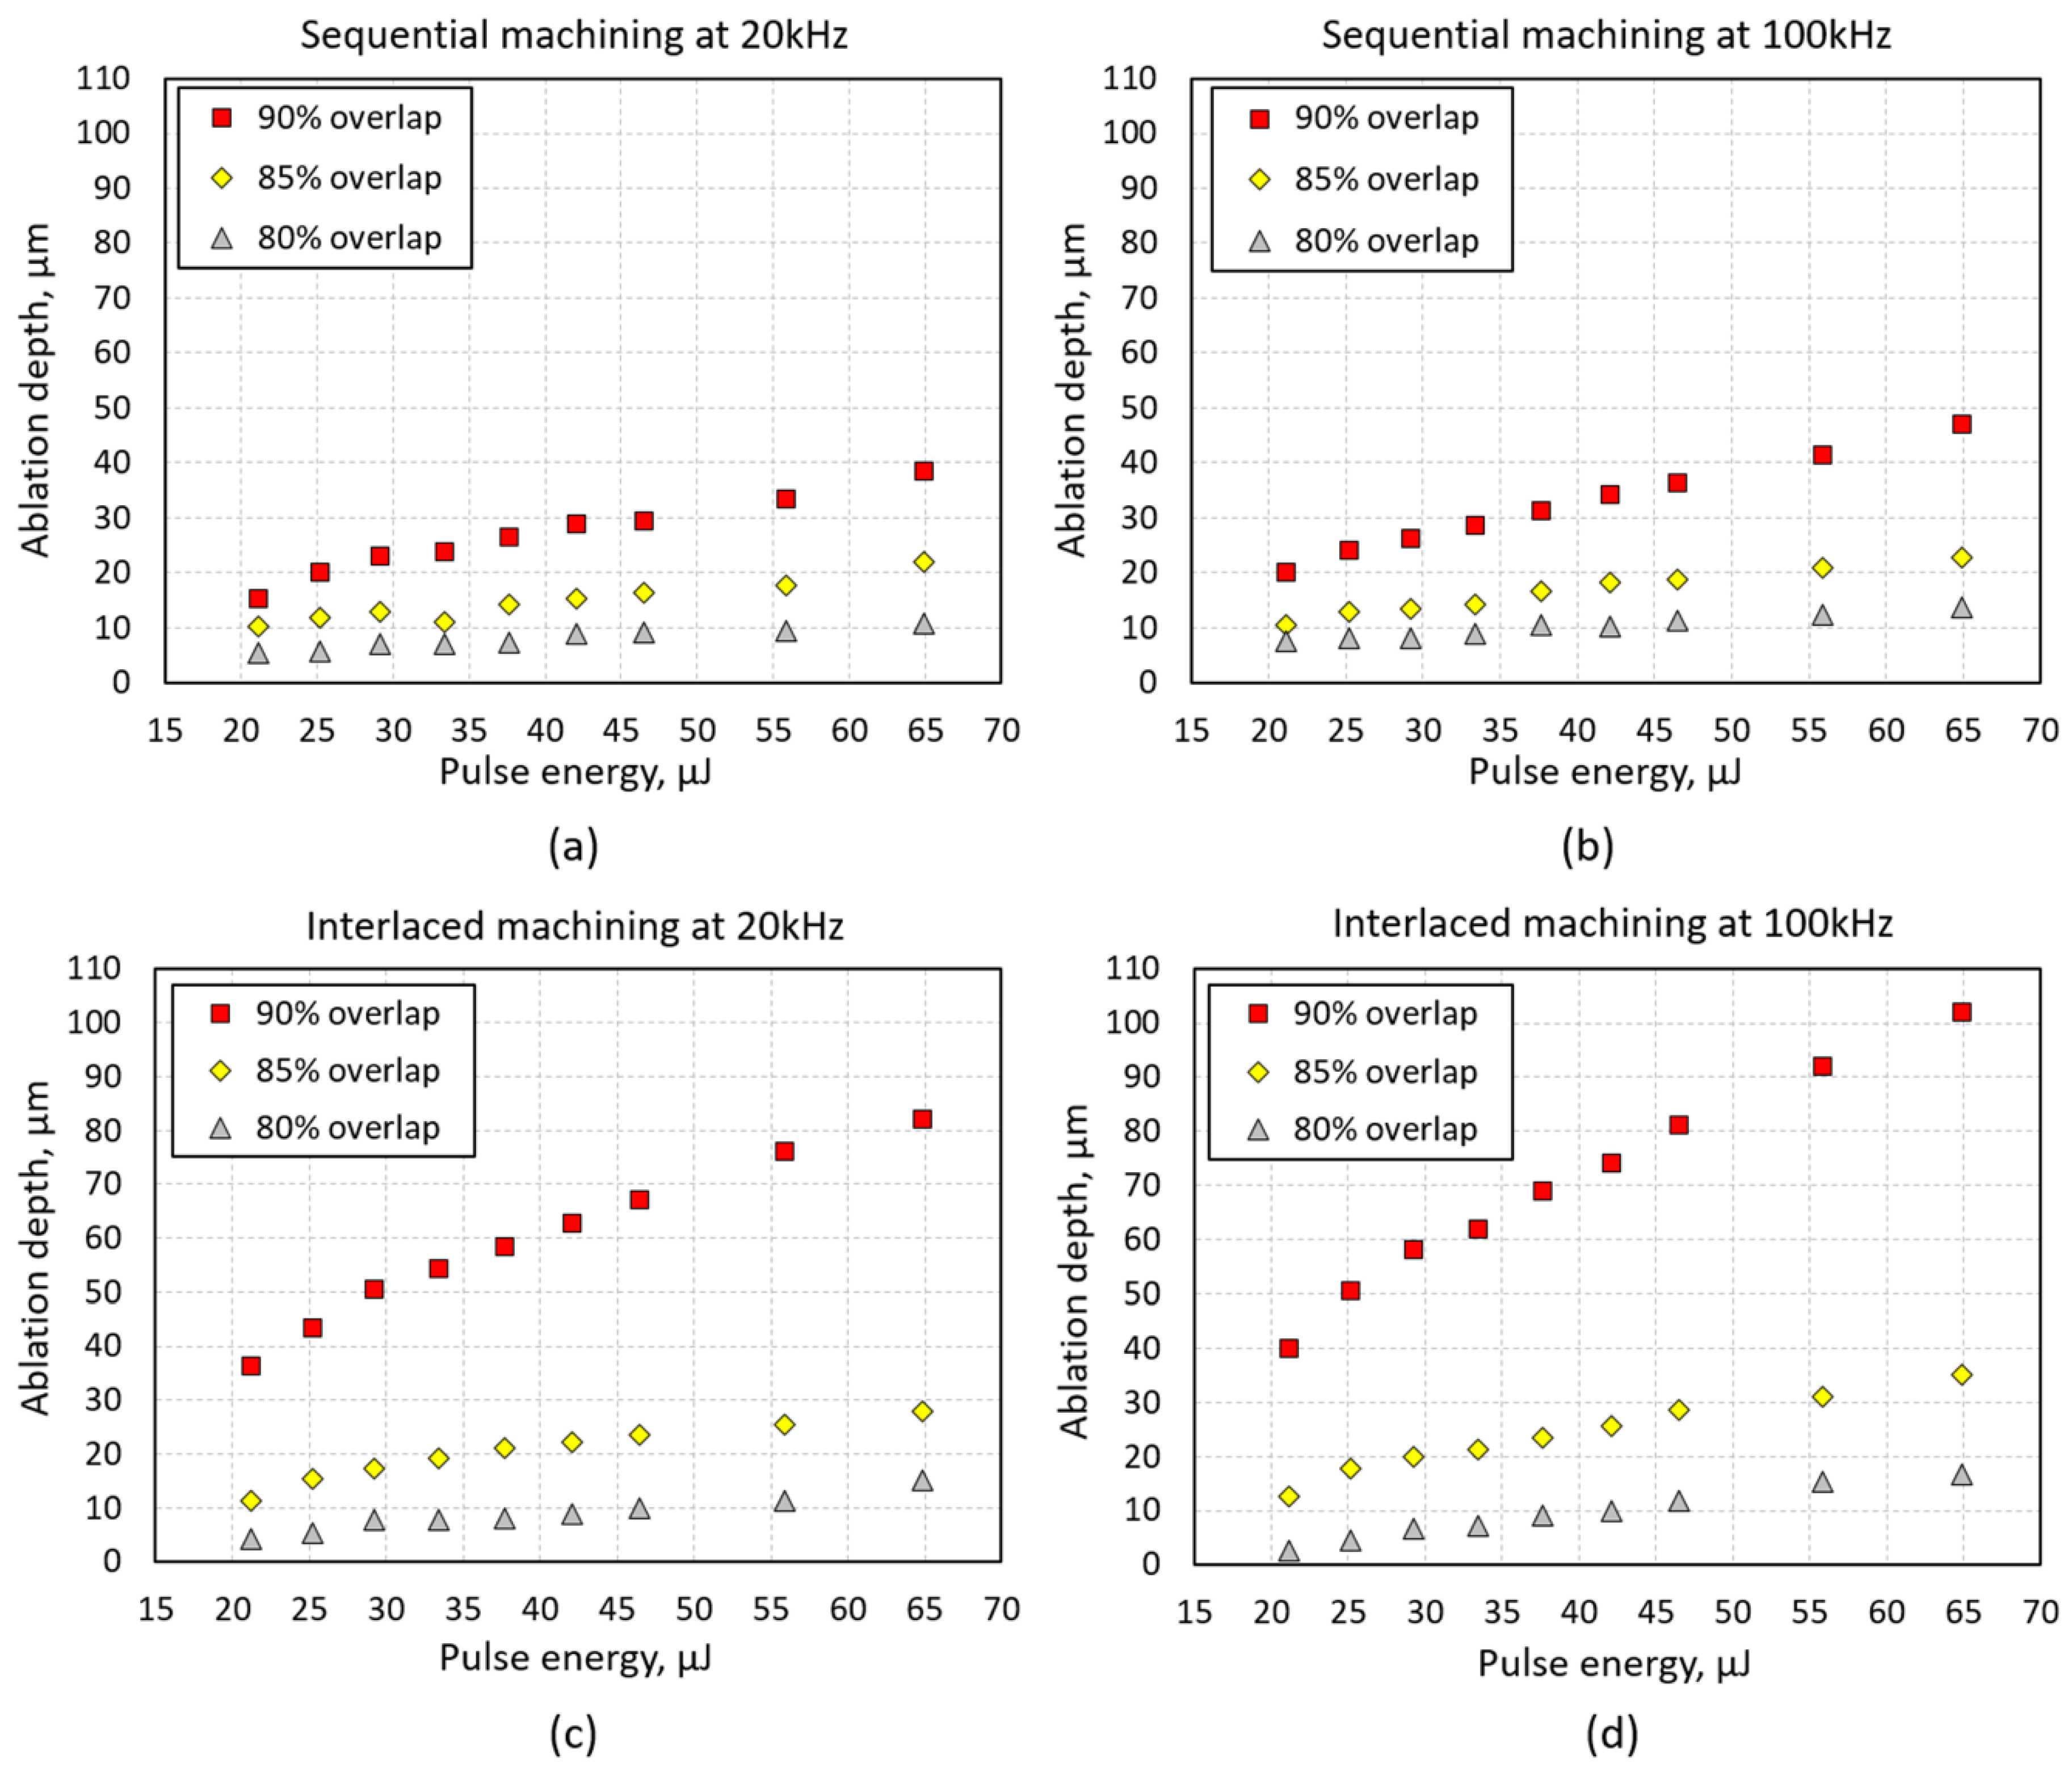
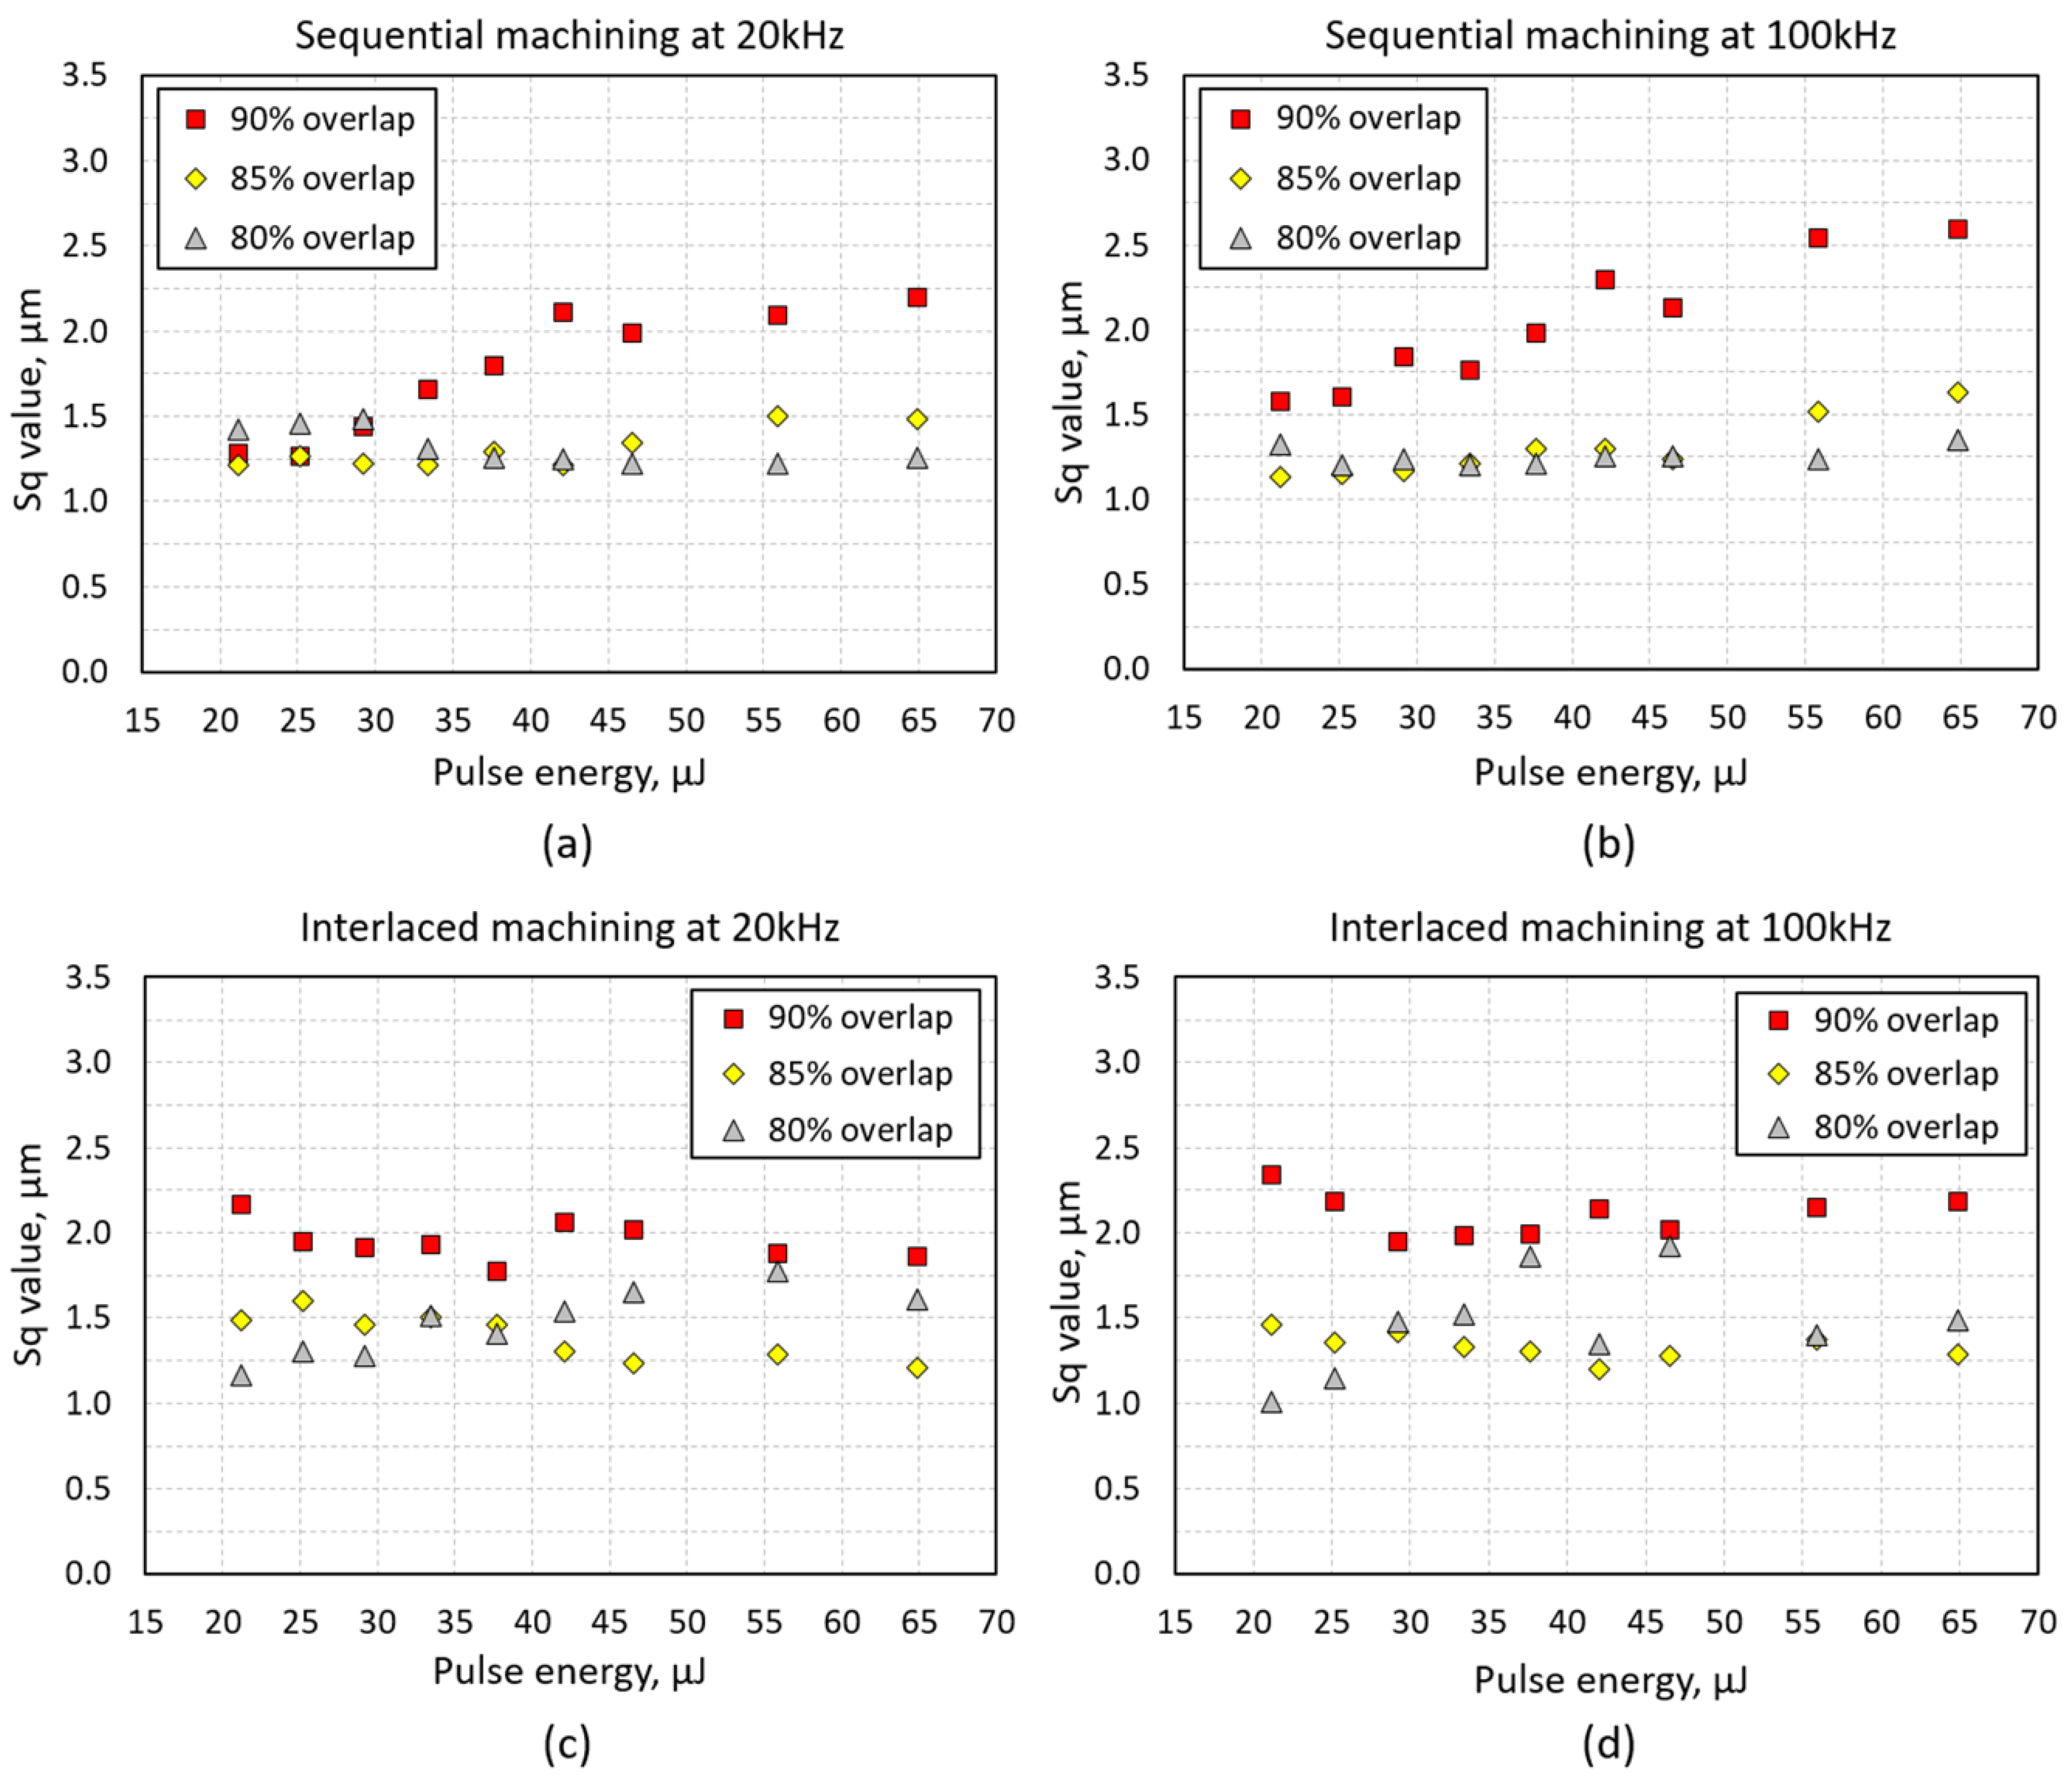
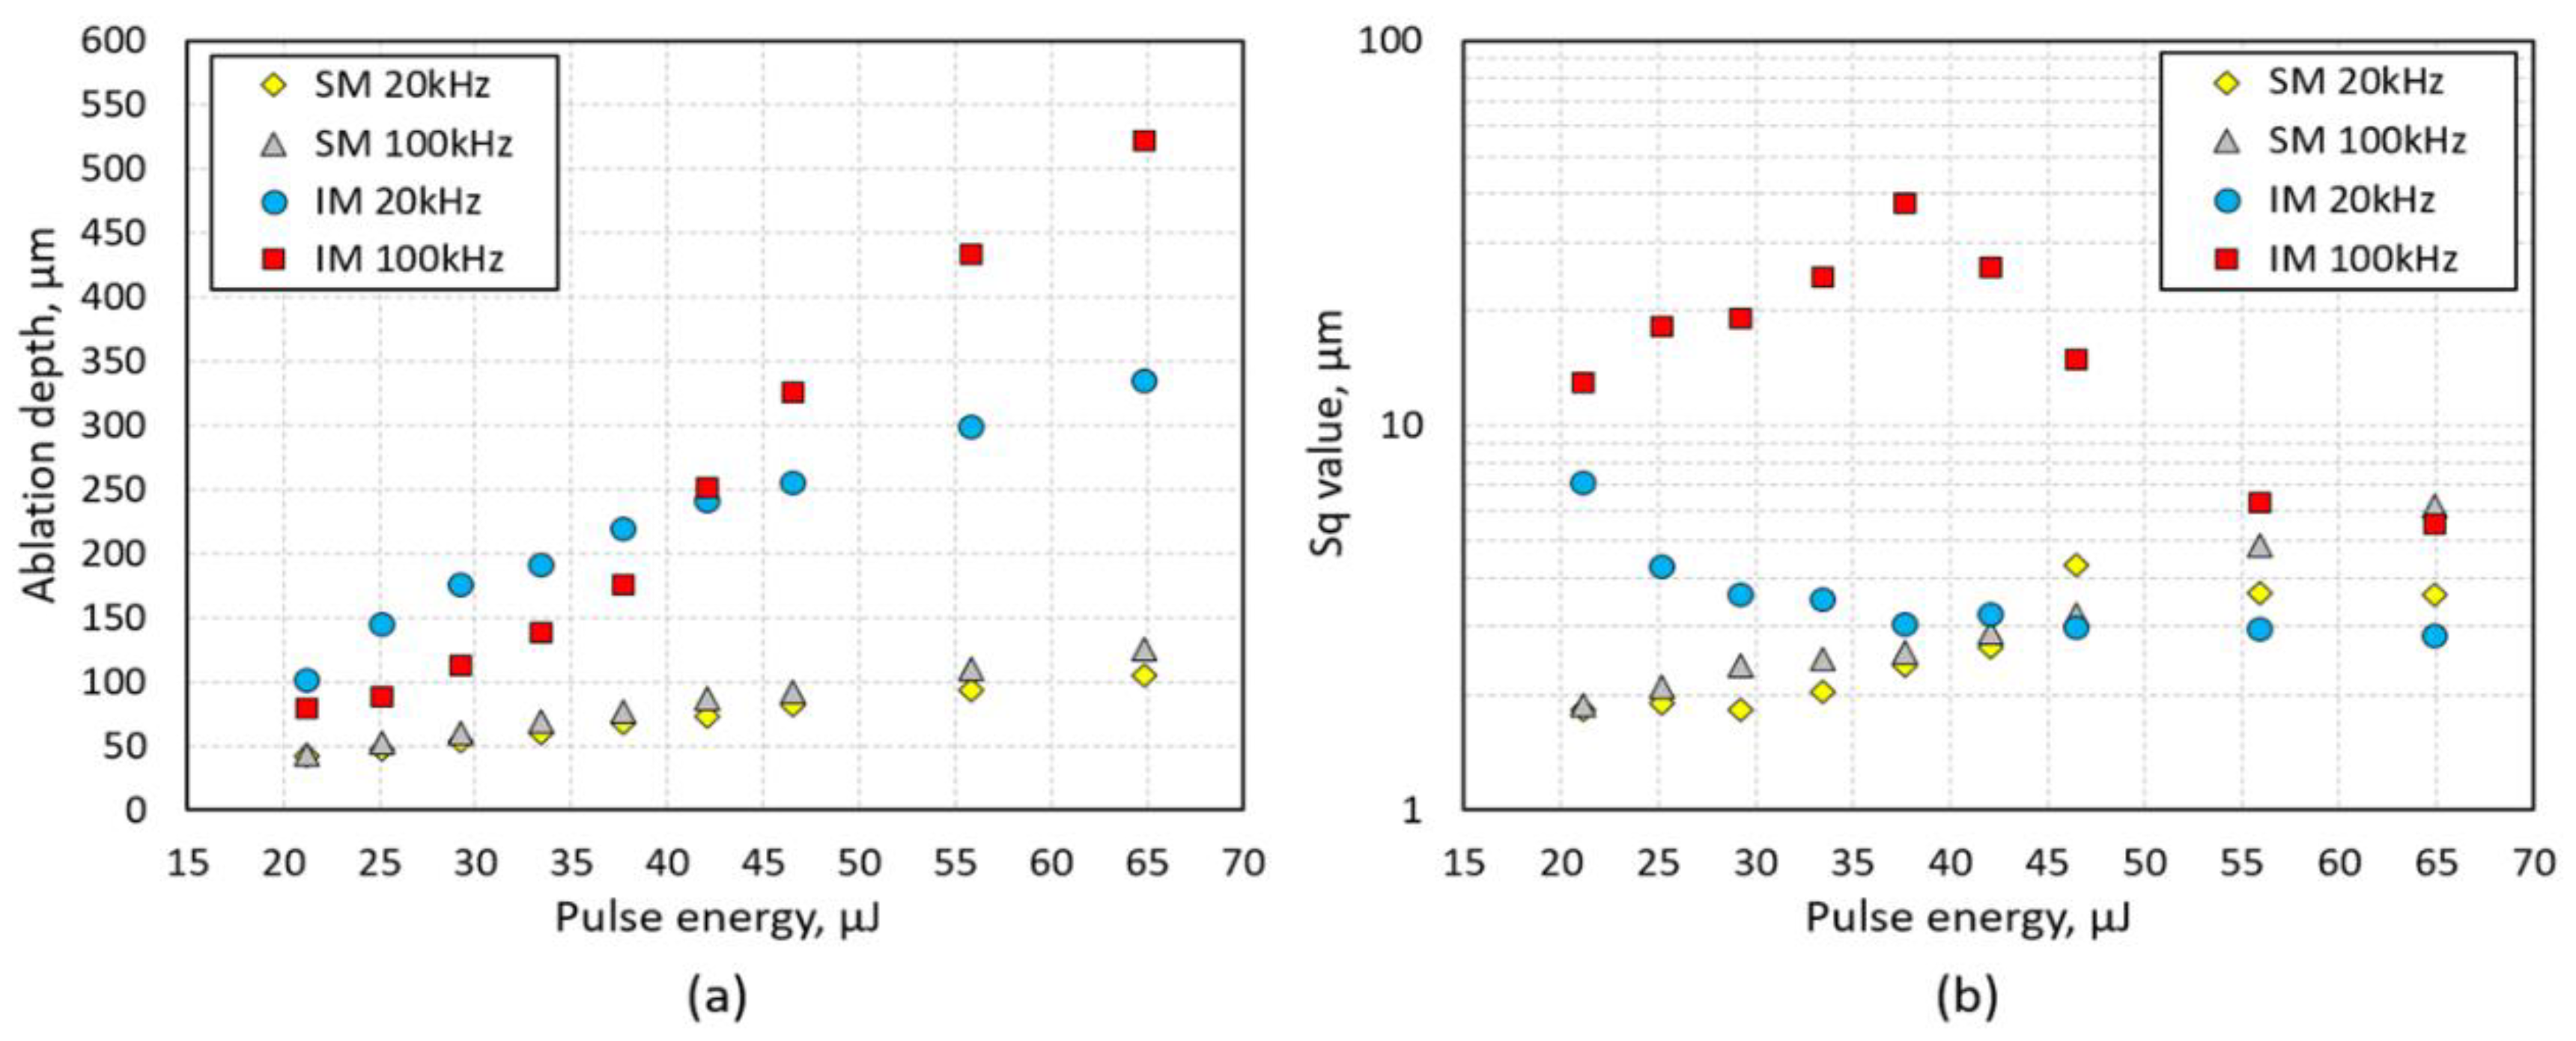
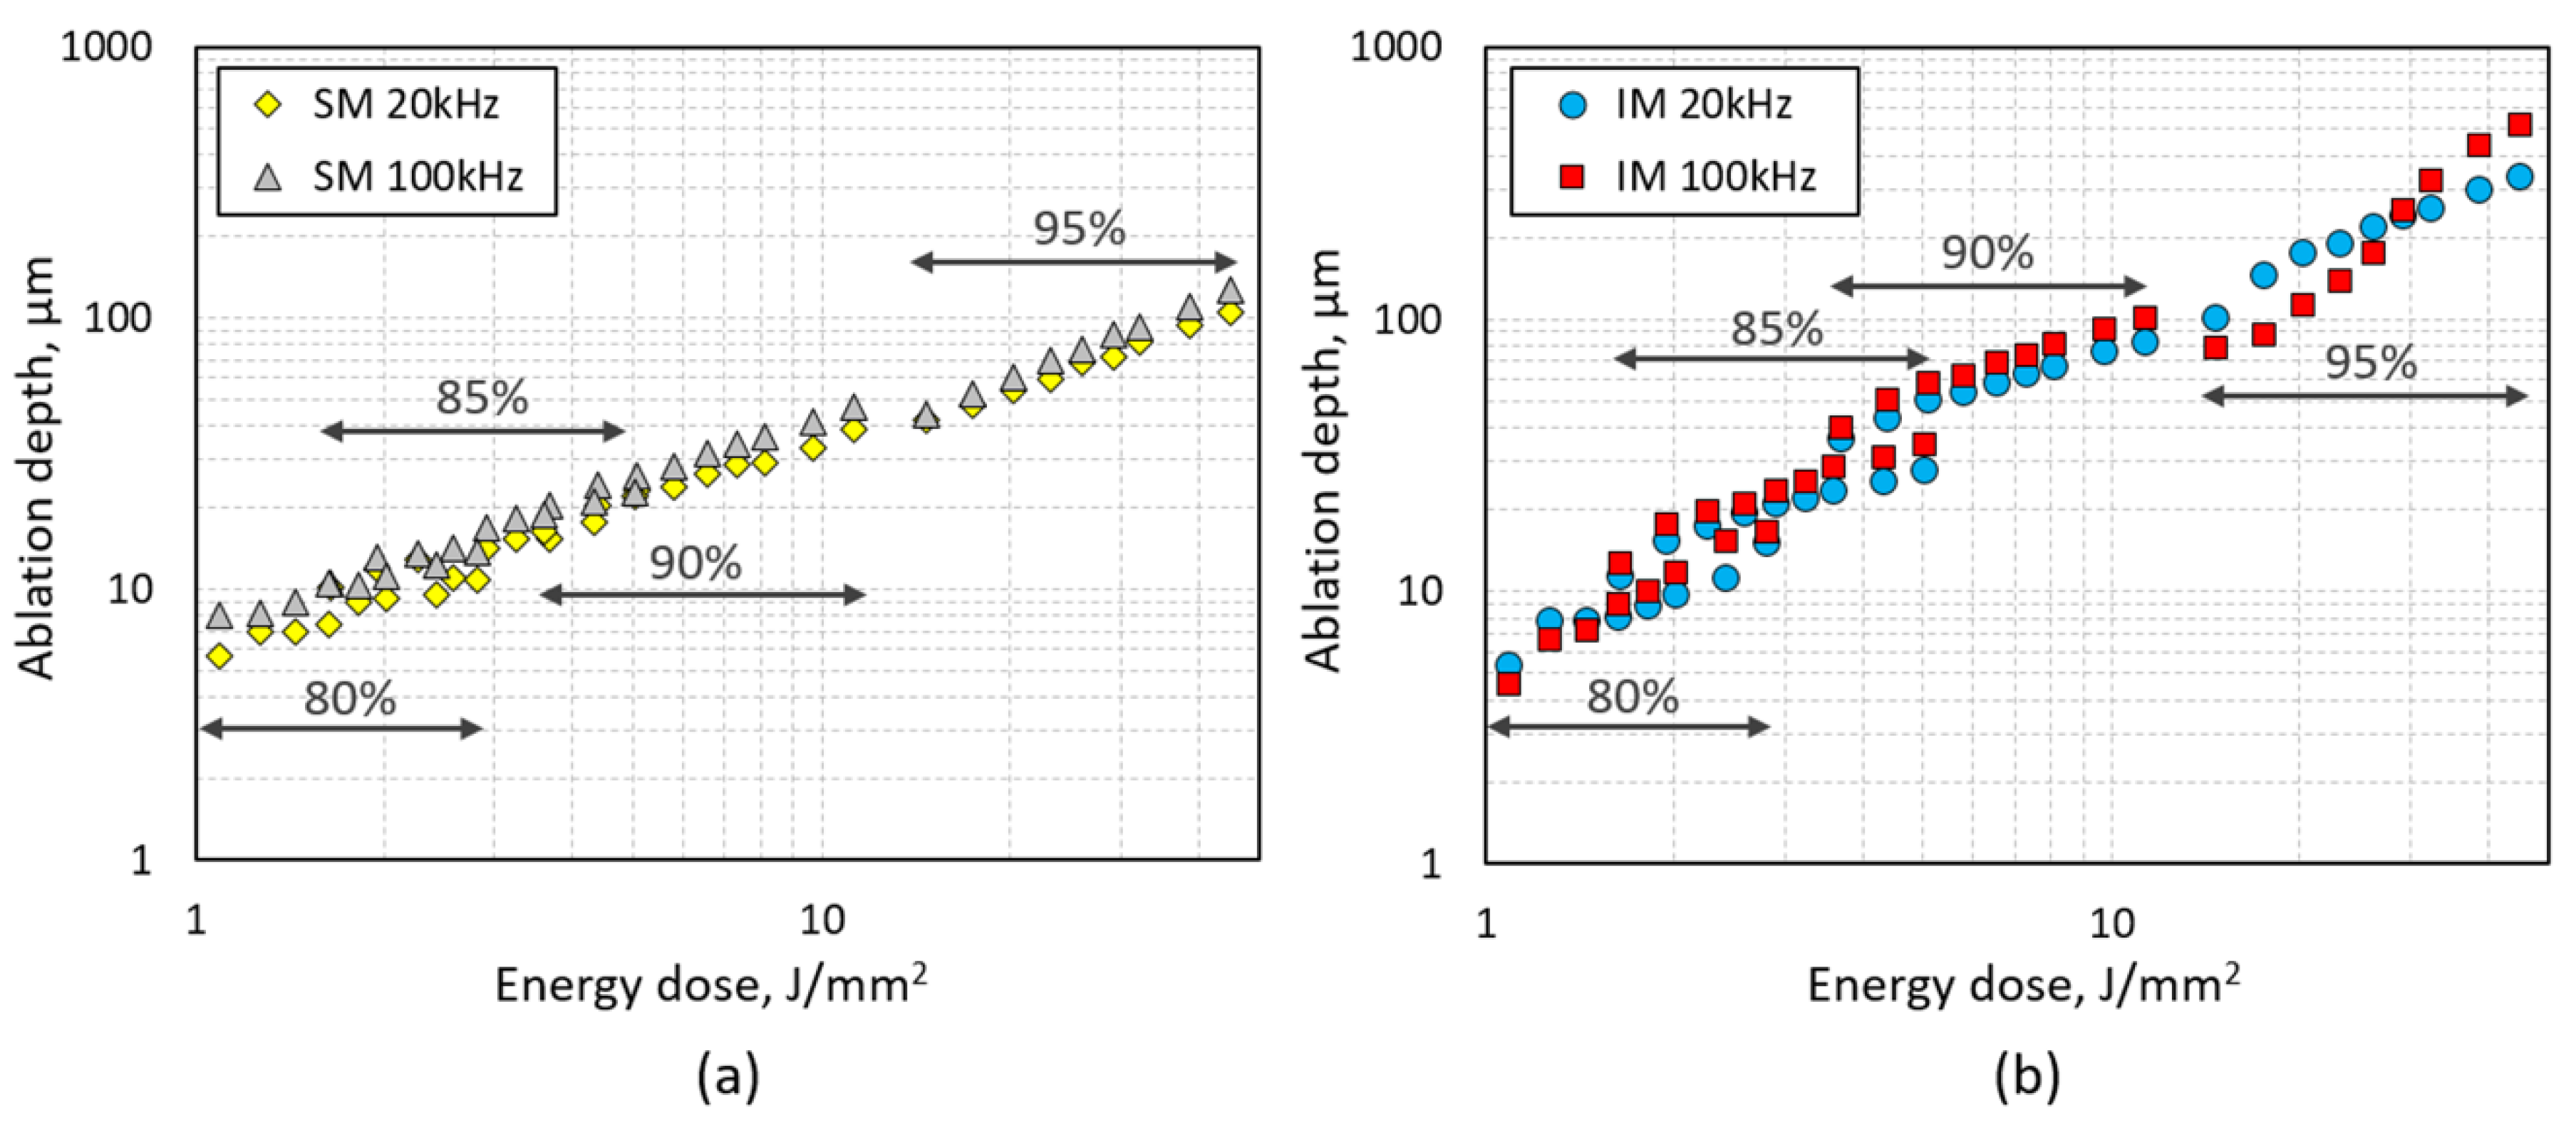
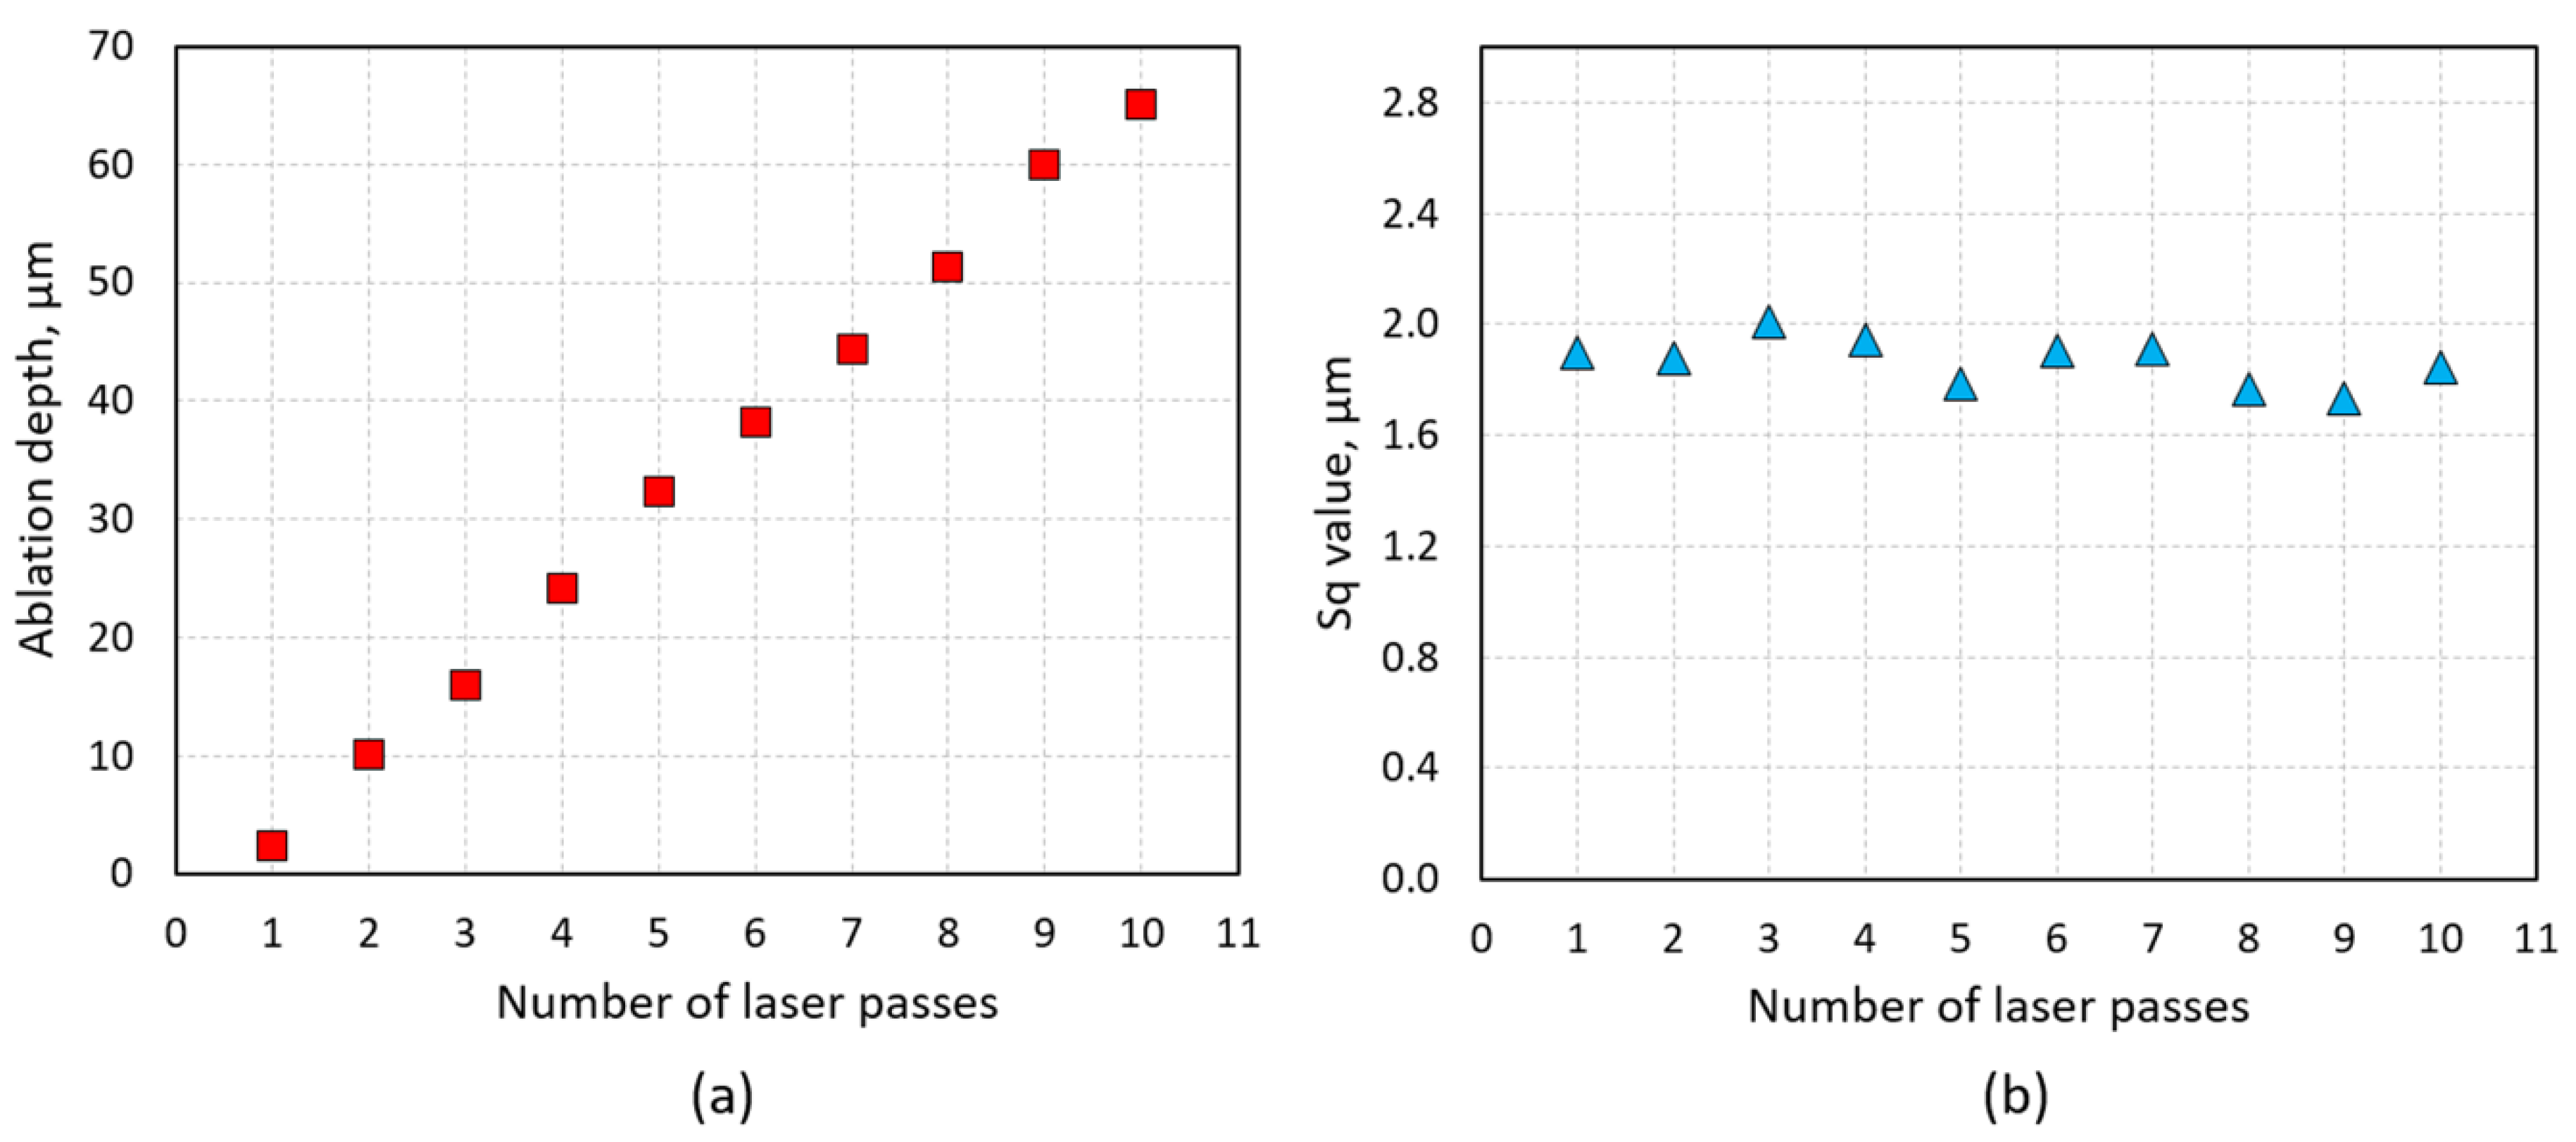
4.2. Ablation Depth and Surface Roughness

In this section, the machining results obtained with O = 80%, 85%, and 90% are presented together, whereas the results obtained with O = 95% are presented separately because this pulse overlap led to a different machining outcome.
Figure 4 shows that the ablation depth of the laser-machined areas in all cases increased with EP and O. For the O values in the range of 80% to 90%, the ablation depth increased almost in a linear manner when EP > 30 µJ, i.e., when the EP value was at least 40% above the ablation threshold. Figure 4 also shows that the laser machining of glass with PRF = 100 kHz led to greater ablation depths. This can be seen by comparing Figure 4a,c with Figure 4b,d. Although the difference between the ablation depths was not so great for SM, this difference was pronounced for the IM results. For EP = 65 µJ and O = 90%, the interlaced scanning with PRF = 100 kHz led to the generation of areas deeper even by 25% in comparison to the areas generated with PRF = 20 kHz.
Even more interesting conclusions could be drawn by directly comparing the ablation depths obtained with two different scanning strategies using the same PRF. By comparing Figure 4a,b with Figure 4c,d, it can be seen that the machining depth using IM could be up to twice as deep as in the areas generated using SM for the same values of EP (and tM). This clearly demonstrates that the choice of an appropriate scanning method is an important factor that has significant impact on the ablation depth and, thus, on the machining throughput.
Laser machining of the glass samples with O ≤ 90% resulted in areas with a surface roughness (Sq) in the range of 1 µm to 2.5 µm. In general, higher overlaps led to higher Sq values, as can be seen in Figure 5. Interestingly, however, the Sq of the areas generated using IM was similar to that obtained using SM, despite the fact that the surfaces generated using IM were deeper and had characteristic, regularly spaced, parallel grooves, as already shown in Figure 2a. Moreover, for O = 90%, it was observed that the Sq of the areas generated using IM was almost constant for the whole range of the EP values used, while the Sq of the areas generated using SM increased with increasing EP.
Figure 6 shows the results obtained with O = 95%. As can be seen in Figure 6a, SM provided removal of quite thick layers of glass of up to 105 µm when PRF = 20 kHz, and of up to 125 µm when PRF = 100 kHz. The Sq value of the areas generated using this scanning method was within the range of 1.8 µm to 6.2 µm, as shown in Figure 6b.
With O = 95%, however, significantly more aggressive machining was achieved using IM. Figure 6a shows that the areas generated in this way were at least twice as deep as those generated using SM. With PRF = 20 kHz it was possible to machine areas as deep as 335 µm, whilst, with PRF = 100 kHz, depths of up to 520 µm were obtained for the same total energy deposited. The Sq of the areas generated using SM was observed to be dependent on the values of PRF and EP, as can be seen in Figure 6b. The Sq values achieved with PRF = 20 kHz were within the range of 3–7 µm, whereas the Sq values achieved with PRF = 100 kHz were in a broader range of 5.5–38 µm. Interestingly, in IM, the lowest Sq values were obtained with higher pulse energies (EP > 50 µJ). The lowering of surface roughness may be associated with a higher recoil pressure that is capable of ejecting glass particles over longer distances. This, in turn, perhaps prevents the glass particles from redepositing on, and fusing to the hot surface of glass.
In general, it was observed that the ablation depth of the machined areas was directly proportional to a parameter called the energy dose (EDOSE), as can be seen in Figure 7. The energy dose simply defines the total laser energy delivered to a 1-mm2 area, and it can be calculated using the following equation:
EDOSE = N × EP,
where N is the total number of laser pulses delivered to a 1-mm2 area. The N values for different values of O are listed in Table 1.
In the case of SM, the ablation depth increased almost linearly with increasing EDOSE, as can be seen in Figure 7a. This increase was very similar for both values of PRF (20 kHz and 100 kHz) and constant for all values of the pulse overlap. IM, meanwhile, led to slightly different results, as shown in Figure 7b. Although the ablation depth increased with increasing EDOSE, this increase did not follow the same overall linear trend. The linear increase was only seen locally, i.e., for individual values of O ≤ 90%. In the case of O = 95%, the ablation depth increased in a non-linear manner.

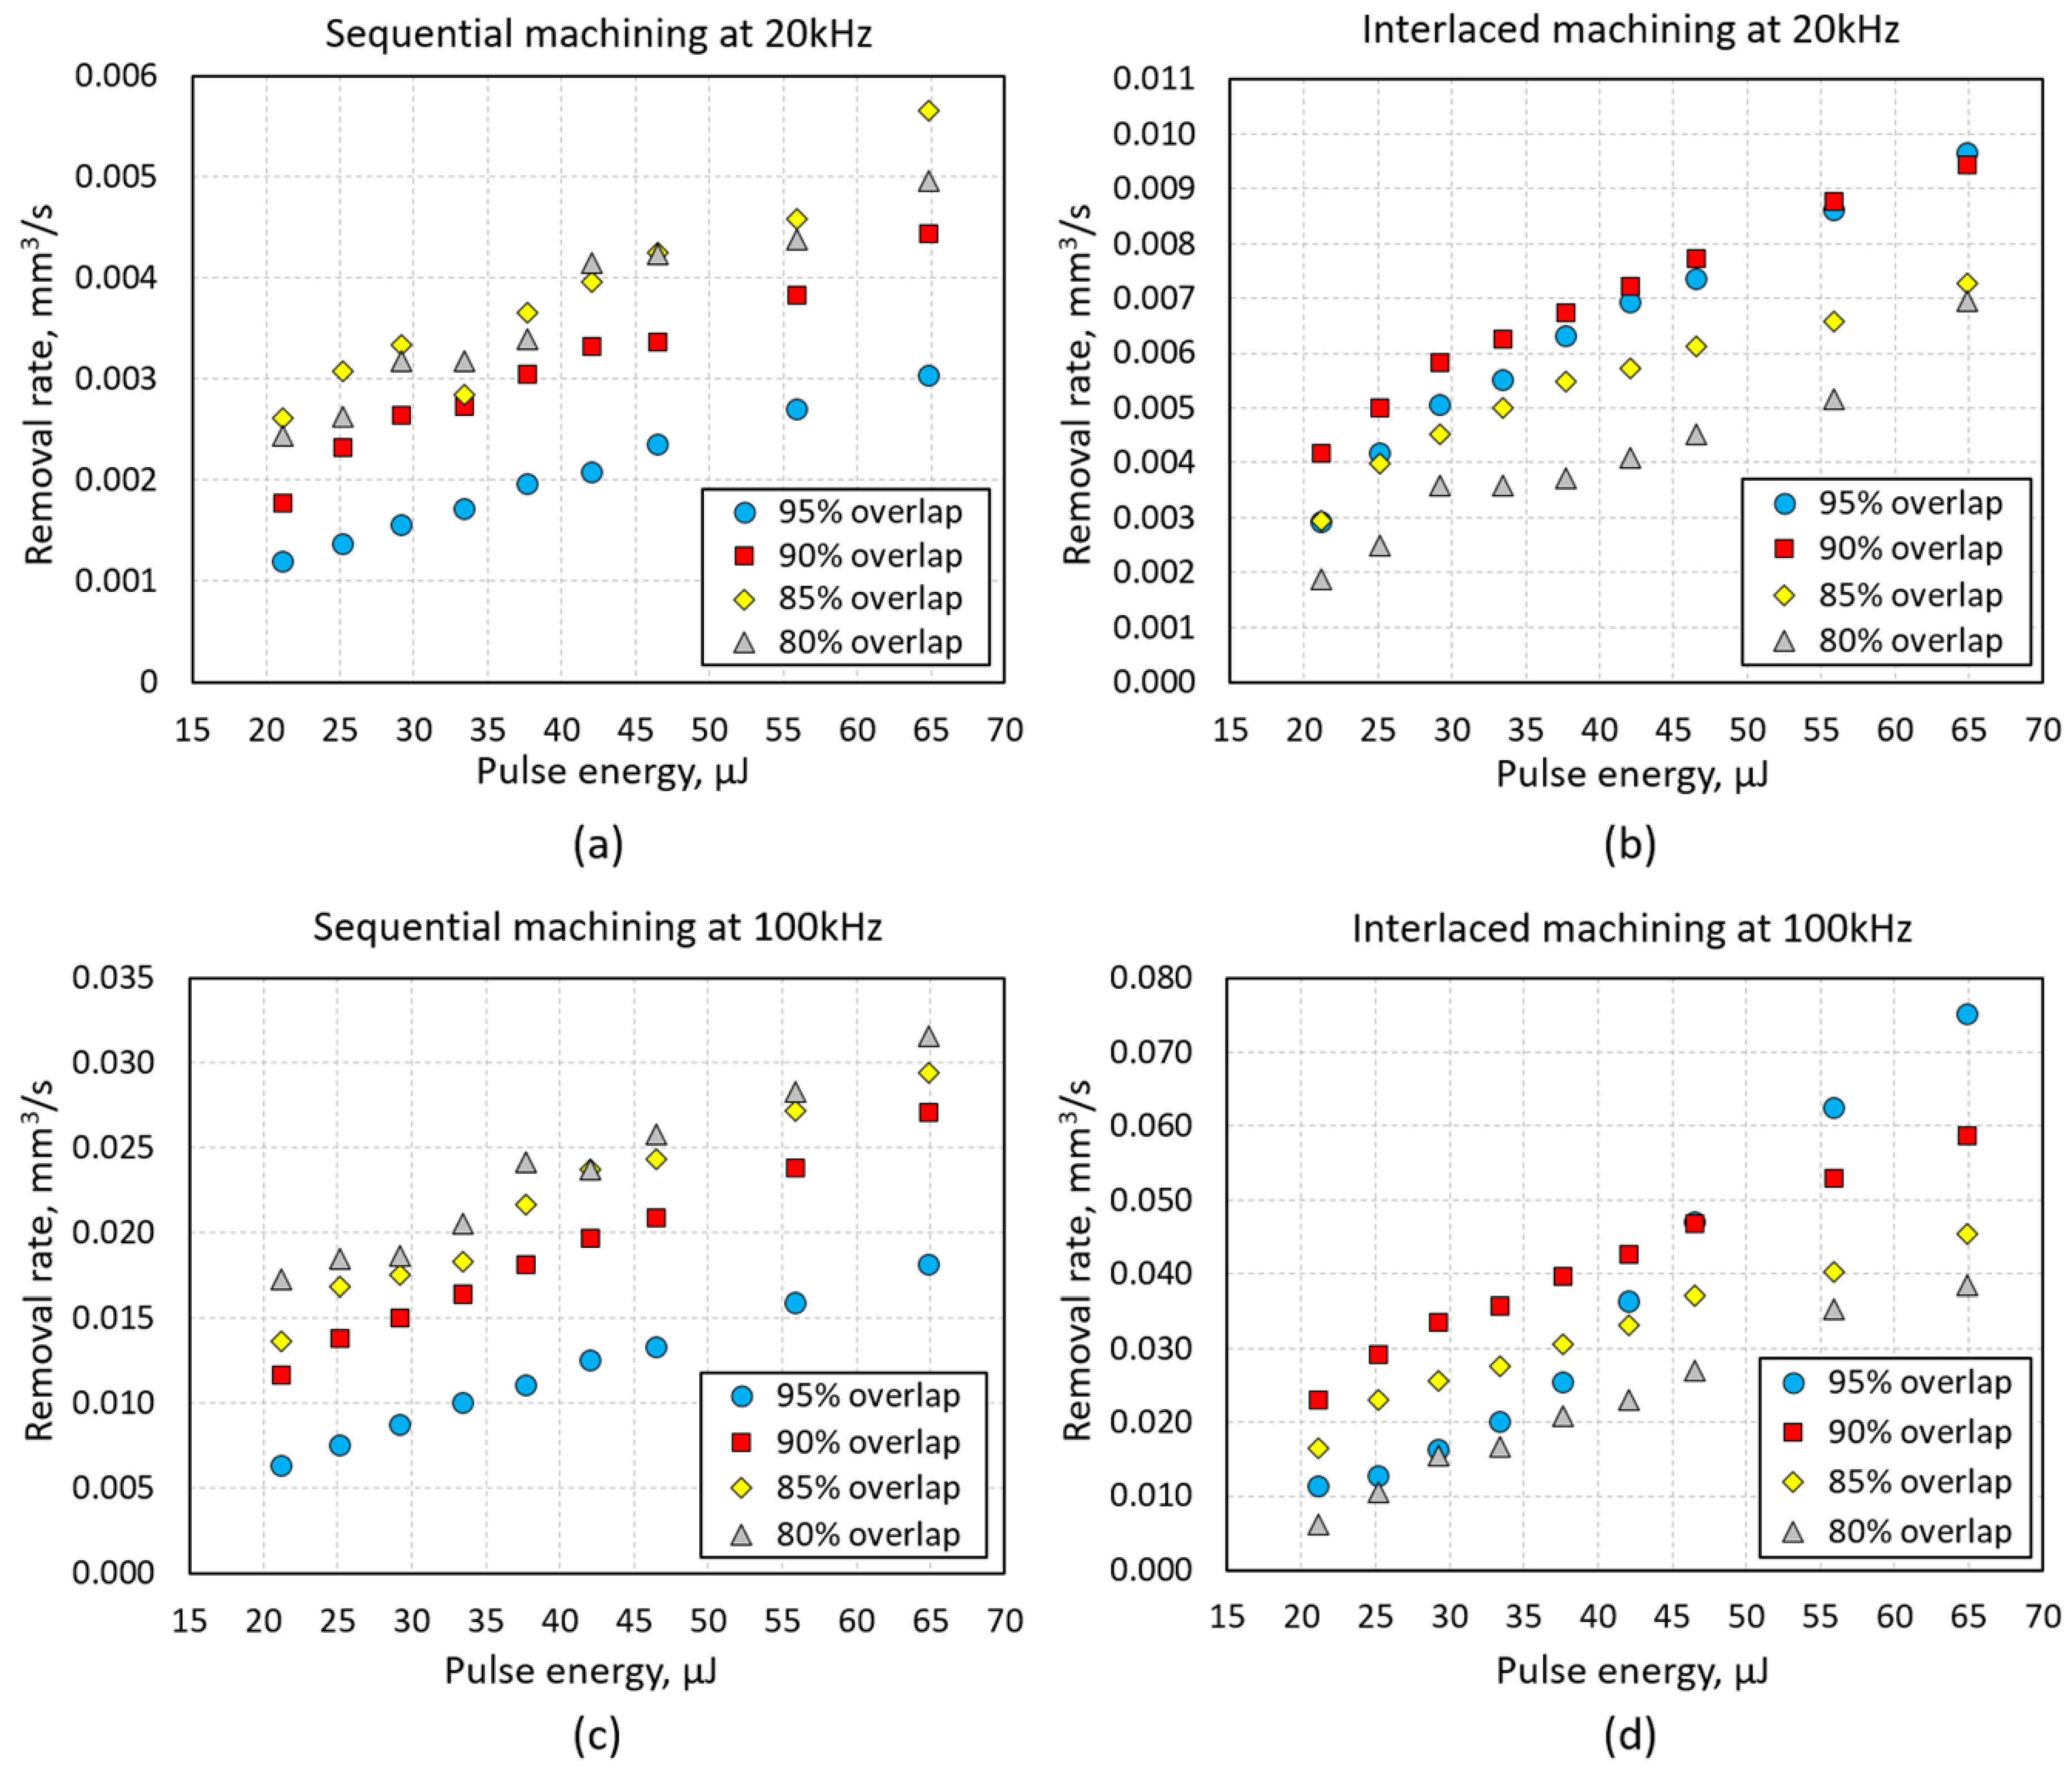
4.3. Removal Rate Analysis

The material removal rate was calculated for different pulse overlaps, PRFs, and scanning methods, by dividing the ablation depth (D) by the machining time (tM), and the values are listed in Table 1. By comparing the results presented in Figure 8a,c with the results shown in Figure 8b,d, it can be noted that the removal rate was higher for IM, in particular for high values of pulse overlap (O ≥ 90%) and energy (EP > 50 μJ), where it could be twice as high as with SM.
The highest removal rates were obtained using IM with PRF = 100 kHz. For O = 90%, where Sq < 2.5 μm (see Figure 5d), the removal rate was between 0.02 and 0.06 mm3/s (see Figure 8d). For the higher pulse overlap (O = 95%) and EP > 46.5 μJ, material was removed at an even higher rate, e.g., 0.075 mm3/s for EP = 65 μJ, which was 13 times the maximum removal rate obtained using SM with PRF = 20 kHz. Unfortunately, such a high pulse overlap led to the generation of very high surface roughness, as shown in Section 4.2, which may be an issue in some applications. Interestingly, the highest material removal rates in SM were obtained when the pulse overlap was either 80% or 85%. Higher pulse overlaps resulted in the trapping of the white powder within the laser-machined areas, as shown in Figure 3a. This powder partially shields the substrate from the incoming laser pulses, scatters the laser beam and, hence, reduces the machining efficiency.

4.4. Simplified Model of IM

To illustrate the difference in laser machining for IM compared with SM, we performed simple numerical simulations in which the cross-section of individual grooves generated by the laser beam at different locations was represented by a Gaussian function (see the dotted profiles in Figure 9). In the simulations, we assumed that the width of the grooves (defined at 1/e2 of its peak value) was equal to the laser spot diameter (2ω) and the cross-section of the resulting surface was the sum of all groove profiles.
Figure 9 illustrates the cross-section of areas generated at various stages of processing. In the case of SM, a constant depth was obtained after several laser scans, when the lateral translation of the laser beam was ≥2ω relative to its starting position. In the case of IM, in contrast, the depth of the machined area increased gradually, i.e., the material was removed layer by layer, following each complete pass of the laser beam. This simple model indicates that both laser beam scanning methods should remove the same volume of material provided that the total number of laser scans in both scanning methods is the same; however, this was not observed experimentally. More importantly, the model demonstrates that the surface topology generated by IM should undergo significant changes between laser passes. Hence, we performed a simple experiment in which the interlaced laser machining was interrupted between subsequent laser passes and the topography of the machined areas was analyzed using the Alicona surface profilometer. In this way, the ablation depth and surface roughness (Sq) were measured and compared with the simulation results. The experiment was performed only for one set of laser machining parameters (i.e., EP = 46.5 µJ, PRF = 20 kHz, O = 90%, and ΔIL = 24 µm), which corresponds roughly to the midpoint on the graphs of Figure 7. The results of this experiment are presented in Figure 10.
Figure 10a shows that the first laser pass removed a relatively thin layer of glass (less than 3 µm), whereas the subsequent laser passes removed a thicker layer of the material (approximately 7 µm in each pass). This observation is consistent with the simulation results shown in Figure 9, except the result for the first laser pass. The lower ablation depth in the first laser pass most likely results from the fact that the laser beam hits an optically smooth and cold surface. In the next passes, the laser beam hits a rough surface that is optically scattering, and hence it is more strongly absorbed.
The Alicona results also showed that the interlaced machined areas contained a characteristic texture consisting of parallel grooves whose periodicity corresponded to the value of ΔIL. In contrast to our predictions shown in Figure 9, however, the peak-to-valley of these grooves was almost constant and the Sq values ranged between 1.7 and 2.0 µm, as can be seen in Figure 10b. This discrepancy between the experimental results and the simulation results most likely occurred because of the real shape of the grooves, which were rough and contained burrs and glass debris around the machined area. Moreover, each laser pass generated a groove of a slightly different shape, which means that the resultant surface of the machined area was more random and less predictable than in the simulations.
Finally, it should be noted by analyzing the illustrations from Figure 9 that the angle of incidence of the laser beam in IM is normally smaller than the incidence angle in SM. In the case of SM, the laser beam is constantly incident on a steep wall, whilst in the case of IM, the laser beam is incident on a corrugated surface whose slope is rather gentle because the material is removed layer by layer. The smaller angles of incidence of the laser beam in IM suggest that the glass has a relatively low reflectivity, as can be found by solving the well-known Fresnel equations for the air–glass interface (for equations, see, e.g., Reference [21]), and this may lead to better coupling efficiency of the laser beam with the material and, consequently, to higher ablation depths and higher material removal rates. Our experiments showed that the test areas generated using SM had walls whose steepness could be as high as 82°. For such high angles of incidence of the laser beam, the reflectivity of glass can be 20% or even higher (dependent on the laser beam polarization), which may also result in non-homogenous ablation of glass, as suggested by Machado et al. [22]. Files containing datasets used to plot graphs in Figure 4, Figure 5, Figure 6, Figure 7, Figure 8, Figure 9 and Figure 10 can be found in Supplementary Materials.

5. Conclusions

The presented experimental results provide clear evidence that the laser beam scanning strategy has a significant influence on the machining results, in particular on the material removal rate and, hence, the process throughput. Using IM, it was possible to remove twice as much material as with SM in the same time. The increased ablation depths and removal rates with IM result from the fact that glass is removed layer by layer, which provides more efficient ejection of glass particles and, hence, reduced shielding of the machined area. The smaller angles of incidence of the laser beam in IM probably also increase the coupling efficiency of the laser beam with the material, which allows faster generation of deep 3D structures as compared with SM. The interlaced areas were observed to contain a characteristic texture consisting of parallel grooves whose periodicity was found to correspond to the interlace distance (ΔIL). When the pulse overlap used was ≤90%, the peak-to-valley (PV) of the grooves was less than a few µm, giving a surface roughness (Sq) of less than 2.5 µm which is comparable to the surface roughness of the areas generated using SM. A pulse overlap of >90% led to the generation of rougher but also deeper areas. In a single laser treatment, it was possible to generate areas as deep as 0.5 mm. We believe that IM opens a possibility to increase machining throughput in applications such as milling, drilling, and engraving without increasing the average laser power.

Supplementary Materials

The following are available online at https://www.mdpi.com/2504-4494/3/1/14/s1.

Author Contributions

K.L.W. performed all experiments and wrote this article; A.A.L. investigated IM for fused silica, N-BK7, S-TiH53, and N-LaF21 glass; M.M.M-V. was the principal investigator (PI) and supervised this work; P.B. provided advice with respect to the application demands; D.P.H. was the co-investigator and provided scientific and technical advice, together with access to the laser facilities.

Funding

This research received funding from the European Research Council (ERC) under the European Union’s Horizon 2020 Research and Innovation program (MILEPOST, Grant agreement No.: 695070).

Acknowledgments

The authors would like to thank the EPSRC Centre for Innovative Manufacturing in Laser-Based Production Processes (EP/K030884/1) for providing access to the laboratory space and laser facilities.

Conflicts of Interest

The authors declare no conflicts of interest.

References

  1. Dahotre, N.B.; Harimkar, S.P. Manufacturing processes: An overview. In Laser Fabrication and Machining of Materials; Springer Science & Business Media: New York, NY, USA, 2008; pp. 69–96. [Google Scholar]
  2. Shirk, M.D.; Molian, P.A. A review of ultrashort pulsed laser ablation of materials. J. Laser Appl. 1998, 10, 18–28. [Google Scholar] [CrossRef]
  3. Mishra, S.; Yadava, V. Laser Beam MicroMachining (LBMM)—A review. Opt. Laser Eng. 2015, 73, 89–122. [Google Scholar] [CrossRef]
  4. Malinauskas, M.; Žukauskas, A.; Hasegawa, S.; Hayasaki, Y.; Mizeikis, V.; Buividas, R.; Juodkazis, S. Ultrafast laser processing of materials: From science to industry. Light Sci. Appl. 2016, 5, e16133. [Google Scholar] [CrossRef] [PubMed]
  5. Shugaev, M.V.; Wu, C.; Armbruster, O.; Naghilou, A.; Brouwer, N.; Ivanov, D.S.; Derrien, T.J.; Bulgakova, N.M.; Kautek, W.; Rethfeld, B.; et al. V Fundamentals of ultrafast laser—Material interaction. MRS Bull. 2014, 960–968. [Google Scholar] [CrossRef]
  6. Pfeiffer, M.; Engel, A.; Weißmantel, S.; Scholze, S.; Reisse, G. Microstructuring of steel and hard metal using femtosecond laser pulses. Physci. Proc. 2011, 12, 60–66. [Google Scholar] [CrossRef]
  7. Cheng, C.-W.; Tsai, X.-Z.; Chen, J.-S. Micromachining of stainless steel with controllable ablation depth using femtosecond laser pulses. Int. J. Adv. Manuf. Technol. 2016, 85, 1947–1954. [Google Scholar] [CrossRef]
  8. Sugioka, K.; Cheng, Y. Fabrication of 3D microfluidic structures inside glass by femtosecond laser micromachining. Appl. Phys. A Mater. 2014, 114, 215–221. [Google Scholar] [CrossRef]
  9. Sugioka, K. Progress in ultrafast laser processing and future prospects. Nanophotonics 2017, 6, 393–413. [Google Scholar] [CrossRef]
  10. Thomson, R.R.; Bookey, H.T.; Psaila, N.D.; Fender, A.; Campbell, S.; MacPherson, W.N.; Barton, J.S.; Reid, D.T.; Kar, A.K. Ultrafast-laser inscription of a three dimensional fan-out device for multicore fiber coupling applications. Opt. Express 2007, 15, 11691–11697. [Google Scholar] [CrossRef] [PubMed]
  11. Thomas, J.; Voigtländer, C.; Becker, R.G.; Richter, D.; Tünnermann, A.; Nolte, S. Femtosecond pulse written fiber gratings: A new avenue to integrated fiber technology. Laser Photonics Rev. 2012, 6, 709–723. [Google Scholar] [CrossRef]
  12. Gross, S.; Withford, M.J. Ultrafast-laser-inscribed 3D integrated photonics: Challenges and emerging applications. Nanophotonics 2015, 4, 332–352. [Google Scholar] [CrossRef]
  13. Paiè, P.; Bragheri, F.; Di Carlo, D.; Osellame, R. Particle focusing by 3D inertial microfluidics. Microsyst. Nanoeng. 2017, 3, 17027. [Google Scholar] [CrossRef] [Green Version]
  14. Carter, R.M.; Chen, J.; Shephard, J.D.; Thomson, R.R.; Hand, D.P. Picosecond laser welding of similar and dissimilar materials. Appl. Opt. 2014, 53, 4233–4238. [Google Scholar] [CrossRef] [PubMed]
  15. Wlodarczyk, K.L.; Carter, R.M.; Jahanbakhsh, A.; Lopes, A.A.; Mackenzie, M.D.; Maier, R.R.J.; Hand, D.P.; Mercedes Maroto-Valer, M. Rapid laser manufacturing of microfluidic devices from glass substrates. Micromachines 2018, 9, 409. [Google Scholar] [CrossRef] [PubMed]
  16. Bulgakova, N.M.; Zhukov, V.P.; Collins, A.R.; Rostohar, D.; Derrien, T.J.Y.; Mocek, T. How to optimize ultrashort pulse laser interaction with glass surfaces in cutting regimes? Appl. Surf. Sci. 2015, 336, 364–374. [Google Scholar] [CrossRef]
  17. Lopes, A.A.; Wlodarczyk, K.L.; Blair, P.; McBride, R.; Hand, D.P. High speed unltrafast laser based machining of glass. In Proceedings of the 19th International Symposium on Laser Precision Microfabrication (LPM), Edinburgh, UK, 25–28 June 2018. [Google Scholar]
  18. Neuenschwander, B.; Jaeggi, B.; Zimmermannn, M.; Markovic, V.; Resan, B.; Weingarten, K.; de Loor, R.; Penning, L. Laser surface structuring with 100 W of average power and sub-ps pulses. J. Laser Appl. 2016, 28, 022506. [Google Scholar] [CrossRef]
  19. Domke, M.; Piredda, G.; Bernard, B.; Matylitsky, V. Cutting thin glasses with ultrafast lasers. In Proceedings of the Lasers in Manufacturing 2017, Munich, Germany, 26–29 June 2017. [Google Scholar]
  20. Ben-Yakar, A.; Byer, R.L. Femtosecond laser ablation properties of borosilicate glass. J. Appl. Phys. 2004, 96, 5316–5323. [Google Scholar] [CrossRef]
  21. Hecht, E. The propagation of light. In Optics; Pearson Education: London, UK, 2017; pp. 96–158. [Google Scholar]
  22. Machado, L.M.; Samad, R.E.; Freitas, A.Z.; Vieira, N.D.; de Rossi, W. Microchannels direct machining using the femtosecond smooth ablation method. Physics Procedia 2011, 12, 67–75. [Google Scholar] [CrossRef]
Figure 1. Illustration of different laser beam scanning methods: (a) unidirectional sequential, (b) bidirectional sequential, (c) unidirectional interlaced, (d) bidirectional interlaced type 1, and (e) bidirectional interlaced type 2. Meaning of symbols: ΔH—hatch distance; ΔS—distance between pulses in the laser beam scan direction; ΔIL—interlace distance.
Jmmp 03 00014 g001
Figure 2. Three-dimensional (3D) profiles of the surfaces generated using two different laser beam scanning methods and two different pulse repetition frequencies (PRFs). The surfaces shown in (a) were generated using EP = 65 μJ and O = 85%, whereas those shown in (b) were generated using EP = 46 μJ and O = 95%. The profiles were measured using the Alicona surface profilometer.
Jmmp 03 00014 g002
Figure 3. Photograph of the test areas generated using two different laser beam scanning strategies: (a) bidirectional sequential scanning and (b) bidirectional interlaced scanning type 2. Each square was produced using the EP values as indicated on the photographs. The PRF and pulse overlap were 100 kHz and 95 %, respectively. The photos were taken before cleaning the samples.
Jmmp 03 00014 g003
Figure 4. Ablation depths measured for different values of pulse energy and pulse overlap. Results are presented for two different laser beam scanning strategies and two PRF values.
Jmmp 03 00014 g004
Figure 5. Root-mean-square (RMS) surface roughness (Sq) measured for different values of pulse energy and pulse overlap. Results are presented for two different laser beam scanning methods and two PRF values.
Jmmp 03 00014 g005
Figure 6. (a) Ablation depth and (b) RMS surface roughness (Sq) as a function of pulse energy for the pulse overlap of 95%. Results are presented for sequential and interlaced machining using PRF = 20 kHz and 100 kHz.
Jmmp 03 00014 g006
Figure 7. Ablation depth as a function of energy dose. Results are presented on the log–log scale for (a) sequential machining and (b) interlaced machining (using PRF = 20 kHz and 100 kHz). The graphs also show the ranges of energy dose obtained with different values of pulse overlap.
Jmmp 03 00014 g007
Figure 8. Removal rate calculated for different pulse energies and pulse overlaps. Results are presented for (a) sequential machining using PRF = 20 kHz, (b) interlaced machining using PRF = 20 kHz, (c) sequential machining using PRF = 100 kHz, and (d) interlaced machining using PRF = 100 kHz.
Jmmp 03 00014 g008
Figure 9. Simplified cross-section of the areas generated using sequential machining (left column) and interlaced machining (right column). In this case, the hatch distance (ΔH) was equal to 0.1 × (2ω), whereas the interlace distance (ΔIL) was equal to 10 × ΔH.
Jmmp 03 00014 g009
Figure 10. (a) Ablation depth and (b) surface roughness of the areas generated during interlaced machining using the following laser machining parameters: EP = 46.5 µJ, PRF = 20 kHz, O = 90%, and ΔIL = 24 µm.
Jmmp 03 00014 g010
Table 1. List of parameters used for the generation of the test areas. The table also provides information on the time (tM) required for the generation of 1-mm2 areas, the interlace distances (ΔIL) used for different values of pulse overlap (O), the laser scan speeds (v) used for different combinations of pulse overlap, pulse repetition frequency (PRF), and scanning methods, as well as the total number of laser pulses (N) per 1-mm2 area calculated for different values of pulse overlap.
Pulse Overlap (O)Scanning Method & PRF Used
SM 20 kHzSM 100 kHzIM 20 kHzIM 100 kHz
75% (ΔH, ΔS = 6 μm)v = 120 mm/s
tM = 1.4 s/mm2
v = 600 mm/s
tM = 0.3 s/mm2
v = 120 mm/s
tM = 1.4 s/mm2
v = 600 mm/s
tM = 0.3 s/mm2
ΔIL = 24 μm
N = 27,889 pulses/mm2
80% (ΔH, ΔS = 4.8 μm)v = 96 mm/s
tM = 2.2 s/mm2
v = 480 mm/s
tM = 0.4 s/mm2
v = 96 mm/s
tM = 2.2 s/mm2
v = 480 mm/s
tM = 0.4 s/mm2
ΔIL = 24 μm
N = 43,264 pulses/mm2
85% (ΔH, ΔS = 3.6 μm)v = 72 mm/s
tM = 3.9 s/mm2
v = 360 mm/s
tM = 0.8 s/mm2
v = 72 mm/s
tM = 3.9 s/mm2
v = 360 mm/s
tM = 0.8 s/mm2
ΔIL = 21.6 μm
N = 77,284 pulses/mm2
90% (ΔH, ΔS = 2.4 μm)v = 48 mm/s
tM = 8.7 s/mm2
v = 240 mm/s
tM = 1.7 s/mm2
v = 48 mm/s
tM = 8.7 s/mm2
v = 240 mm/s
tM = 1.7 s/mm2
ΔIL = 24 μm
N = 173,889 pulses/mm2
95% (ΔH, ΔS = 1.2 μm)v = 24 mm/s
tM = 34.7 s/mm2
v = 120 mm/s
tM = 6.9 s/mm2
v = 24 mm/s
tM = 34.7 s/mm2
v = 120 mm/s
tM = 6.9 s/mm2
ΔIL = 24 μm
N = 693,889 pulses/mm2

