Investigations on Material Loads during Grinding by Speckle Photography

 ,
,  and
and 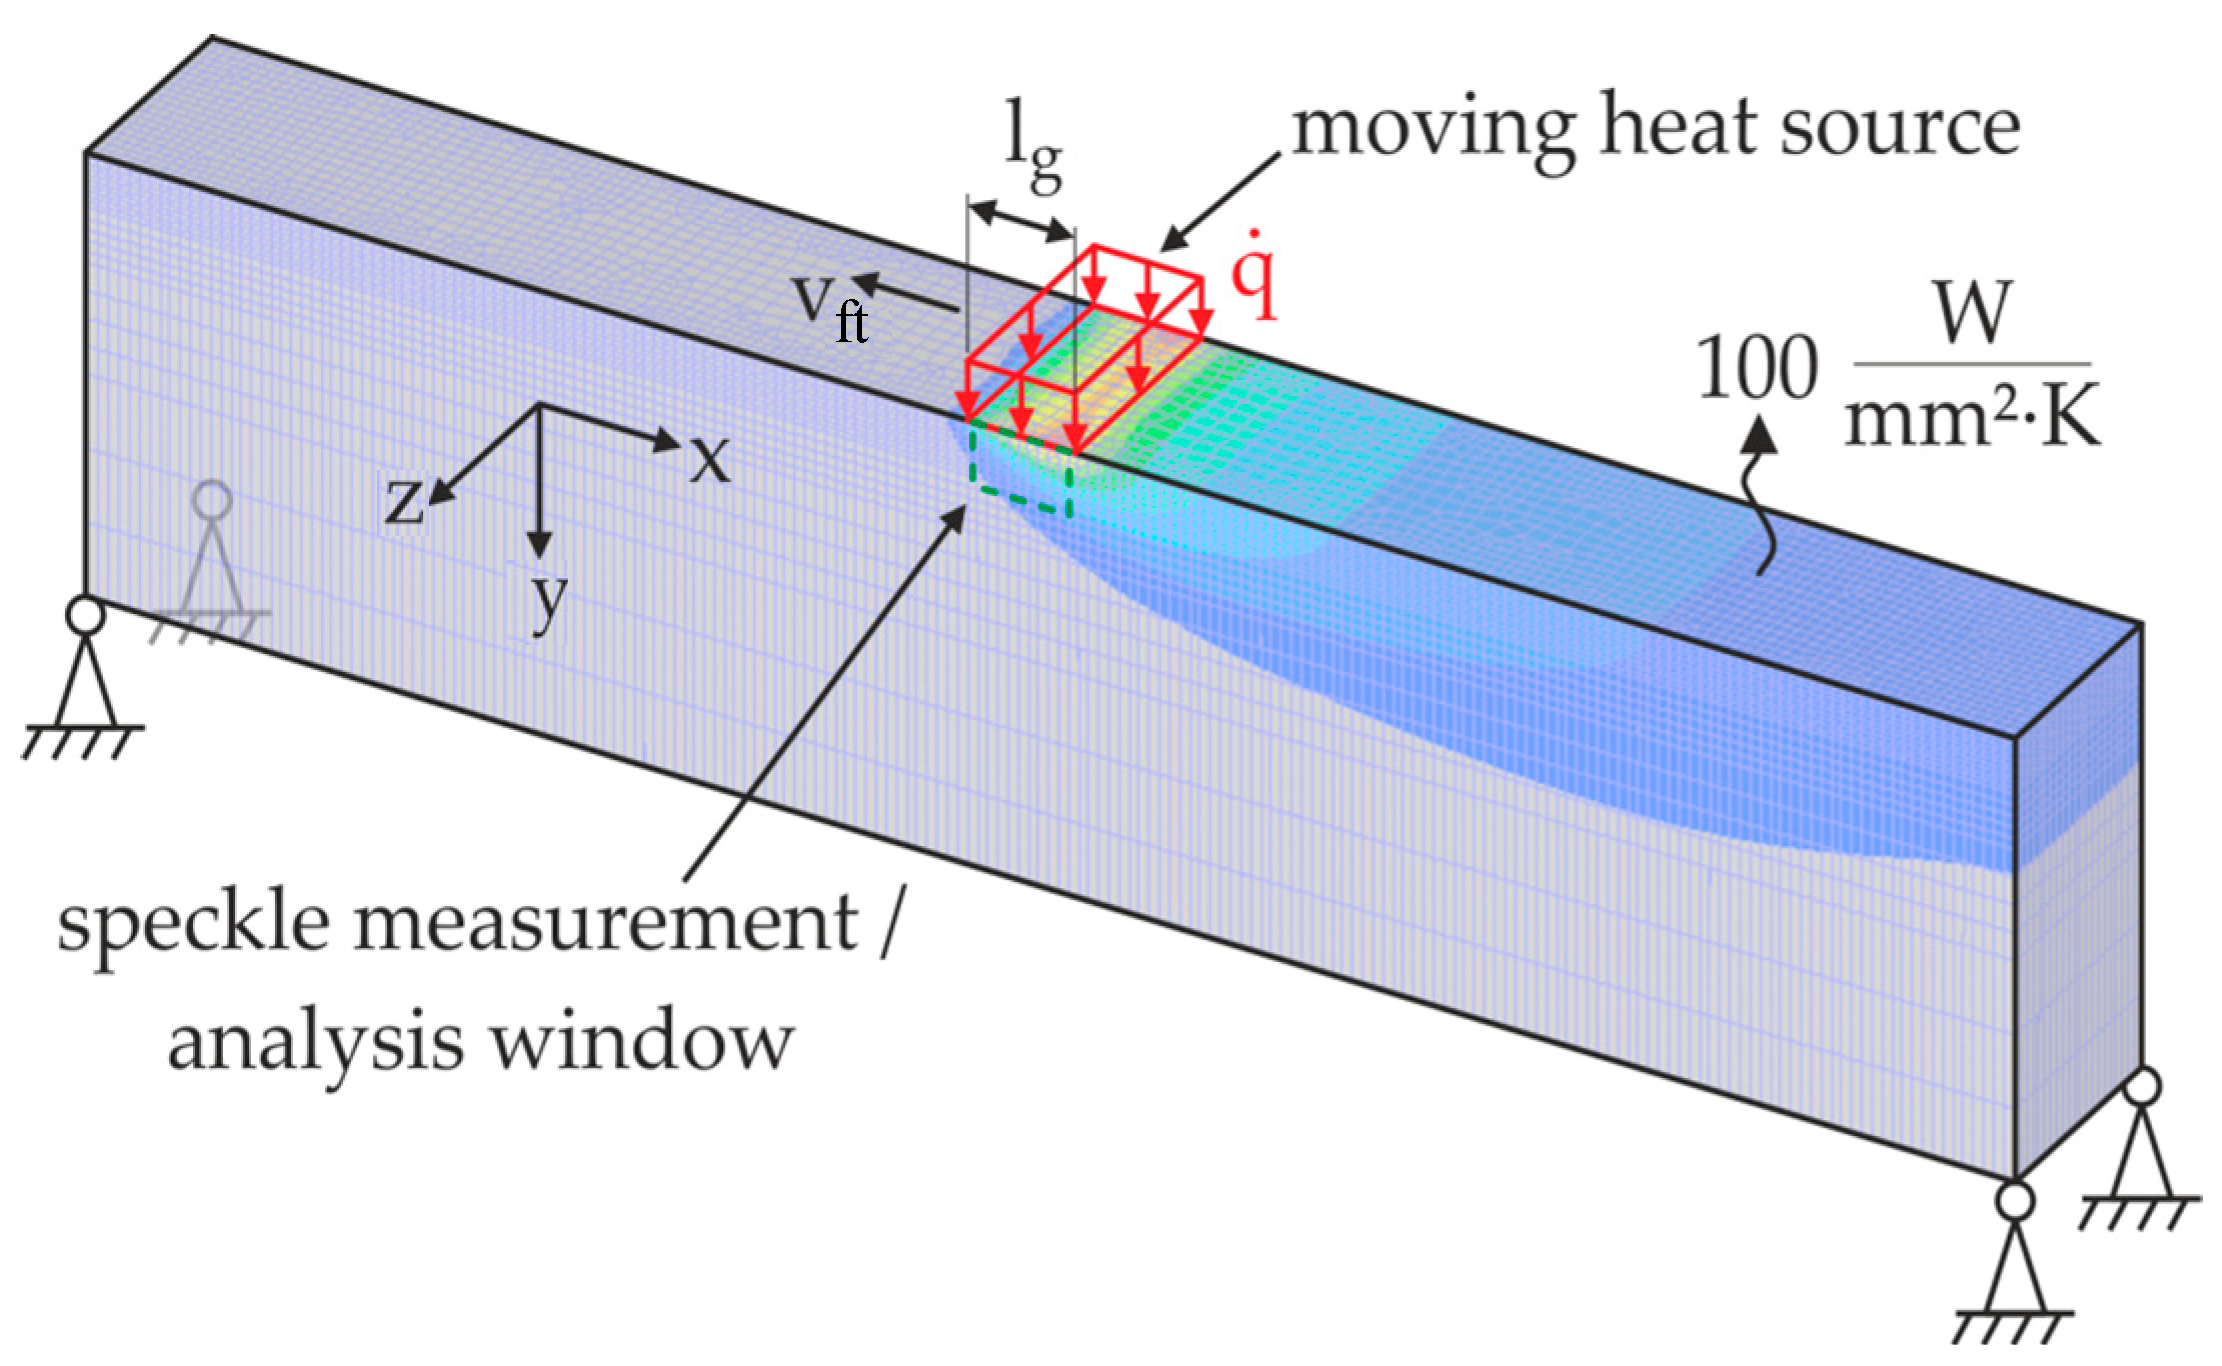
Abstract
:1. Introduction
2. Materials and Methods
2.1. Material Loads
2.2. FEM Approach and Simulative Setup
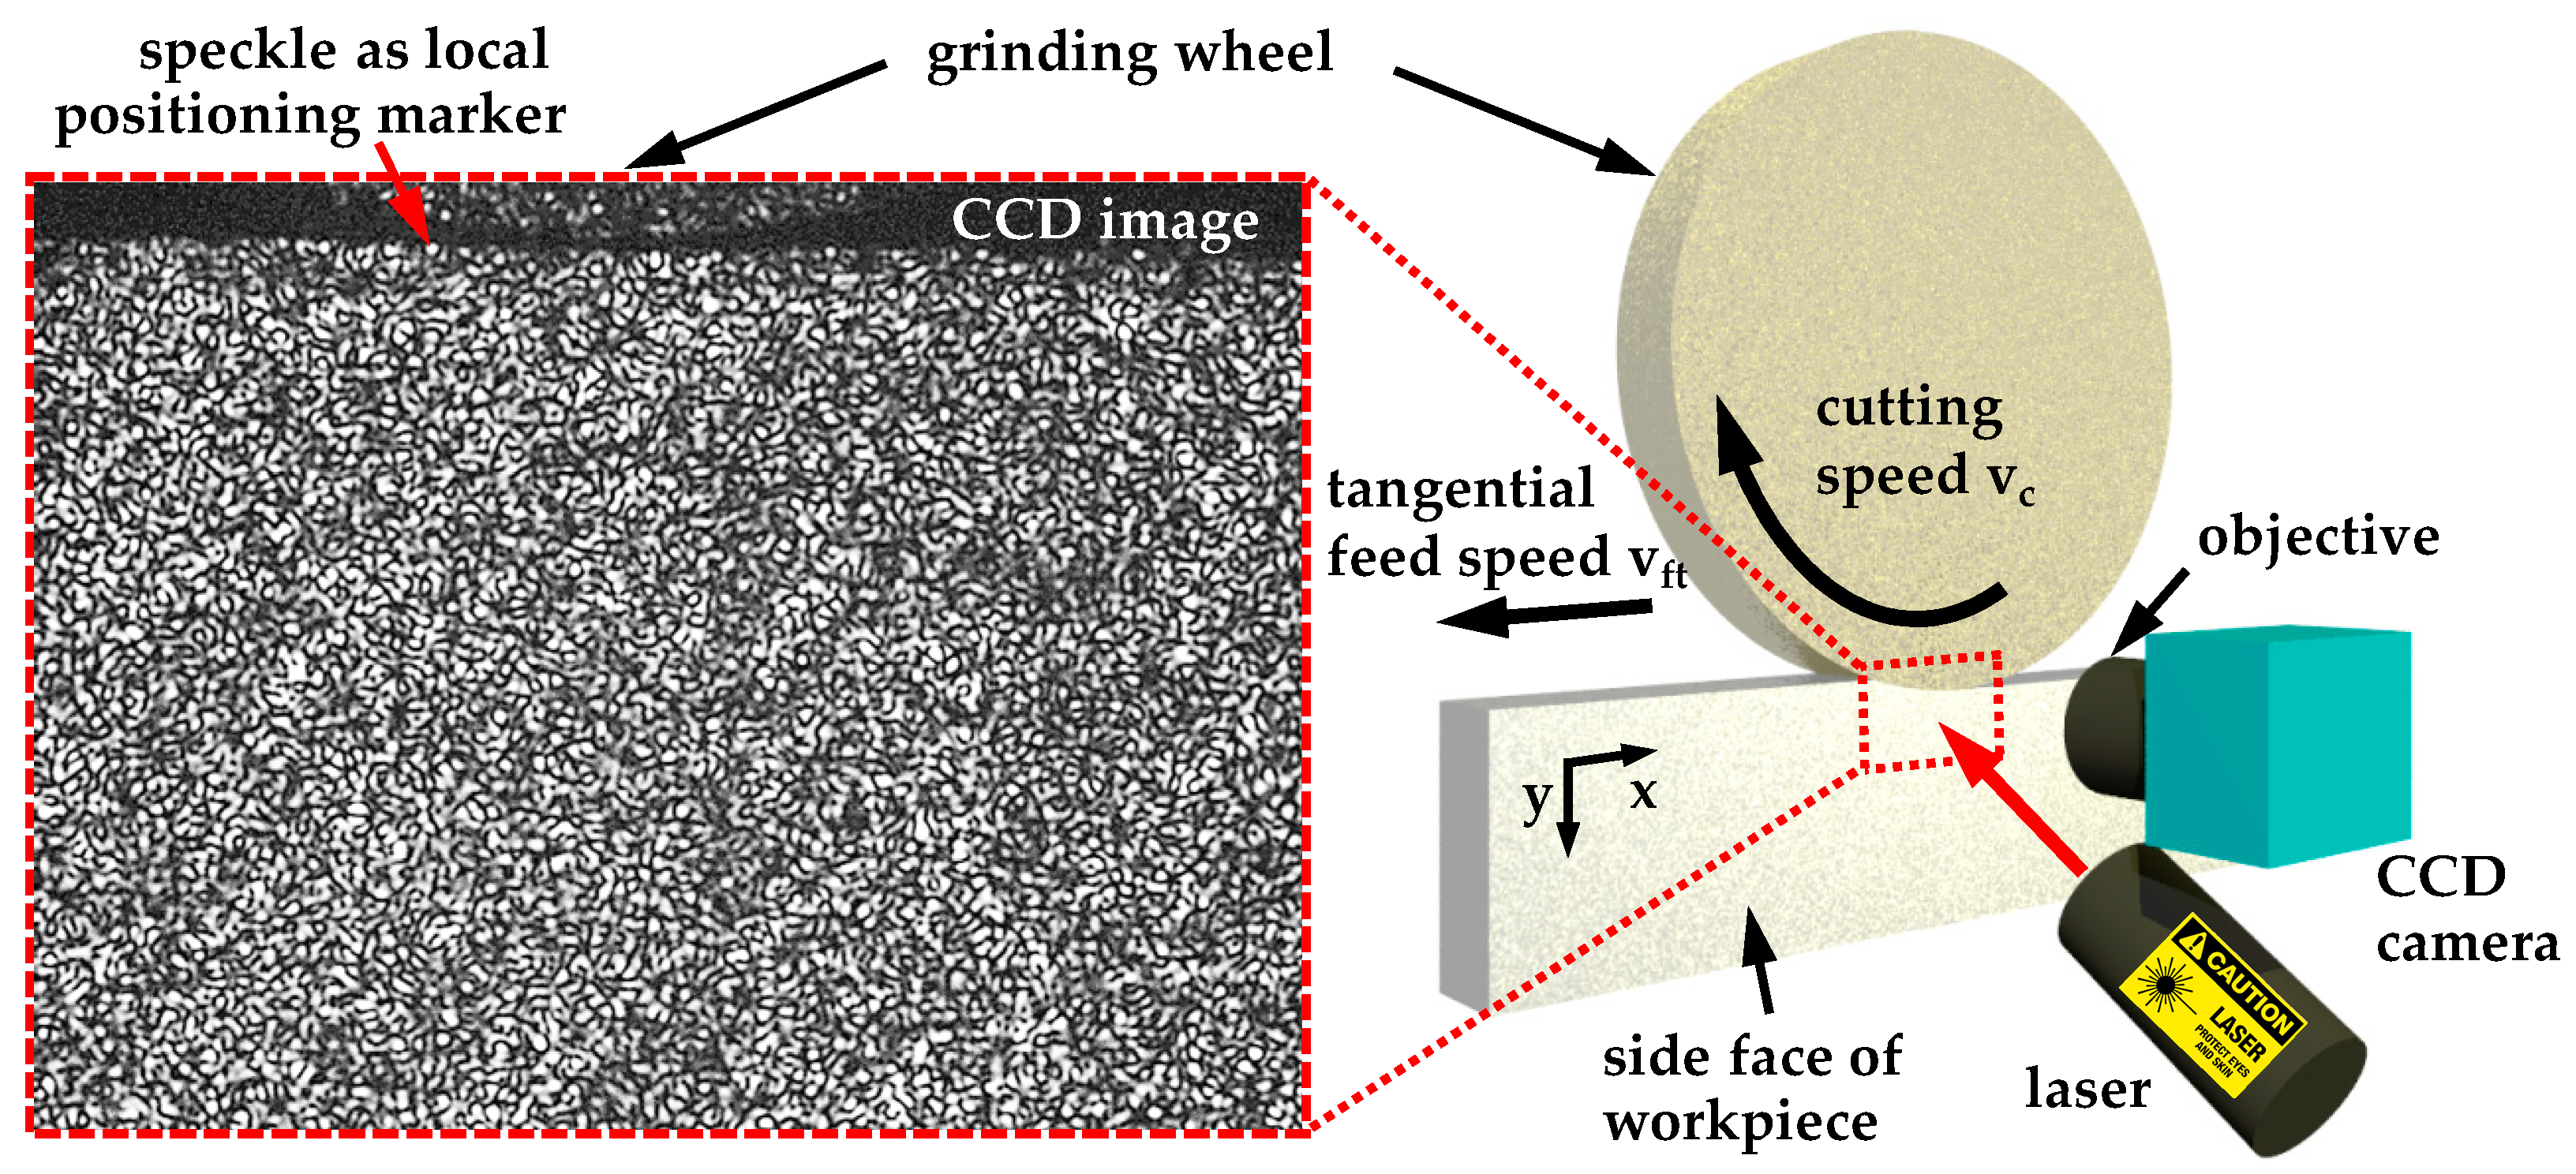
2.3. Displacement and Strain Field Measurement with DSP
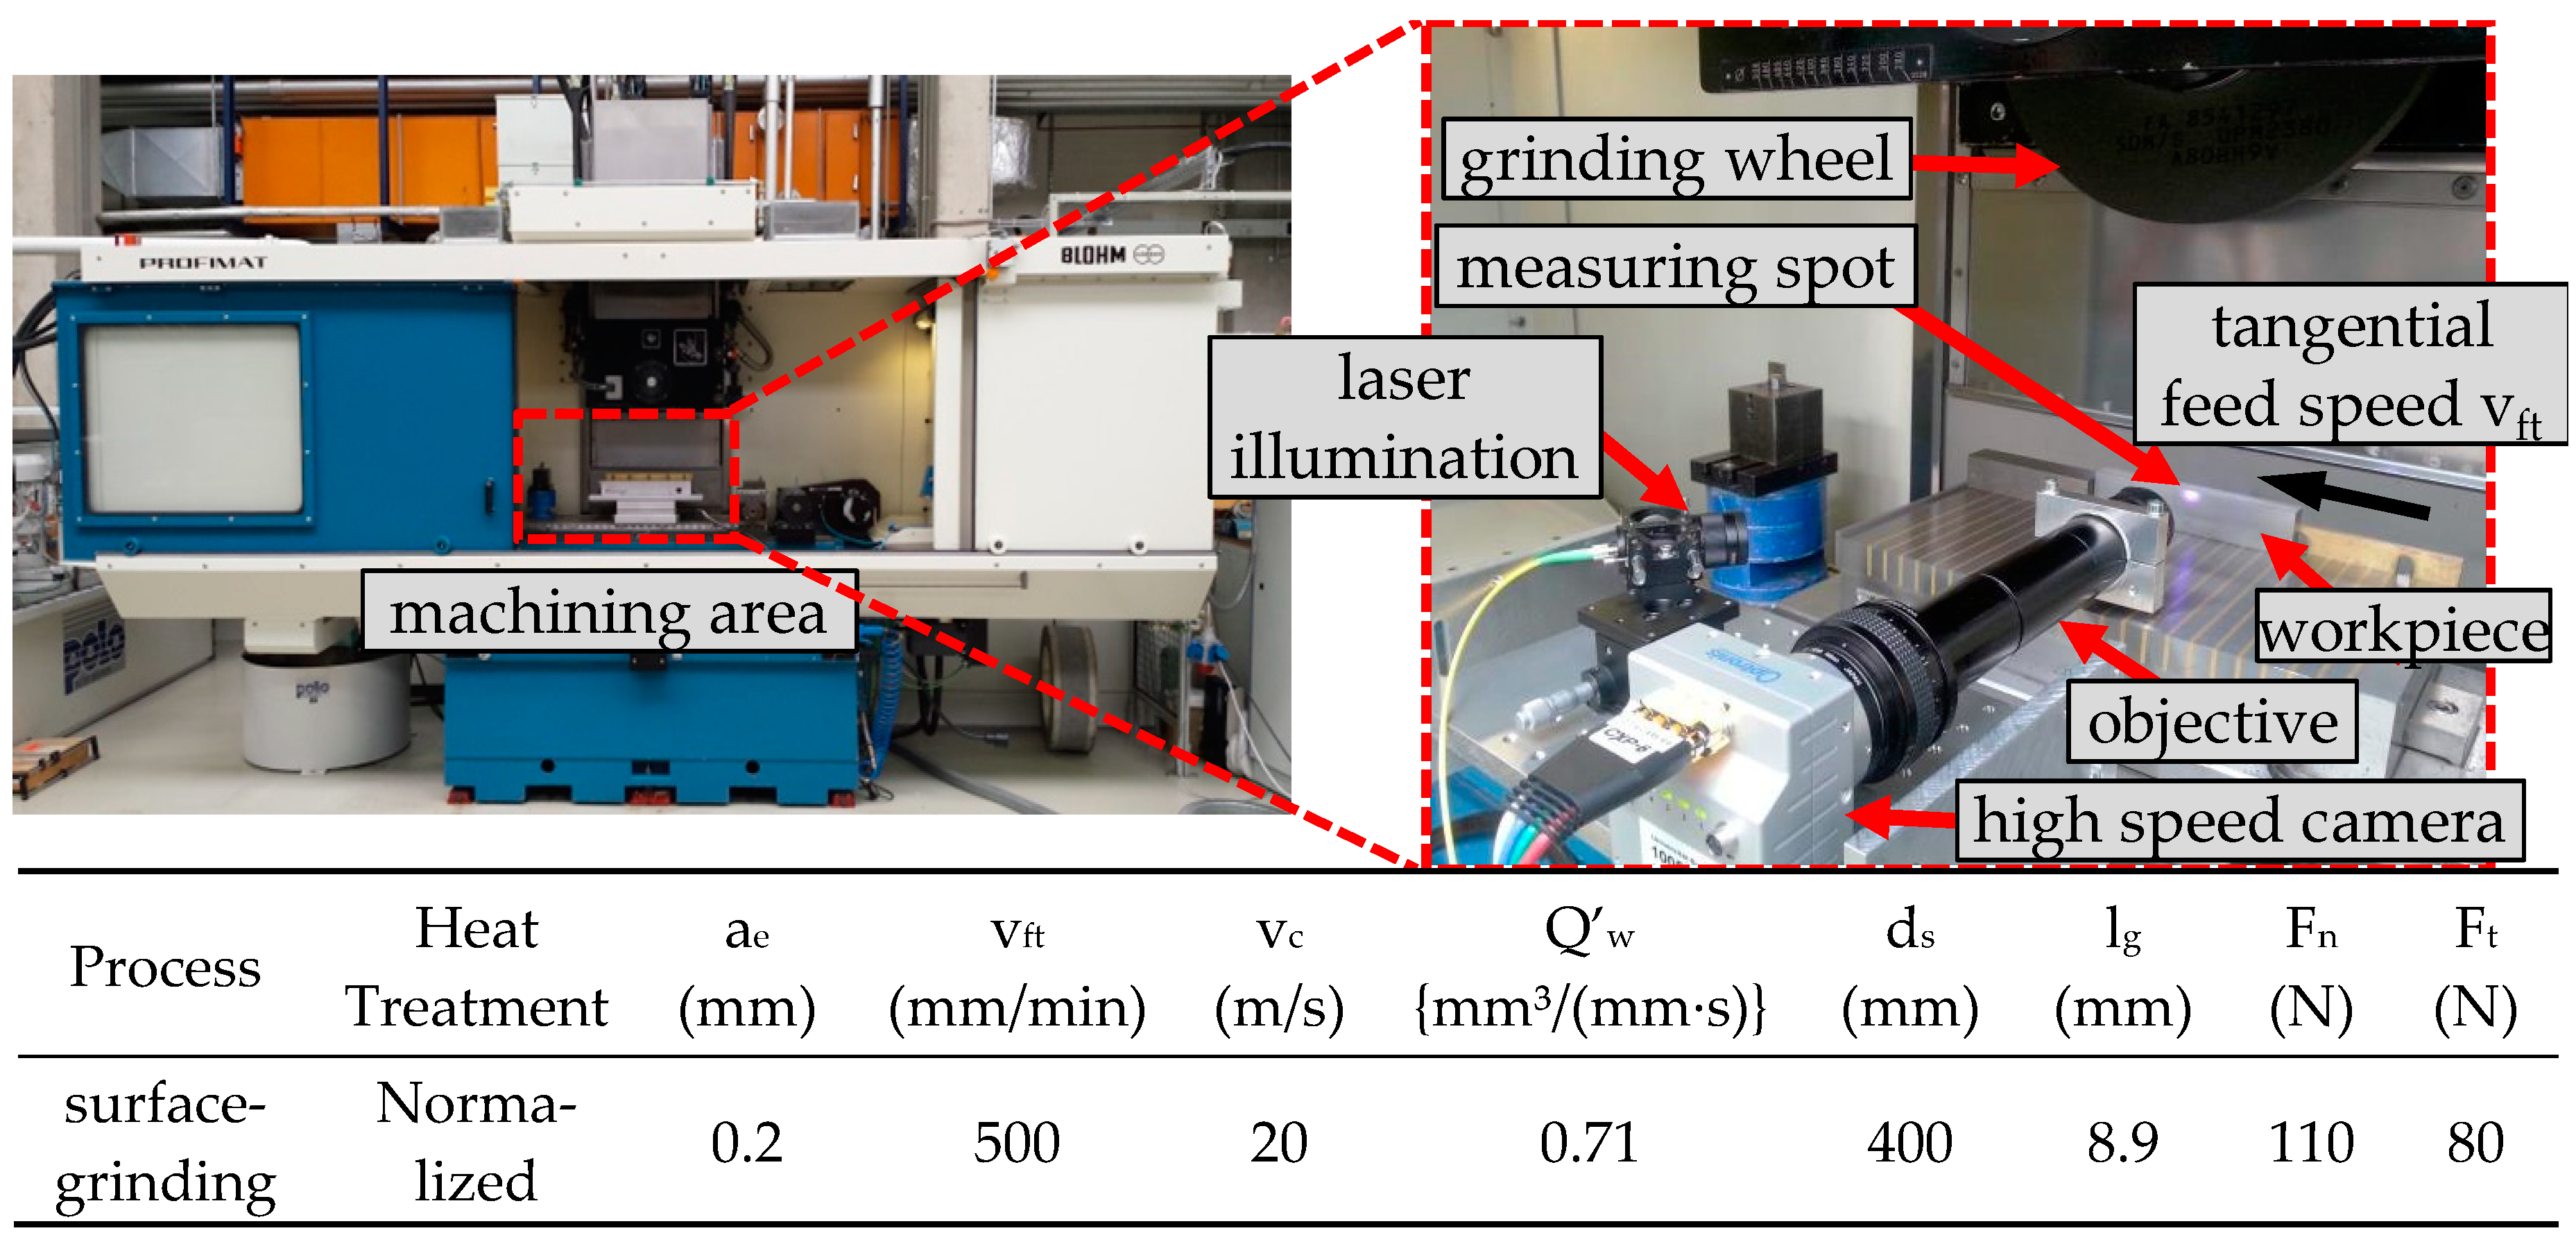
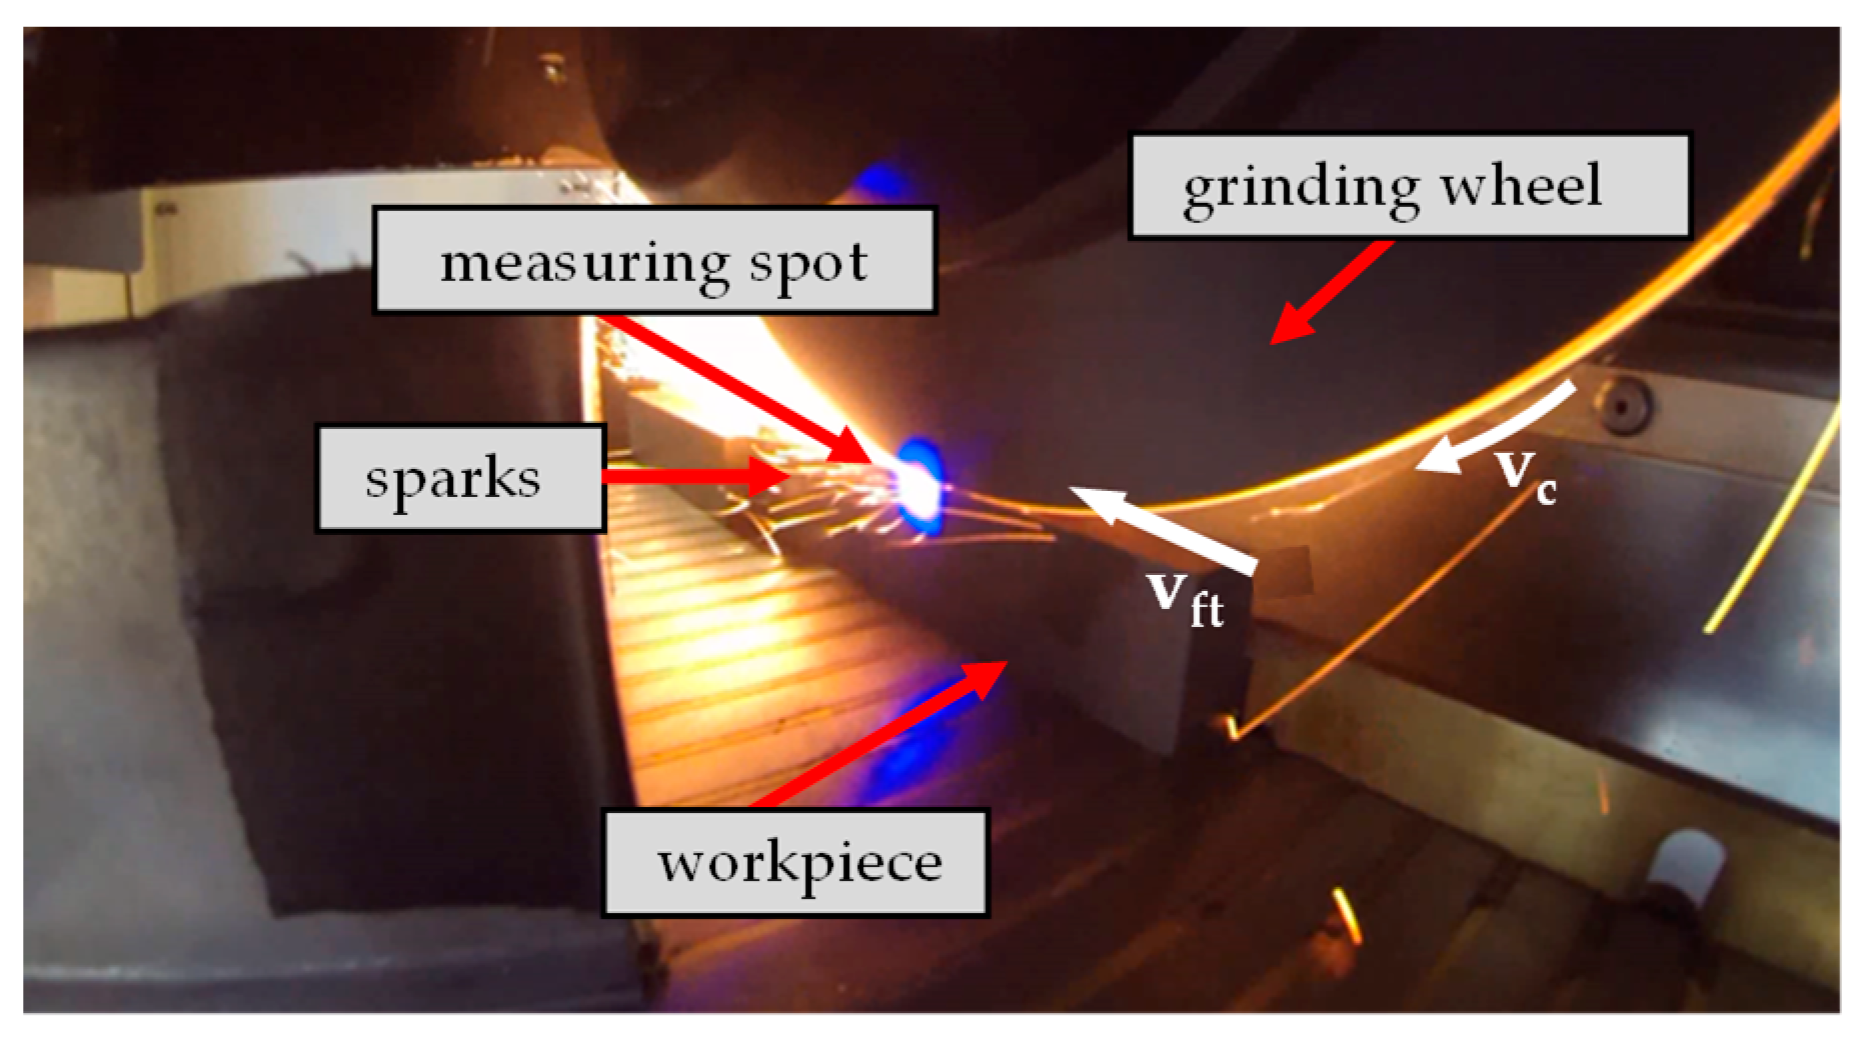
2.4. Experimental Setup
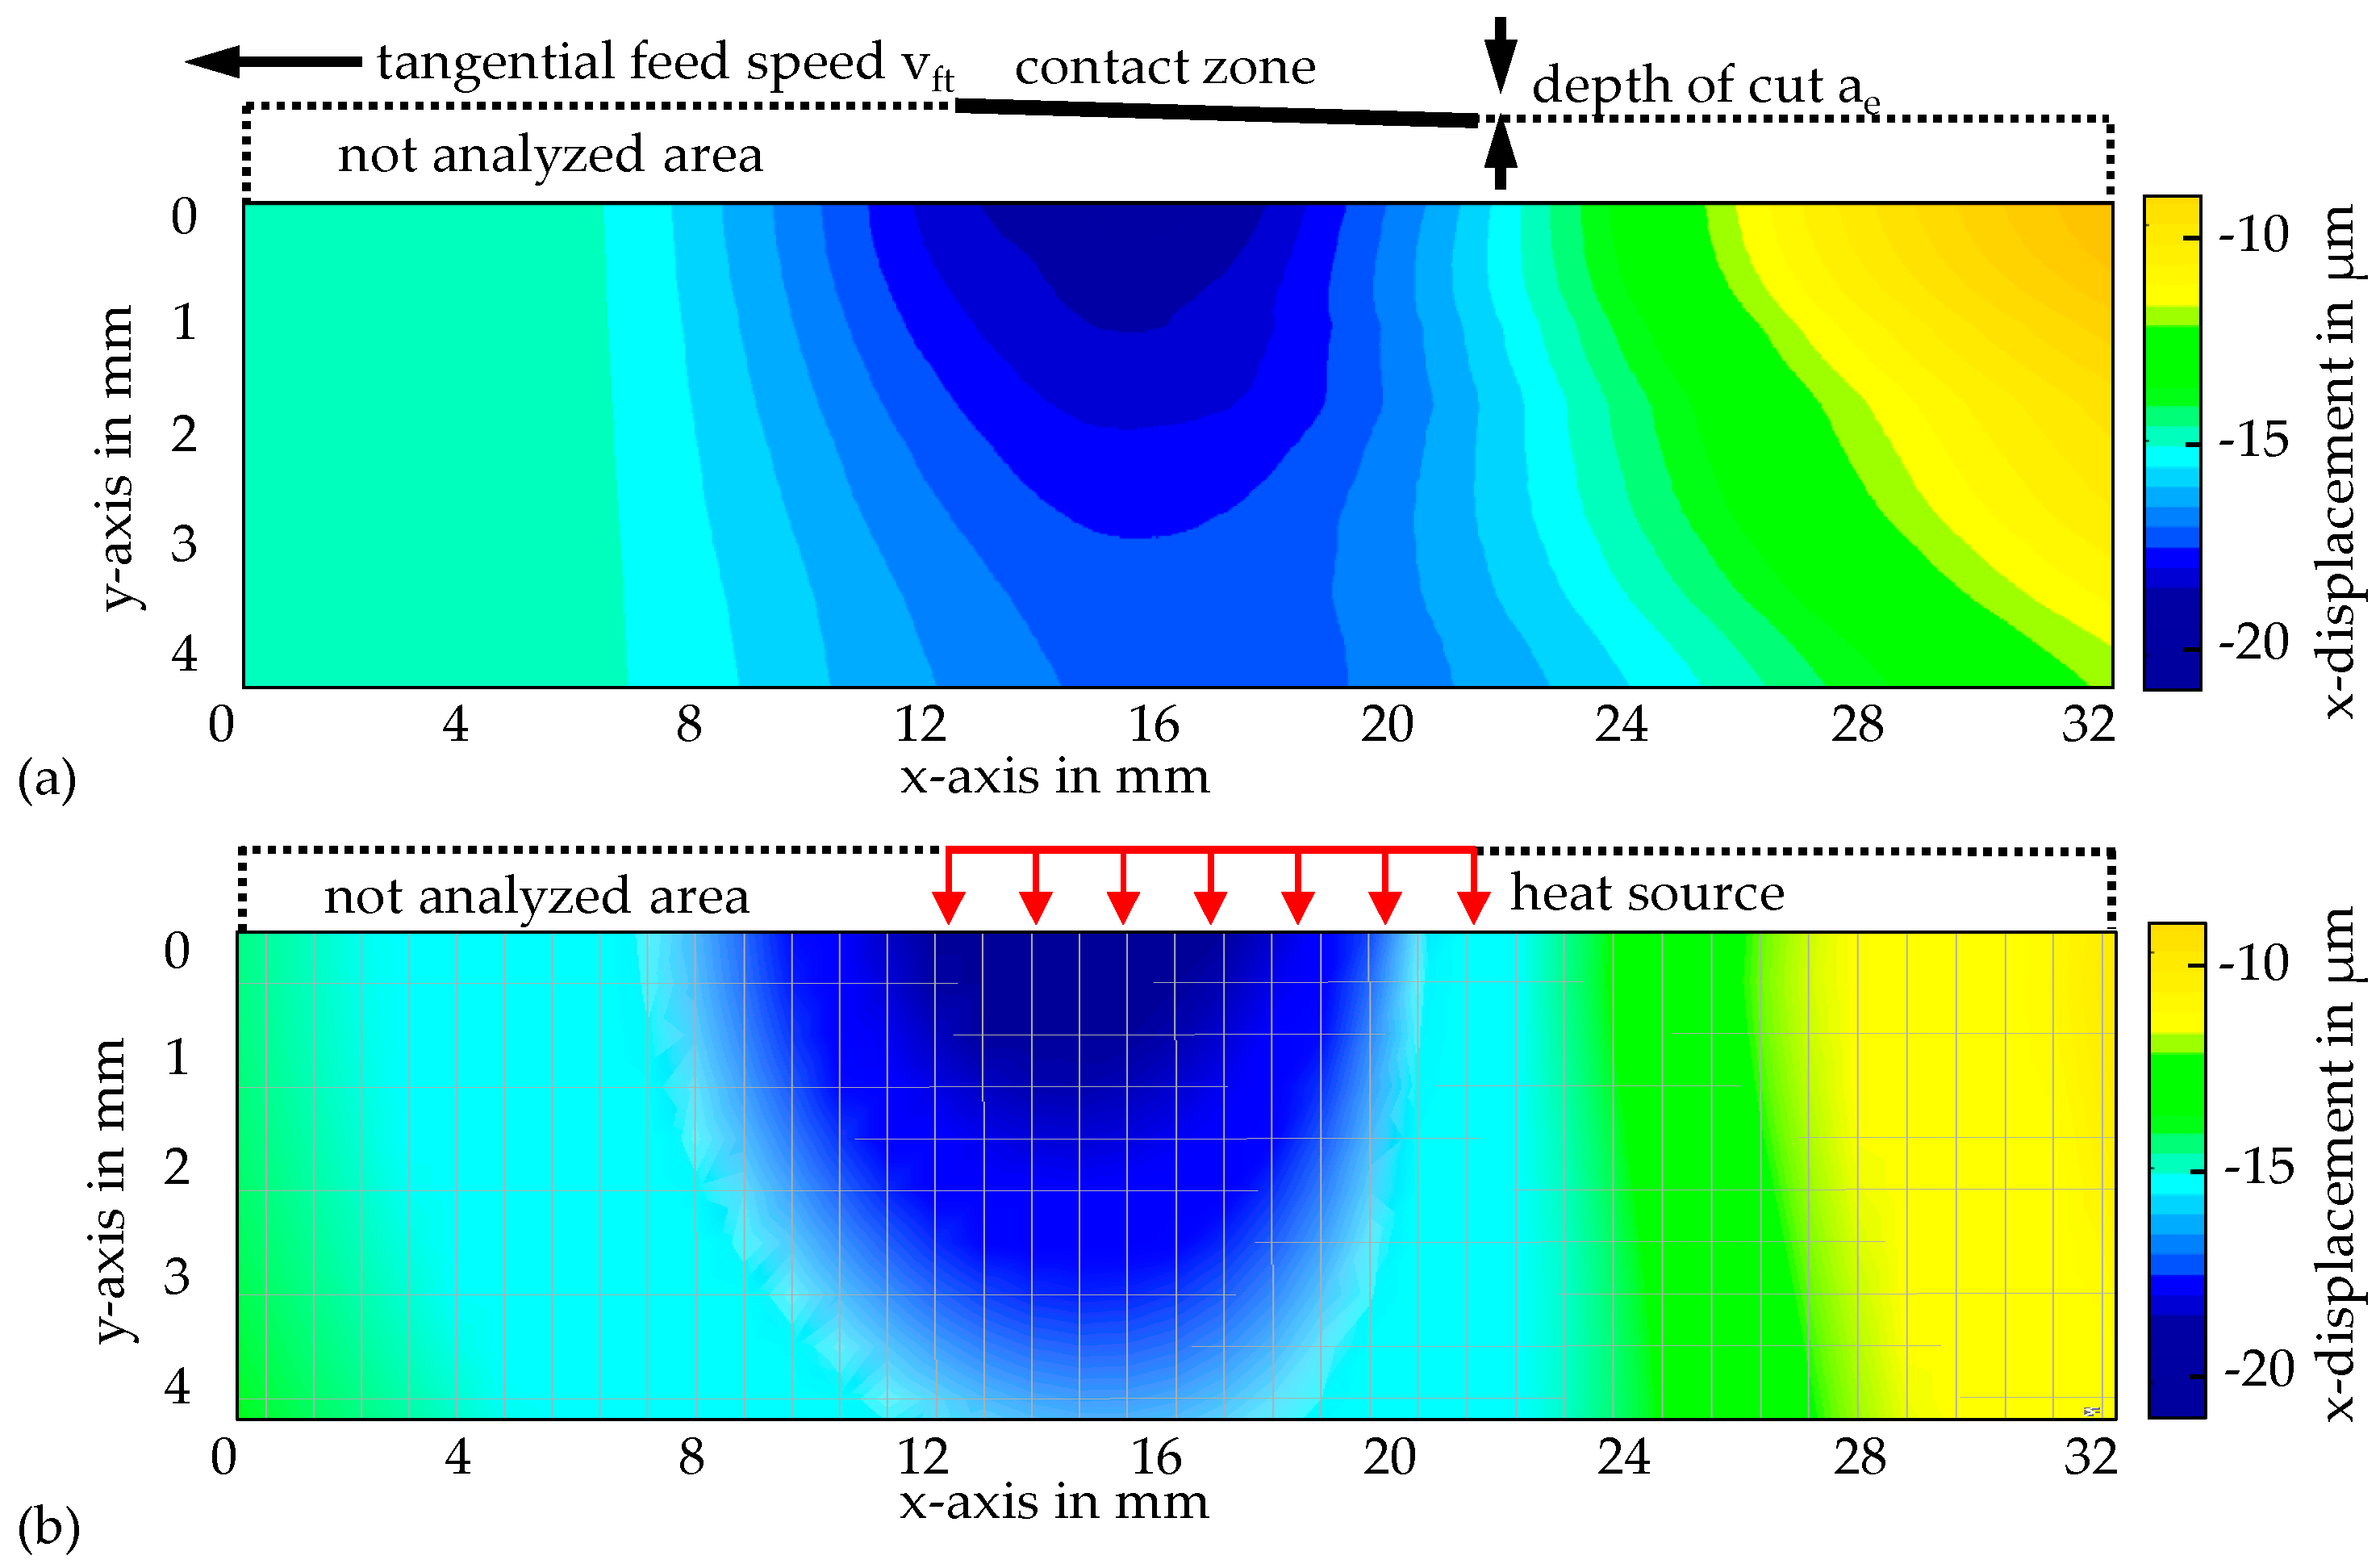
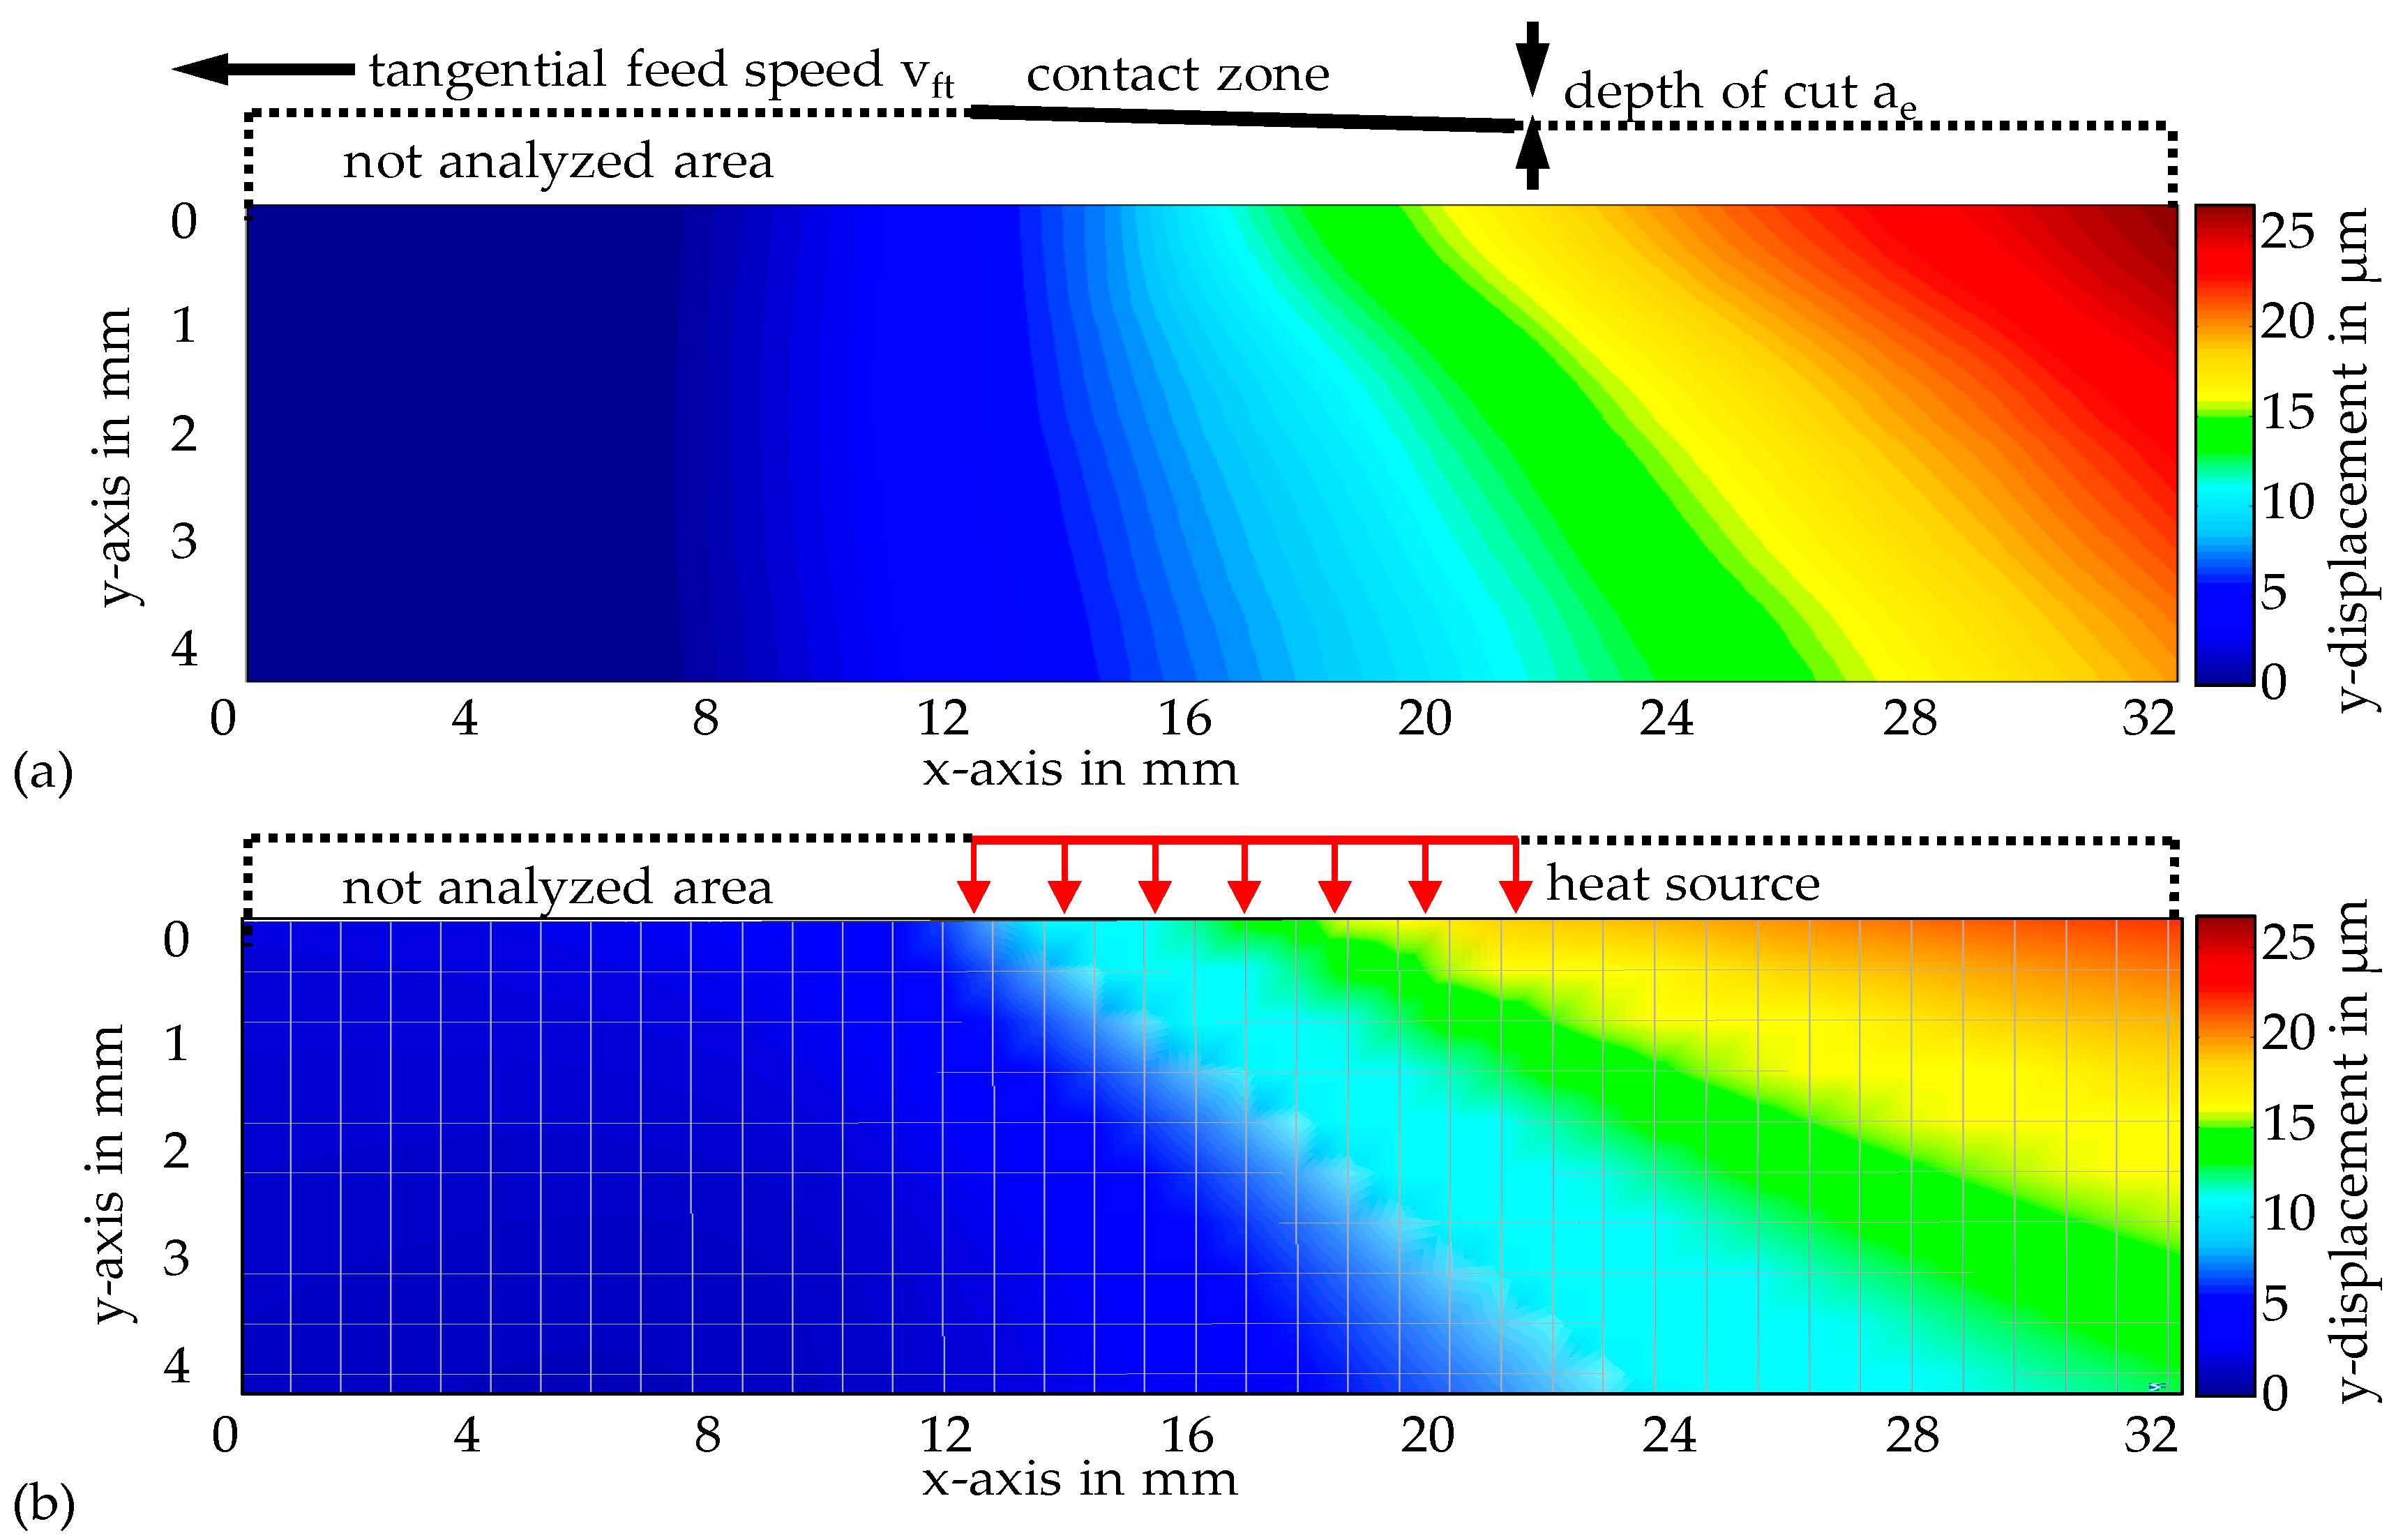
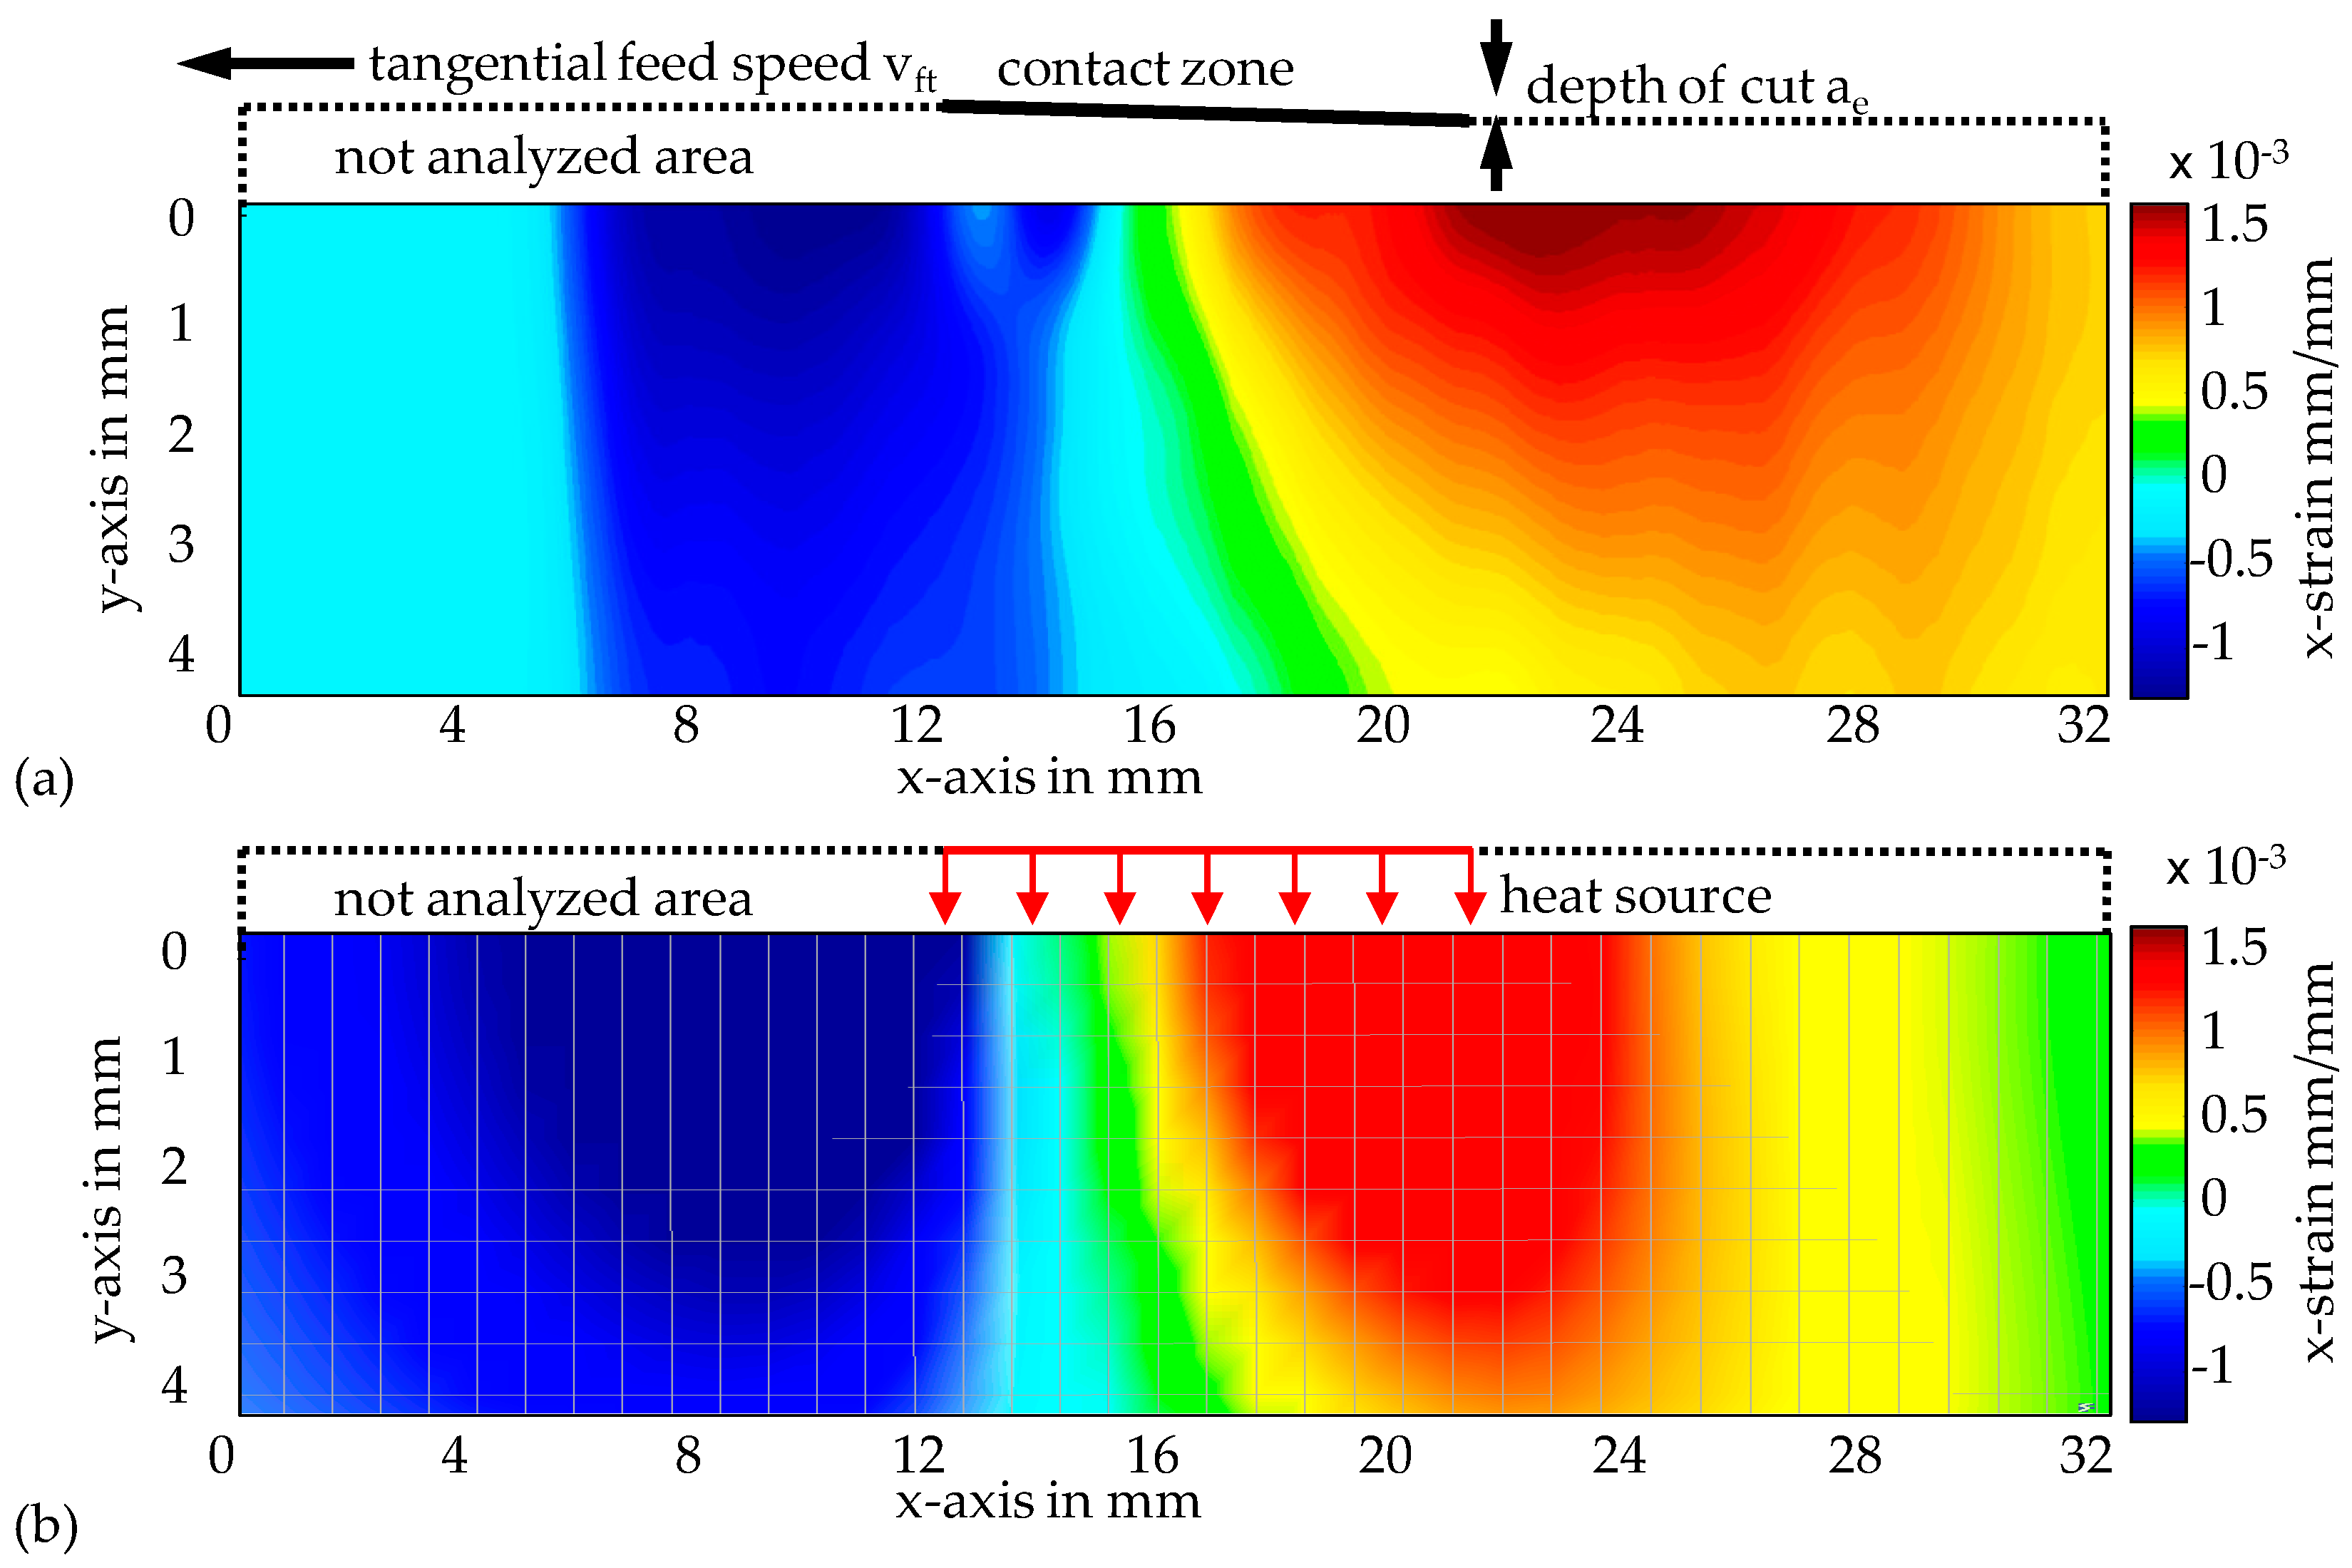
3. Results of In-Process Measurements and Simulations of Material Loads
4. Conclusions and Outlook
Author Contributions
Funding
Conflicts of Interest
References
- Jawahi, I.S.; Brinksmeier, E.; M’Saoubi, R.; Aspinwall, D.K.; Outiero, J.C.; Meyer, D.; Umbrello, D.; Jayal, A.D. Surface Integrity in Material Removal Proecesses: Recent Advances. CIRP Ann. Manuf. Technol. 2011, 60, 603–626. [Google Scholar] [CrossRef]
- Brinksmeier, E.; Klocke, F.; Lucca, D.A.; Sölter, J.; Meyer, D. Process signatures—A new approach to solve the inverse surface integrity problem in machining processes. Procedia CIRP 2014, 13, 429–434. [Google Scholar] [CrossRef]
- Kuschel, S.; Sölter, J.; Brinksmeier, E. Analysing internal material loads in manufacturing processes. Adv. Mater. Res. 2014, 1018, 83–90. [Google Scholar] [CrossRef]
- Mahdi, M.; Zhang, L. Applied Mechanics in Grinding—V. Thermal Residual Stesses. Int. J. Mach. Tools Manuf. 1997, 37, 619–633. [Google Scholar] [CrossRef]
- Walsh, D.G.; Torrance, A.A.; Tiberg, J. Analytical evaluation of thermally induced residual stresses in ground components. J. Mech. Eng. Sci. 2003, 217, 471–482. [Google Scholar] [CrossRef]
- Liu, C.; Ding, W.; Yu, T.; Yang, C. Materials removal mechanism in high-speed grinding of particulate reinforced titanium matrix composites. Precis. Eng. 2018, 51, 68–77. [Google Scholar] [CrossRef]
- Tausendfreund, A.; Stöbener, D.; Dumstorff, G.; Sarma, M.; Heinzel, C.; Lang, W.; Goch, G. Systems for locally resolved measurements of physical loads in manufacturing processes. CIRP Ann. Manuf. Technol. 2015, 64, 495–498. [Google Scholar] [CrossRef]
- Dumstorff, G.; Sarma, M.; Reimers, M.; Kolkwitz, B.; Brinksmeier, E.; Heinzel, C.; Lang, W. Steel integrated thin film sensors for characterizing grinding processes. Sens. Actuators A 2016, 242, 203–209. [Google Scholar] [CrossRef]
- Sarma, M.; Borchers, F.; Dumstorff, G.; Heinzel, C.; Lang, W. Measuring strain during a cylindrical grinding process using embedded sensors in a workpiece. J. Sens. Syst. 2017, 6, 331–340. [Google Scholar] [CrossRef] [Green Version]
- Yamaguchi, I. Speckle displacement and decorrelation in the diffraction and image fields for small object deformation. Opt. Acta 1981, 28, 1359–1376. [Google Scholar] [CrossRef]
- Goodman, J.W. Speckle Phenomena in Optics. Theory and Applications; Roberts and Company Publishers: Greenwood Village, CO, USA, 2007; ISBN 0-9747077-9-1. [Google Scholar]
- Fischer, A. Fundamental uncertainty limit for speckle displacement measurements. Appl. Opt. 2017, 56, 7013–7019. [Google Scholar] [CrossRef] [PubMed]
- Tausendfreund, A.; Stöbener, D.; Fischer, A. Precise In-Process Strain Measurements for the Investigation of Surface Modification Mechanisms. J. Manuf. Mater. Process. 2018, 2, 9. [Google Scholar] [CrossRef]
- Outwater, J.O.; Shaw, M.C. Surface temperatures in grinding. Trans. ASME 1952, 74, 73–86. [Google Scholar]
- Lavine, A.S. A simple model for convective cooling during the grinding process. ASME J. Eng. Ind. 1988, 110, 1–6. [Google Scholar] [CrossRef]
- Martini, K.H. Multicomponent Dynamometers Using Quartz Crystals as Sensing Elements. ISA Trans. 1983, 22, 35–46. [Google Scholar]
- Jermolajev, S.; Heinzel, C.; Brinksmeier, E. Experimental and analytical investigation of workpiece thermal load during external cylindrical grinding. Procedia CIRP 2015, 31, 465–470. [Google Scholar] [CrossRef]
- Varghese, B.; Pathare, S.; Gao, R.; Guo, C.; Malkin, S. Development of a Sensor-Integrated “Intelligent” Grinding Wheel for In-Process Monitoring. CIRP Ann. Manuf. Technol. 2001, 49, 231–234. [Google Scholar] [CrossRef]
- Kuschel, S.; Kolkwitz, B.; Sölter, J.; Brinksmeier, E.; Heinzel, C. Experimental and numerical analysis of residual stress change caused by thermal loads during grinding. Procedia CIRP 2016, 45, 51–54. [Google Scholar] [CrossRef]
- Archold, E.; Burch, J.M.; Ennos, A.E. Recording of in-plane surface displacements by double-exposure speckle photography. Opt. Acta 1970, 17, 883–898. [Google Scholar] [CrossRef]
- Stetson, K.A. A Review of Speckle Photography and Interferometry. Opt. Eng. 1975, 14, 482–489. [Google Scholar] [CrossRef]
- Zhou, P.; Goodson, K.E. Subpixel displacement and deformation gradient measurement using digital image/speckle correlation (DISC). Opt. Eng. 2001, 40, 1613–1620. [Google Scholar] [CrossRef]
- Kajberg, J.; Lindkvist, G. Characterisation of materials subjected to large strains by inverse modelling based on in-plane displacement fields. Int. J. Solids Struct. 2004, 41, 3439–3459. [Google Scholar] [CrossRef]
- Eman, J.; Sundin, K.G.; Oldenburg, M. Spatially resolved observations of strain fields at necking and fracture of anisotropic hardened steel sheet material. Int. J. Solids Struct. 2009, 46, 2750–2756. [Google Scholar] [CrossRef] [Green Version]
- Tausendfreund, A.; Stöbener, D.; Goch, G. Measuring technique for the detection of process force related component deformations in metalworking manufacturing processes. In Proceedings of the 5th International Conference on Distortion Engineering (IDE), Bremen, Germany, 23–25 September 2015; pp. 355–364. [Google Scholar]


© 2018 by the authors. Licensee MDPI, Basel, Switzerland. This article is an open access article distributed under the terms and conditions of the Creative Commons Attribution (CC BY) license (http://creativecommons.org/licenses/by/4.0/).
Share and Cite
Tausendfreund, A.; Borchers, F.; Kohls, E.; Kuschel, S.; Stöbener, D.; Heinzel, C.; Fischer, A. Investigations on Material Loads during Grinding by Speckle Photography. J. Manuf. Mater. Process. 2018, 2, 71. https://doi.org/10.3390/jmmp2040071
Tausendfreund A, Borchers F, Kohls E, Kuschel S, Stöbener D, Heinzel C, Fischer A. Investigations on Material Loads during Grinding by Speckle Photography. Journal of Manufacturing and Materials Processing. 2018; 2(4):71. https://doi.org/10.3390/jmmp2040071
Chicago/Turabian StyleTausendfreund, Andreas, Florian Borchers, Ewald Kohls, Sven Kuschel, Dirk Stöbener, Carsten Heinzel, and Andreas Fischer. 2018. "Investigations on Material Loads during Grinding by Speckle Photography" Journal of Manufacturing and Materials Processing 2, no. 4: 71. https://doi.org/10.3390/jmmp2040071