Deployment and Comparison of a Low-Cost High-Sensitivity Concentration Meters Using Micro-Optical Resonators †

1
Applied-Science & Robotics Laboratory for Applied-Mechatronics (ARAtronics Lab.), Mechatronics Engineering Department, German University in Cairo, Cairo 11835, Egypt
2
Pharmacology and Toxicology Department, Faculty of Pharmacy and Biotechnology, German University in Cairo, Cairo 11835, Egypt
*
Author to whom correspondence should be addressed.
†
Presented at the 1st International Electronic Conference on Biosensors, 2–17 November 2020; Available online: https://iecb2020.sciforum.net/.
Proceedings 2020, 60(1), 53; https://doi.org/10.3390/IECB2020-07091
Published: 2 November 2020
(This article belongs to the Proceedings of The 1st International Electronic Conference on Biosensors)
Abstract
:Micro-optical resonators have been introduced as sensors in many applications for a wide number of variable types of stimuli due to their very high resolution, high sensitivity, and high-quality factor. In this paper, a novel micro-optical sensor was designed and tested as a concentration meter for chemical composition of a solution. The micro-optical resonator used is based on whispering gallery mode (WGM). This phenomenon appears when a tapered, single-mode laser carrying micro-optical fiber is evanescently coupled with a polymeric or silica micro-optical resonator. The presented sensor shows the change in concentration by experiencing a change in its morphology due to the varied viscosity of its environment. The variation of concentrations or fluid contents results in a change between the radii of the micro-optical resonator. With varied chemical composition and concentration in the tested sample varied infinitesimally small morphological changes are detected. The change in the resonators shape is read as a WGM shift in the resonance transmission spectrum, which is interpreted using a technique called cross-correlation, which compares the output across time to display the shift, which is later translated into distinct concentration levels. The proposed, exceptionally low-cost sensors were able to detect change at very high resolutions allowing better sensitivity along with wider range of variation. Experimental work for detection of ranges of concentrations of variable type of contaminants is presented.
1. Introduction
Concentration sensors, saturation sensors, and sample composition level monitoring biosensors are some of the most highly in demand types of biosensors as they are used for diagnosis, prognosis, and drug efficiency research. For example, measuring concentration levels of salt as well as sugar in blood and urine samples is constantly needed for analysis and monitoring the prognosis of several diseases.
In this paper, an optics-based sensor of uniquely high resolution that is able to indicate concentration levels of variable substances using only a single droplet of the solution and its theory of operation are presented.
Chemical phenomenon [1] and physical phenomenon such as mechanical forces [2,3], pressure [4], temperature [5,6], acceleration [7], magnetic field [8,9], angular velocity [10], and others are some of the many fields that have found ways to employ micro-optical sensors. One of the widely known micro-optical sensors is the whispering gallery mode (WGM) and its schematic shown in Figure 1. The WGM resonators are known for their low cost, very high sensitivity, and resolution. Laser is emitted from a laser source, passed through a single mode optical fiber into the WGM resonator. As the resonator faces morphological changes, altering its radius or surrounding refractive index, in response, the output wave ength of the light shifts; known as WGM shifts, which are interpreted into measurements.
2. Materials and Methods
WGM resonators have been presented in shapes such as discs [11], toroids [12], and spheres [13,14]. This paper deals with a new design that was originally made to perform as a strain gauge. The sensor is composed of a PDMS sphere carried on hangers between two stems of silica fiber on the tip of one of the fibers a silica sphere is made as seen in Figure 2. Under this scope, we developed this sensor to measure concentrations of different solutions. In a lot of biomedical applications, high-accuracy concentration is required. In past work, experiments were made using micro-optical silica spheres to detect concentration differences by reading the change in solutions refractive index [15]. This work overcomes the issue of unstable coupling as the coupling is far from the sensing element in the solution.
The two factors that alter the resonant wavelength of the WGM are the radius of the resonator and the refractive indices; of the resonator and the surrounding environment, which may be represented in the following equation
where is the radius of the sphere, is its refractive index, is the mode number and is the wavelength of the light. At resonance, dips are observed in the transmission spectrum as a result of interference. Change in index of refraction or the radius may be represented as follows
As the sensor is dipped in fluid as seen in Figure 3, the only two forces considered acting on are gravity due to its mass and buoyancy force acted by the fluid on the sensing element:
The total force exerted on the silica sphere; that is, the sensing element, then transmitted through the stem to the PDMS resonator. The polymeric resonator in turn is squeezed and its radius is changed resulting in WGM shift. Thus, the buoyancy force is optically measured and the mass is calculated.
Buoyancy force is represented as follows:
where ρ is the density of the solution under investigation, V is the volume of the silica sphere, and g is gravitational acceleration.
Therefore, for calculating the mass of the solute, all that is required are the mass and volume of the sphere and volume of the solution.
3. Experimental Work
3.1. Opto-Electronic Setup
Figure 4 presents the optoelectronic setup that used in the experiment as it is consist of a distributed feedback laser diode (DFB) outputs laser of nominal wavelength of ~1312 nm and power of 5 mW. After passing through a splitter, single-mode optical fibers transfer the split intensities of the laser, 10% as a reference and 90% to be used in the WGM sensor. Photo diodes (PD) are then used to recollect and read both the laser from the system and the reference. A saw tooth function generator driven controller is used to control and tune the current and temperature of the DFB. The outputs of the photo diodes and the function generator are sampled using a 16-bit data-acquisition card (DAQ). A personal computer (PC) is used for the processing display and analysis of the acquired data. The transmission spectrum from the sensor fiber is normalized using the reference 10% signal.
3.2. Experimental Procedure
First of all, a silica sensor was made by melting the tip of a 125-μm diameter, to create a silica sphere using micro-torch. Between the other tip and another fiber, a 10:1 PDMS sphere is made after forming PMMA hangers for support of the liquid polymer. The sensor is put in an oven at 100 °C for two hours to cure. The sensor is mounted on the micro-translation stage and coupled at the PDMS resonator as seen in Figure 5. The silica sensing element is dipped in ethanol and left to dry before each measurement to make sure no impurities are attached to it. A drop of 50 uL of solution in put on an acrylic slide using a micro pipette. The silica sphere was slowly inserted into the drop until fully submerged. Readings were taken three times for each concentration and averages were calculated.
4. Results and Discussion
The experiment was performed on two solutions of NaCl and sucrose in distilled water. Each solute was tested at four different concentrations. Readings were taken using distilled water at the beginning for calibration. The same sensor and coupling were used to carry out all five concentrations of the same chemical. As is clear in Figure 6, a noticeable trend of decreasing shift against increasing concentration was obtained. This can be interpreted as follows: As concentration increases, the density of the solution increases and in turn the buoyancy force, which squeezes the sphere more increasing the radius along which it is coupled and therefore changing the WGM shift. The sensitivity, standard deviation and resolution were calculated as presented in Table 1.
5. Conclusions
In conclusion, a WGM sensor was designed and used as a concentration meter. As the independent sensing element is inserted into a solution, the buoyancy force that is concentration dependent squeezes the sensing element altering its radius and causing a readable WGM shift. This sensor only depends on the change in the resonators radius to read different concentrations unlike our first application in which the effect of the change in surrounding refractive index was used. This sensor design presented high sensitivity and above all overcame the problem of unstable coupling under water.
This can be further used for measuring the concentration levels of sodium in blood to detect hypernatremia or in urine as an assessment for kidney function. Moreover, sugar in blood and urine samples (glycosuria) can be detected using our method to monitor uncontrolled diabetes.
Conflicts of Interest
The authors declare that there is no conflict of interest regarding the publication of this paper.
References
- Ali, A.; Elias, C. Ultra-Sensitive Optical Resonator for Organic Solvents Detection Based on Whispering Gallery Modes. Chemosensors 2017, 5, 19. [Google Scholar] [CrossRef]
- Ioppolo, T.; Ayaz, U.; Ötügen, V. High-resolution force sensor based on morphology dependent optical resonances of polymeric spheres. J. Appl. Phys. 2009, 105, 013535. [Google Scholar] [CrossRef]
- Kozhevnikov, M.; Stepaniuk, V.; Ötügen, V.; Sheverev, V. A micro-optical force sensor concept based on whispering gallery mode resonators. Appl. Opt. 2008, 47, 3009. [Google Scholar]
- Ioppolo, T.; Ötügen, V. Pressure tuning of whispering gallery mode resonators. J. Opt. Soc. Am. B 2007, 24, 2721–2726. [Google Scholar] [CrossRef]
- Guan, G.; Arnold, S.; Ötügen, V. Temperature measurements using a micro-optical sensor based on whispering gallery modes. AIAA J. 2006, 44, 2385. [Google Scholar] [CrossRef]
- Ma, Q.; Rossmann, T.; Guo, Z. Temperature sensitivity of silica micro-resonators. J. Phys. D Appl. Phys. 2008, 41, 245111. [Google Scholar] [CrossRef]
- Ioppolo, T.; Ötügen, V.; Fourguette, D.; Larocque, L. Effect of acceleration on the morphology dependent optical resonances of spherical resonators. J. Opt. Soc. Am. B 2011, 28, 225. [Google Scholar] [CrossRef]
- Ioppolo, T.; Ötügen, V.; Marcis, K. Magnetic field-induced excitation and optical detection of mechanical modes of micro-spheres. J. Appl. Phys. 2010, 107, 123115. [Google Scholar] [CrossRef]
- Ioppolo, T.; Ötügen, V. Magnetorheological polydimethylsiloxane micro-optical resonator. Opt. Lett. 2010, 35, 2037. [Google Scholar] [CrossRef] [PubMed]
- Ali, A.; Ioppolo, T. Effect of Angular Velocity on Sensors Based on Morphology Dependent Resonances. Sensors 2014, 14, 7041. [Google Scholar] [CrossRef] [PubMed]
- Kaproulias, S.; Sigalas, M.M. Whispering gallery modes for elastic waves in disk resonators. AIP Adv. 2011, 1, 041902. [Google Scholar] [CrossRef]
- Hunt, H.K.; Soteropulos, C.; Armani, A.M. Bioconjugation Strategies for Microtoroidal Optical Resonators. Sensors 2010, 10, 9317–9336. [Google Scholar] [CrossRef] [PubMed]
- Ali, A. Development of Whispering Gallery Mode Polymeric Micro-optical Sensors to Detect Chemical Impurities in Water Environment. Recent Adv. Photonics Opt. 2017, 1, 7–15. [Google Scholar]
- Ioppolo, T.; Das, N.; Ötügen, V. Whispering Gallery Modes of Microspheres in the Presence of a Changing Surrounding Medium: A New Ray-Tracing Analysis and Sensor Experiment. J. Appl. Phys. 2010, 7, 103–105. [Google Scholar] [CrossRef]
- Ali, A.R.; Wael, M.; Assal, R.A. Design and Deployment of a Low-Cost Water Quality Monitoring Sensor Using Micro-Optical Resonator. In Proceedings of the Third International Conference on Solar Energy Solutions for Electricity and Water Supply in Rural Areas, Cairo, Egypt, 7–10 November 2018. [Google Scholar]
Figure 1.
Whispering gallery mode schematic with ray optics approximation.
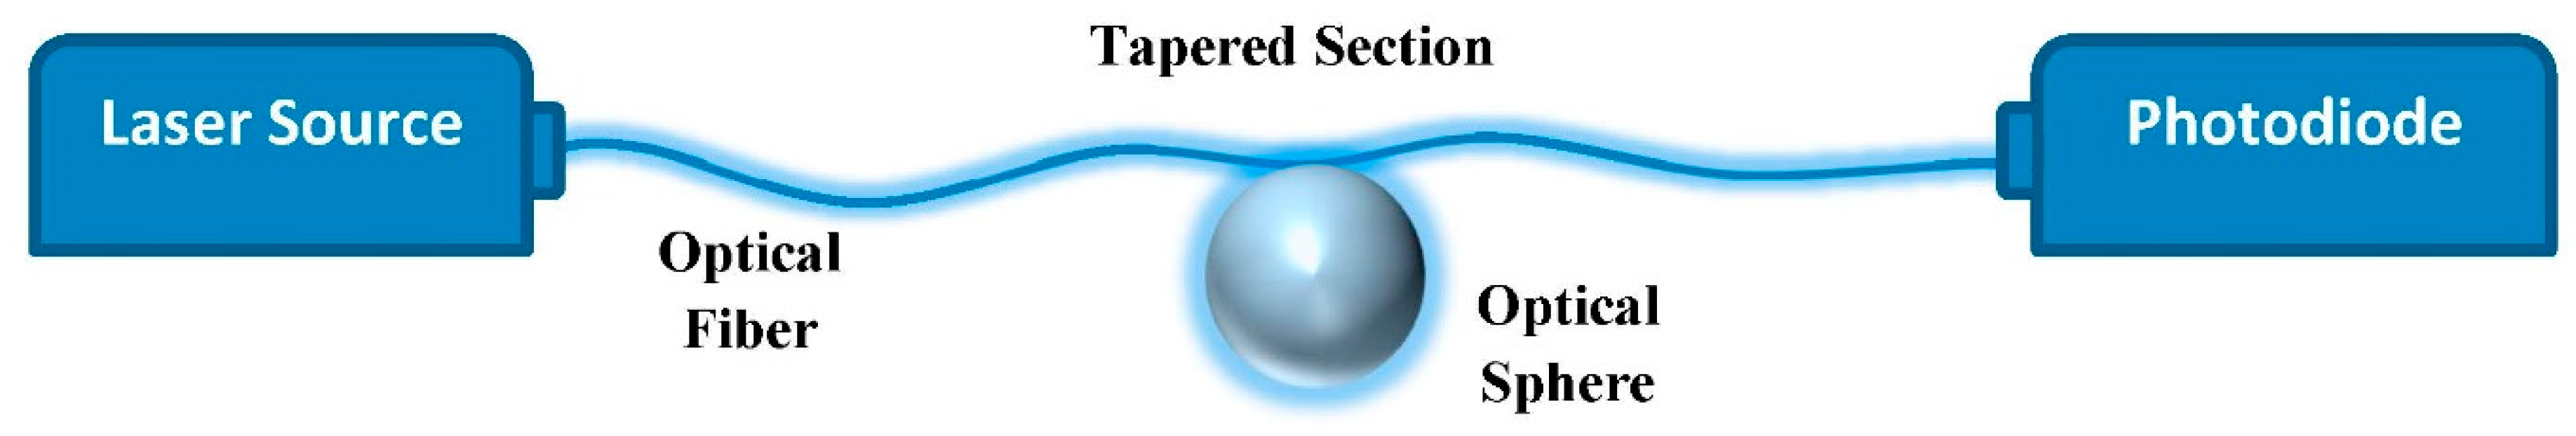
Figure 2.
Sensing polymeric resonator.
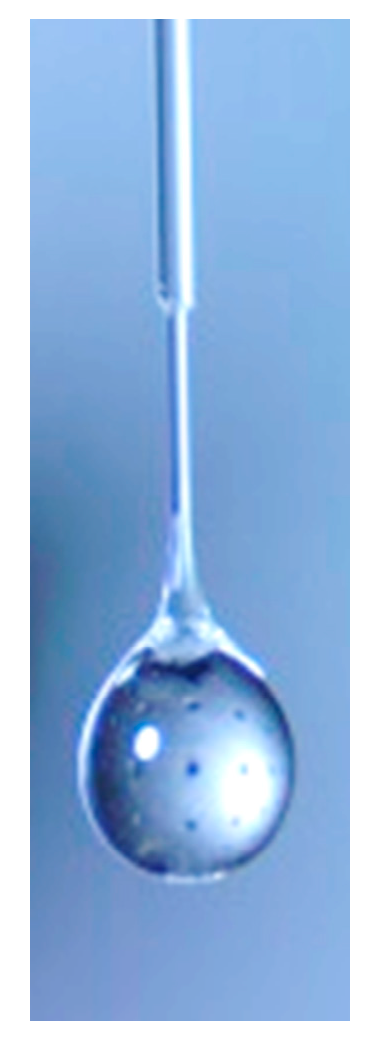
Figure 3.
Acting forces on sensor in solution.

Figure 4.
Schematic for the opto-electronics Setup used in the experiment.
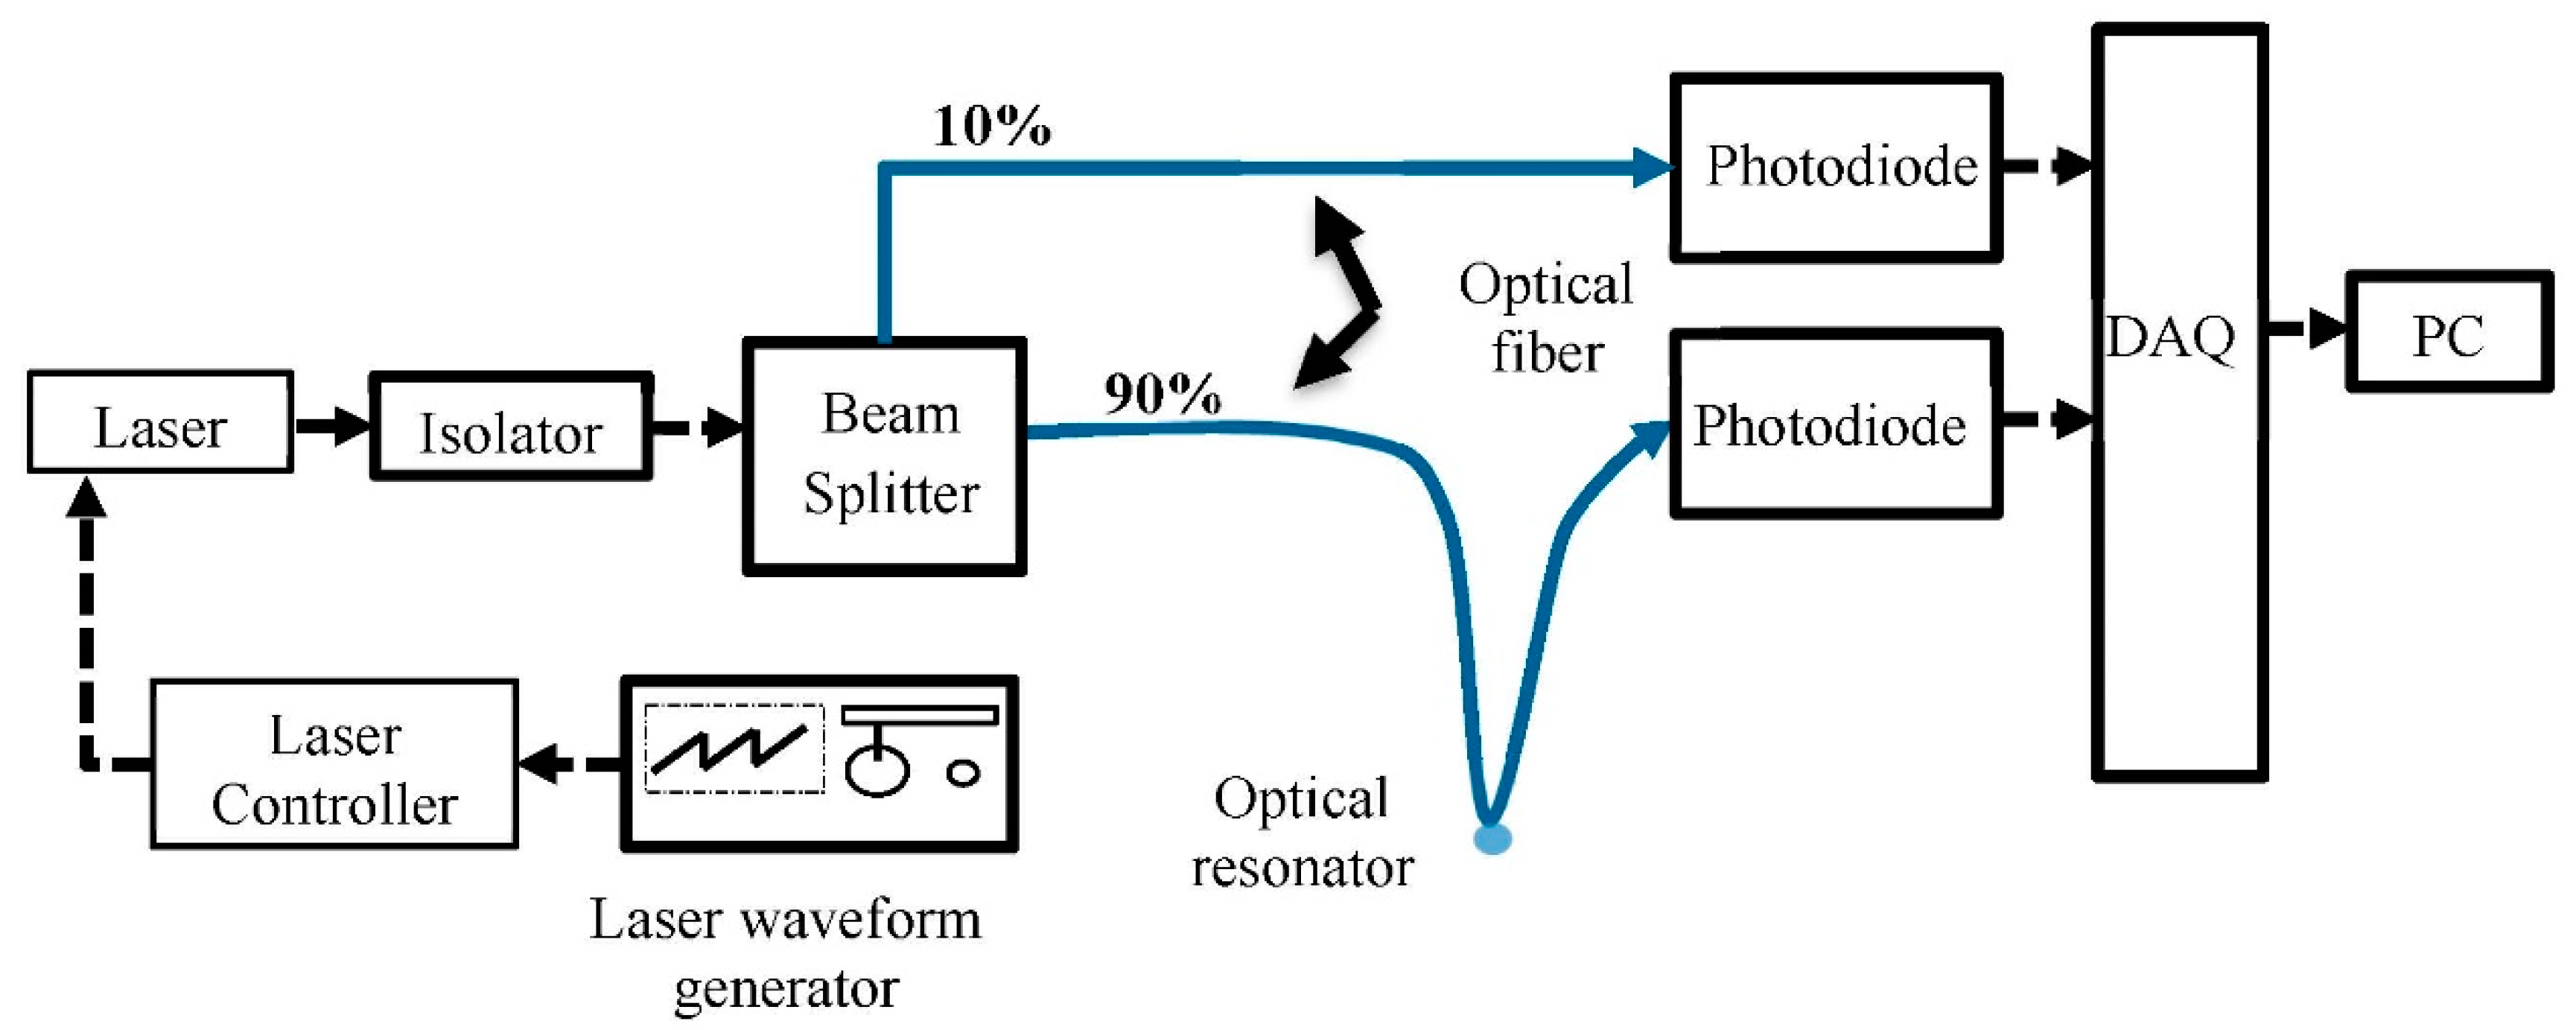
Figure 5.
The setup for the sensing element during its preparation for the experiment.

Figure 6.
Experimental results showing increasing shift with decreasing concentration.


Table 1.
Comparison between sensitivity, standard deviation and resolution for the NaCl and Sucrose.
Table 1.
Comparison between sensitivity, standard deviation and resolution for the NaCl and Sucrose.
| Sensitivity (pm/nN) | Standard Deviation (pm) | Resolution (nN) | |
|---|---|---|---|
| NaCl | 1.09 | 5.85 | 5.37 |
| Sucrose | 2.93 | 23.7 | 8.09 |
Publisher’s Note: MDPI stays neutral with regard to jurisdictional claims in published maps and institutional affiliations. |
© 2020 by the authors. Licensee MDPI, Basel, Switzerland. This article is an open access article distributed under the terms and conditions of the Creative Commons Attribution (CC BY) license (https://creativecommons.org/licenses/by/4.0/).
Share and Cite
MDPI and ACS Style
Ali, A.R.; Wael, M.; Assal, R.A. Deployment and Comparison of a Low-Cost High-Sensitivity Concentration Meters Using Micro-Optical Resonators. Proceedings 2020, 60, 53. https://doi.org/10.3390/IECB2020-07091
AMA Style
Ali AR, Wael M, Assal RA. Deployment and Comparison of a Low-Cost High-Sensitivity Concentration Meters Using Micro-Optical Resonators. Proceedings. 2020; 60(1):53. https://doi.org/10.3390/IECB2020-07091
Chicago/Turabian StyleAli, Amir R., Maram Wael, and Reem Amr Assal. 2020. "Deployment and Comparison of a Low-Cost High-Sensitivity Concentration Meters Using Micro-Optical Resonators" Proceedings 60, no. 1: 53. https://doi.org/10.3390/IECB2020-07091