Proceeding Paper

Changes in the Antioxidant Activity of Peptides Released during the Hydrolysis of Quinoa (Chenopodium quinoa willd) Protein Concentrate †

Centro de Investigaciones Interdisciplinarias en Tecnologías y Desarrollo Social para el NOA (CIITED), CONICET-Facultad de Ingeniería, Universidad Nacional de Jujuy, Ítalo Palanca 10.4600, San Salvador de Jujuy, Argentina
*
Author to whom correspondence should be addressed.
Presented at the 2nd International Conference of Ia ValSe-Food Network, Lisbon, Portugal, 21–22 October 2019.
Proceedings 2020, 53(1), 12; https://doi.org/10.3390/proceedings2020053012
Published: 26 August 2020
(This article belongs to the Proceedings of The 2nd International Conference of Ia ValSe-Food Network)

Abstract

:
There is an increased interest in Andean crops as sources of nutritious compounds. This study evaluated changes in the antioxidant activity of quinoa protein hydrolysate with commercial enzymes. Aliquots at 0, 30, 60, 120 and 180 min were tested for DPPH (2,2′-diphenyl-1-picrylhydrazyl) and ABTS ((2,2′-azino-bis(3-ethylbenzothiazoline-6-sulfonic acid)), antiradical activity. Initial DPPH inhibition rose from 9.2% ± 2.7% to 20.0% ± 4.0% (30 min) when employing alcalase and initial ABTS inhibition increased from 20.9 ± 0.2 to 105.1 ± 3.7 with ascorbic acid µg/mL (30 min). Protamex improved this to 75.7 ± 0.6 µg/mL (180 min). Alcalase and protamex are suitable enzymes for the production of rich peptides and hydrolysates as novel ingredients with antioxidant activity.

1. Introduction

Several plant-derived foods exhibit health benefiting attributes and are suitable for healthy food production. Many of these properties are attributed to proteins and peptides. Peptides can be found in foods as individual parts of proteins or encrypted inside parent proteins.
Peptides and hydrolysates are produced from diverse protein sources. Although animal sources such as milk, eggs and meat proteins are the largest type of products employed, they are not cheap or easily accessible. This has led to an increased interest in vegetable proteins for the manufacturing of such products.
Quinoa has been largely consumed by early Latin American inhabitants and has a long tradition of well-known nutritive properties, now appreciated by different regions around the world [1]. There are few studies showing the potentiality of quinoa protein as substrate for the release of bioactive peptides or hydrolysate as novel ingredients [2]. The scope of this study was to evaluate the potentiality of quinoa for the production of protein concentrate and to select widely available enzymes for the production of protein hydrolysates as functional ingredients with antioxidant activity.

2. Materials and Methods

2.1. Chemicals and Reagents

Chemical and reagents employed were of analytical grade. The following were purchased from Sigma-Aldrich: 2,4,6-trinitrobenzenesulfonic (TNBS) acid solution (5%), L-leucine (≥98% HPLC), alcalase from Bacillus lincheniformis (activity ≥ 2.4 AU/g), flavourzyme from Aspergillus oryzae (activity ≥ 500 LAPU/g) and protamex from Bacillus sp. (activity ≥ 1.5 AU-NH/g). AU is defined as Anson units; LAPU is defined as leucine aminopeptidase units [3]. Reagents 2,2′-diphenyl-1-picrylhydrazyl (DPPH) and 2,2-azino-bis-3-ethylbenzothiazoline-6-sulfonic acid (ABTS) were obtained from Merck Bio and Sigma-Aldrich, respectively. Quinoa seeds (Chenopodium quinoa willd. var INTA Hornillos) were provided by the National Institute of Agricultural and Livestock Technology (INTA-IPAF-NOA-Argentina). The pH was adjusted using NaOH or HCl 0.3 M. Assays were performed in duplicate (n = 2). A two-way ANOVA and the Tukey test (Graph Pad Prism 6.0.) were performed. Significant differences were detected at p < 0.05.

2.2. Quinoa Protein Solubility Study

2.2.1. Quinoa Protein Solubility
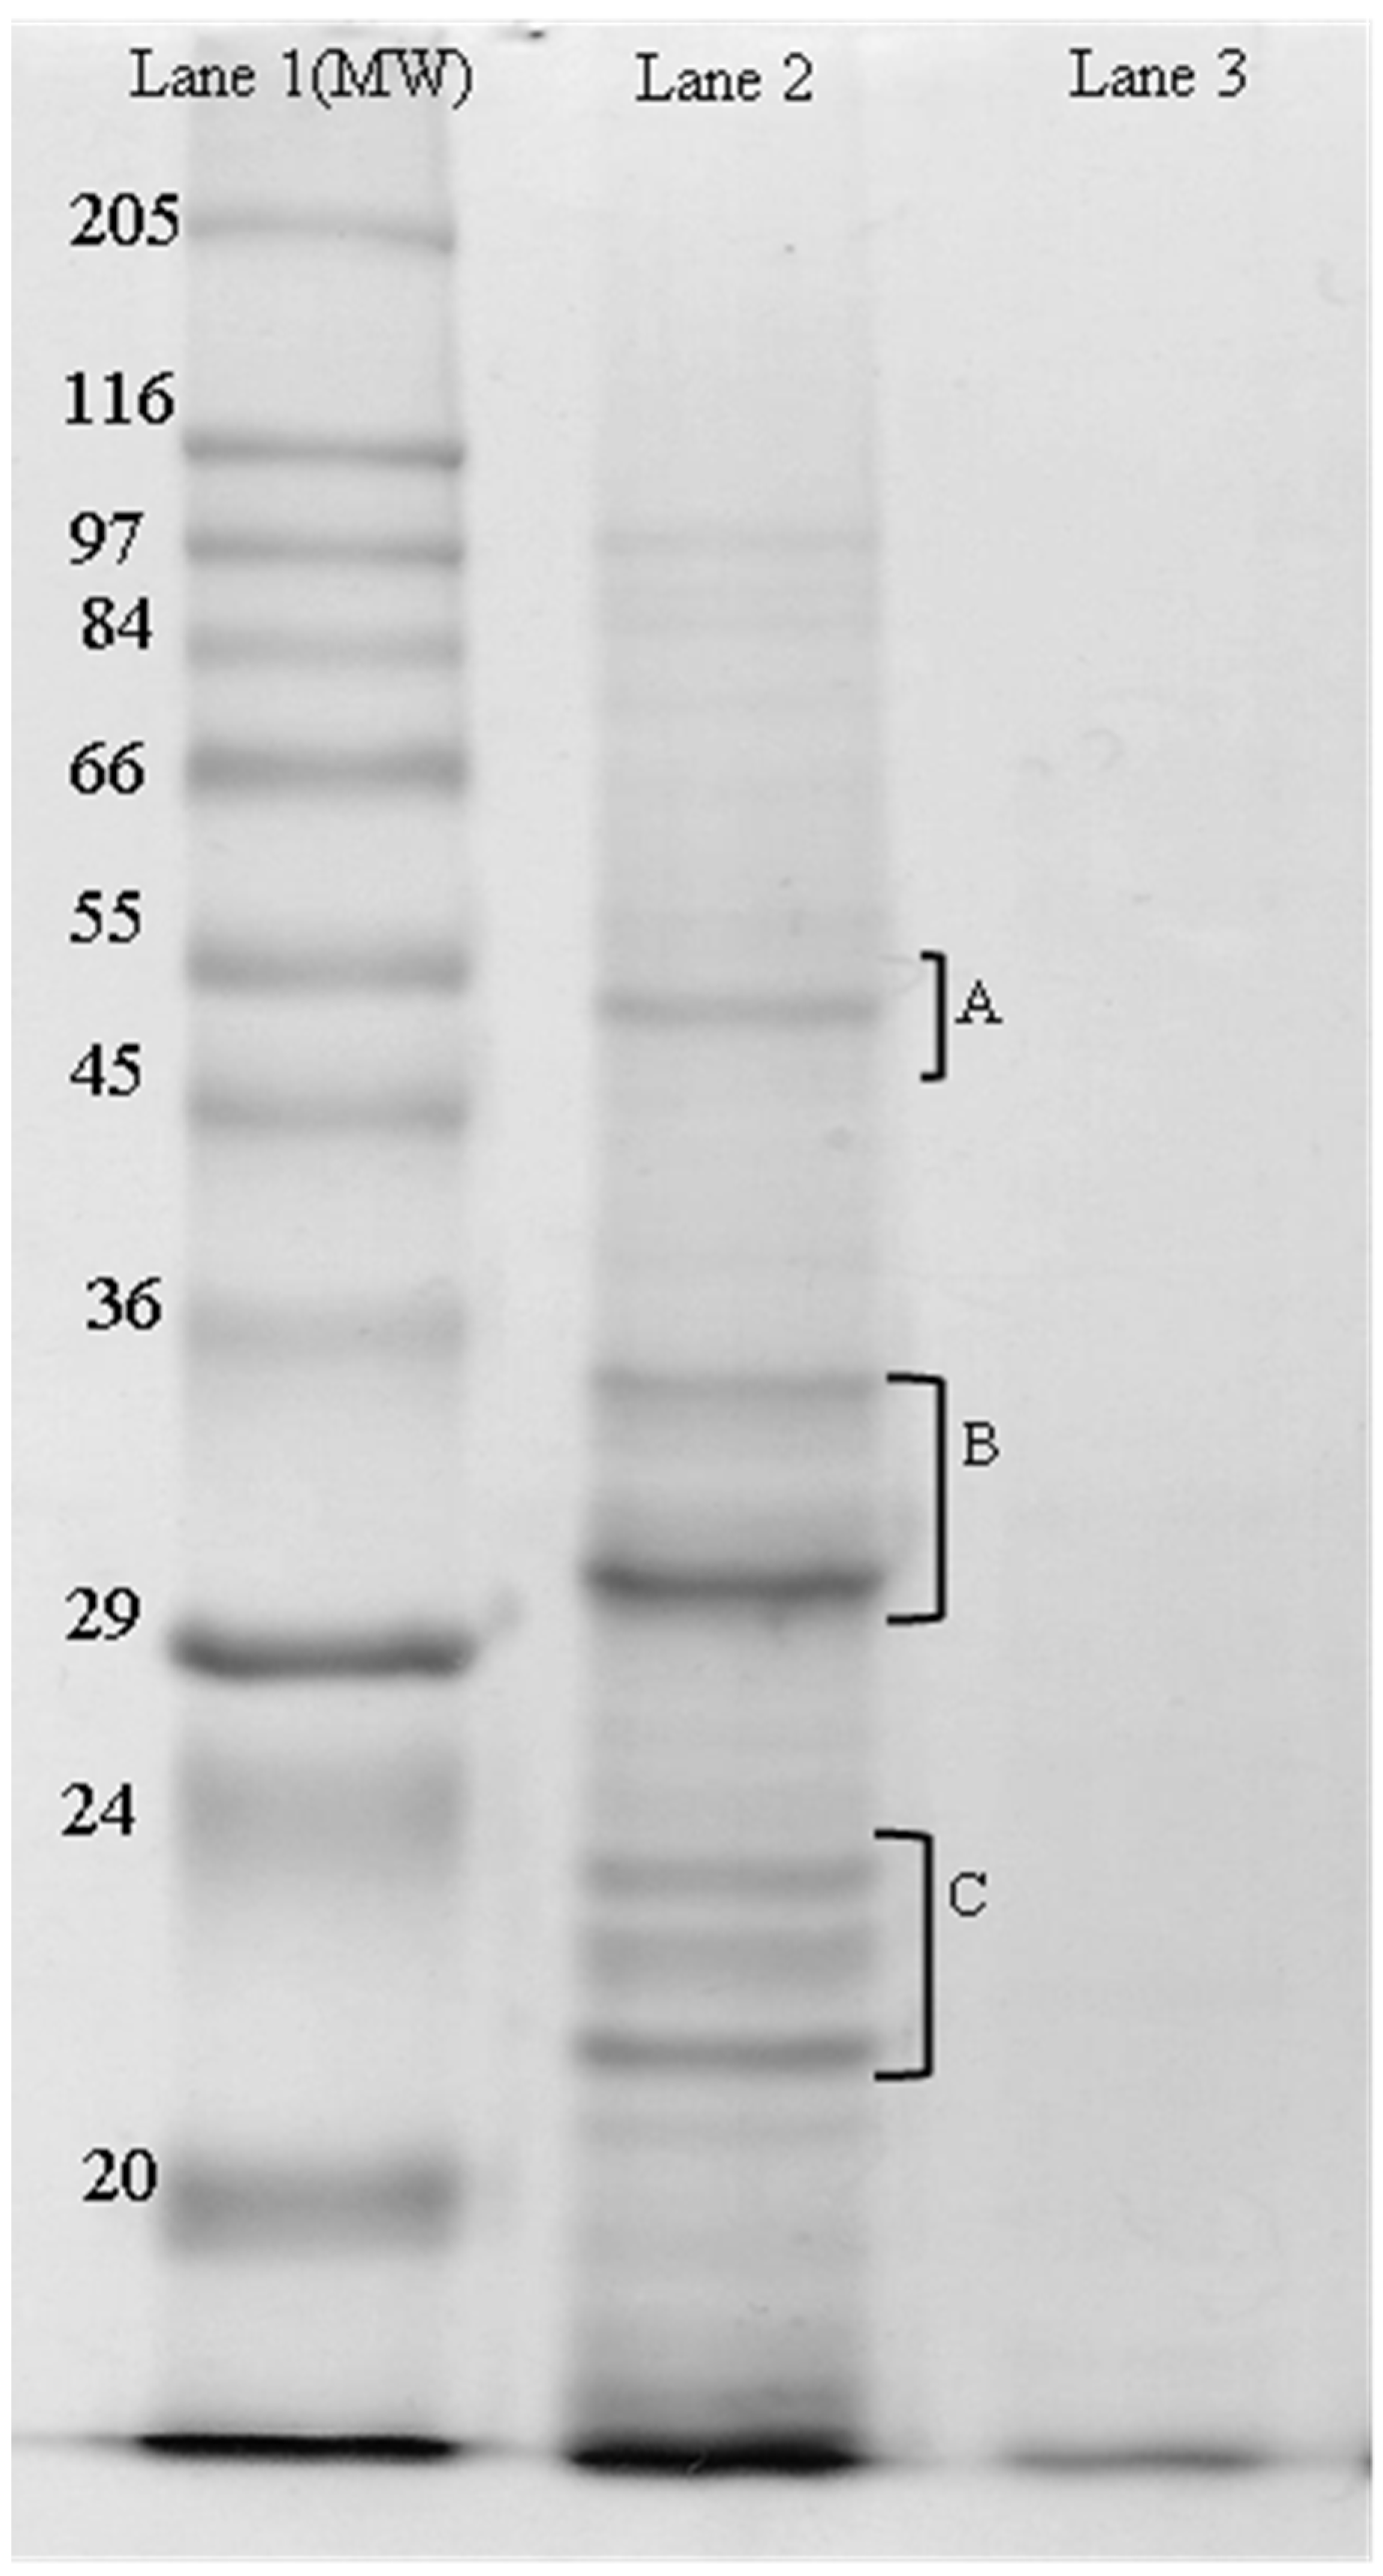
Quinoa grains were ground in a mill and the flour was agitated for 2 h with petroleum ether (1:10 w/v). Protein solubility at different pH levels (212) was determined. Aqueous quinoa flour suspensions (1/10 w/v) were mixed for 20 min, at 30°C and 100 rpm. Proteins were measured at pH 2–12 using bovine serum albumin (BSA) as standard and Bradford′s reagent. Results are expressed as mg BSA equivalents/mL.

2.2.2. SDS-PAGE

Electrophoresis in denaturing conditions was performed using acrylamide stacking (4%) and running (12%) gels. Samples were boiled for 3 min in separating buffer containing 2% SDS, 10% glycerol, 0.01% bromophenol blue, 0.0625 M tris-HCl pH 6.8 and 5% β-mercaptoethanol, loaded (5 µL) onto gels and run at a constant voltage (60 V first 10 min and 120 V) using Laemmli buffer. Gel staining was performed with Coomassie Blue R-250 and destaining was performed in methanol/acetic acid solution (50/20).

2.3. Quinoa Protein Concentrate (QPC)

A proportion of 1:10 (w/v) of defatted flour was agitated at 150 rpm, for 2 h, at 30 °C, at the desired pH, then centrifuged (10,000× g, 10 min), and proteins were precipitated at acid pH. The slurry was refrigerated for 30 min, at 4 °C, and centrifuged (10,000× g, 10 min, 4 °C). The pellet was air-dried in a flux oven (30 °C, 12 h). The protein concentrate was powdered and the protein content (N × 5.7) was determined by the Kjeldahl method.

2.4. Proteolysis

2.4.1. Hydrolysis Conditions

Hydrolysis conditions of quinoa protein (10 mg/mL) at pH 7–10 and temperatures of 40–60 °C were determined. Proteases were added (1/10 w or v/w) and after 10 min, the reaction was stopped (1.0 mL TCA 10%). A blank for each assay was prepared without the enzyme. The slurry was refrigerated (4 °C), for 30 min and centrifuged (15,000× g, 4 °C and 10 min). TCA soluble peptides were determined.

2.4.2. Protease Activity

Alpha amino groups were measured according [4]. Aliquots of 0.1 mL of peptides were mixed with 3.4 mL phosphate buffer pH 8.2 (0.2 M) and 0.5 mL of TNBS 0.05% and incubated in the dark at 50 °C, for 60 min at 200 rpm. The absorbance was measured at 420 nm in a UV-visible spectrophotometer, using leucine as standard. Proteolytic units were expressed as leucine equivalents mM/min (PU/min) [3].

2.4.3. Quinoa Protein Hydrolysates (QPH)

Enzyme and substrate ratio was 1:10. Optimal conditions were adjusted. Aliquots were taken at 0, 30, 60, 120 and 180 min. Enzyme inactivation was performed at 85 °C for 10 min.

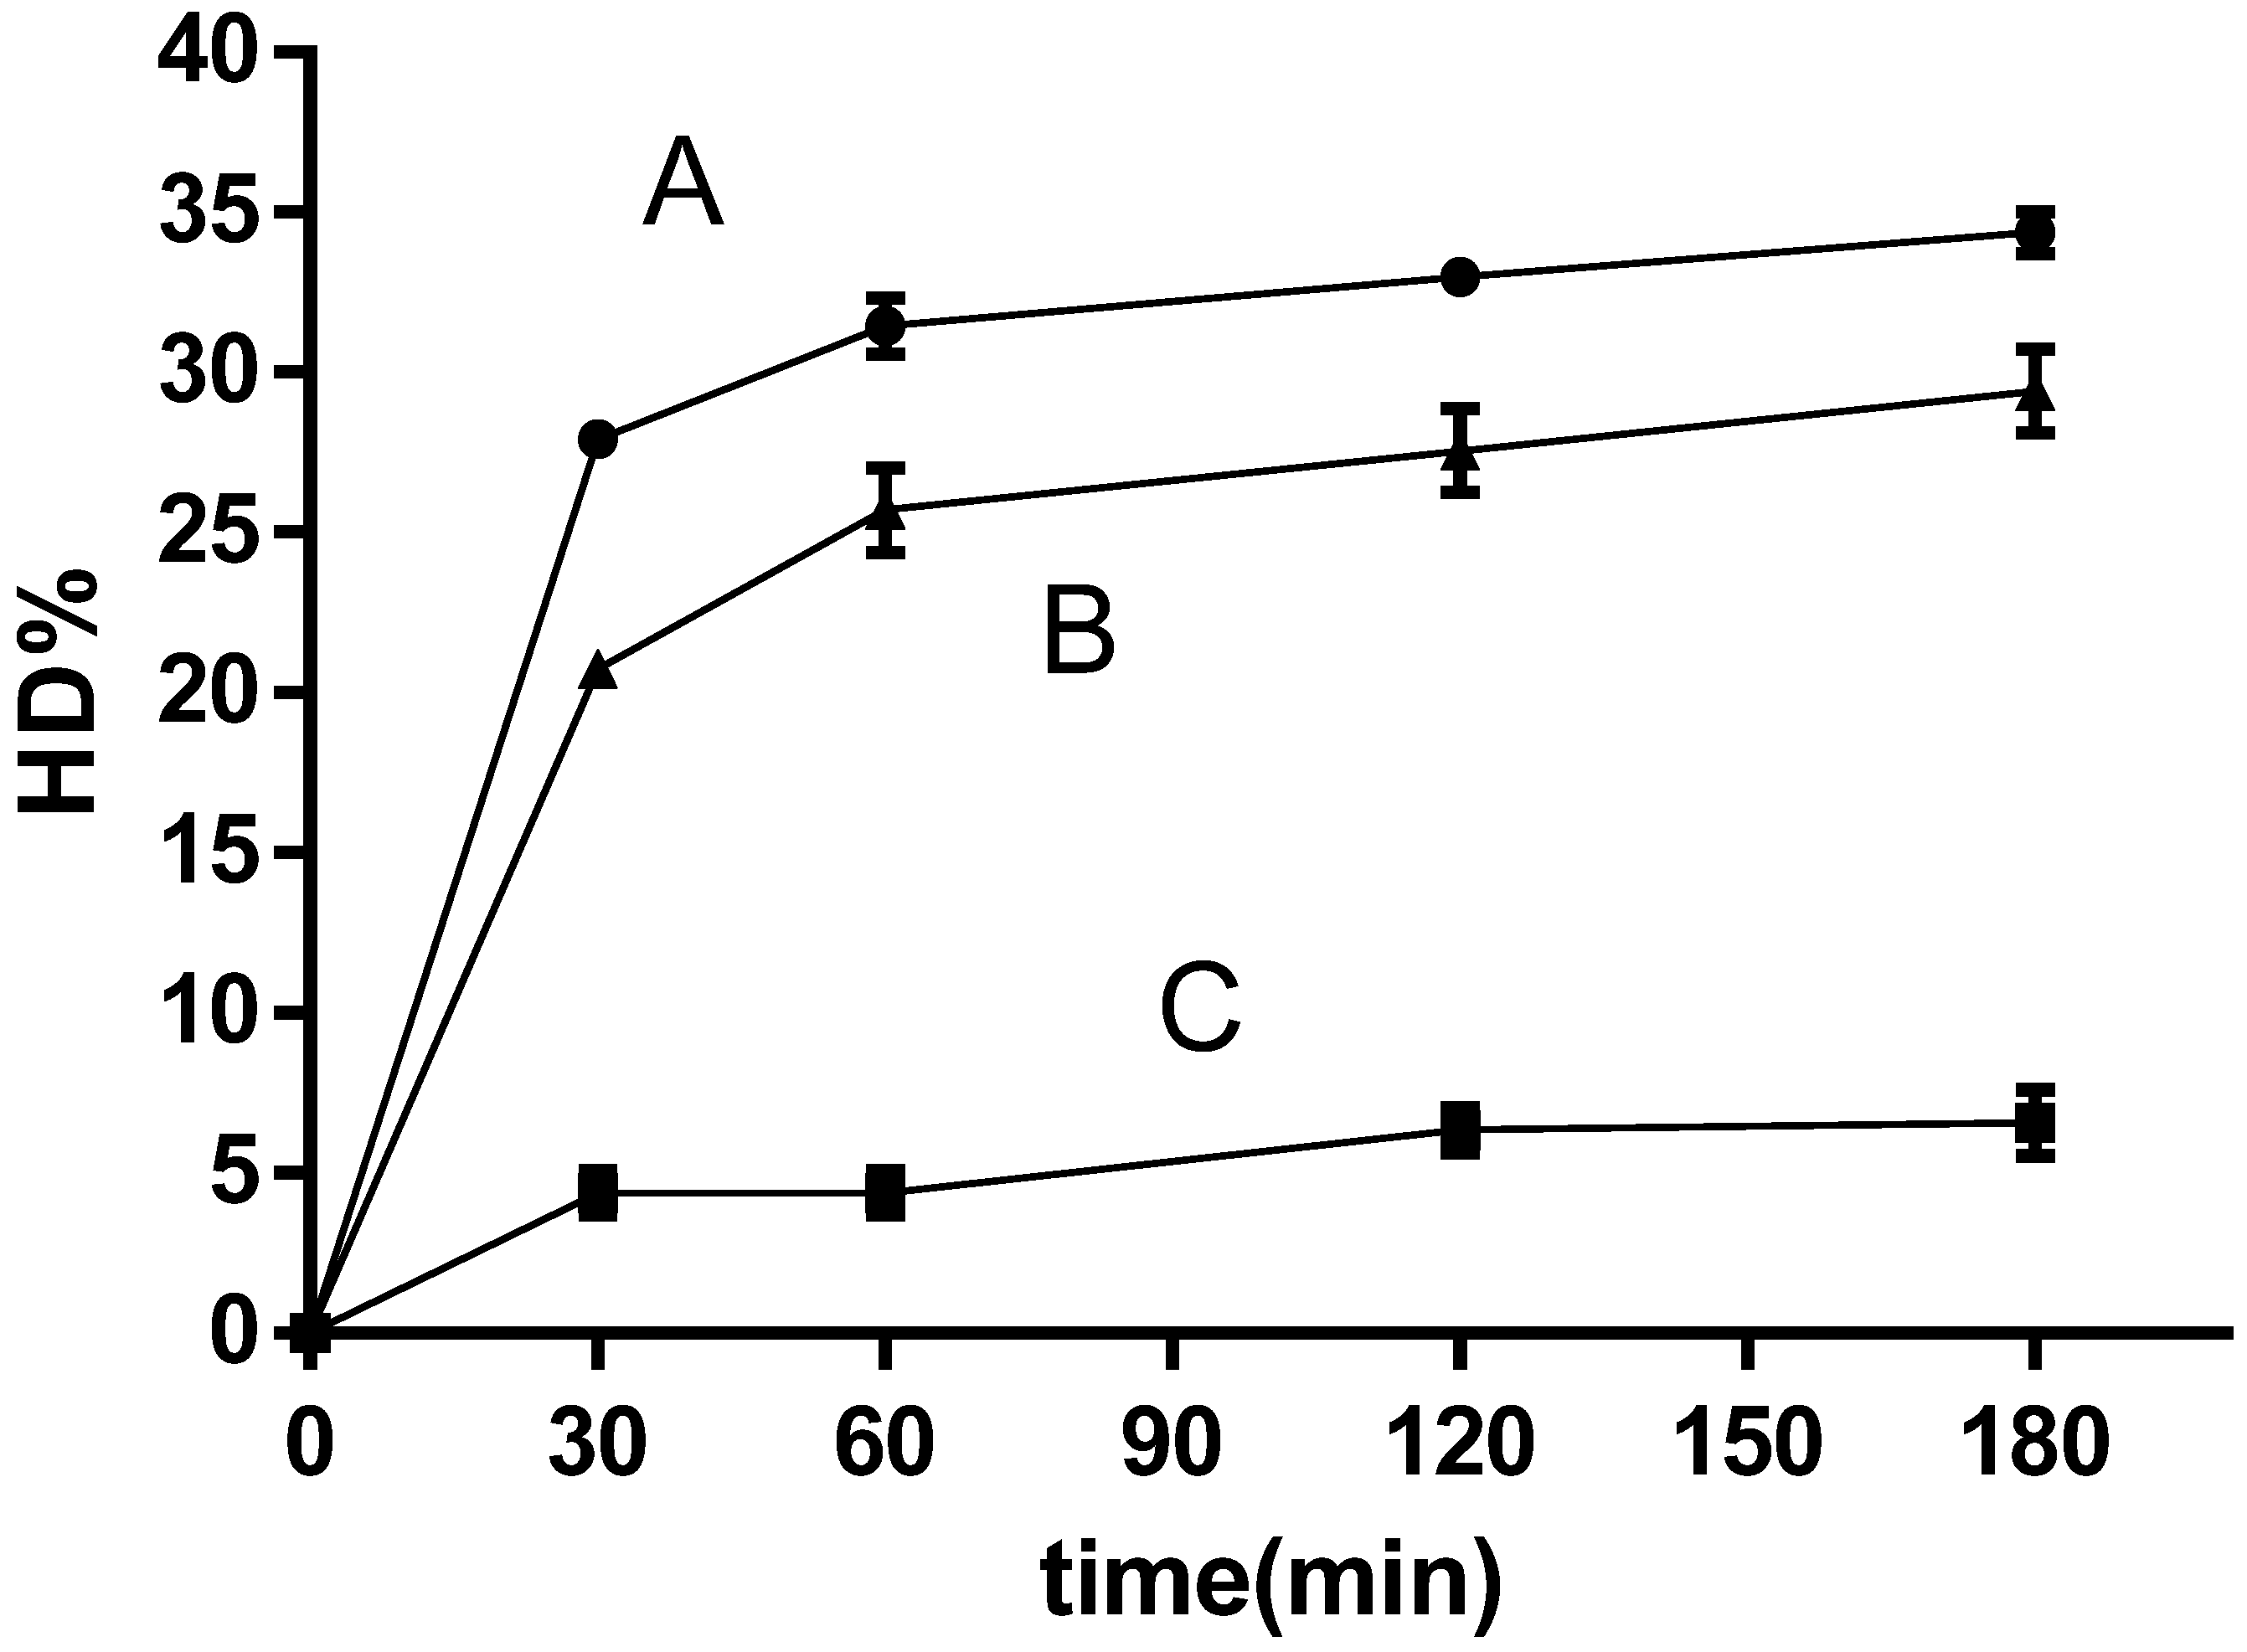
2.4.4. Hydrolysis Degree Calculation

The hydrolysis degree percentage (HD%) was determined as follows:
H D % = B × N b × 1 α × 1 P M × 1 h t o t × 100
htot is the total number of peptide bonds (7.21 miliequivalents/g protein), calculated on the basis of the amino acid occurrence in a local variety of quinoa [5], B is the volume (mL) of base necessary to keep the pH constant, Nb is the normality of the base, α−1 is the calibration factor calculated as the reciprocal of the average degree of dissociation of α-NH amino groups, and PM is the mass of protein (g) in the total reaction.

2.5. Antiradical Activity

2.5.1. Inhibition of Radical DPPH

QPH antiradical properties were tested following the methodology of Chakka et al. [6]. Briefly, 0.1 mL of sample or blank (distillate water) was mixed with 1.4 mL of DPPH at 0.1 mM in anhydrous methanol and incubated 30 min in the dark; absorbance readings were taken at 515 nm in a UV-visible spectrophotometer. The antiradical activity as percentage (ARA) was calculated according the following equation.
A R A   ( % ) = [ 1 ( A s A b ) A c   ] × 100
Ac, As and Ab are absorbance of control, sample and blank, respectively.

2.5.2. Inhibition of Radical ABTS

The radical formed with 2,2′-azinobis (3-ethylbenzothiazoline-6-sulfonic acid) ammonium salt and potassium persulfate was employed. The radical solution was mixed with 50 μL of sample or standard and incubated for 6 min before absorbance reading. A linear calibration curve was prepared using ascorbic acid. Results are expressed as equivalent ascorbic acid µg/mL.

3. Results and Discussion

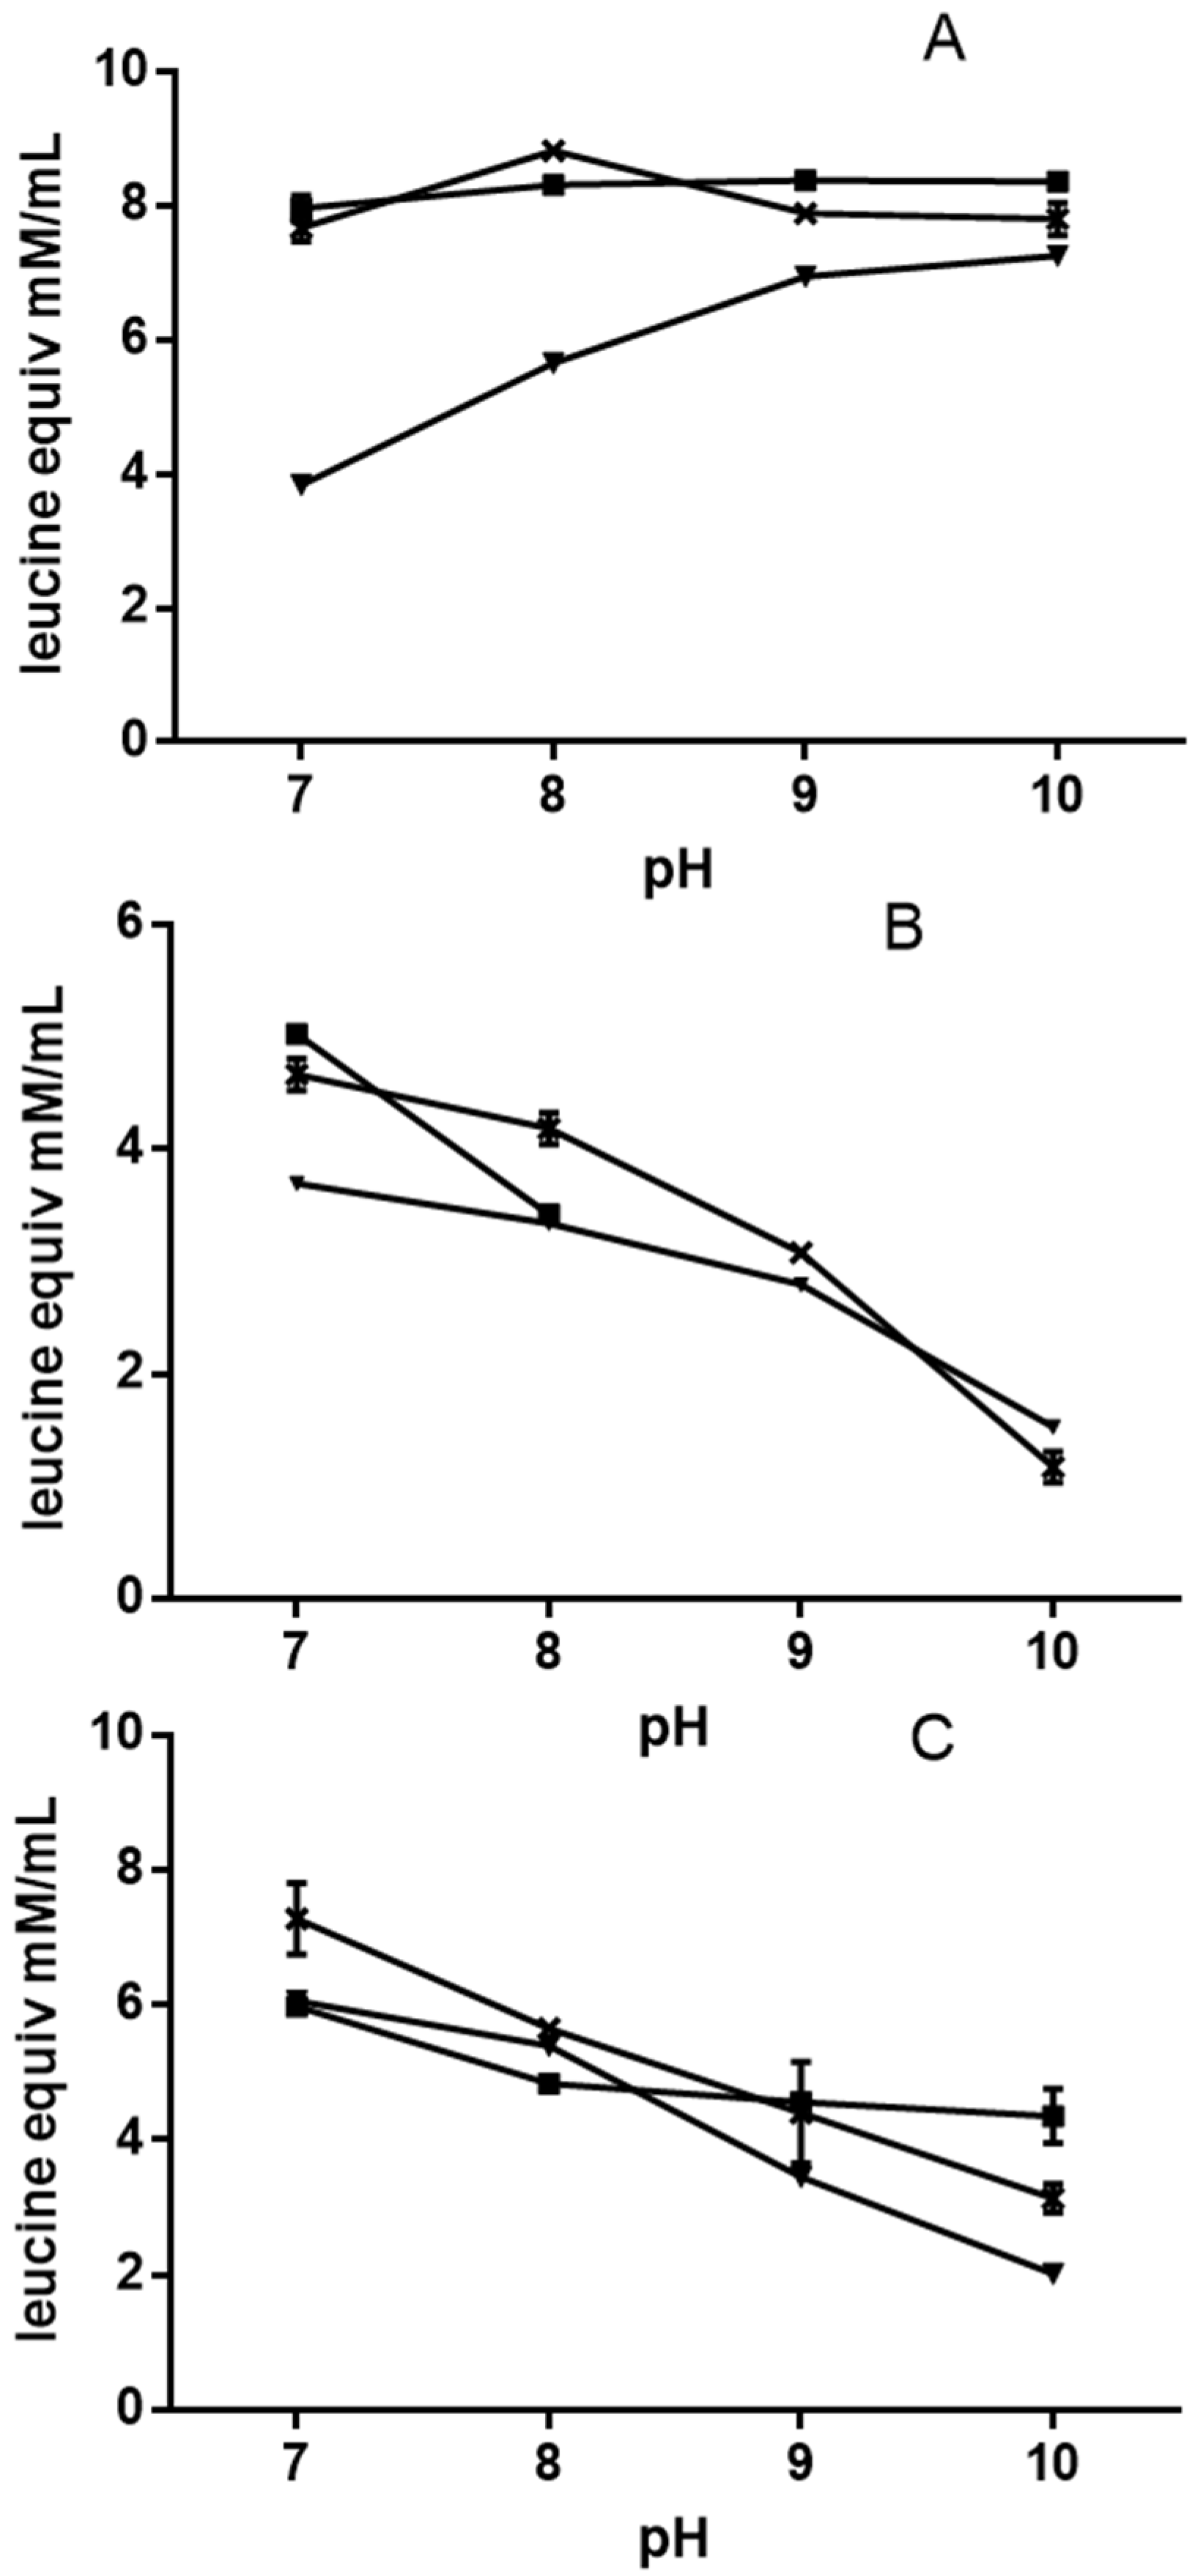
3.1. Quinoa Protein Solubility

Figure 1 shows the protein solubility in a wide range of pH levels; an increase in solubility profile at extreme acid and alkali conditions was observed. The maximal concentrations were measured at pH 9 (13.33 ± 0.71) and 10 (13.41 ± 0.62). Similar results were reported by Elsohaimy et al. [7]. In other Andean crops such as amaranth, pH values of 4 or 5 precipitated most proteins [8], which agrees with this study. The protein content of the concentrate was 61.61% ± 0.43%. This value is higher than the one (40.7% ± 0.9%) found by Nongonierma et al. [2], who employed mashed grains, an extraction time of 60 min compared to 120 min and quinoa defatted flour as starting material, as described in this study. The higher value may be due to the much smaller and homogeneous material employed, which allowed more protein extractability. Higher levels of protein content (65.5 ± 0.1 and 77.2 ± 0.1% w/w) were found in protein concentrates prepared by Aluko and Monu [9] and Abugoch et al. [10].

3.2. Electrophoresis

Figure 2 shows the electrophoretic run of proteins solubilized at pH 9 (lane 2) and 4 (lane3). While lane 3 shows no protein bands, indicating that the solubilized protein meets its isoelectric point, the pattern of proteins solubilized at pH 9 (lane 2) exhibits polypeptides of high molecular weight, ranging from 100.0 to 24.5 kDa. Major bands of polypeptides are estimated in molecular weights of 45,700 (A), 32,000–28,700 (B) and 25,900–24,480 (C) kDa. These sets of polypeptides have been initially described by Brinegar and Goudan [11] and recently by Vilcacundo et al. [1].
The polypeptides belong to the main constituent protein in quinoa, chenopodin. Each group (B and C) is composed of subunits bonded by disulfide bonds. In Figure 2, bands B and C correspond respectively to the acidic and basic polypeptides found in 11S-type globulin family proteins. The 45,000 kDa protein appearing in Figure 2 may be a chenopodin A-B protein with a strong disulfide bond still remaining after reductive SDS-PAGE conditions; bands appearing under 20 kDa have been described as 2S type proteins present in many seeds, albumins mainly. Concerning amino acid composition, it has been reported that chenopodin exceeds the Food and Agriculture Organization(FAO) requirements and has a high chemical score [11].

3.3. Hydrolysis Conditions

Figure 3 shows the leucine equivalents at different conditions of pH and temperature, using quinoa protein as substrate. Figure 3B (flavourzyme) and Figure 3C (protamex) show an increase in the protease activity towards neutral conditions for all temperatures and pH levels. Flavourzyme showed no activity at pH 9–10, at 60 °C. On the other hand, alcalasa (Figure 3A) was very active at all pH levels and temperatures. Its activity increased noticeably as the medium turned alkaline. This increase was gradual at 40 °C but high and constant at 50 or 60 °C. Optimal conditions and proteolytic units (PU) are summarized in Table 1, solubilized from defatted flour 1:10 w/v in aqueous suspensions. Alkali and acid media were regulated with NaOH or HCl.
The optimal values of temperature found (flavourzyme and protamex) differ from those employed by Jung et al. [12]. This change could be attributed to the substrate type, enzyme: substrate ratio and conditions of reaction employed for the hydrolysis.

3.4. Quinoa Protein Hydrolysis

As shown in Figure 4, the hydrolysis of quinoa protein follows an enzyme dependent hydrolysis pattern. Curves show a high rate of hydrolysis in the first 30 min with alcalsa (27.9%) and protamex (20.7%) and evolves at low velocity for flavourzyme (4.3%). Thamnarathip et al. [13] achieved 13–14 HD% by employing alcalasa, flavourzyme and rice bran protein after 6 h.

3.5. Antiradical Activity

Table 2 compares the antiradical activity measured by ABTS and DPPH methods as the hydrolysis progresses. DPPH antiradical activity with alcalasa was higher than that obtained with flavourzyme and protamex. From initial values of 9.3% ± 0.2%, alcalase increased activity to 20.0% ± 4.0% after 30-min hydrolysis. DPPH inhibition with flavourzyme and protamex decreased or remained fairly constant as the hydrolysis degree increased, with 14% being the average highest value after 180 min.
ABTS measurements were remarkably different among the enzymes employed. From initial values of 20.9 ± 0.2 ascorbic acid µg equivalents/mL of the non-hydrolyzed protein, the antioxidant activity increased to 105.1 ± 0.1 (30 min) and to 75.7 ± 0.6 µg/mL (180 min) using alcalasa and protamex, respectively. Flavourzyme reduced the antioxidant activity. Differences in the activities measured by the mentioned methods may be related to the solubility of the antioxidant compounds in the organic (methanol) and aqueous phases employed. This could be related to lipophilic and hydrophilic peptides and also to the low molecular weight.

4. Conclusions

Results reported here show quinoa as a promising source for the production of protein concentrates and protein hydrolysates with potential antioxidant activity and the formulation of novel food ingredients with bioactive properties. Moreover, commercial enzymes were assayed from the hydrolysis of quinoa protein and the release of peptides, alcalasa and protamex being preferable for the hydrolysis of chenopodin at high rates in practically short times of reaction. Additional work needs to be performed in order to characterize the peptides responsible for the potential bioactivity.

Acknowledgments

This work was supported by grant Ia ValSe-Food-CYTED (119RT0567), Consejo Nacional de Investigaciones Científicas y Técnicas (CONICET) and Secretaría de Ciencia y Técnica y Estudios Regionales (SECTER), Universidad Nacional de Jujuy, Argentina.

References

  1. Vilcacundo, R.; Martínez-Villaluenga, C.; Hernández-Ledesma, B. Release of dipeptidyl peptidase IV, α-amylase and α-glucosidase inhibitory peptides from quinoa (Chenopodium quinoa Willd.) during in vitro simulated gastrointestinal digestion. J. Funct. Foods 2017, 35, 531–539. [Google Scholar] [CrossRef]
  2. Nongonierma, A.B.; Le Maux, S.; Dubrulle, C.; Barre, C.; FitzGerald, R.J. Quinoa (Chenopodium quinoa Willd.) protein hydrolysates with in vitro dipeptidyl peptidase IV (DPP-IV) inhibitory and antioxidant properties. J. Cereal Sci. 2015, 65, 112–118. [Google Scholar] [CrossRef]
  3. Navarrete del Toro, M.A.; García-Carreño, F.L. Evaluation of the Progress of Protein Hydrolysis. Curr. Protoc. Food Anal. Chem. 2003, 10, B2.2.1–B2.2.14. [Google Scholar] [CrossRef]
  4. Schokker, E.P.; van Boekel, A.J.S. Kinetic Modeling of Enzyme Inactivation: Kinetics of Heat Inactivation at 90–110 °C of Extracellular Proteinase from Pseudomonas fluorescens 22F. J. Agric. Food Chem. 1997, 45, 4740–4747. [Google Scholar] [CrossRef]
  5. Mota, C.; Santos, M.; Mauro, R.; Samman, N.; Matos, A.S.; Torres, D.; Castanheira, I. Protein content and amino acids profile of pseudocereals. Food Chem. 2016, 193, 55–61. [Google Scholar] [CrossRef] [PubMed]
  6. Chakka, A.K.; Elias, M.; Jini, R.; Sakhare, P.Z.; Bhaskar, N. In-vitro antioxidant and antibacterial properties of fermentatively and enzymatically prepared chicken liver protein hydrolysates. J. Food Sci. Technol. 2015, 52, 8059–8067. [Google Scholar] [CrossRef] [PubMed]
  7. Elsohaimy, S.A.; Refaay, T.M.; Zaytoun, M.A.M. Physicochemical and functional properties of quinoa protein isolate. Ann. Agric. Sci. 2015, 60, 297–305. [Google Scholar] [CrossRef]
  8. Martínez, E.N.; Añón, M.C. Composition and structural characterization of amaranth protein isolates. An electrophoretic and calorimetric study. J. Agric. Food Chem. 1996, 44, 2523–2530. [Google Scholar] [CrossRef]
  9. Aluko, R.E.; Monu, E. Functional and Bioactive Properties of quinoa seed protein hydrolysates. Food Chem. Toxicol. 2003, 68, 1254–1258. [Google Scholar] [CrossRef]
  10. Abugoch, L.E.; Romero, N.; Tapia, C.A.; Silva, J.; Rivera, M. Study of some physicochemical and functional properties of quinoa (Chenopodium quinoa Willd) protein isolates. J. Agric. Food Chem. 2008, 56, 4745–4750. [Google Scholar] [CrossRef] [PubMed]
  11. Brinegar, C.; Goundan, S. Isolation and characterization of chenopodin, the 11S seed storage protein of quinoa (Chenopodium quinoa). J. Agric. Food Chem. 1993, 41, 182–185. [Google Scholar] [CrossRef]
  12. Jung, K.; Karawita, R.; Heo, S.J.; Lee, B.J.; Kim, S.K.; Jeon, Y.J. Recovery of a novel Ca-binding peptide from Alaska Pollack (Theragra chalcogramma) backbone by pepsinolytic hydrolysis. Process Biochem. 2006, 41, 2097–2100. [Google Scholar] [CrossRef]
  13. Thamnarathip, P.; Jangchud, K.; Jangchud, A.; Nitisinprasert, S.; Tadakittisarn, S.; Vardhanabhuti, B. Extraction and characterisation of Riceberry bran protein hydrolysate using enzymatic hydrolysis. Int. J. Food Sci. Technol. 2016, 51, 194–202. [Google Scholar] [CrossRef]
Figure 1. Quinoa protein solubility at different pH values. Obtained from aqueous suspensions of defatted flour (1:10 w/v) maintained at a constant pH (NaOH or HCl) for 10 min at 30 °C and 100 rpm. n = 2. Values (mean ± SD) are expressed as bovine serum album equivalents mg/mL.
Proceedings 53 00012 g001
Figure 2. SDS-PAGE characterization of quinoa proteins soluble at pH 9 (lane 2) and pH 4 (lane 3). MW: molecular weight marker; A: 7S globulin 45 kDa; B: globulin acid subunit; C: globulin basic subunit.
Proceedings 53 00012 g002
Figure 3. Leucine equivalents produced at different pH levels and temperatures by three enzymes (substrate enzyme ratio 1:10). (A) alcalase; (B) flavourzyme; (C) protamex. Temperatures: 40 °C (▼); 50 °C (×); 60 °C (■). Results (mean ± SD) are expressed as mM/mL of supernatant after 10 min of hydrolysis (n = 2).
Proceedings 53 00012 g003
Figure 4. Hydrolysis degree progression of quinoa protein concentrate in aqueous suspension (10 mg/mL) using different enzymes (substrate enzyme ratio 1:10). Data are expressed as percentage (mean ± SD) of peptide bonds cleaved at defined time (min).
Proceedings 53 00012 g004
Table 1. Experimental proteolytic units (PU) and optimal temperature and pH for the hydrolysis of quinoa protein concentrate.
EnzymeTemperaturepHPU/min
Alcalasa508220
Flavoruzyme607125
Protamex507182
PU/min: Proteolytic units expressed as leucine equivalents mM/min.
Table 2. Antiradical activity of quinoa protein hydrolyzates at different times of hydrolysis.
Time (min)AlcalaseFlavourzymeProtamex
ABTS
(asc. ac./mL)
DPPH
(% inhib)
ABTS
(asc. ac./mL)
DPPH
(% inhib)
ABTS
(asc. ac./mL)
DPPH
(% inhib)
020.9±0.2c9.3±2.7a20.9±0.2a9.3±2.7a20.9±0.2d9.3±2.7a
30105.1±3.7b20.0±4.0b10.9±0.3b9.6±1.0a42.8±1.4c11.3±3.0a
60110.9±1.3ab11.78±1.4ab15.1±0.5b9.4±0.5a50.0±1.2c12.3±3.3a
120102.9±2.4b10.8±2.5a15.3±0.6b4.0±0.9a60.1±2.6b14.1±0.7a
180119.19±8.7a7.6±6.2a12.7±2.0b14.8±2.4b75.7±0.6a12.5±1.3a
ABTS expressed as ascorbic acid μg equivalents/mL of hydrolyzate; DPPH expressed as percentage of inhibition of 0.1 mL of hydrolyzate. Values followed by the same letter within each column are not significantly different, p > 0.05.
Publisher’s Note: MDPI stays neutral with regard to jurisdictional claims in published maps and institutional affiliations.

