Exploring the Effect of Pacing Plan Feedback for Professional Road Cycling †


1
Multi-Actor Systems, TU Delft, 2628BX Delft, The Netherlands
2
HIT Lab NZ, University of Canterbury, 8140, Christchurch, New Zealand
3
BioMechanical Engineering, TU Delft, 2628CD Delft, The Netherlands
4
Department of Human Movement Sciences, Faculty of Behavioural and Human Movement Sciences, Amsterdam Movement Sciences, Vrije Universiteit Amsterdam, 1081BT Amsterdam, The Netherlands
*
Author to whom correspondence should be addressed.
†
Presented at the 13th conference of the International Sports Engineering Association, Online, 22–26 June
2020.
Proceedings 2020, 49(1), 58; https://doi.org/10.3390/proceedings2020049058
Published: 15 June 2020
(This article belongs to the Proceedings of The 13th Conference of the International Sports Engineering Association)
Abstract
:In road cycling, cyclists strategically use their energetic resources in unique race-specific circumstances. For time-trial events, professional cycling teams design pacing plans aimed at the effective management of anaerobic work capacities of individual cyclists, allowing for more consistent speeds and therefore, faster times. Patently, adherence to such plans is essential. This paper reports on a field user-study on the effectiveness of providing a pacing plan to cyclists with the following information: (1) printed table alongside a display device with non-processed information (power, distance); and (2) aggregated, processed, just-in-time information on the same device (past, present, prospective; power, distance, W’). In both conditions, 15 road cyclists completed an 8 km open route mimicking race conditions, while adhering to pre-set pacing plans designed relative to their individual critical-power capabilities. Results indicated a linear load-to-adherence relationship and better adherence in condition (2). These findings will help guide future designs of adaptive feedback mechanisms for professional road cycling.
1. Introduction
Beyond great strength and stamina, professional road cycling requires an appropriate strategy to effectively use a cyclist’s physical capabilities in race-specific circumstances [1]. A cyclist can generate power aerobically, and beyond a certain threshold anaerobically—with the latter being a finite resource and requiring rest to replenish, and thus prudent use thereof, a strategy known as pacing. Achieving optimal race results is accomplished by riding at a consistent speed (irrespective of environmental factors, e.g., climbs, corners), which requires a cyclist to vary their power output accordingly—pushing uphill, recovering downhill, in anticipation of the next climb.
In pursuit of podia, professional cycling teams prepare their cyclists by running simulations [2,3,4,5] and generating pacing plans [6], particularly for individual time trials in which cyclists lack the aerodynamic benefit of the peloton. Simplified instructions are shared with cyclists prior to the race, and the pacing plan’s execution is tracked and modified with adjustments relayed from the coach car. The required radio communication has become contentious [7], and with regulation moving to oppose it, adherence to pre-made pacing plans is gaining in importance. Based on informal interviews, cyclists from a partnered UCI (Union Cycliste Internationale) World Tour team have reported that traditional, printed plans are difficult to adhere to. Teams are looking for more reliable and effective delivery of information, as minor deviations from a pre-determined strategy may have a cumulative effect given a cyclist’s finite anaerobic capacity (W’).
Decision-making in road cycling has been shown to benefit from effective feedback [8]. While current sensor technology has become more accessible and vast data collection more prevalent, and while models are available to translate said data into pacing insights [9], these are seldom used in race events in real-time, neither by coaches nor by the cyclists themselves.
This paper documents exploratory research aimed at understanding the behaviour of cyclists in attempting to follow a pacing plan, given two different types of information, focussing on factors affecting adherence. With the goal of supporting cyclists from a partnered professional cycling team, this exploratory field user-study examines the behaviour of serious amateurs. Insights gleaned herein will guide future designs and studies on effective adaptive feedback systems for professional cycling.
Adherence of participants is expected to be better when provided with aggregated information, based on knowledge of past performance [8]. Such information is expected to influence cyclists’ performance, e.g., compensate after coasting through corners. Furthermore, decreasing the cognitive task load is expected to result in more confidence in taking corners at high speed.
The adherence is further expected to differ depending on the expected performance in the proposed pacing plan. Lastly, with regard to cyclist’s experience, the adherence in use of the two conditions are expected to differ less for experienced cyclists as they are likely to have better developed internal feedback [10], and more experience relying on non-processed information.
2. Materials and Methods
The study set out to investigate the decision-making behaviour of cyclists with respect to two different types of information from a pacing plan provided in two conditions (detailed below): (1) traditional: a printed table alongside a display device with non-processed information; and (2) aggregated, processed, just-in-time information presented on the same type of device.
2.1. Experiment Design
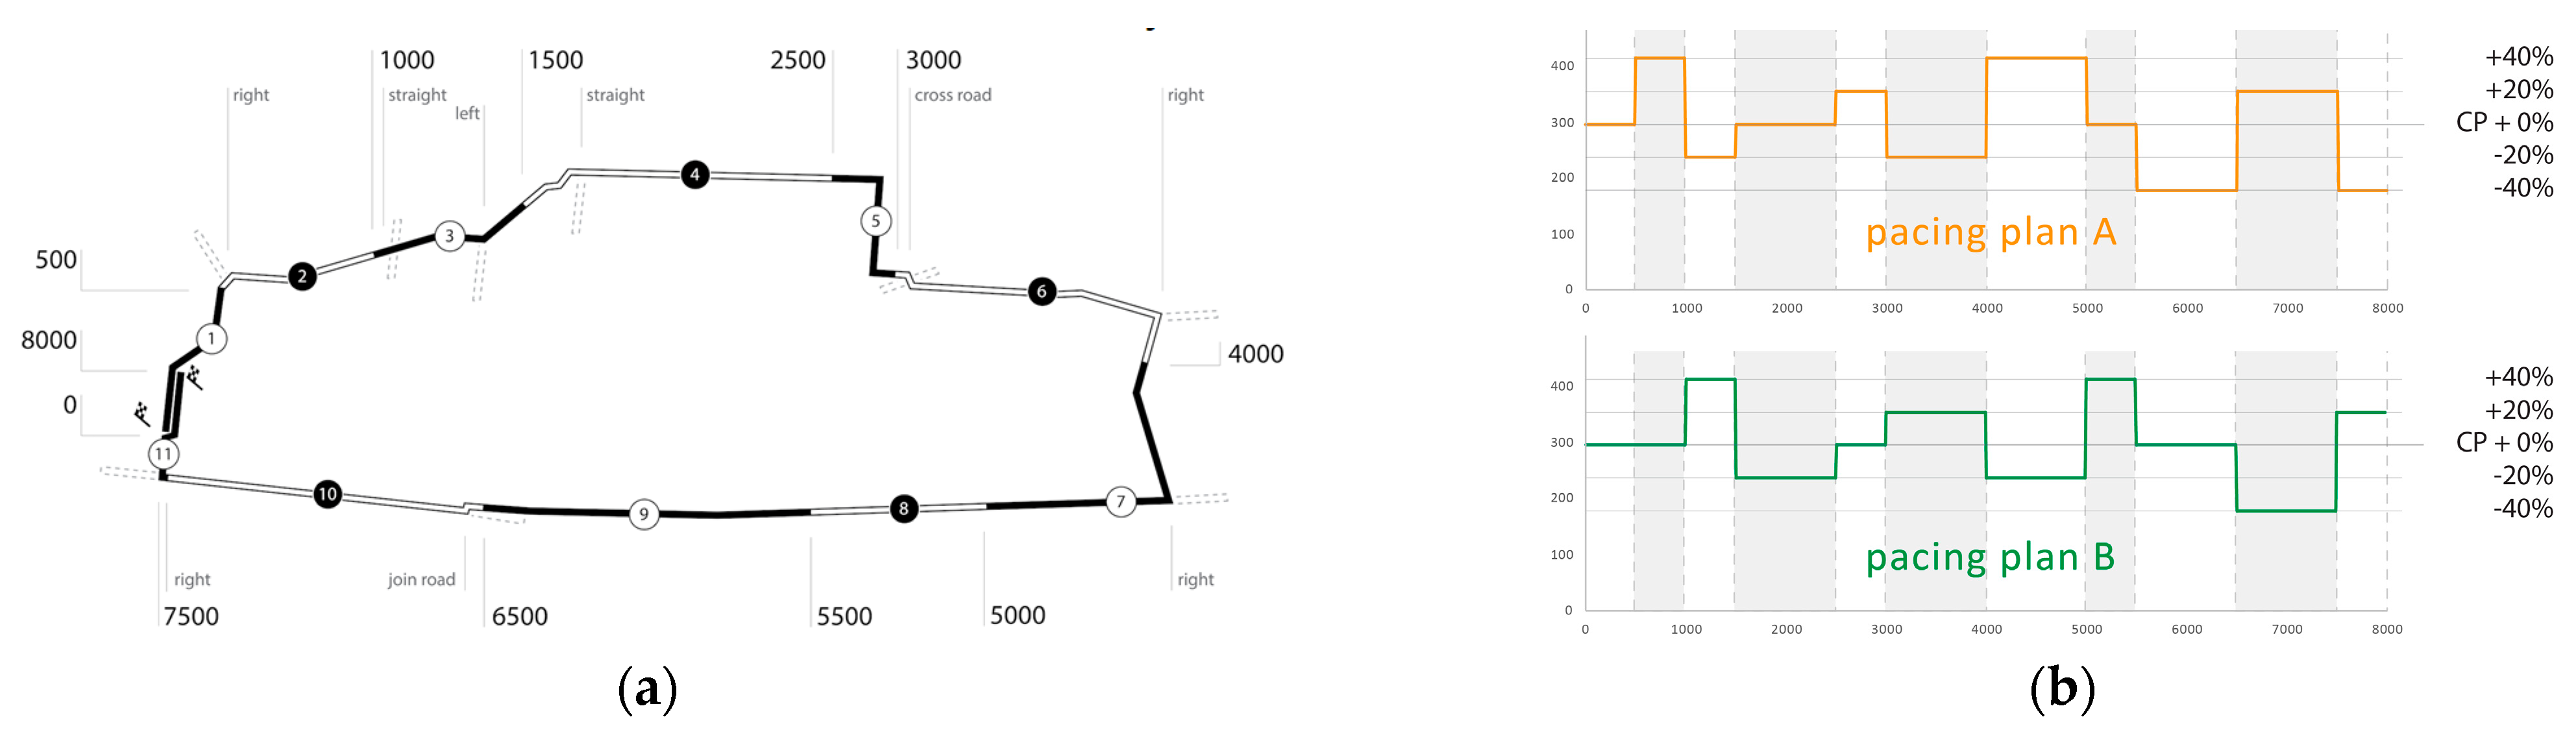
The study involved 15 participants, self-reported ‘serious amateurs’ of road cycling, in the 20–40 age range. All participants gave written consent to participate in the study and for the use of their data for scientific purposes. Participants were tasked with completing a route twice (Figure 1a) while closely adhering to a pacing plan (Figure 1b) presented differently for condition 1 and 2 (order varied), requiring them to adjust their power output at pre-determined distances.
Participants were given time to rest and replenish carbohydrates between these two trials, and invited to voice their opinions. When two trials could not be completed on the same day, a weather-equivalent alternative day was used. Trials were completed in moderately warm, dry weather.
The study was conducted outdoors to mimic racing conditions including navigation of the route, with distractions in the form of other cyclists and pedestrians. Participants were required to follow road rules and prioritise safety. The 3-m wide public cycling path featured a single 1000 m straight lane on a low-speed public road shared with cars. A map was provided prior to departure; additionally, basic on-screen instructions (e.g., ‘turn right’) were delivered on the display device 150 m ahead. Pacing plans covered 11 segments of either 500 m or 1000 m, totalling 8000 m and requiring approximately 20 min to complete. Through heuristic evaluation by an expert the lengths were determined to be sufficiently long to be acceptable by professional cyclists, yet short enough to improve on the granularity of segments currently in use by a consulted professional cycling team.
Each segment was prescribed a difficulty level relative to each individual cyclist’s critical power (CP): −40%, −20%, CP+0%, +20%, +40%; henceforth referred to as difficulties −2, −1, 0, +1, +2, respectively. Segments were arranged in a sequence to cause moderate fatigue but not exceed predetermined aerobic work capacity. Physical demand was matched for each participant, with each plan adjusted to each individual’s critical power (CP) capabilities (measured prior to the trials on a stationary bicycle trainer, following the Vanhatalo et al. [11] 3-min all-out routine).
Two pacing plans were created with different difficulty levels assigned for each segment (plans A and B, Figure 1). As illustrated in Table 1, condition 1 was tested with plan A, whereas condition 2 was tested with both plan B and A (in a supplementary study performed with 5 of the present participants). In the analysis participants were further divided into groups on the basis of the number of reported years of cycling club association or training experience: less than 3 was categorized as ‘amateurs’ (n = 8), more than 3 as ‘experienced’ (n = 7).
2.2. Apparatus
All participants completed the study on the same high-end road-racing carbon-fibre frame bicycle with electronic gear shifting and 26” wheels, and were required to wear a helmet. Each participant had the bicycle fitted, and was given time to familiarize oneself with the equipment and handling during a practice run. Power baseline measurement was performed on location with the bicycle mounted on a stationary bicycle trainer (Tacx Swing/Satori Smart). Due to printing of tables for condition 1 in advance, baseline values were rounded to the nearest five, and used for both trials.
Performance and biometric data were transmitted through ANT+ and stored by the Android display device: Giant RideSense (speed/distance), and Pioneer Power (power, cadence). Onboard video was recorded using a 360º camera (Garmin VIRB 360) mounted on the handlebar. Raw sensor data (1Hz) for power/cadence, distance/ground-speed, and GPS were logged once every second.
During testing of conditions (1) and (2), the bicycle was fitted with the 5.8” Android-based display device attached to the stem in landscape orientation, with the display set to an appropriate mode (basic or advanced telemetry; Figure 2). Prior to departure participants learned to work with the interface and following a trial run were asked to confirm this ability.
Condition (1) provided information on pacing plans through a printed table (7 by 21 cm) attached to the bicycle frame and the display device with: distance travelled (top-right), instantaneous power output (top-left), as well as occasional navigation queues (e.g., ‘cross road ↑’; bottom-right). The printed table consisted of two columns, distance (left) and expected power output (right). The right column was offset to aid in reading three cues: expected power output as well as the given segment’s start and end distances. Every fifth row was highlighted to further assist in reading.
Condition (2) provided aggregated, just-in-time pacing information on the display device, divided into three columns: results (past and present; left), expectations (present and future; centre), and navigation (right). The left column displayed: numerical values for instantaneous power output (top) and ‘anaerobic battery’ status (bottom; determined with the Skiba et al. [9] model), as well as two graphs: a grey bar chart for ‘anaerobic battery’ status, and a two-colour line graph (past 50 values of the last 1000 m) with the participant’s power output (blue) and expected power output (pacing plan, yellow). The centre column similarly displayed two numerical values: currently expected power output (top) and expected ‘battery’ status (assuming having followed the pacing plan), as well as two graphs: grey expected battery, and expected power output levels in the upcoming 1000 m. The right column displayed distance and navigation identically to condition (1).
Raw sensor data were presented (no moving averages), rounded to the nearest integer. Numerical power, battery, and distance values updated every second (ANT+ sensor frequency; ~8.5 m @ 30 km/h), while the line graphs updated once every 20 m (~2.5 s). The colour scheme was chosen for its high contrast and lack of value attribution (as is the case with red or green).
3. Results
Table 2 shows the groupings used in the analysis of the results. In the verbal evaluation, performance of two ‘experienced’ participant(s) (#4 and #13) was uncharacteristic and not in line with their own expectations, probably due to recovery from a sporting event and were thus excluded** from the calculations of the ‘experienced’ grouping but included in other groupings. Additionally, two participants reported mis-reading the information in condition (1); they were left in the dataset as this was deemed an inherent limitation of use of this condition.
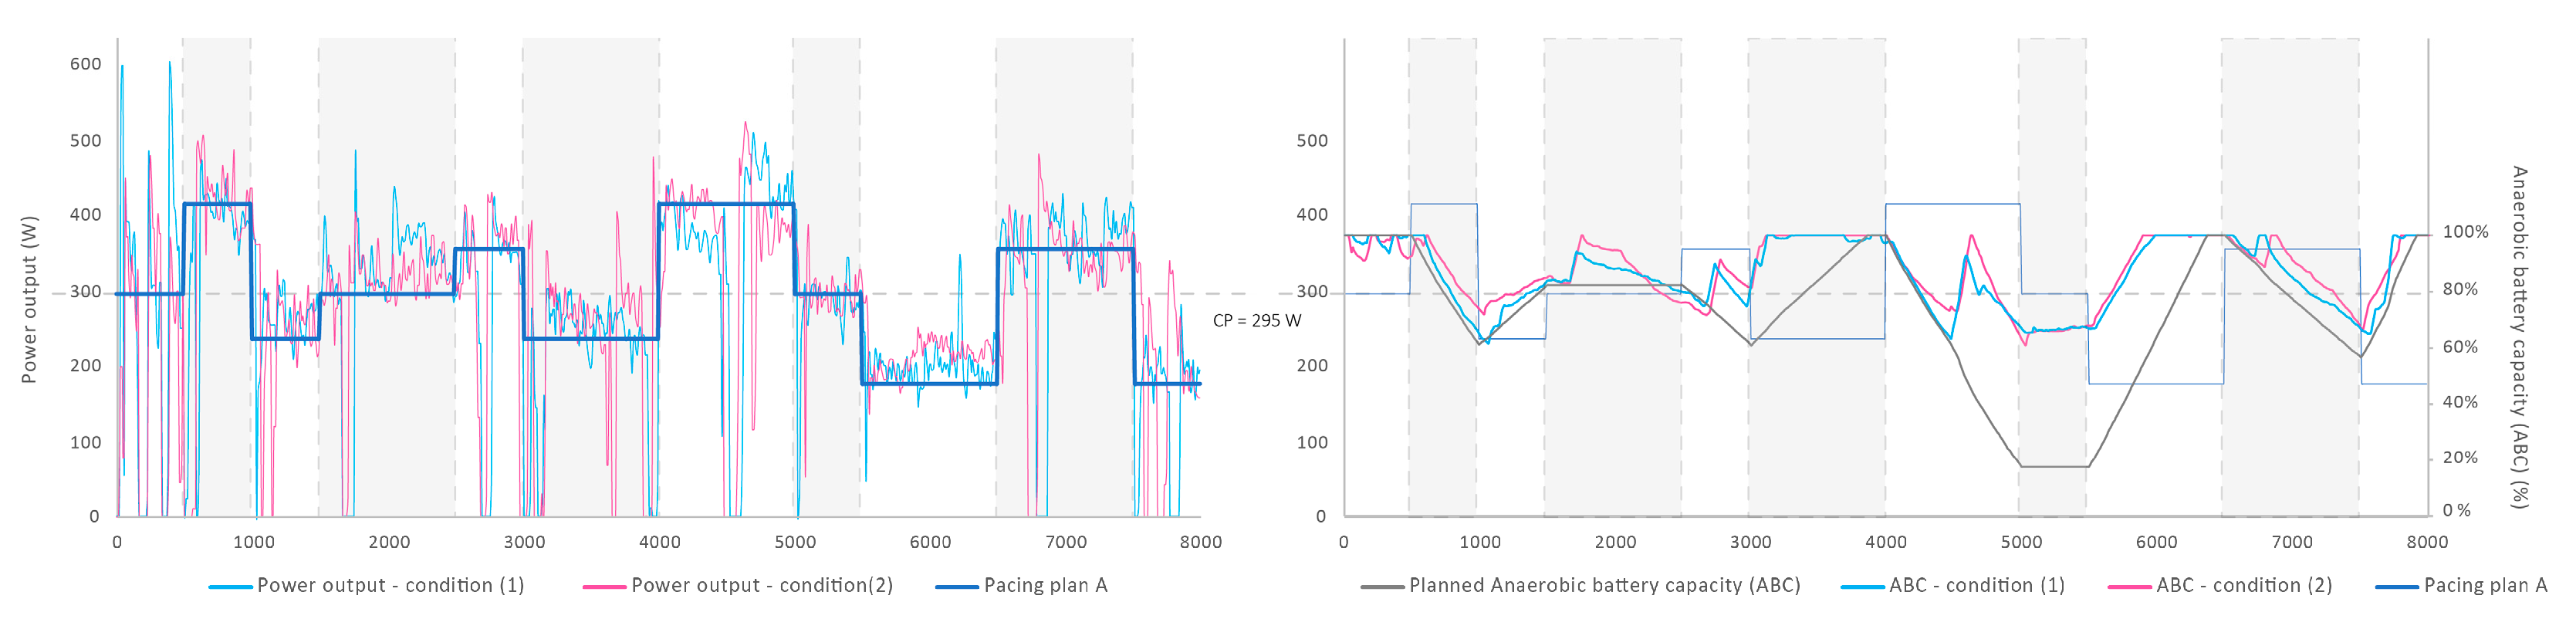
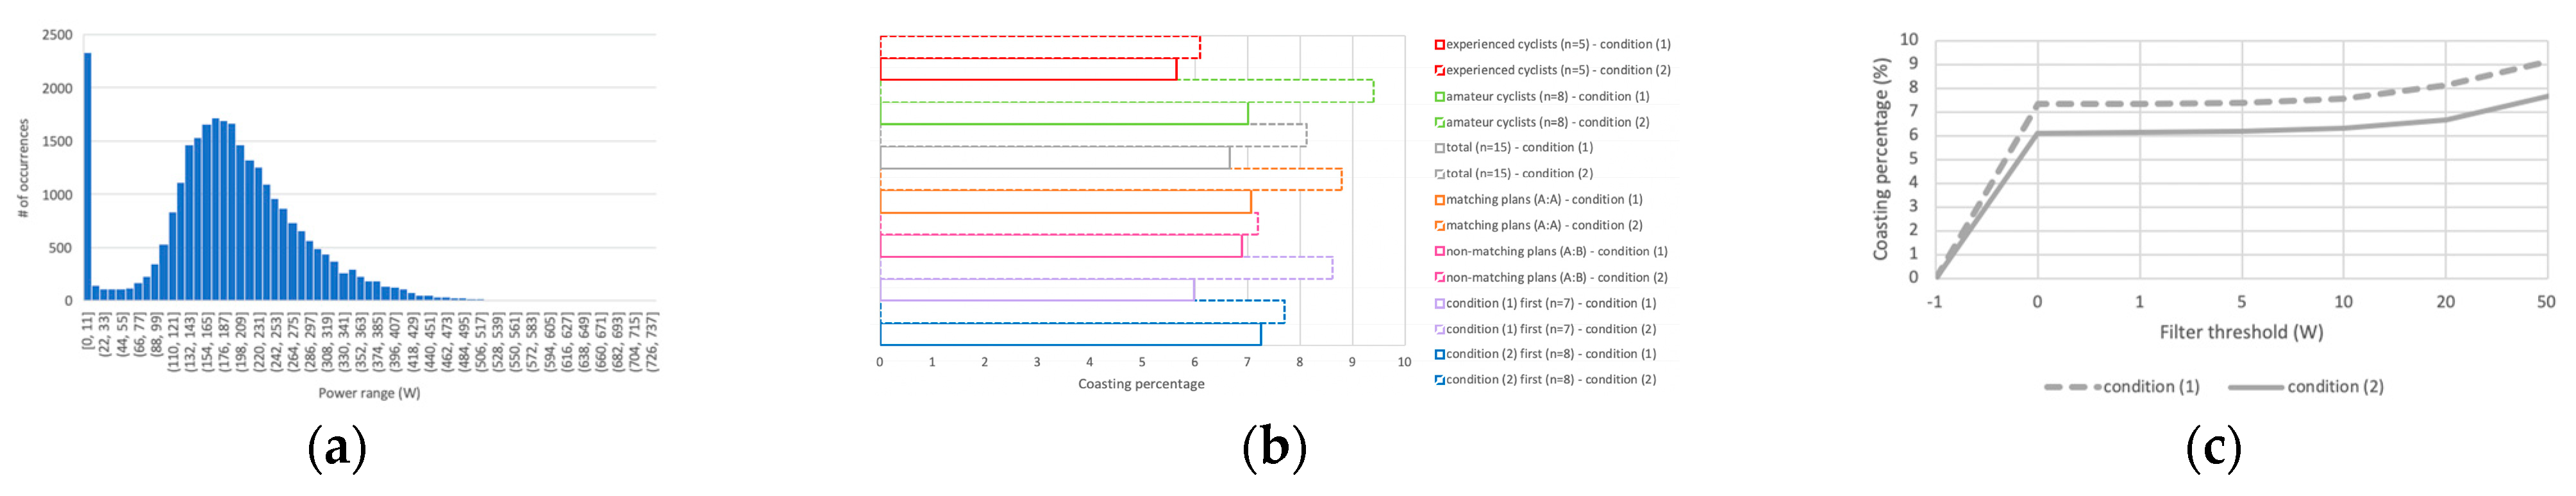
Figure 3 shows an example of power outputs of a participant during the two trials ((1) blue, (2) magenta), atop the set-out pacing plan, and the consequent impact on the anaerobic work capacity in the two trials, as well as its planned depletion. The performance data show numerous sudden drops in power output (Figure 4a), with a noteworthy instance at 4500m having a detrimental effect on the planned depletion. Upon review of the collected video data the vast majority of the instances were confirmed to be due to environmental factors (e.g., coasting towards corners). As these instances were inherent to the track and not to segment difficulty, a hard threshold of 20 W was used to filter these out (Figure 4c illustrates the impact of the use of other thresholds), with any performance data below this threshold excluded from the calculation of the Adherence score (below). In turn, the percentage of rejected values of each trial defines the ‘coasting percentage’ (Figure 4b). The data showed a trend consistent across participant groupings in that participants testing condition (1) coasted more, e.g., before and after a corner.
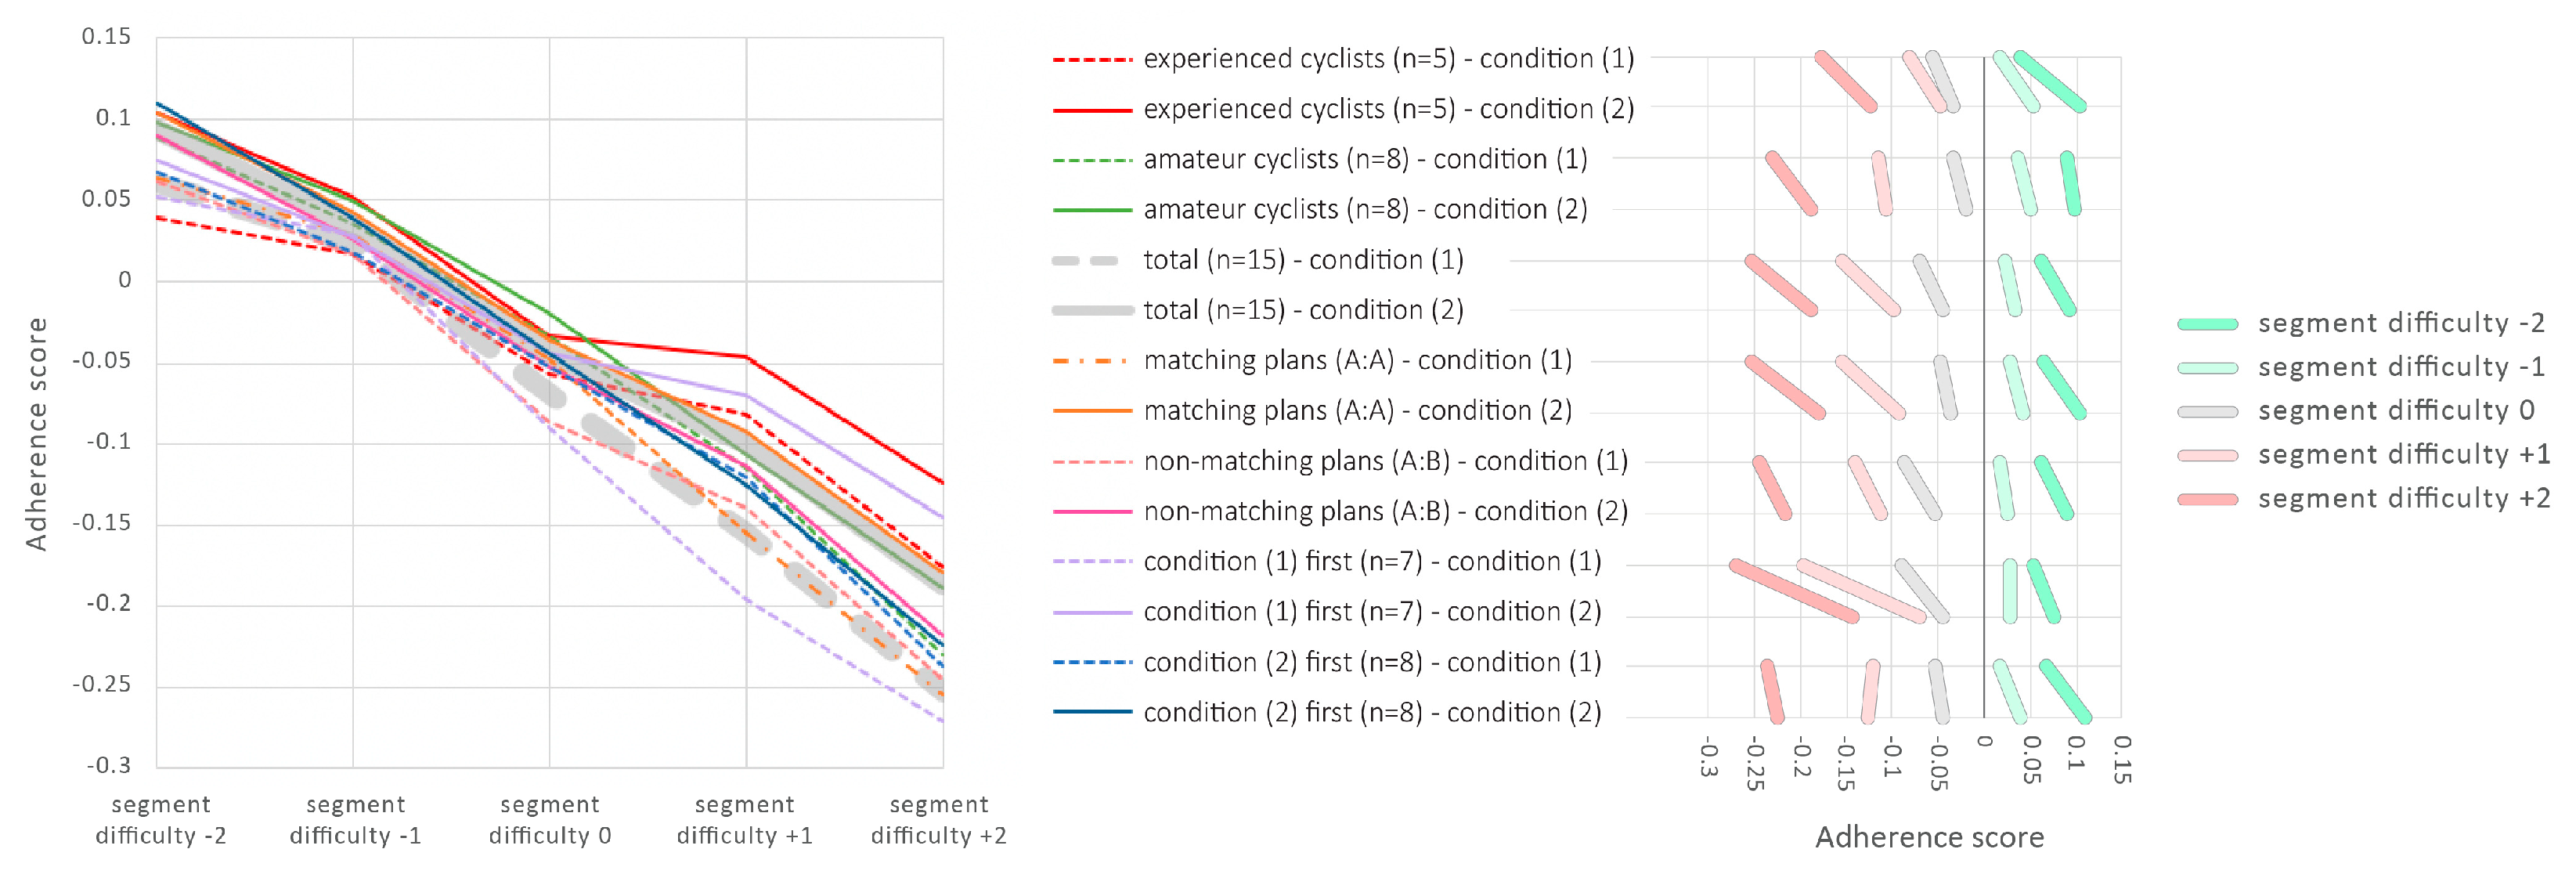
Given the broad range of power capability amongst participants the effect of a condition was quantified in terms of adherence in its use. Performance data from the trials were used to determine the ‘Adherence Score’, which represents the relative power output deviation from the planned pace. A single value was determined by taking a segment-length-weighted average of a segment’s average per-second differences in a cyclist’s power output against the expected power output, made relative to one’s physical capabilities (CP).
4. Discussion
As shown above, comparing the two conditions (Figure 5, right) suggests that aggregated information of condition (2) is more effective—adherence scores are consistently lower for condition (1) across all participant groupings, with the trend both above and below the 0 score (perfect match). This may mean that condition (1) fares better for lower difficulty levels, or that overperformance at low-difficulty levels is counteracted by underperformance inherent to using condition (1).
The data (illustrated in Figure 5) support the hypothesis that in both conditions there is a relationship between adherence and CP-relative difficulty levels—the higher the difficulty, the more participants underperformed. Interestingly, at below-CP level participants overperformed. At CP, the level at which participants could maintain performance indefinitely purely aerobically, participants slightly underperformed. The data suggest participants in condition (2) were less prone to coasting for all coasting-filtering thresholds evaluated. Future studies will explore coasting behaviour for the individual corners to deepen the understanding of these results.
With respect to other participant groupings participant experience (amateurs/experienced) showed generally similar results, with slightly better performance in higher difficulty segments—arguably due to higher stamina or experience with perseverance under similar pain or discomfort levels. Contrary to the hypothesis, the difference between conditions in the experienced group was more pronounced than in the amateur group. Differences in using matching/non-matching pacing plans appeared small. Order of testing conditions showed a considerable effect when testing condition (1) first, and a close match with condition (2) tested first, likely due to a learning effect, as participants became more familiar with the route during the second trial.
The results suggest that if adherence to a pacing plan is of major importance, plans should compensate for expected/shown divergence. In the CP−40% to CP+40% range the trend found in this paper (Figure 5, grey thick lines) can be expressed as a linear relationship between adherence and load (instructed-power-output: critical-power; Pplanned: PCP), represented by:
Given these results it would seem that these formulas can be used to shape pacing plans that could yield desired power output in practice. Further research is required to validate this hypothesis.
Furthermore, the trials were limited to an 11-segment route with five distinct power levels. Future research will explore longer routes, under the expectation that the strengths and limitations of conditions would become more apparent.
5. Conclusions
This study examined the extent to which participants can follow a pacing plan using two types of pacing plan information on an 8000m track consisting of 11-segments of varied power output intensity. Participants adhered to their plans better and coasted less when presented with aggregated information (condition (2)) compared to simple information (condition (1)). These results are promising. Future research will explore professional cyclists’ behaviour and validate the use of a compensation factor in practice. In addition, the effect of other information, as well as other delivery modalities (sound, augmented reality) will be explored.
Funding
This study is part of the ‘Citius Altius Sanius’ project (P16-28 CAS), funded by the Netherlands Organisation for Scientific Research. Open access publishing is to be funded by the department.
Conflicts of Interest
The authors declare no conflict of interest. The funding sponsors had no role in the design of the study; in the collection, analyses, or interpretation of data; and in the writing of the manuscript.
References
- Atkinson, G.; Davison, R.; Jeukendrup, A.; Passfield, L. Science and cycling: Current knowledge and future directions for research. J. Sports Sci. 2003, 21, 767–787. [Google Scholar] [CrossRef] [PubMed]
- De Koning, J.J.; Bobbert, M.F.; Foster, C. Determination of optimal pacing strategy in track cycling with an energy flow model. JSAMS 1999, 2, 266–277. [Google Scholar] [CrossRef]
- Noordhof, D.A.; de Koning, J.J.; van Erp, T.; van Keimpema, B.; de Ridder, D.; Otter, R.; Foster, C. ; The between and within day variation in gross efficiency. EJAP 2010, 109, 1209–1218. [Google Scholar] [CrossRef] [PubMed]
- Sanders, D.; van Erp, T.; de Koning, J.J. Intensity and load characteristics of professional road cycling: Differences between men’s and women’s races. IJSPP 2019, 14, 296–302. [Google Scholar] [CrossRef] [PubMed]
- Van Erp, T.; Foster, C.; de Koning, J.J. Relationship between various training-load measures in elite cyclists during training, road races, and time trials. IJSPP 2019, 14, 493–500. [Google Scholar] [CrossRef] [PubMed]
- Wolf, S.; Biral, F.; Saupe, D. Adaptive feedback system for optimal pacing strategies in road cycling. Sports Eng. 2019, 22, 6. [Google Scholar] [CrossRef]
- The Appeal of Road Cycling: Findings from the Public Consultation. Available online: https://www.uci.org/inside-uci/press-releases/the-appeal-of-road-cycling-findings-from-the-public-consultation (accessed on 19 September 2019).
- Ammons, R.B. Effects of knowledge of performance: A survey and tentative theoretical formulation. JGP 1956, 54, 279–299. [Google Scholar] [CrossRef]
- Skiba, P.F.; Clarke, D.; Vanhatalo, A.; Jones, A.M. Validation of a novel intermittent W′ model for cycling using field data. IJSPP 2014, 9, 900–904. [Google Scholar] [CrossRef] [PubMed]
- Magill, R.; Anderson, D. Motor Learning and Control: Concepts and Applications; McGraw-Hill: New York, NY, USA, 2007. [Google Scholar]
- Vanhatalo, A.; Doust, J.H.; Burnley, M. Determination of critical power using a 3-min all-out cycling test. MSSE 2007, 39, 548–555. [Google Scholar] [CrossRef] [PubMed]
Figure 1.
(a) Route plan with segment lengths and navigation instructions; (b) Pacing plans A and B.
Figure 1.
(a) Route plan with segment lengths and navigation instructions; (b) Pacing plans A and B.

Figure 2.
Placement of two tested modalities on the bicycle’s frame and stem.

Figure 3.
(left) Example results for matching plan trials; (right) consequent anaerobic battery capacity.
Figure 3.
(left) Example results for matching plan trials; (right) consequent anaerobic battery capacity.

Figure 4.
(a) Example power output histogram; (b) coasting percentage; (c) filter thresholds compared.
Figure 4.
(a) Example power output histogram; (b) coasting percentage; (c) filter thresholds compared.

Figure 5.
Adherence scores for segment difficulties for different participant groupings.


Table 1.
Pacing plans used in trials for each participant (* supplementary study) (underlined: experienced cyclist participants and condition tested first).
Table 1.
Pacing plans used in trials for each participant (* supplementary study) (underlined: experienced cyclist participants and condition tested first).
| Participant | 1 | 2 | 3 | 4 | 5 | 6 | 7 | 8 | 9 | 10 | 11 | 12 | 13 | 14 | 15 |
| Condition 1 | A | A | A | A | A | A | A | A | A | A | A | A | A | A | A |
| Condition 2 | B | B | B | B | B | B | B | B | B | B | B | B | A | A | A |
| Condition 2 * | A | A | A | A | A |
Table 2.
Participant and trial data groupings (* supplementary study, ** excluded).
| All Participants (n = 15) | Amateur (n = 8) | Experienced (n = 7) | |
|---|---|---|---|
| Matching (A:A) | 3 + 5 * | 1 + 3 * | 2 + 2 * |
| Non-Matching (A:B) | 12 | 7 | 5 − 2 ** |
Publisher’s Note: MDPI stays neutral with regard to jurisdictional claims in published maps and institutional affiliations. |
© 2020 by the authors. Licensee MDPI, Basel, Switzerland. This article is an open access article distributed under the terms and conditions of the Creative Commons Attribution (CC BY) license (https://creativecommons.org/licenses/by/4.0/).
Share and Cite
MDPI and ACS Style
Dukalski, R.; Lukosch, S.; Schwab, A.; Beek, P.J.; Brazier, F.M. Exploring the Effect of Pacing Plan Feedback for Professional Road Cycling. Proceedings 2020, 49, 58. https://doi.org/10.3390/proceedings2020049058
AMA Style
Dukalski R, Lukosch S, Schwab A, Beek PJ, Brazier FM. Exploring the Effect of Pacing Plan Feedback for Professional Road Cycling. Proceedings. 2020; 49(1):58. https://doi.org/10.3390/proceedings2020049058
Chicago/Turabian StyleDukalski, R., S. Lukosch, A. Schwab, P.J. Beek, and F.M. Brazier. 2020. "Exploring the Effect of Pacing Plan Feedback for Professional Road Cycling" Proceedings 49, no. 1: 58. https://doi.org/10.3390/proceedings2020049058