Proceeding Paper

Social Conflicts Studied by Statistical Physics Approach and Monte Carlo Simulations †

1
Laboratoire de Physique Théorique et Modélisation Université de Cergy-Pontoise, CNRS, UMR 8089, 2 Avenue Adolphe Chauvin, 95302 Cergy-Pontoise, CEDEX, France
2
Department of Physics, Cleveland State University, Cleveland, OH 44115, USA
3
Levin College of Urban Affairs, Cleveland State University, Cleveland, OH 44115, USA
*
Author to whom correspondence should be addressed.
Presented at the 5th International Electronic Conference on Entropy and Its Applications, 18–30 November 2019; Available online: https://ecea-5.sciforum.net/.
Proceedings 2020, 46(1), 4; https://doi.org/10.3390/ecea-5-06661
Published: 17 November 2019

Abstract

:
Statistical physics models of social systems with a large number of members, each interacting with a subset of others, have been used in very diverse domains such as culture dynamics, crowd behavior, information dissemination and social conflicts. We observe that such models rely on the fact that large societal groups display surprising regularities despite individual agency. Unlike physics phenomena that obey Newton’s third law, in the world of humans the magnitudes of action and reaction are not necessarily equal. The effect of the actions of group n on group m can differ from the effect of group m on group n. We thus use the spin language to describe humans with this observation in mind. Note that particular individual behaviors do not survive in statistical averages. Only common characteristics remain. We have studied two-group conflicts as well as three-group conflicts. We have used time-dependent Mean-Field Theory and Monte Carlo simulations. Each group is defined by two parameters which express the intra-group strength of interaction among members and its attitude toward negotiations. The interaction with the other group is parameterized by a constant which expresses an attraction or a repulsion to other group average attitude. The model includes a social temperature T which acts on each group and quantifies the social noise. One of the most striking features is the periodic oscillation of the attitudes toward negotiation or conflict for certain ranges of parameter values. Other striking results include chaotic behavior, namely intractable, unpredictable conflict outcomes.

1. Introduction

Statistical physics studies large systems of interacting particles using their microscopic properties [1]. Statistical physics models are suitable for investigating social systems which are composed of a large number of individuals who interact with each other under a social ambiance which can be associated with the temperature in physics. These models have been used to study complex social systems such as culture dynamics, crowd behavior, information dissemination and social conflict. This is possible [2,3] because the average over large societal groups washes away individual particularities and retains only common characteristics at the end. We see surprising behavior regularities in opinion surveys despite individual uniqueness. Many discussions have been found in the literature on the critique of oversimplification of social dynamics of sociophysics [4]. In particular, social conflicts have been subject of investigations over the years [5,6,7,8,9]. Many applications to concrete situations such as the Brexit referendum [10,11], the US election in 2016 [10,11,12], the Serbia–Herzegovina–Croatia election in 2018 [13] have been discussed.
This paper is organized as follows. Section 2 is devoted to the two-group dynamics with mean-field analysis and Monte Carlo simulations. Section 3 shows the case of three-group dynamics. Conclusion is given in the last section.

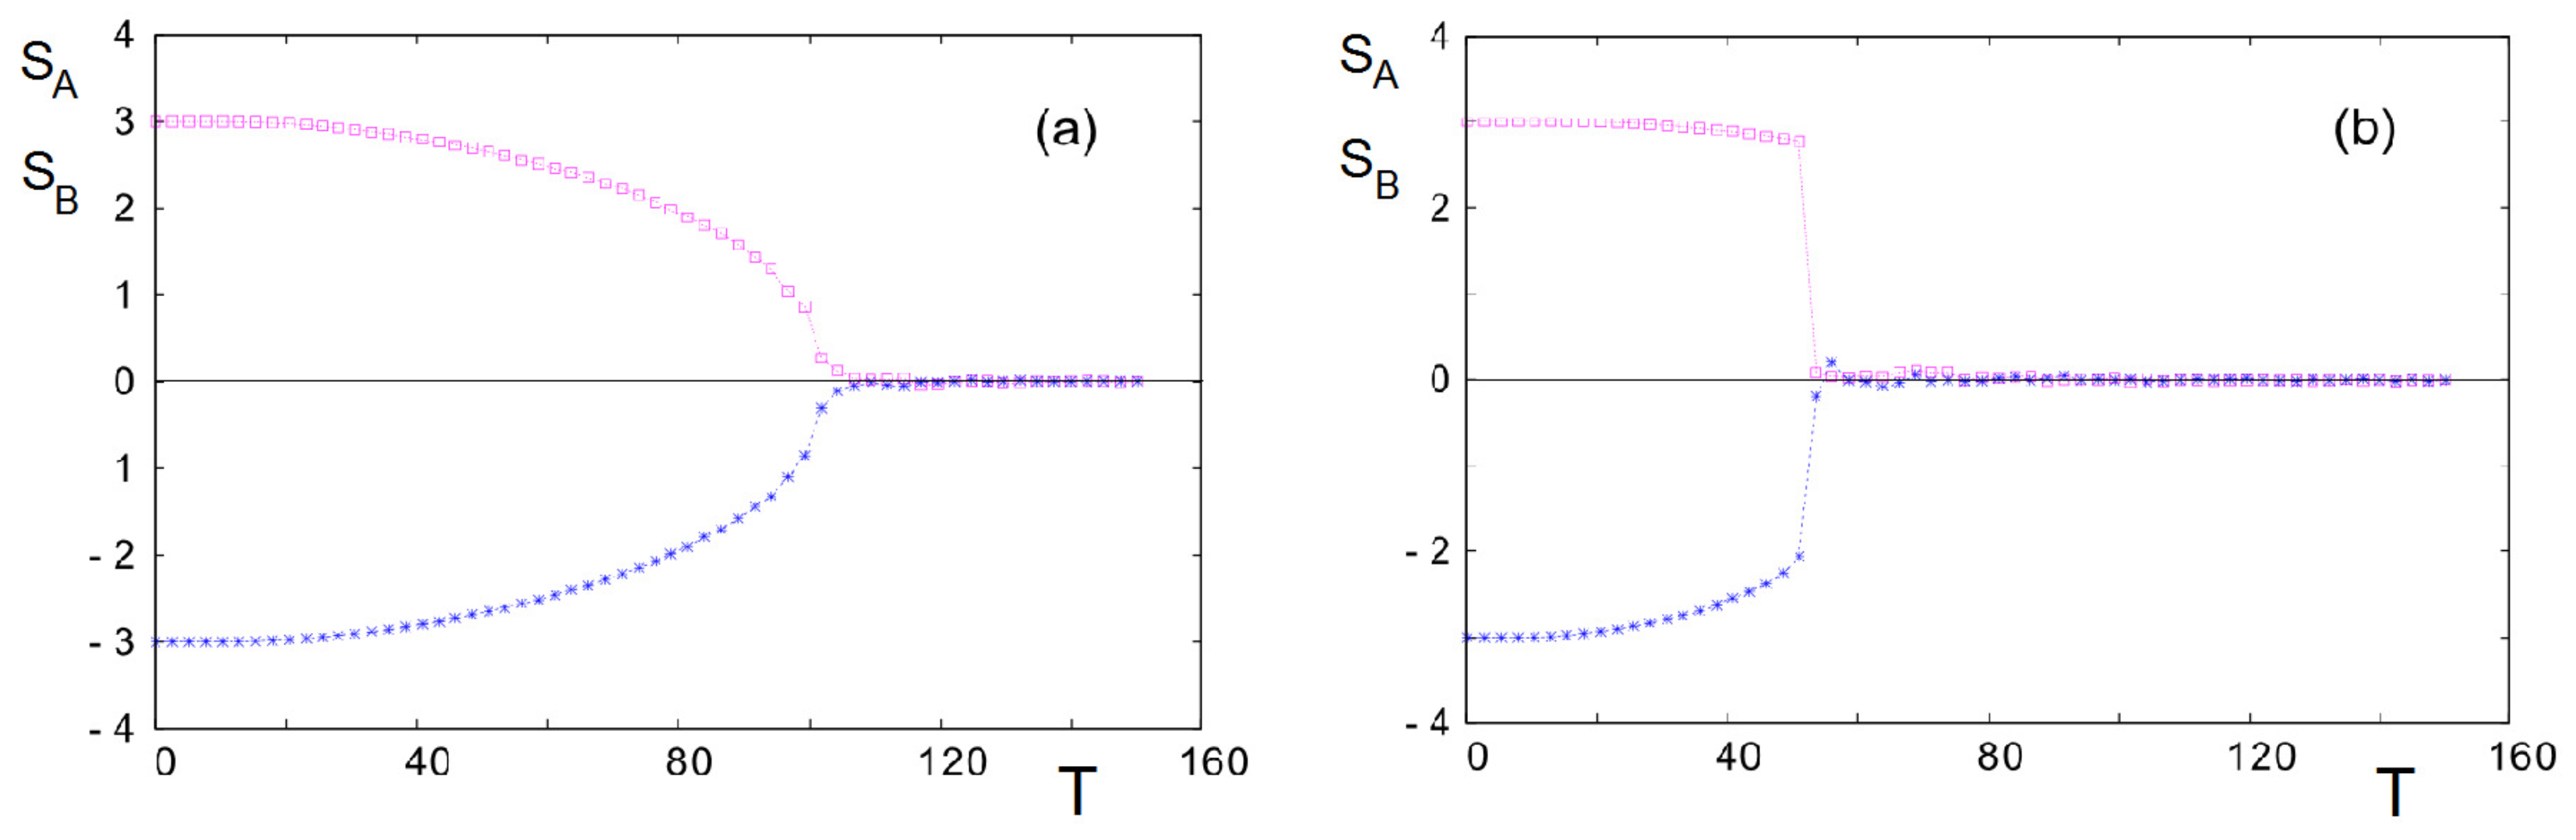
2. Two-Group Dynamics

We use a spin S i to represent the opinion of an individual i in a group. As said in the Introduction, this spin can be discrete or continuous, depending on the problem and the model we wish to make for that problem.

2.1. Model: Time-Dependent Mean-Field Theory

On the Renyi–Erdos (equivalent neighbor) network, the mean of preferences s of each group is proportional to the exponential of the intensity of interactions (negative energy):
S A ( t + 1 ) = s = M A M A s e s [ J 1 S A ( t ) + K 12 S B ( t ) ] s = M A M A e s [ J 1 S A ( t ) + K 12 S B ( t ) ]
S B ( t + 1 ) = s = M B M B s e s [ J 2 S B ( t ) + K 21 S A ( t ) ] s = M B M B e s [ J 2 S B ( t ) + K 21 S A ( t ) ]
We introduce a lag time as we assume the preference s at time t + 1 interacts with the averages S A and S B at an earlier time t. The time is measured in units of the delay time. The sums on the right hand sites of Equations (1) and (2) involve the Brillouin function [1]:
B ( x , y , J , K , M ) = ( M + 1 2 ) cotanh [ ( M + 1 2 ) ( J x + K y ) ] 1 2 cotanh [ 1 2 ( J x + K y ) ]
Equations (2)–(9) can be written as:
S A ( t + 1 ) = B ( S A ( t ) , S B ( t ) , J 1 , K 12 , M A )
S B ( t + 1 ) = B ( S B ( t ) , S A ( t ) , J 2 , K 21 , M B )
An analysis of the linearized Equations (4) and (5), valid for small S A and S B , gives the region of the parameter space where an ordered phase ( | S A | > 0 , | S B | > 0 ) can exist beside the disordered phase ( S A = S B = 0 ) :
J 1 J 1 c K 12 J 2 J 2 c K 21 = 1
where J 1 c and J 2 c are the critical values of the couplings when the two networks are decoupled: If the states of an individual are M A , M A + 1 , M A + 2 , , M A 1 , M A for A and the similar for B then J 1 c = 3 / M A ( M A + 1 ) ; J 2 c = 3 / M B ( M B + 1 ) . The eigenvalues of the Jacobian [ J 1 ( t + 1 ) , J 2 ( t + 1 ) ] / [ J 1 ( t ) , J 2 ( t ) ] are:
λ 1 , 2 = 1 2 [ J 1 J 1 c + J 2 J 2 c ± ( J 1 J 1 c J 2 J 2 c ) 2 + 4 K 12 J 1 c K 21 J 2 c ]
On the manifold of Equation (6) both eigenvalues are equal to 1. The eigenvalues can become complex provided K 12 * K 21 < 0 . In such cases the average S A and S B exhibit oscillations as function of time. The period of such oscillations is given by
Period = 2 π arctan ( λ I / λ R )
where λ R and λ I are the real and imaginary parts of the eigenvalue. When the eigenvalue absolute value is larger than unity the average S evolves in time to a non-zero value while when the eigenvalue absolute value is less than unity the average S evolves in time to zero.
We show some results in the following with a few typical sets of parameters (Figure 1).

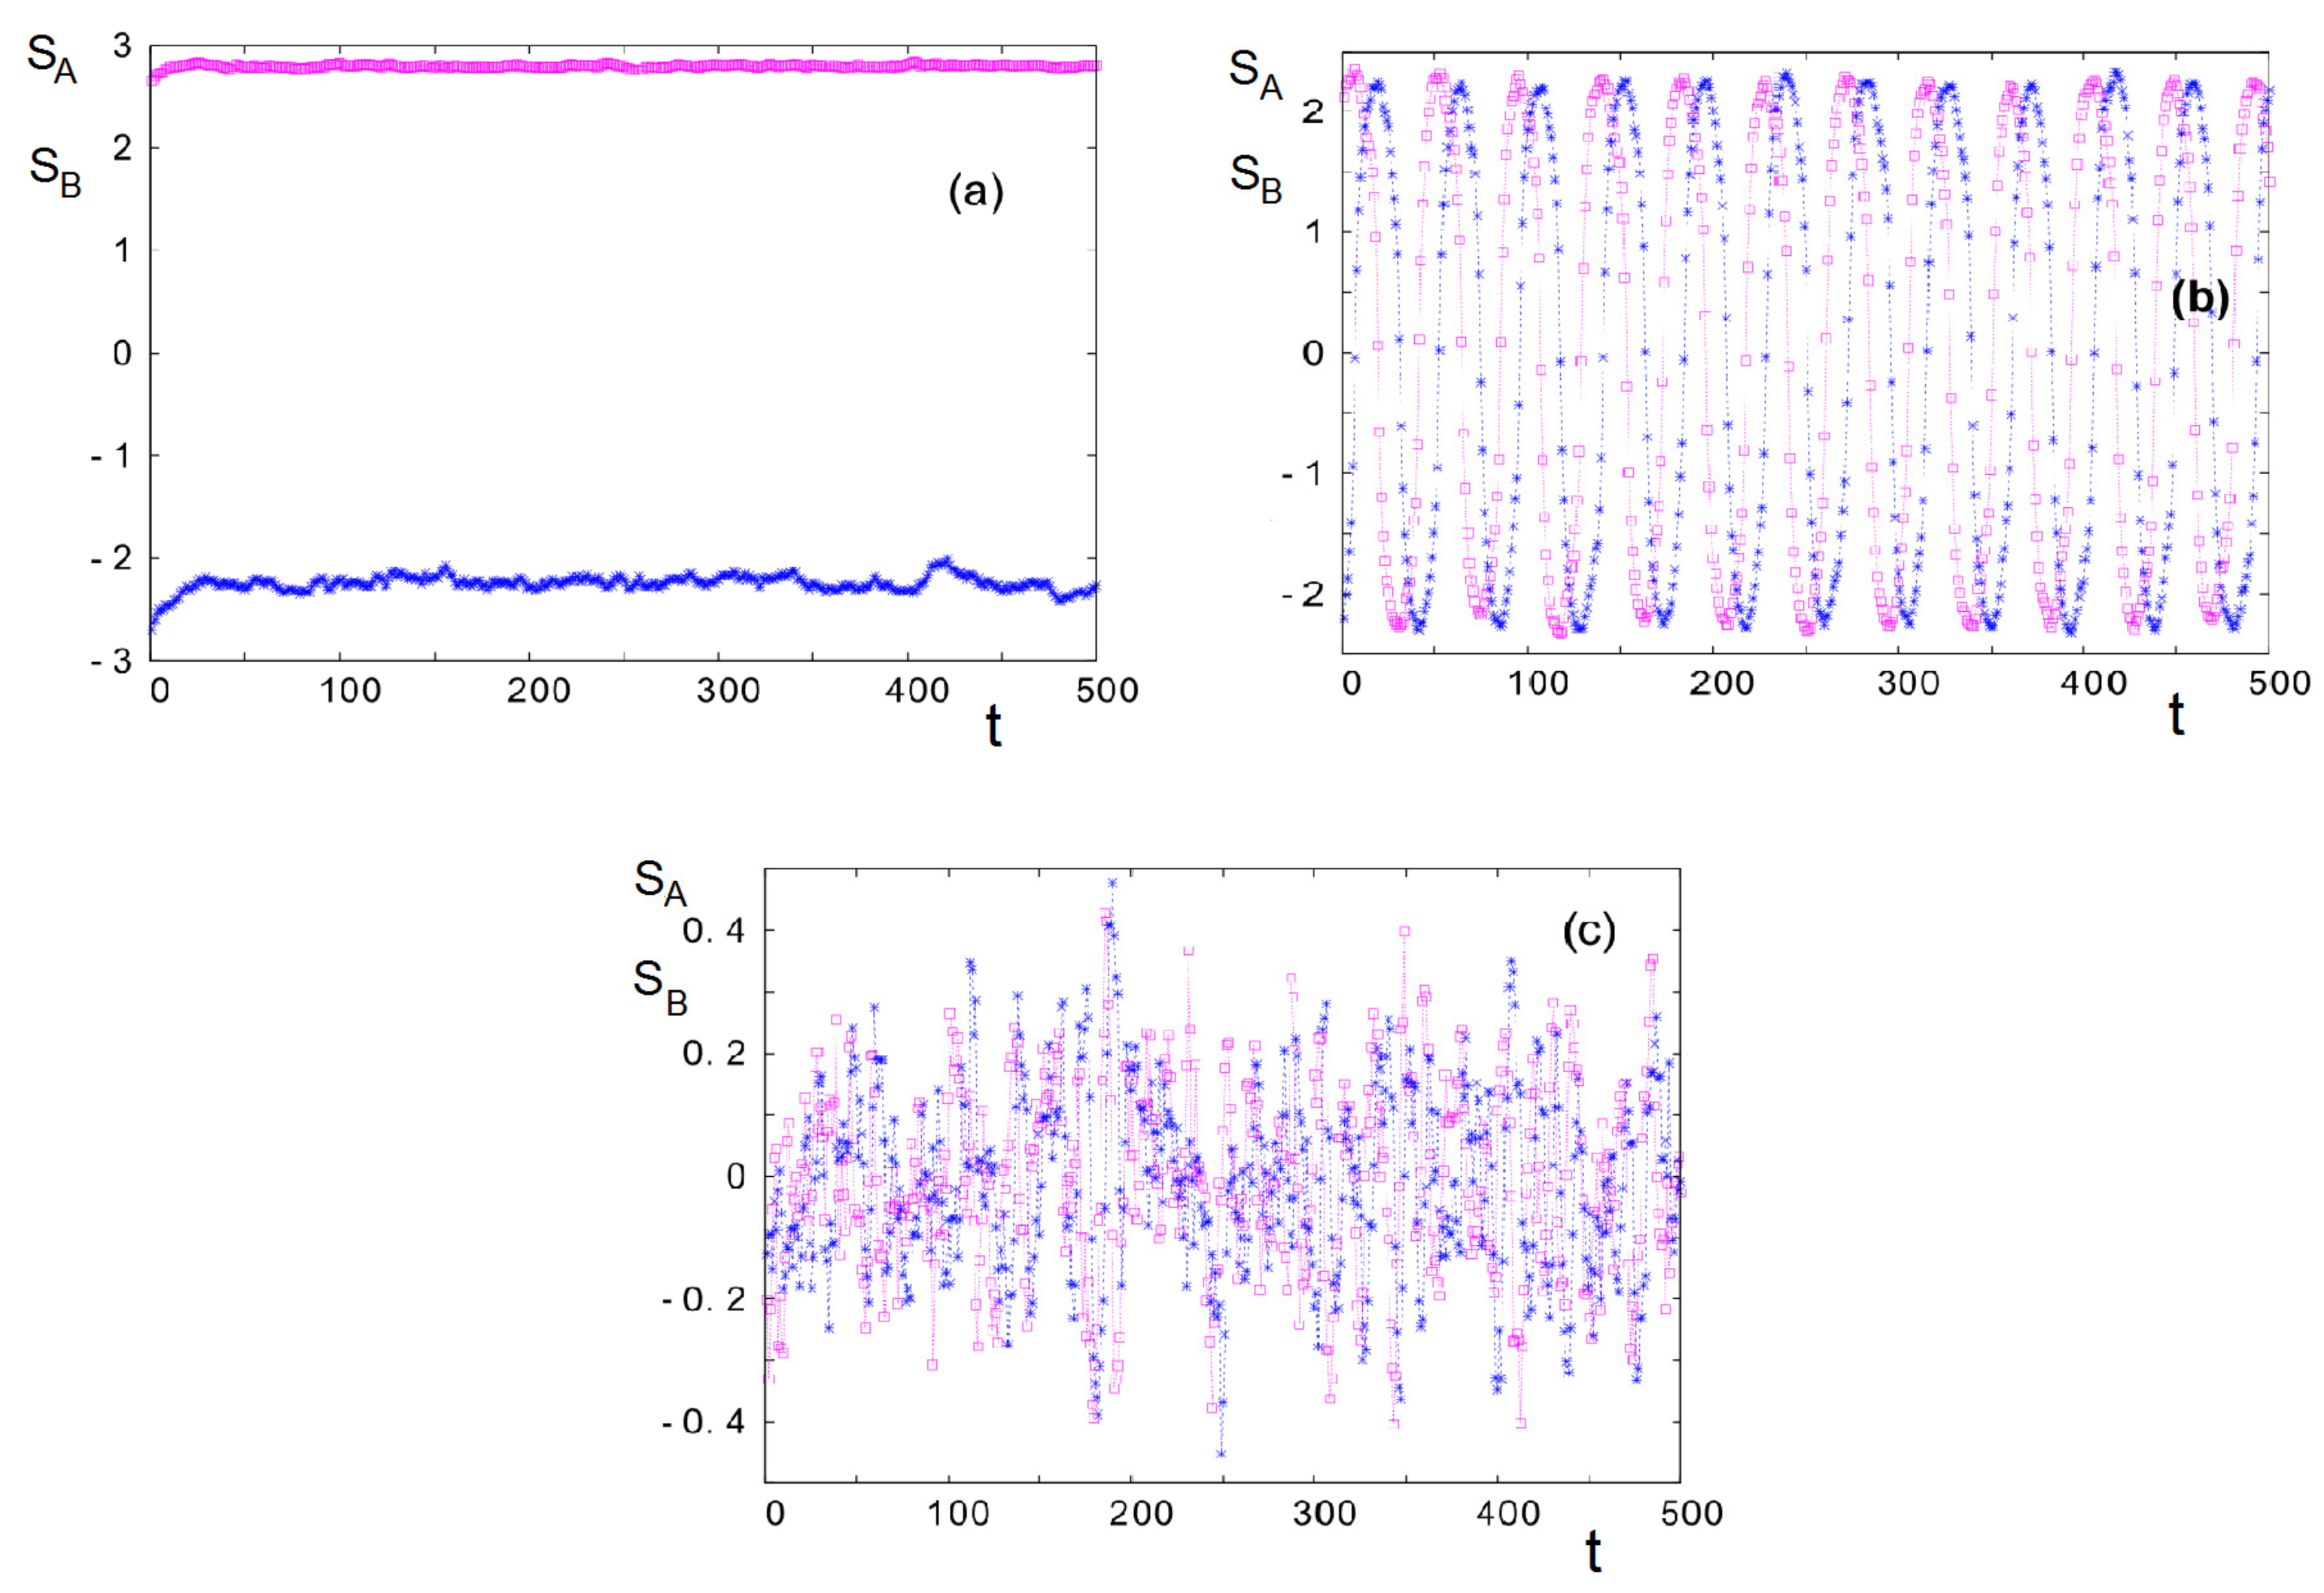
2.2. Monte Carlo Simulation

We use the Metropolis algorithm [14] to simulate the model presented in the previous subsection: We calculate the energy of an individual at the time t using the state of the other individuals of his/her group and the average field of the other group at time t. We update his/her state according to the Metropolis algorithm, before taking another individual for updating until all individuals of two groups are updated. This achieves on Monte Carlo step. Unlike problems of statistical physics at equilibrium, here we would like to follow the individuals with time evolution. We need just to equilibrate the groups at T separately (this take times), and turn on the interaction between them. We follow how each group evolves with t.
We change the notations here: In the mean-field theory above, the “social temperature” has been included in the definitions of J 1 , J 2 , K 12 and K 21 . Here we explicitly express it by J 1 = J A / T , J 2 = J B / T , K 12 = K A B / T and K 21 = K B A / T .
The size of N = 1600 individuals is used for each group with periodic boundary conditions so that individuals being at the borders of the group have the same number of neighbors. This order of size is what is used in opinion surveys so that a precision of a few percents since the uncertainty is proportional to 1 / N near the change of phase.
As an example we take the case q A = q B = 7 ( M M A = M B = 3 ) with an antisymmetric K A B = K B A . The two groups in the absence of interaction and with interaction at long-time average are shown in Figure 2.
The time evolution of the two groups’ stances is shown in Figure 3 at three social temperatures: At low T two groups are stable with opposite stances, at intermediate T their stances oscillate (periodic change of stance), and at high T they oscillate chaotically.
These results have been discussed in relation with the Brexit referendum [10,11].

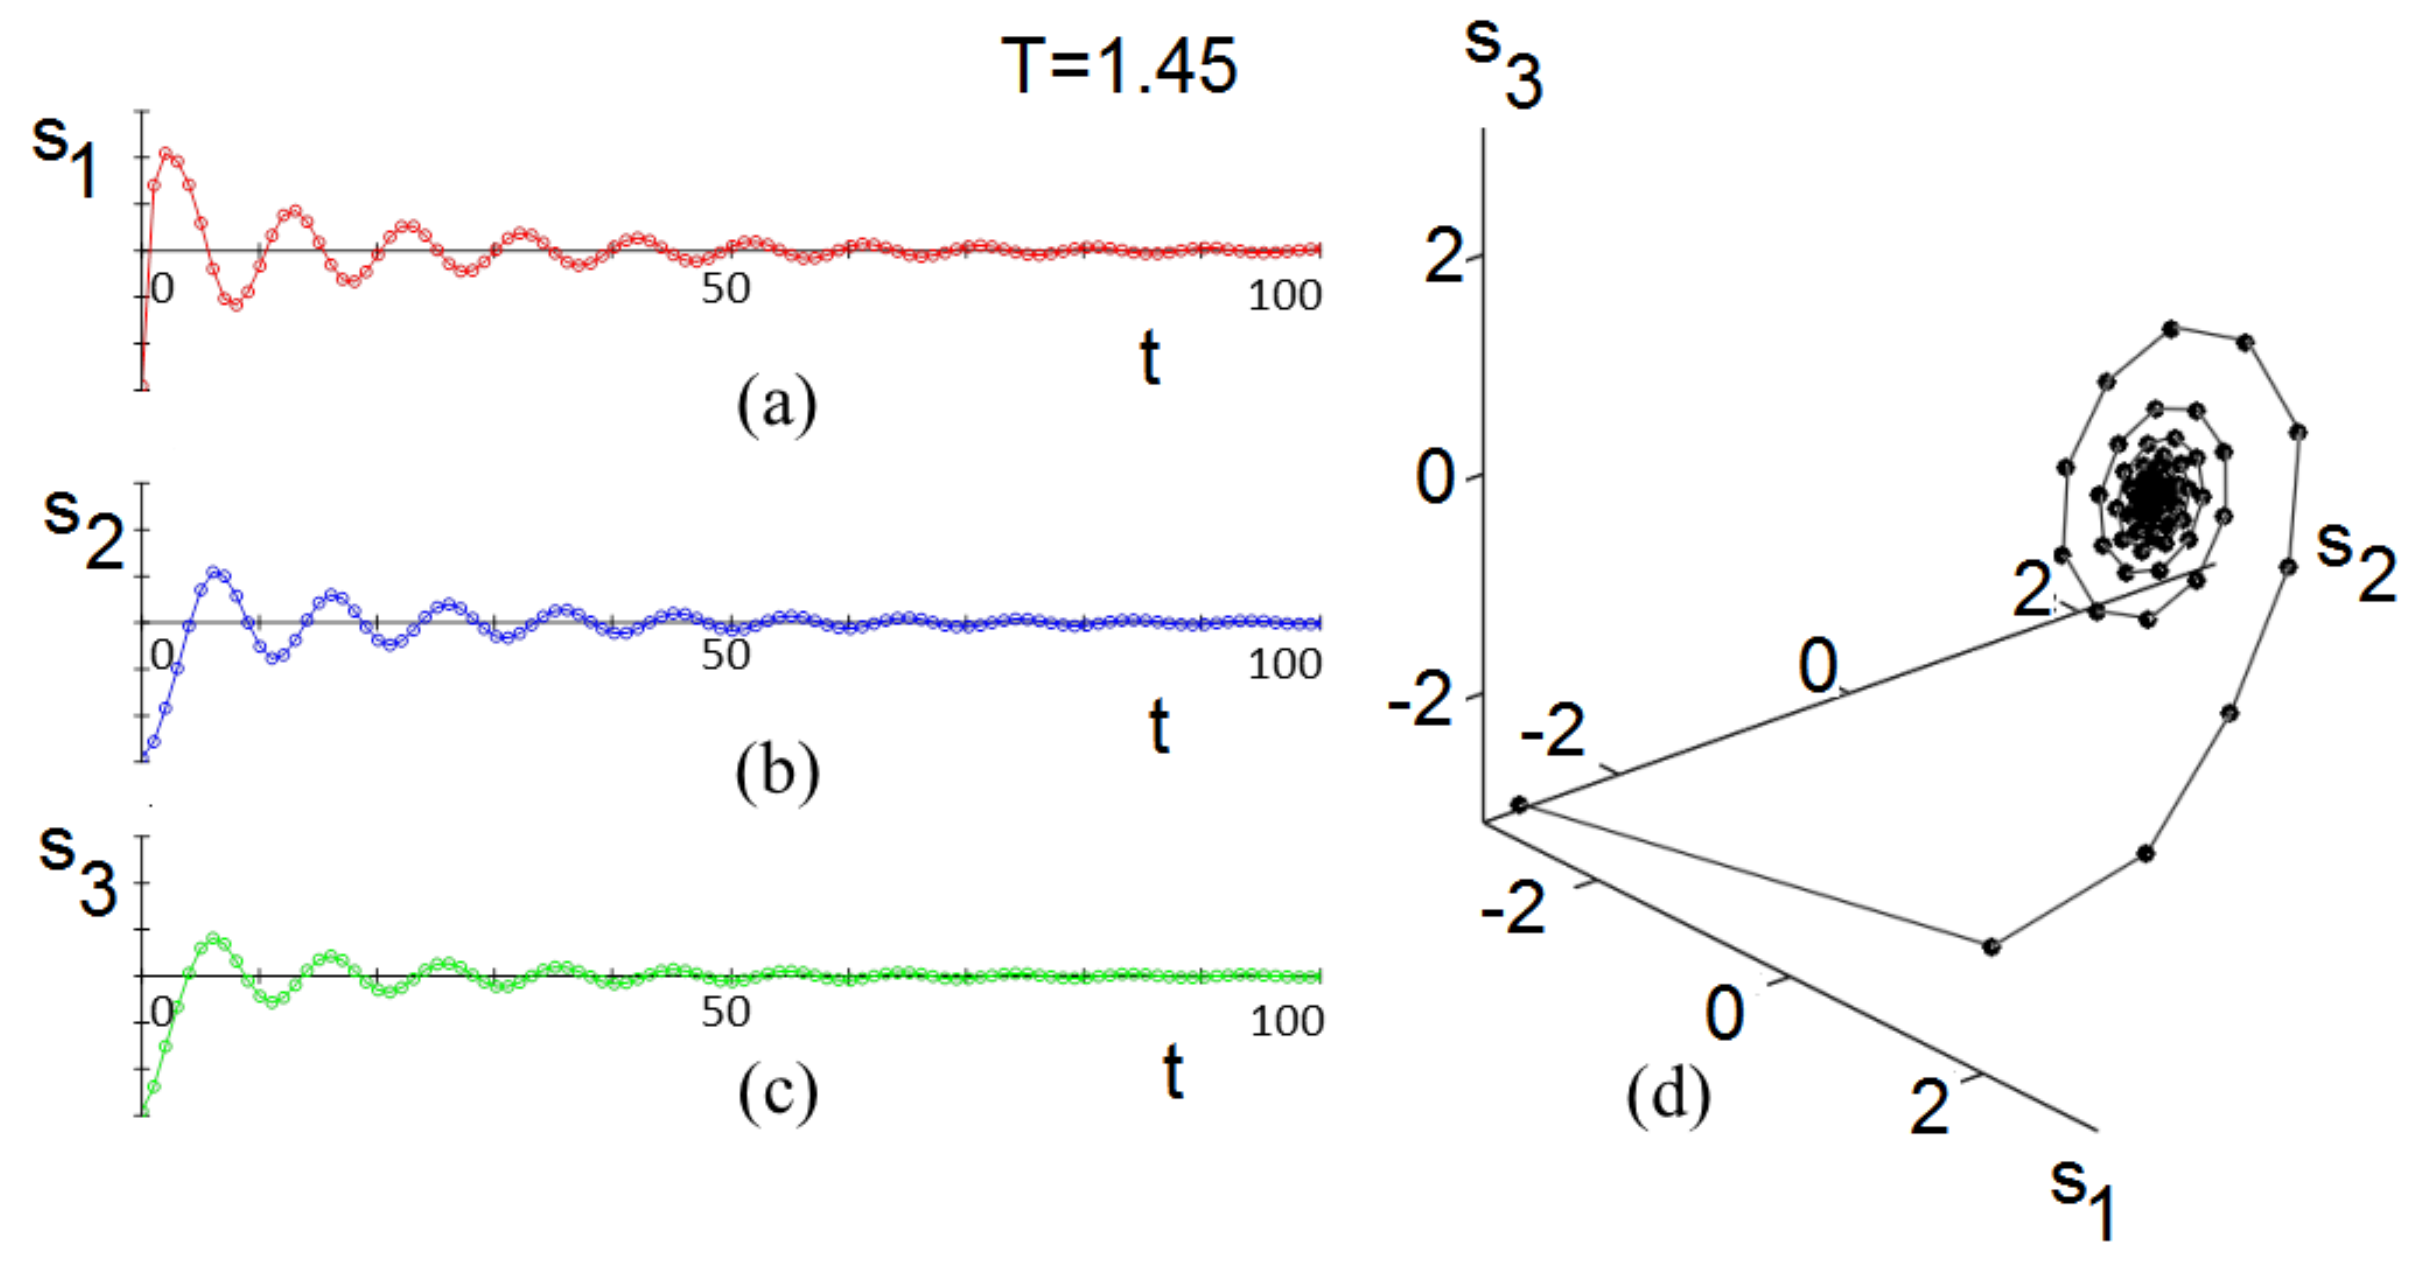
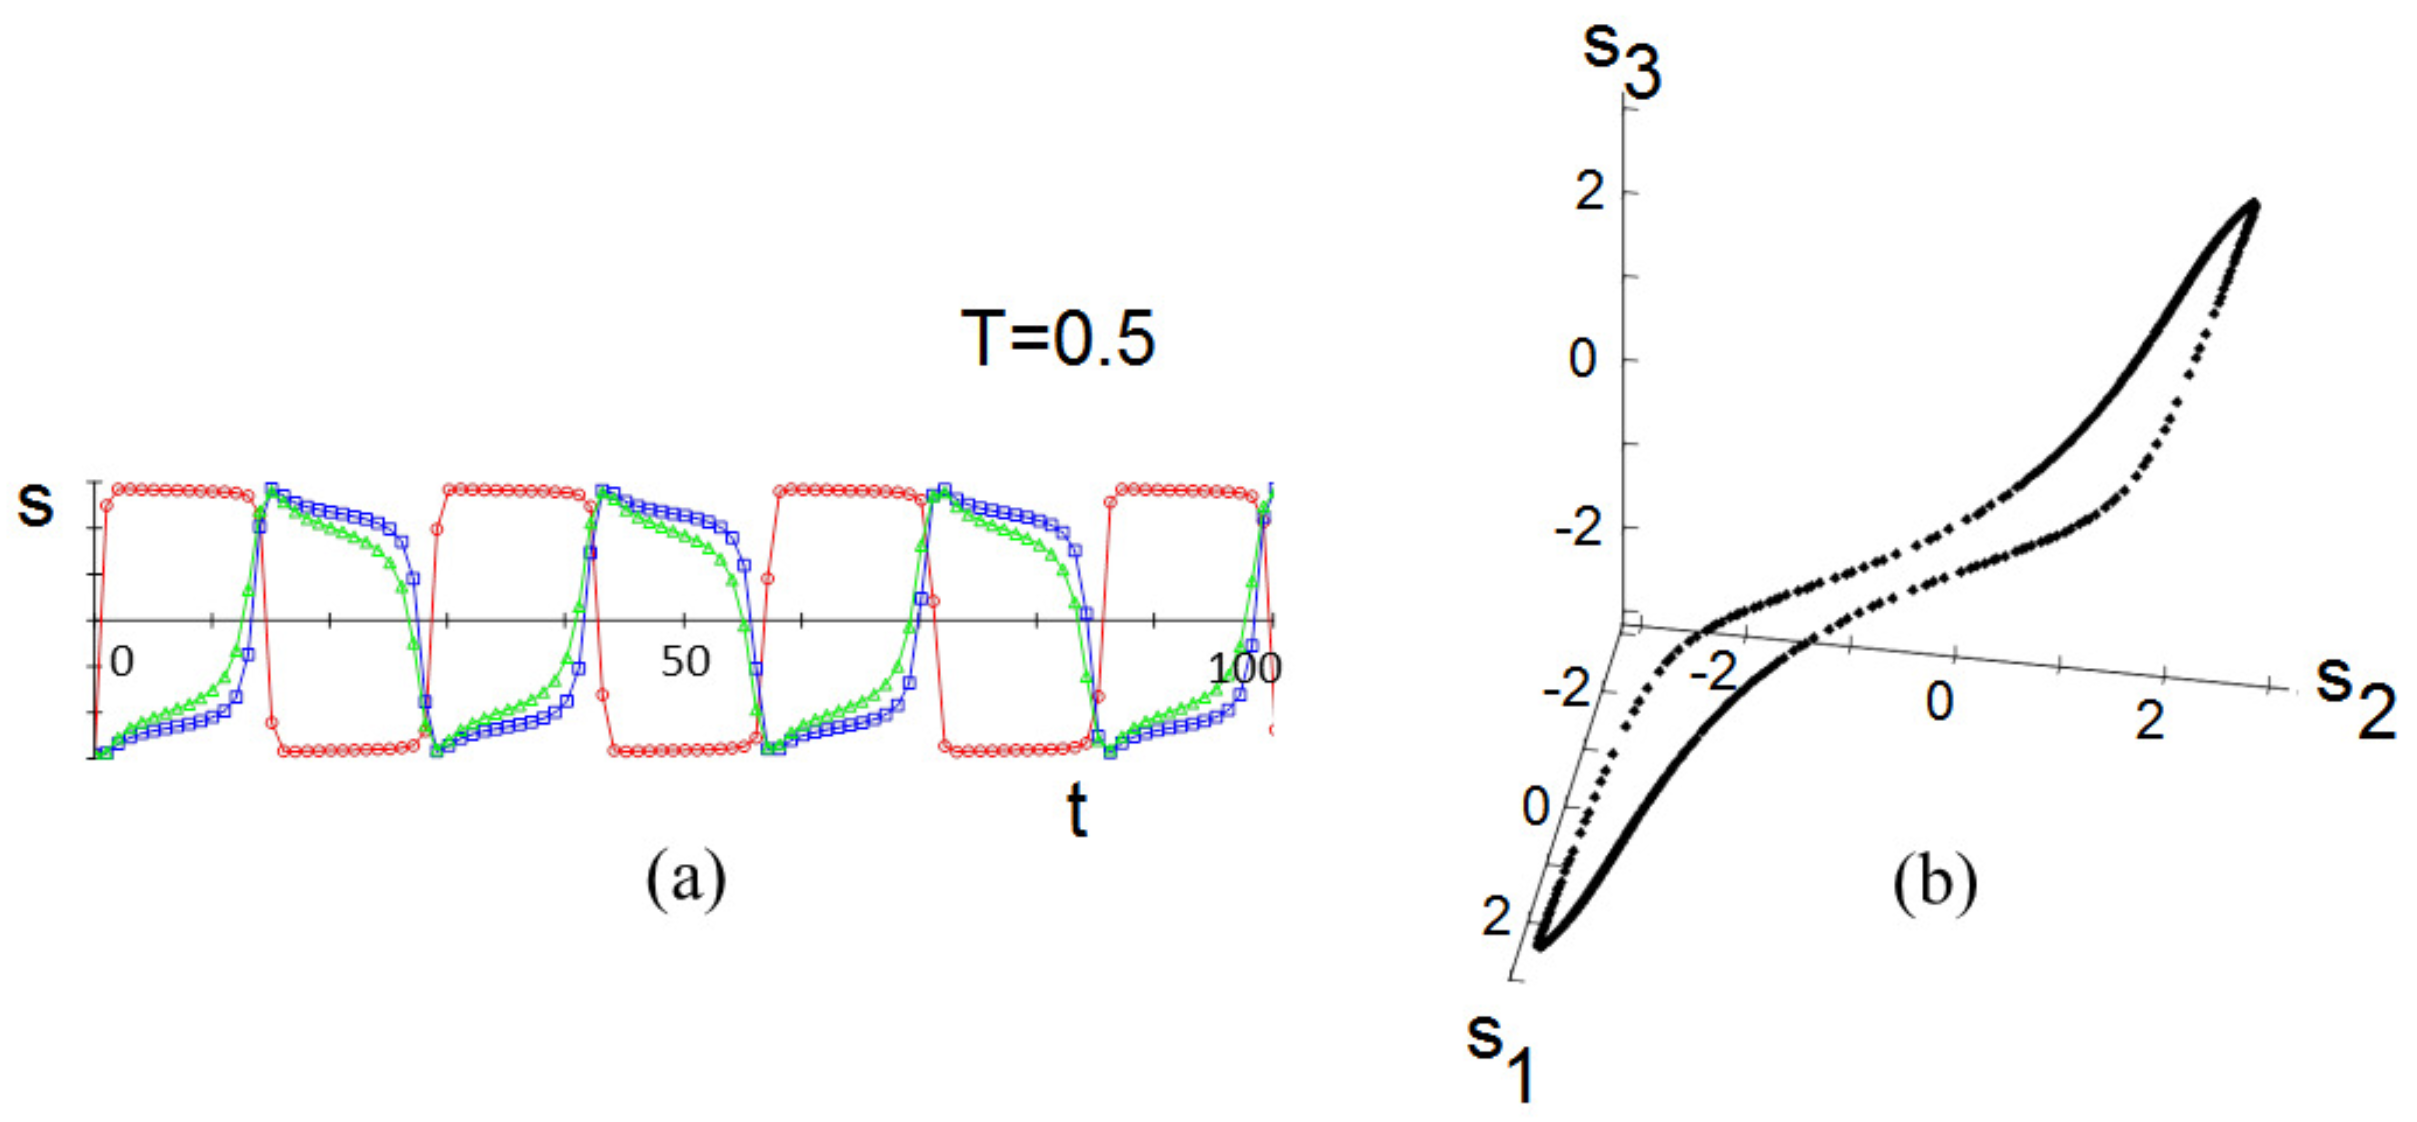
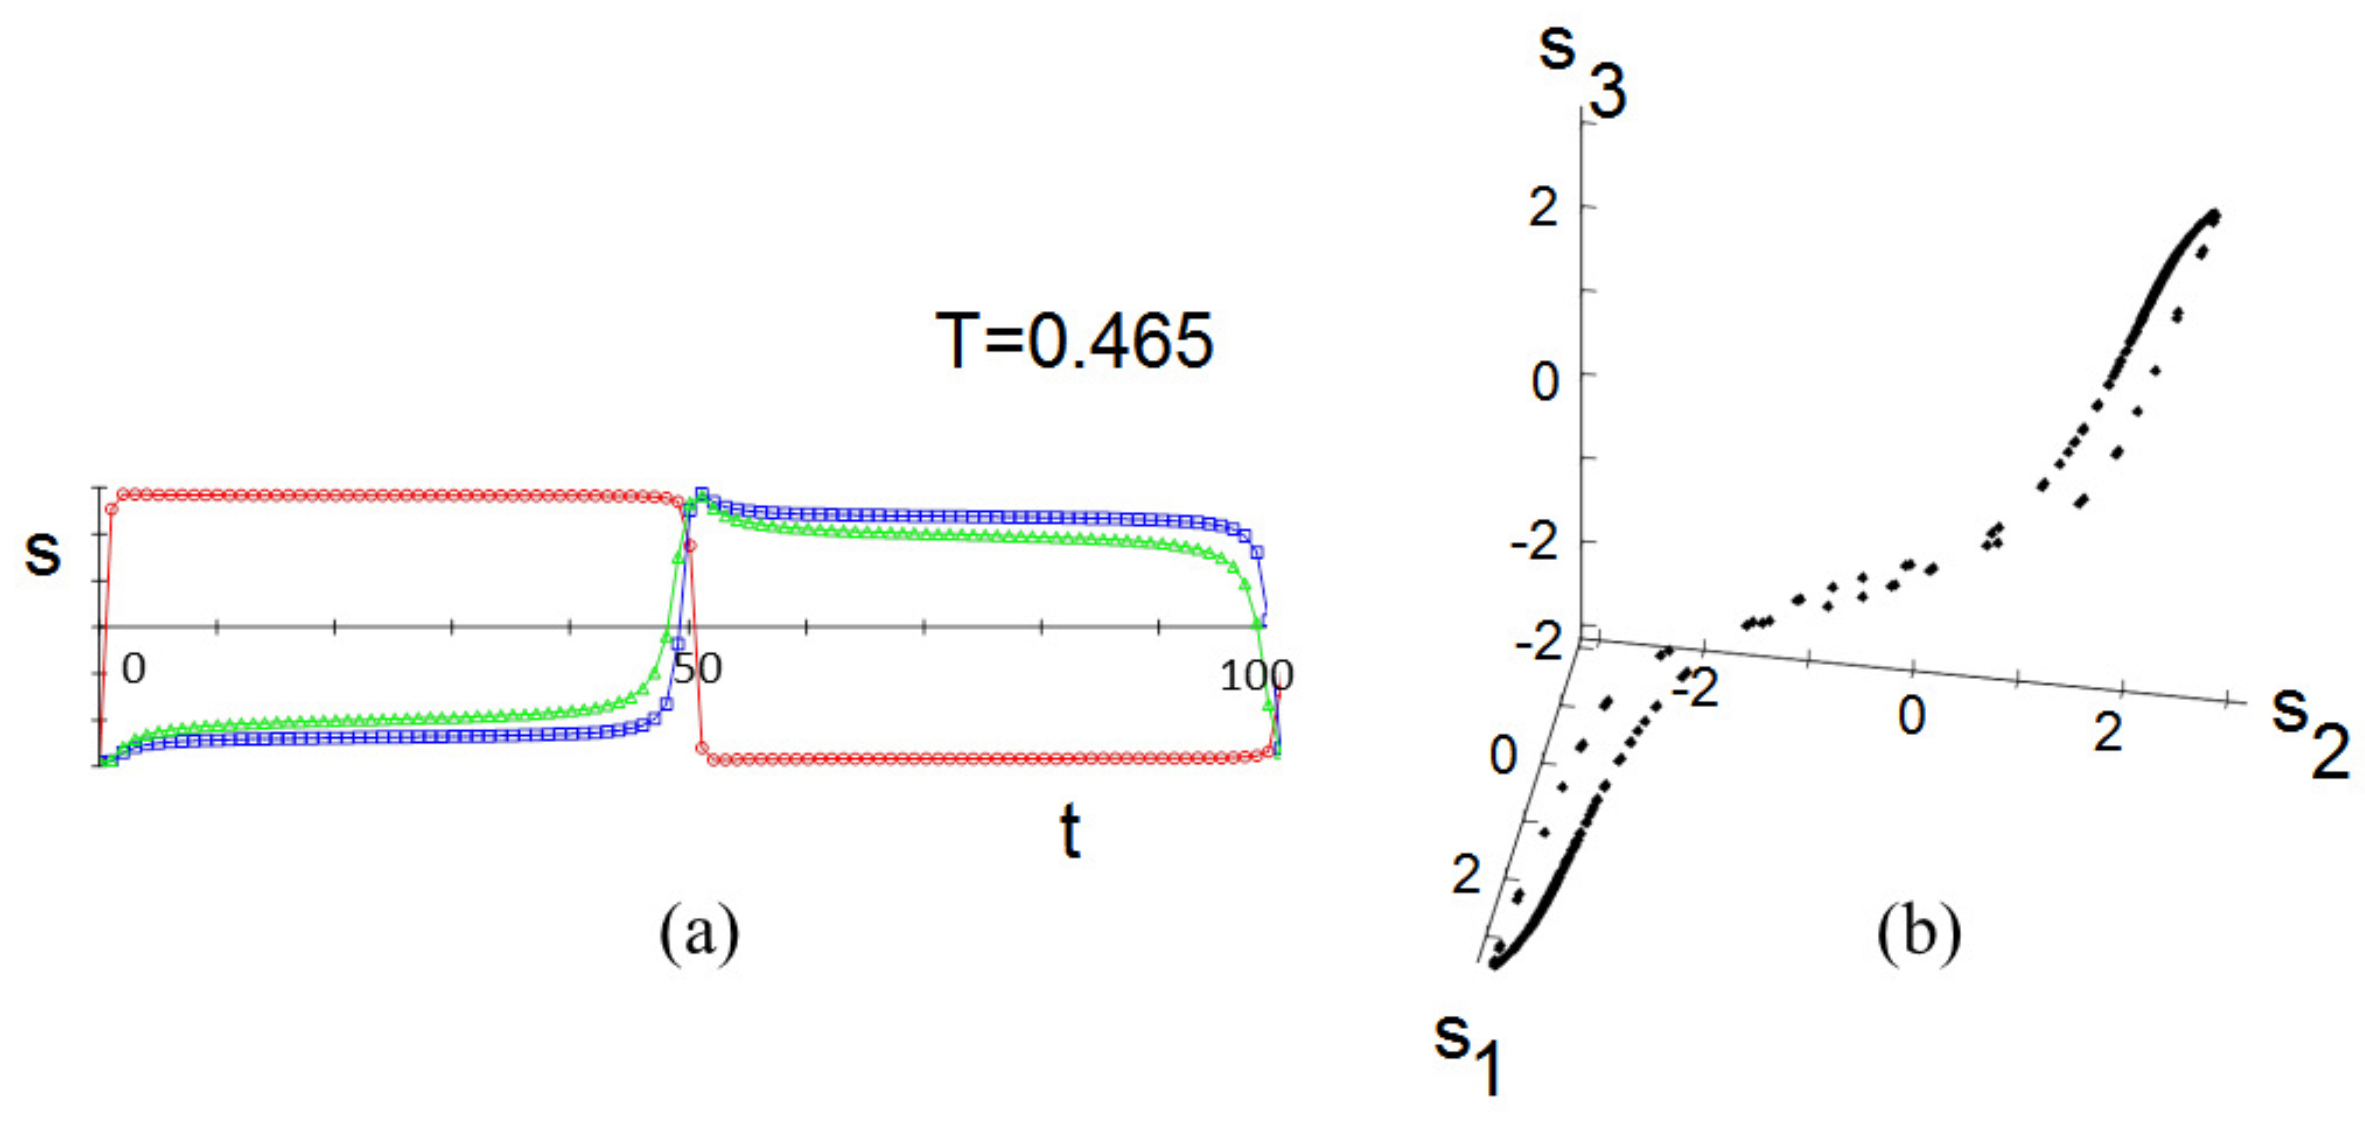
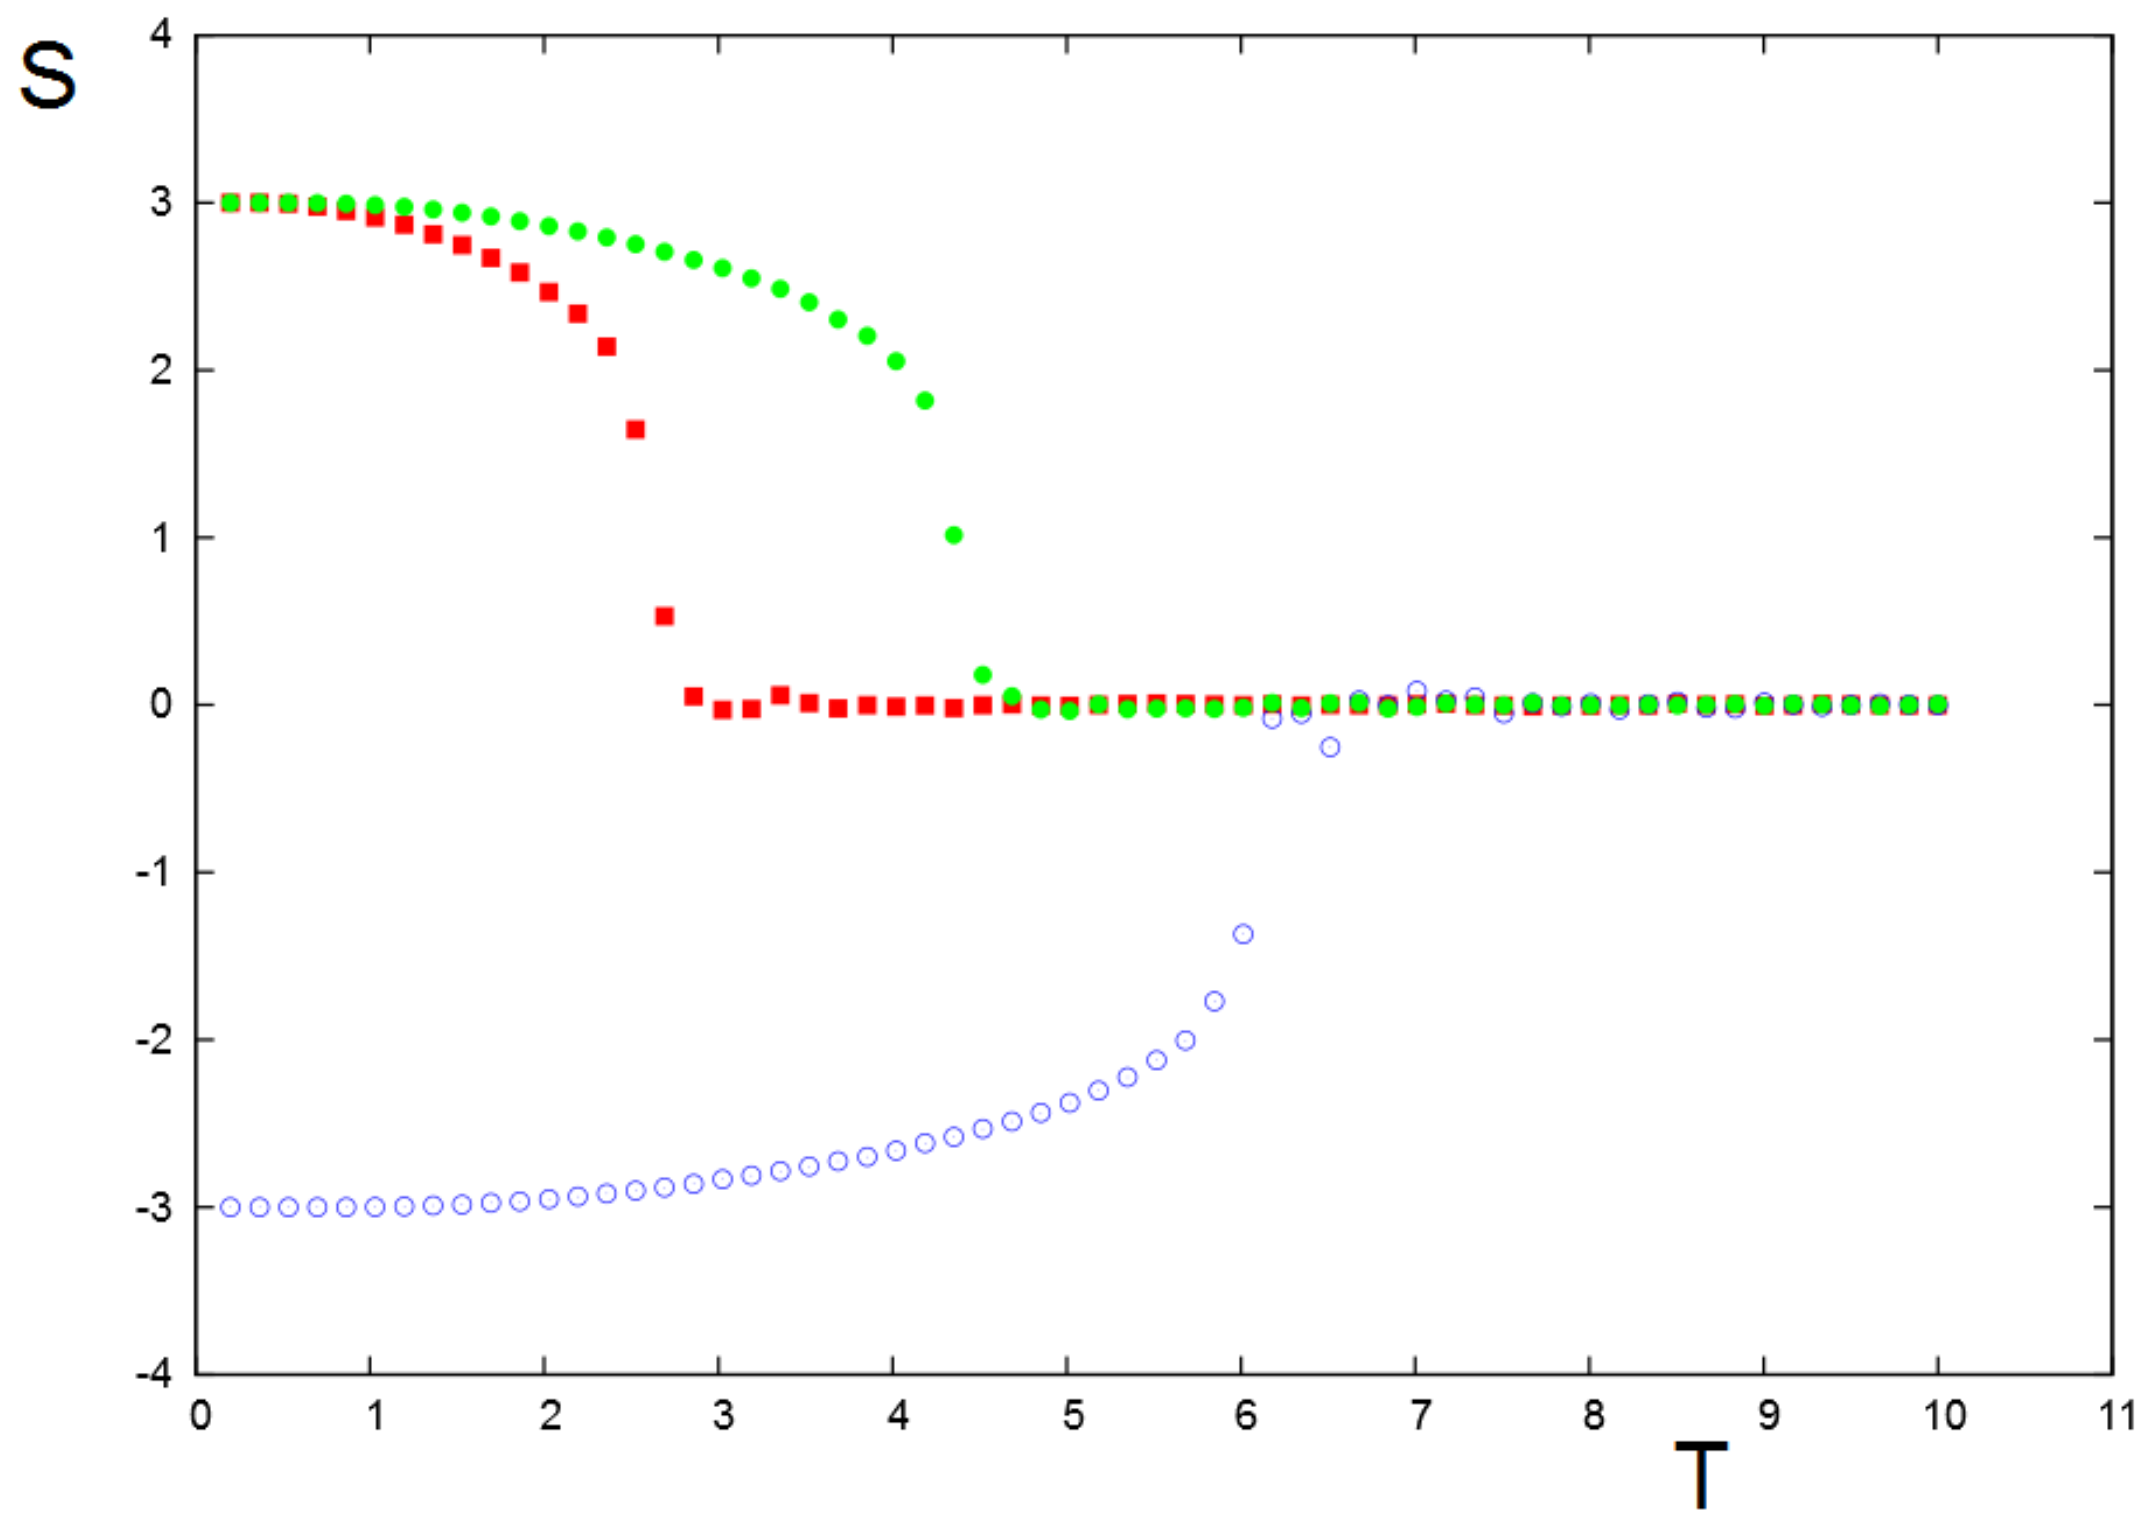
3. Three-Group Dynamics

3.1. Mean-Field Results

s 1 ( t + 1 ) = s = M 1 M 1 s e s ( j 1 s 1 ( t ) + k 12 s 2 ( t ) + k 13 s 3 ( t ) ) s = M 1 M 1 e s ( j 1 s 1 ( t ) + k 12 s 2 ( t ) + k 13 s 3 ( t ) ) ,
s 2 ( t + 1 ) = s = M 2 M 2 s e s ( j 2 s 2 ( t ) + k 23 s 3 ( t ) + k 21 s 1 ( t ) ) s = M 2 M 2 e s ( j 2 s 2 ( t ) + k 23 s 3 ( t ) + k 21 s 1 ( t ) ) ,
s 3 ( t + 1 ) = s = M 3 M 3 s e s ( j 3 s 3 ( t ) + k 31 s 1 ( t ) + k 32 s 2 ( t ) ) s = M 3 M 3 e s ( j 3 s 3 ( t ) + k 31 s 1 ( t ) + k 32 s 2 ( t ) )
where j n = J n / T and k n , m = K n , m / T for n,m = 1, 2, 3. We use units such that k B = 1 . Note that in Equations (9)–(11), s at time t + 1 interacts with the averages s 1 , s 2 and s 3 evaluated at an earlier time t. Here time is measured in units of the delay time. The sums on the right hand sides of Equations (9)–(11) give
s 1 ( t + 1 ) = B ( s 1 ( t ) , s 2 ( t ) , s 3 ( t ) , j 1 , k 12 , k 13 , M 1 )
s 2 ( t + 1 ) = B ( s 2 ( t ) , s 3 ( t ) , s 1 ( t ) , j 2 , k 23 , k 21 , M 2 )
s 3 ( t + 1 ) = B ( s 3 ( t ) , s 1 ( t ) , s 2 ( t ) , j 3 , k 31 , k 32 , M 3 )
This model depends on 3 values M, 3 values of the intra-network couplings J, and 6 values of the inter-network couplings K. We consider next only M M 1 = M 2 = M 3 = 3 as in the above two-group case.
At lower temperatures T = 1.0 the oscillations are sustained and the three groups’ attitudes are synchronized exhibiting the same period, (see Figure 4). The trajectory in the ( s 1 , s 2 , s 3 ) space evolves in the long run to a closed-loop attractor shown in Figure 4.
Lowering the temperatures increases the period of oscillations, and the closed-loop attractor begins to fragment (Figure 6 and Figure 7).
We argue that the higher temperature attractor represents the essence of acute intractability: There is no single point at which the conflict settles, but rather a never-ending (non-sequential) cycling occurs among possible outcomes on the attractor.
At lower temperatures the attractor fragments into a discreet number of fixed points. The system still cycles among them but the discrete configuration corresponds to a lower degree of intractability than the continuous attractor (Figure 5).
At very low temperatures the attractor collapses into a single point that corresponds to the ordered phase of the static model. Because of the symmetry S S there is another static solution where all the attitude values are replaced by their negatives.

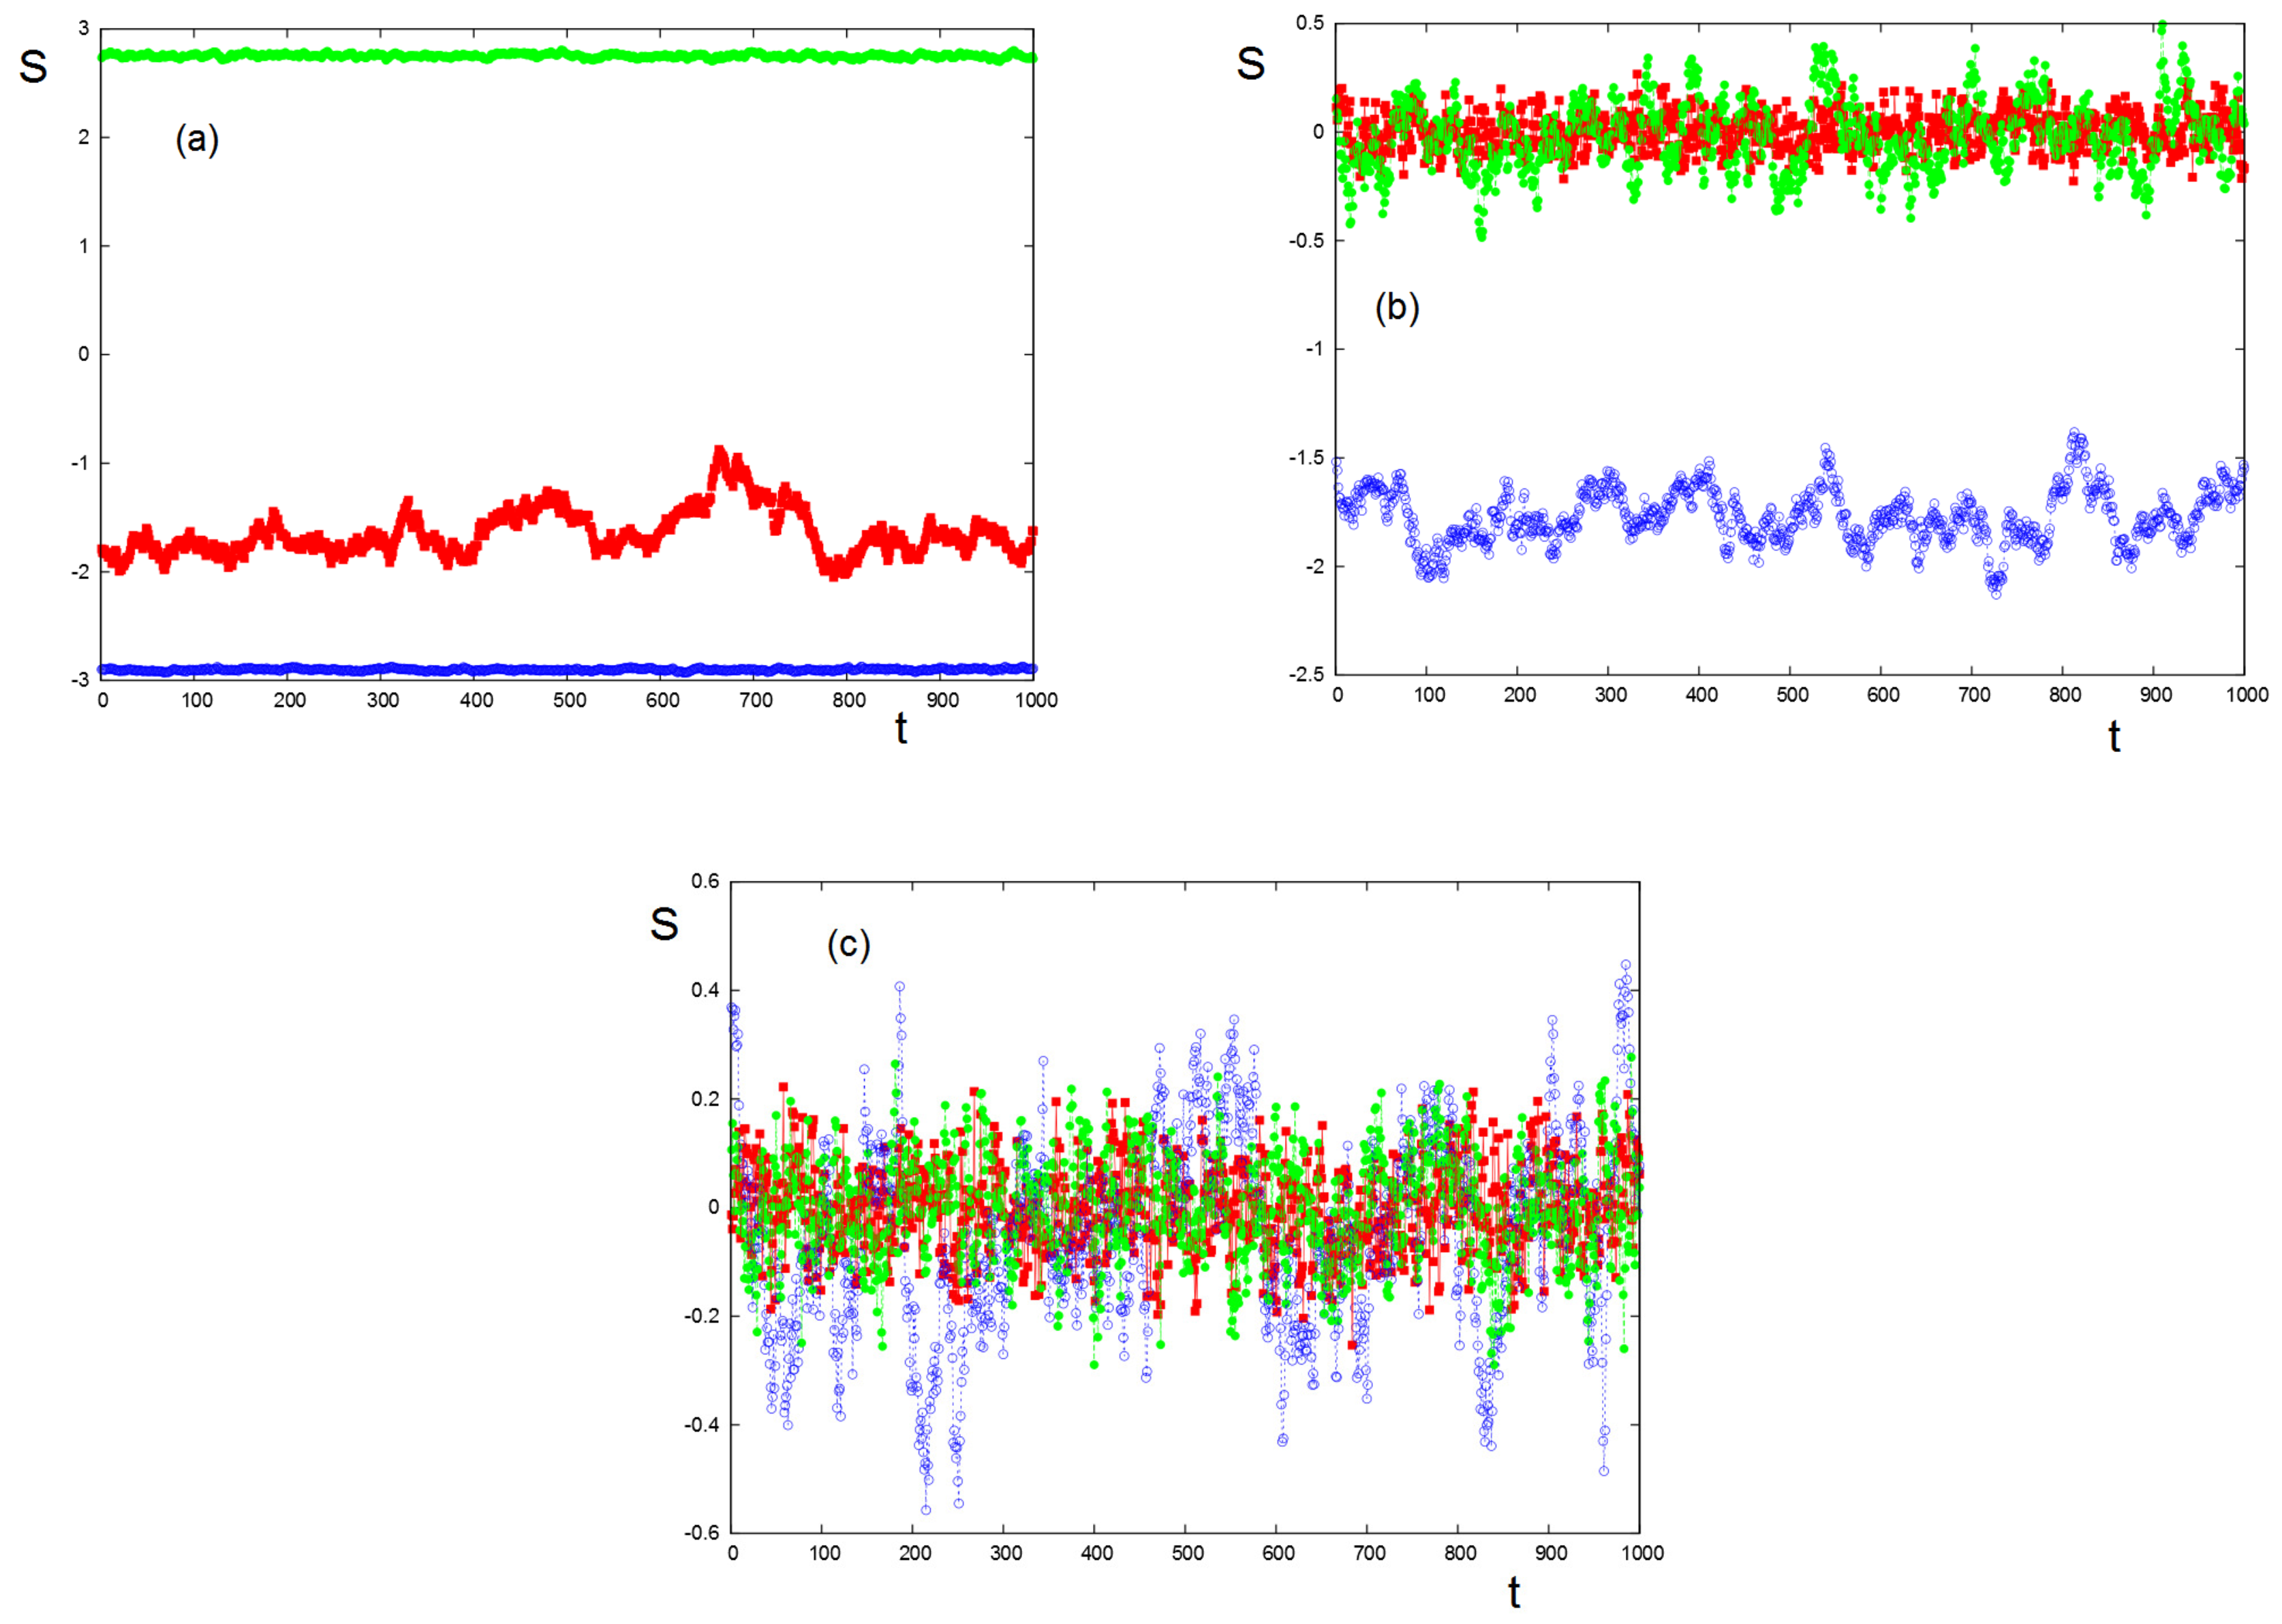
3.2. Monte Carlo Simulation

Monte Carlo simulations have been carried out as described in Section 2 but with three groups. An example is shown in Figure 8. For each group, there is a social temperature T C beyond which the stance of a group is lost, namely s = 0 . We see that T C is not the same for three groups: The higher the intra-group interaction J, the higher T C threshold.
As in the mean-field calculation above, an individual in a given group interacts at the time t + 1 with the average of the action field created by the other groups at the earlier time t. The only difference from the mean-field calculation is the short-range interaction considered in the Monte Carlo simulation. We will see that the results differ in some important aspects.
Once the equilibrium is reached for each group, we turn on the interactions between groups at time t.
An example at low T is shown in Figure 8 where the inter-group interactions may or not destroy the order of a group. We have chosen the interaction strengths and signs in the example below to illustrate the case of Serbia–Herzegovina–Croatia 2018 election [13].
At higher T, the order of each group is weakened. The inter-group interactions cause the groups’ stances to oscillate widely without periodicity as also seen in the long-range mean-field results above. We observe that at times the stronger group 2 dominates the other two. This pattern reflects the level of intractability of the three-group conflict simulated here, consistent with the longer-term mean-field results. While the conflict is intractable at all the temperatures of Figure 9, at the lower temperature (corresponding to a stable context) the groups are ‘stuck’ in predictable ways (see Figure 9a); as the context gets heated, the three-group system cycles unpredictably through various stages (Figure 9b,c).
These results have been discussed in the case of Serbia–Herzegovina–Croatia election in 2018. The parameters used in Figure 9 correspond to the situation of this three-group competition [13].

4. Conclusions

We have shown in this paper that statistical physics is a suitable tool to study social conflicts. In particular, we have outlined the Mean-Field Theory and the Monte Carlo simulation for the two- and three-group conflicts. We have shown the importance of the inter-group interaction which is at the origin of the fluctuation of the group stances if the social temperature is in a region of social instability. Intractability of conflicts is also seen with an appropriate choice of those parameters.
Generalizing the above methods to other social phenomena is possible, in particular in the domain of macro-economy [15].

Author Contributions

H.T.D., M.K. and S.K. have equally contributed in all tasks concerning this paper. All authors have read and agreed to the published version of the manuscript.

Funding

This research received no external funding.

Conflicts of Interest

The authors declare no conflict of interest.

References

  1. Diep, H.T. Statistical Physics: Fundamentals and Application to Condensed Matter; World Scientific: Singapore, 2015. [Google Scholar]
  2. Buchanan, M. The Social Atom; Bloomsbury: New York, NY, USA, 2007. [Google Scholar]
  3. Galam, S. Sociophysics: A Physicist’s Modeling of Psycho-Political Phenomena; Springer Science & Business Media: Berlin, Germany, 2012. [Google Scholar]
  4. Castellano, C.; Fortunato, S.; Loreto, V. Statistical physics of social dynamics. Rev. Mod. Phys. 2009, 81, 591. [Google Scholar] [CrossRef]
  5. Coser, L.A. The Functions of Social Conflict; Routledge: Abingdon-on-Thames, UK, 1956; Volume 9. [Google Scholar]
  6. Druckman, D. Human Factors in International Negotiations: A Survey of Research on Social-psychological Aspects of International Conflict; Schweppe Research and Education Fund, Academy for Educational Development: Washington, DC, USA, 1971. [Google Scholar]
  7. Pruitt, D.G. Social Conflict; McGraw-Hill: New York, NY, USA, 1998. [Google Scholar]
  8. Schelling, T.C. The Strategy of Confict; Harvard University Press: Cambridge, MA, USA, 1960. [Google Scholar]
  9. Simons, H.W. Persuasion in social conflicts: A critique of prevailing conceptions and a framework for future research. Commun. Monogr. 1972, 39, 227–247. [Google Scholar] [CrossRef]
  10. Diep, H.T.; Kaufman, M.; Kaufman, S. Dynamics of two-group conflicts: A statistical physics model. Phys. A Stat. Mech. Appl. 2017, 469, 183–199. [Google Scholar] [CrossRef]
  11. Kaufman, M.; Kaufman, S.; Diep, H.T. Scenarios of Social Conflict Dynamics on Duplex Networks. J. Policy Complex Syst. 2017, 3, 3–13. [Google Scholar] [CrossRef]
  12. Galam, S. The Trump phenomenon an explanation from sociophysics. arXiv 2016, arXiv:1609.03933v1. [Google Scholar] [CrossRef]
  13. Kaufman, M.; Diep, H.T.; Kaufman, S. Sociophysics of intractable conflicts: Three-group dynamics. Phys. A Stat. Mech. Appl. 2019, 517, 175–187. [Google Scholar] [CrossRef]
  14. Binder, K.; Heermann, D.W. Monte Carlo Simulation in Statistical Physics; Springer: Berlin, Germany, 1992. [Google Scholar]
  15. Diep, H.T.; Desgranges, G. Dynamics of Price Behavior in Stock Markets: A Statistical Physics Approach. 2019. in preparation. [Google Scholar] [CrossRef]
Figure 1. All graphs are for K 12 = K 21 = 0.2 . For J 1 = J 2 < 0.15 the time evolution is decaying oscillations (not shown). (a) J 1 = J 2 = 0.15 the state is critical and the amplitude of oscillations does not decay in time; (b) J 1 = J 2 = 0.6 the period of oscillations is long; (c) J 1 = J 2 = 0.7 the S A , S B evolve in time to non-zero steady state values. The transition from (b) to (c) is discontinuous (not shown).
Proceedings 46 00004 g001
Figure 2. (a) Before interaction J A = J B = 0.02 , q A = q B = 7 , initial conditions S A = S B = 3 , both groups become “disordered” at T c 0 102 (arbitrary unit); (b) with inter-group interaction K A B = K B A = 0.005 , both groups become “disordered” at T c = 53 .
Proceedings 46 00004 g002
Figure 3. Dynamics of two groups upon interaction K A B = K B A = 0.005 with J A = J B = 0.02 , q A = q B = 7 , initial conditions S A = S B = 3 : (a) At “social temperature” T = 48 below T c = 53 where both groups are “ordered”; (b) at “social temperature” T = 74 between T c and T c 0 = 102 (values given in the caption of Figure 2); (c) at T = 125 above T c 0 in the initial disordered phase of both groups. See text for comments.
Proceedings 46 00004 g003
Figure 4. (ac) Synchronized sustained oscillations for groups 1–3, respectively at T = 1.0 ; (d) closed loop attractor. For color codes and values of parameters, see Figure 5.
Proceedings 46 00004 g004
Figure 5. In this figure and for all following figures, groups 1–3 are represented by red, blue and green symbols, respectively. (ac) Damped oscillations at high T for groups 1–3, respectively: T = 1.45 ; (d) spiral trajectory to disorder. J 1 = 0.15 , J 2 = 0.35 , J 3 = 0.25 , K 12 = 0.2 , K 21 = 0.2 , K 23 = 0.1 , K 32 = 0.1 , K 31 = 0.15 , K 13 = 0.15 .
Proceedings 46 00004 g005
Figure 6. (a) Synchronization; (b) fragmented attractor. T = 0.5 . For color codes and values of parameters, see Figure 5.
Proceedings 46 00004 g006
Figure 7. (a) Synchronization; (b) fragmented attractor. T = 0.465 . For color codes and values of parameters, see Figure 5.
Proceedings 46 00004 g007
Figure 8. Stance of the three groups as a function of social temperature T before inter-group interactions are turned on. J 1 = 0.15 , J 2 = 0.35 , J 3 = 0.25 . For color codes, see Figure 5. See text for comments.
Proceedings 46 00004 g008
Figure 9. Time-dependence of three groups’ stances at low temperatures (for color codes, see Figure 5): (a) T = 2.5254 , all three groups are ordered; (b) T = 5.8474 , groups 1 and 3 are disordered, group 2 is not disordered; (c) T = 7.5084 , all 3 groups are disordered. The same parameters as in Figure 8 have been used: J 1 = 0.15 , J 2 = 0.35 , J 3 = 0.25 , K 12 = 0.20 , K 21 = 0.20 , K 13 = 0.15 , K 31 = 0.15 , K 23 = 0.10 , K 32 = 0.10 .
Proceedings 46 00004 g009
Publisher’s Note: MDPI stays neutral with regard to jurisdictional claims in published maps and institutional affiliations.

