Proceeding Paper

Information Length as a New Diagnostic of Stochastic Resonance

1
School of Mathematics and Statistics, University of Sheffield, Sheffield S3 7RH, UK
2
Department of Applied Mathematics, University of Leeds, Leeds LS2 9JT, UK
*
Author to whom correspondence should be addressed.
Presented at the 5th International Electronic Conference on Entropy and Its Applications, 18–30 November 2019; Available online: https://ecea-5.sciforum.net/.
Current address: Fluid and Complex Systems Research Centre, Coventry University, Coventry CV1 2TT, UK.
Proceedings 2020, 46(1), 10; https://doi.org/10.3390/ecea-5-06667
Published: 17 November 2019

Abstract

:
Stochastic resonance is a subtle, yet powerful phenomenon in which noise plays an interesting role of amplifying a signal instead of attenuating it. It has attracted great attention with a vast number of applications in physics, chemistry, biology, etc. Popular measures to study stochastic resonance include signal-to-noise ratios, residence time distributions, and different information theoretic measures. Here, we show that the information length provides a novel method to capture stochastic resonance. The information length measures the total number of statistically different states along the path of a system. Specifically, we consider the classical double-well model of stochastic resonance in which a particle in a potential V ( x , t ) = [ x 2 / 2 + x 4 / 4 A sin ( ω t ) x ] is subject to an additional stochastic forcing that causes it to occasionally jump between the two wells at x ± 1 . We present direct numerical solutions of the Fokker–Planck equation for the probability density function p ( x , t ) for ω = 10 2 to 10 6 , and A [ 0 , 0.2] and show that the information length shows a very clear signal of the resonance. That is, stochastic resonance is reflected in the total number of different statistical states that a system passes through.

1. Introduction

Mutual interaction between two systems is most effective when the time scales of the two match, i.e., at the resonance. Time scale matching is manifested in a more subtle manner in stochastic resonance [1,2,3,4,5,6,7] as it occurs when the escape time scale [8,9] due to stochasticity matches the modulation time scale. One of the interesting consequences of stochastic resonance is that a noise plays an unusual role of amplifying a signal instead of attenuating it. Since the pioneering work by Benzi et al. [1] and Nicolis and Nicolis [2] (stochastic resonance could explain the relatively regular occurrence of ice ages by weak periodic modulations in the Earth’s orbital eccentricity), it has attracted great attention with numerous applications in physics, chemistry, biology, etc. [3,4,5,6,7]. Most popular diagnostic quantities that have been used to understand stochastic resonances include the signal-to-noise ratios, residence time distributions, escape time [8,9] and different information theoretic measures, e.g., [3,10,11,12,13,14,15,16,17].
The purpose of this paper is to introduce a new way of describing stochastic resonance from the perspective of information geometry. We do this by mapping the evolution of a stochastic system to a statistical space and interpret stochastic resonance in terms of the total number of statistically different states that a system passes through in time over a cycle of the modulation. The latter is quantified by information length L [18,19,20,21,22,23,24,25,26]. Specifically, for a time-dependent Probability Density Function (PDF) p ( x , t ) for a stochastic variable, we define the (time-dependent) correlation time τ ( t ) of the PDF by
E ( t ) 1 τ 2 = 1 p ( x , t ) p ( x , t ) t 2 d x .
Since τ ( t ) in general depends on time t, we measure the infinitesimal time d t in unit of τ ( t ) and integrate over the time [ 0 , t ] to calculate the total number of statistically different states as
L ( t ) d t τ ( t ) = 1 p ( x , t ) p ( x , t ) t 2 d x d t .
Note that the differential element d L = d t / τ ( t ) measures the rate at which new information is being generated during the evolution of p. We can relate L as the time integral of the infinitesimal relative entropy (see Appendix A). Unlike the relative entropy or Kullback–Leibler divergence [27], which only compares the initial and final PDFs, L is a path-dependent quantity between some initial and final times.
For stochastic resonance which is a periodically forced problem, we calculate L over one period T = 2 π ω as Δ L = L ( t + T ) L ( t ) . We show below that stochastic resonance is accompanied by a rapid change in PDF, generating a new source of information. The latter is captured by Δ L .

2. Double-Well Potential Model

We consider an over-damped system for a stochastic variable x under the influence of a periodic potential V ( x , t ) and a short-correlated Gaussian noise ξ
d x d t = x V + ξ = x x 3 + A sin ( ω t ) + ξ ,
where
V ( x , t ) = x 2 2 + x 4 4 A sin ( ω t ) x ,
and
ξ ( t ) = 0 , ξ ( t 1 ) ξ ( t 2 ) = 2 D δ ( t 1 t 2 ) .
Here, x and t in Equation (3) are given in dimensionless form (in space and time); the angular brackets in Equation (5) denote the average over ξ and ξ = 0 ; D in Equation (5) is the strength of the stochastic noise ξ .
It is useful to note that for A = 0 , two stable equilibrium points are located at x = ± 1 , separated by an unstable point at x = 0 . The potential barrier between the two wells has height V ( 0 ) V ( ± 1 ) = 1 / 4 . For 0 < A 1 , the stable equilibria move as x ± 1 + ( A / 2 ) sin ( ω t ) , while the depth of the wells fluctuates as 1 / 4 A sin ( ω t ) to leading order in A. That is, A 0 causes the asymmetry in the two potential wells, each well being slightly deeper than the other one for half of the cycle. As D increases, the probability of switching between the two potential wells increases with more particles overcoming the potential barrier.
For a stationary potential V ( x ) with A = 0 , the switching between the two wells is quantified by the following Kramers rate [28]
r K = 1 π 2 exp 1 4 D .
In the limit of D 0 , Equation (6) gives r K 0 , confirming no switching without ξ .
To investigate numerically the effect of A, D and ω on stochastic resonance, we consider the Fokker–Planck equation [29] for p ( x , t ) corresponding to Equation (3)
t p ( x , t ) = x x x 3 + A sin ( ω t ) p ( x , t ) + D 2 x 2 p ( x , t ) .
In the limit of the adiabatic or quasi-static approximation, p ( x , t ) is determined by the instantaneous potential as
p = p 0 exp V ( x , t ) / D ,
where p 0 is the normalization constant for + p d x = 1 .
For the results presented in the following, we solve Equation (7) numerically by using second-order accurate finite differences in both space and time. We take a sufficiently large interval in x as x [ 3 , 3 ] so that we can impose p = 0 boundary conditions at x = ± 3 . We check that the total probability 3 3 p d x = 1 within 10 7 . We also use sufficiently small grid size Δ x = 10 3 and time steps Δ t = π · 10 3 to ensure a good numerical accuracy.

3. Results

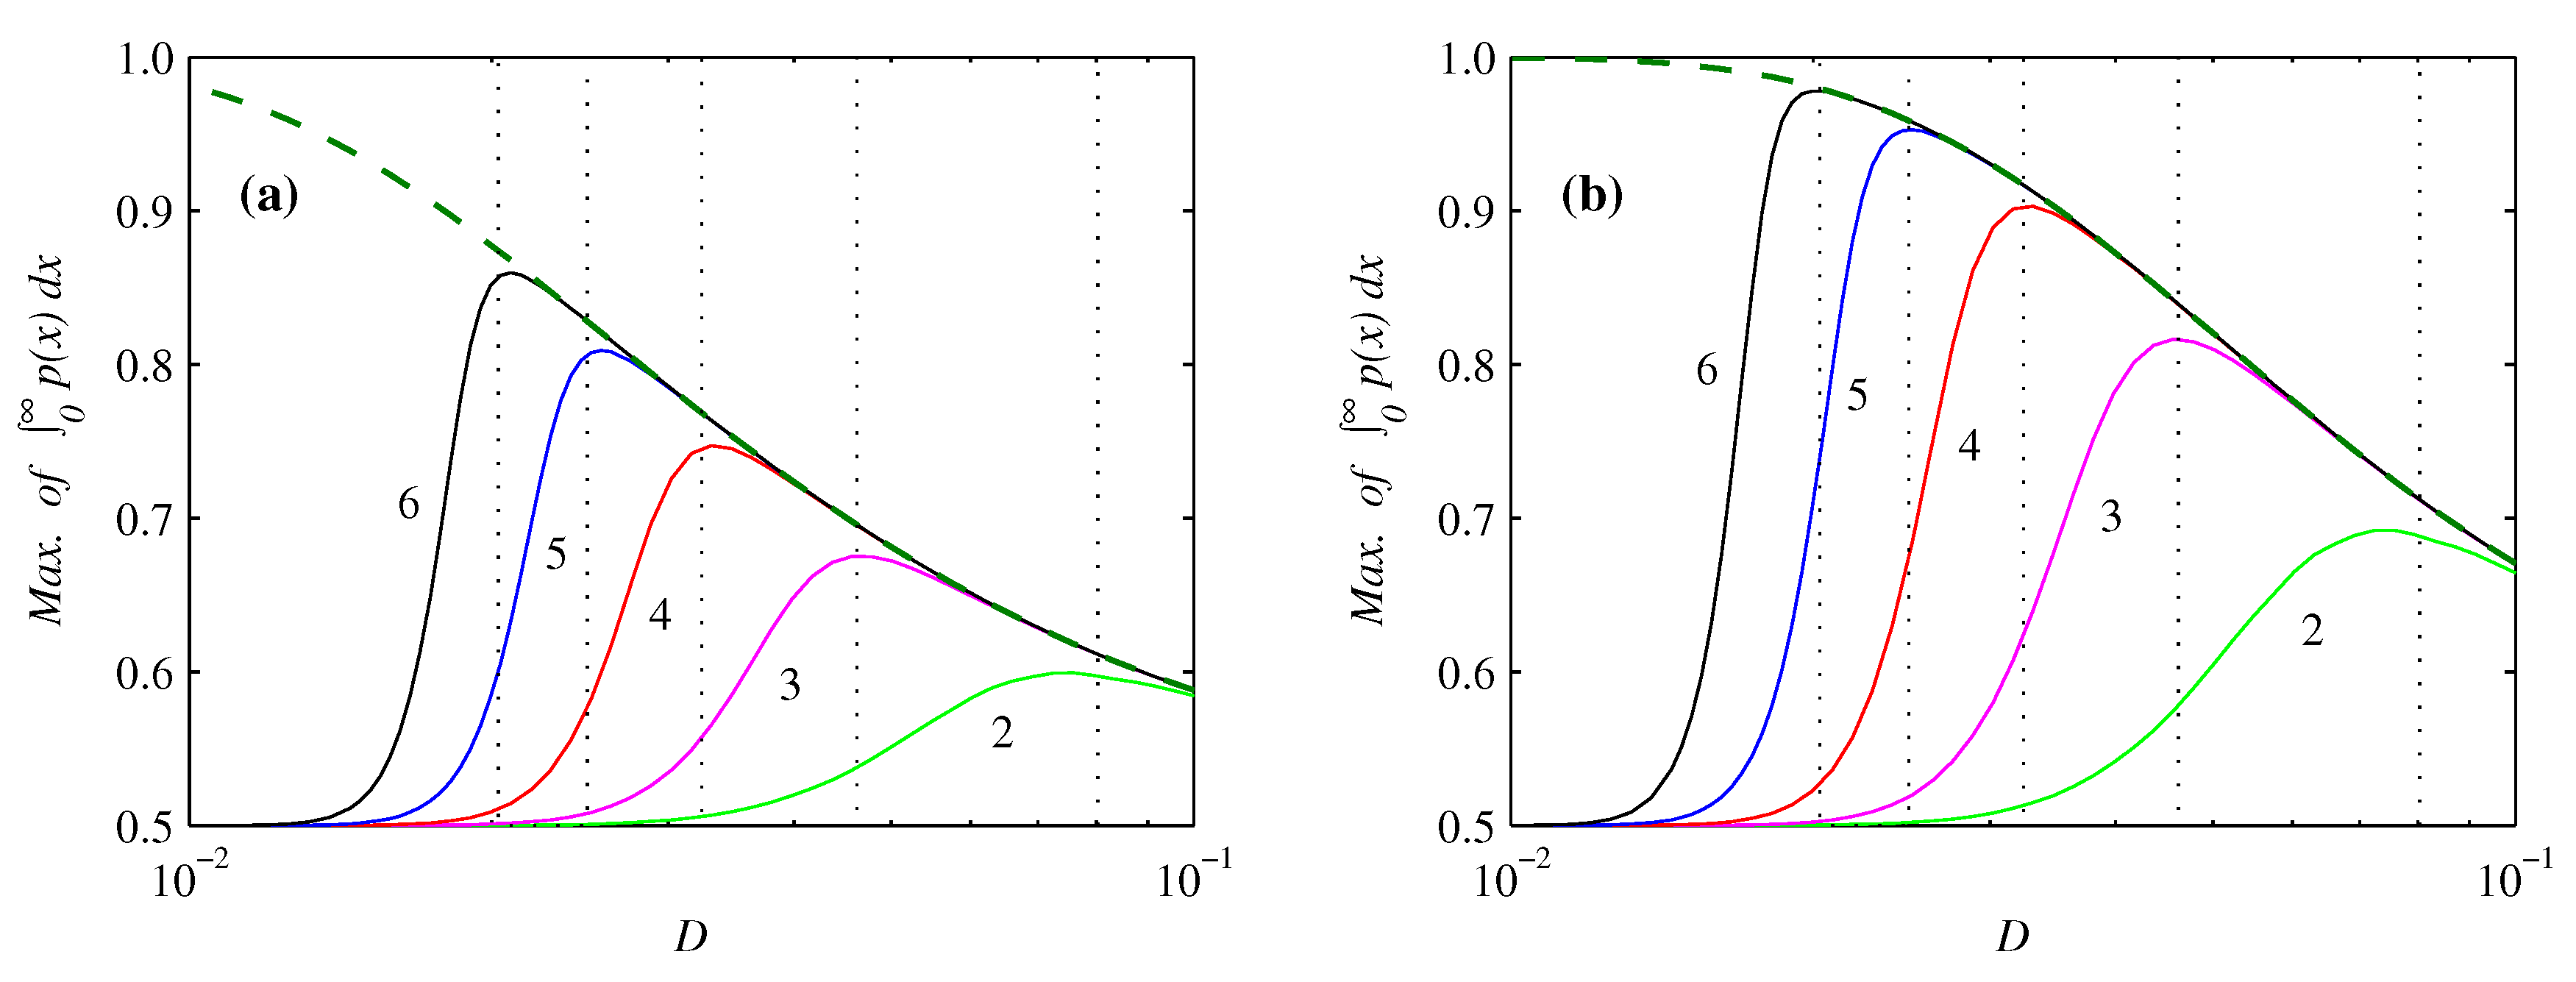
3.1. Probability Density Functions

We begin by presenting snapshots of the PDFs for small A = 0.04 and ω = 10 4 at the times t = 0 , T / 4 , T / 2 and 3 T / 4 , mod ( T ) in Figure 1 around x 1 , where T = 2 π ω is the period of the oscillatory force. Note that the behaviour around x 1 is exactly the same as that around x 1 by symmetry.
Notable in Figure 1 is the oscillation of the peak position in time as ( A / 2 ) sin ( ω t ) despite the fact that the particle switching between the wells is not necessarily following the adiabatic approximation (Equation (8)).That is, for small ω , the behaviour within each well is almost adiabatic. In comparison, for large ω = O ( 1 ) , the potential does vary so quickly that the PDFs are not adiabatic, the peak positions oscillating with an amplitude A / 4 + ω 2 (see, e.g., [7]). We also observe in Figure 1 that the widths of the PDFs increases with D. While for D = 0.01 the PDFs are very close to Gaussian, for larger D = 0.1 , the PDF are not Gaussian in general.
Furthermore, while the amplitudes of p are of similar magnitude for small D = 0.01 , they become drastically different for larger D = 0.0324 and 0.1 . In particular, for D = 0.0324 , the PDFs at t = T / 4 and 3 T / 4 , and even t = 0 and T / 2 , are significantly different, with t = T / 4 yielding a far higher peak than t = 3 T / 4 . These results suggest that 0 p ( x , t ) d x can vary considerably throughout the cycle.
Figure 2 shows the maximum over the cycle of 0 p ( x , t ) d x for ω = 10 2 to 10 6 and D [ 0.01 , 0.1 ] . We can see clearly that if D is too small, this maximum remains essentially 0.5 since there is no preference for one well over the other at any time in the cycle, and hence no synchronization. For larger D however, the values suddenly rise and then slowly decrease again. For smaller ω the rise is more abrupt, and occurs at smaller values of D. For the gradual decrease after the maximum value has been reached, all frequencies ω converge to the same curve.
To understand these results, we use ω = r K and solve ω = exp ( 1 / 4 D ) / ( π 2 ) for D = D res to obtain
D res = 1 4 ln ( π 2 ω ) ,
where the subscript ‘res’ indicates the resonant value. In particular, we see in Figure 2 that the maxima of the individual ω curves all occur very close to their corresponding D res values.
In comparison, the thick dashed lines in Figure 2 show the equivalent results for the adiabatic expression (8) obtained by numerically evaluating quantity
0 exp V ( x , T / 4 ) / D d x / + exp V ( x , T / 4 ) / D d x .
That is, at t = T / 4 , when the asymmetry between the two wells is greatest, we evaluate the probability of being in the lower well, according to the adiabatic PDF.
From Figure 2, we conclude that if D D res , then ω r K . That is, when the modulation is too rapid, the system cannot effectively respond, and the probability of being in either well remains practically 0.5 throughout the entire cycle with no synchronization between the stochastic switching and the modulation. In contrast, if D D res , then ω r K . The imposed modulation is then so slow that the adiabatic relation Equation (8) holds. As the results from (10) show, Equation (8) exhibits synchronization, and in particular stronger synchronization for smaller D, explaining why D should be as small as possible, but not much less than D res , which would switch the resonance off.
These results suggest that a resonant peak occurs only if a scan is done over the noise level D, as presented above. If a scan is done over ω for a fixed D, then the ‘resonance’ becomes a simple on-off phenomenon. This is because if ω r K there is no synchronization; if ω r K there is synchronization, at whatever level (10) yields for the given D (and A), but no variation with ω , since (10) does not involve ω .

3.2. Escape Times

A popular tool to study stochastic resonance is the escape time [8,9,29]. For this, we solve the same Fokker–Planck Equation (7) as before, but now only on the interval x [ 0 , 3 ] with the boundary condition p = 0 at x = 0 . Due to the probability loss, p ( x , t + T ) = c p ( x , t ) , where c < 1 is some factor that depends on the parameters D, ω and A, but is the same for each subsequent period once this behaviour has emerged.
Figure 3 shows this reduction by a constant factor each period, starting from such initialized solutions (rescaled so that they start out with p d x = 1 again). The top row shows the survival probability G ( t ) = 0 p ( x , t ) d x . The bottom row shows the escape rate W ( t ) = d d t G ( t ) . For all choices of D and A, we see that increasing either D or A yields a smaller c with more rapid loss of particles.

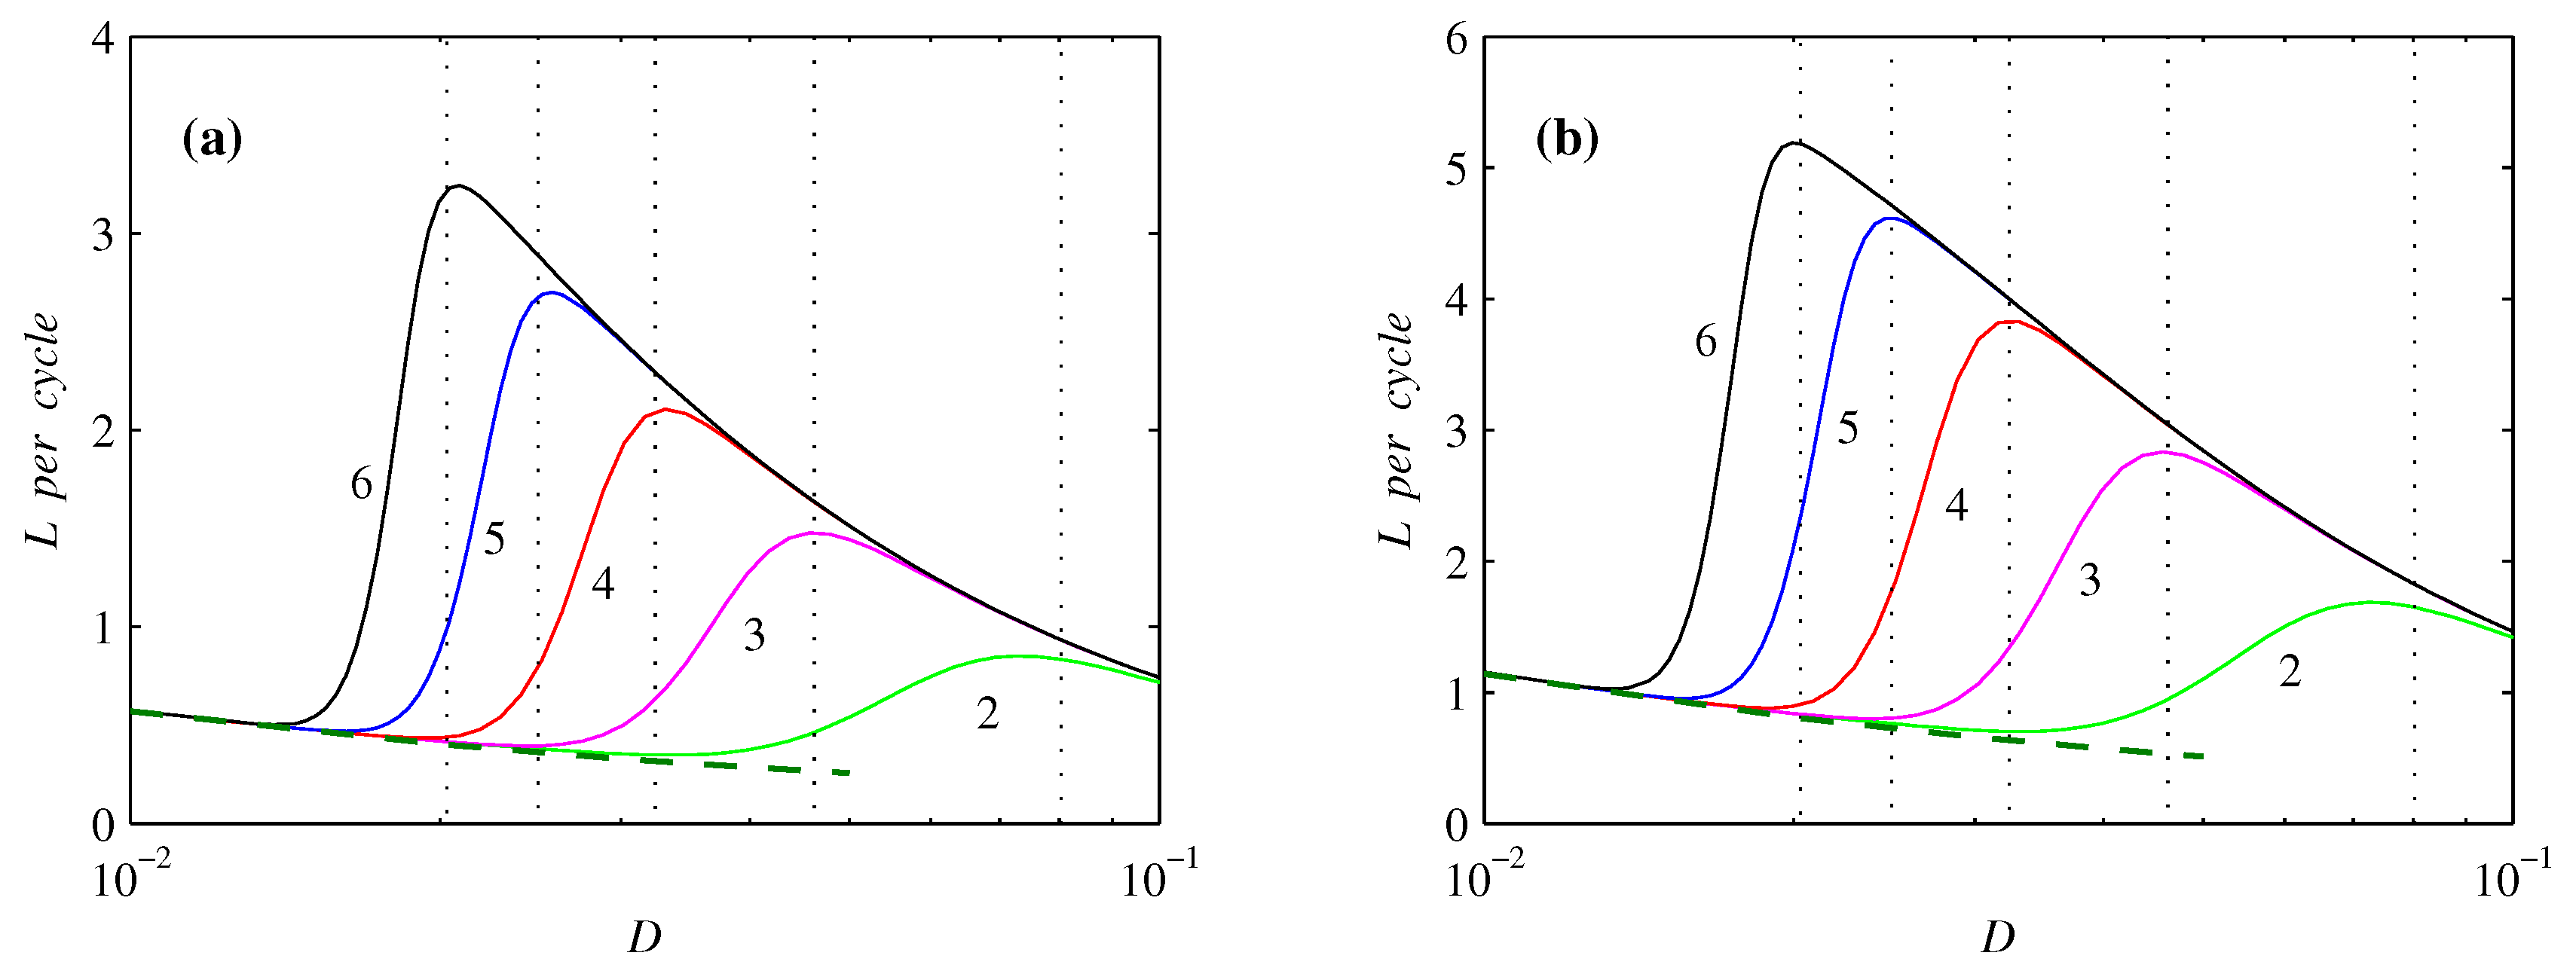
3.3. Information Length

Figure 4 shows E in Equation (1) for the previous solutions from Figure 1. Recalling that the position of the peaks varies as ( A / 2 ) sin ( ω t ) , we see that E is consistently greatest when the peaks are moving fastest. The greatest values of E are for the intermediate case D = 0.0324 . It is important to note that Figure 4 includes the information about how the PDFs move back and forth within a given well.
Figure 5 shows the information length L in Equation (2) per cycle ( Δ L = L ( t + T ) L ( t ) ) associated with the results from Figure 2. We see that L exhibits a beautiful signal of the resonance phenomenon, just as clear as the probabilities themselves in Figure 2. To interpret these results, we start with the thick dashed lines, which are simply 4 A / 1.4 D 1 / 2 . To understand the significance of this formula, we first recall that the peaks move according to ( A / 2 ) sin ( ω t ) . The total distance each peak moves throughout a cycle is therefore 2 A . Next, the two PDF peaks at x ± 1 each have standard deviation σ D / 2 , with the approximation becoming better for smaller D, where the peaks are increasingly close to Gaussian (Figure 1). The width of each peak is therefore 2 σ = 1.4 D 1 / 2 . (As we can also see in Figure 1, the width actually varies slightly throughout the period, but to obtain a lowest order estimate of what L should be, just the average width is sufficient.) So, if each peak moves a total distance 2 A , and has width 1.4 D 1 / 2 , then the number of statistically distinguishable states it moves through is just 2 A / 1.4 D 1 / 2 . The final factor of 2 is simply due to the fact that there are two peaks, each undergoing the same motion. We see therefore that in this small D regime before the resonance sets in, L is measuring precisely the motion of the peaks, and there is no other source of information length.
At the beginning of the resonance there is a sudden increase in L because of the additional information and associated number of statistically distinguishable states caused by the synchronization behaviour; at the synchronization, the probability of being in one well or the other at the appropriate times in the cycle becomes significantly different from 0.5.
Finally, for sufficiently large D, L is decreasing again, in fact, more rapidly than the previous D 1 / 2 scaling. This is because in addition to the previous D 1 / 2 factor, the contribution from the synchronization also decreases again, since according to Figure 2 the synchronization itself decreases once the solutions are back to satisfying the adiabatic condition (10).

4. Conclusions

We presented direct numerical solutions of the Fokker–Planck equation governing the classical double-well model of stochastic resonance. Stochastic resonance was shown to be accompanied by a rapid change in PDF, generating a new source of information. The latter was beautifully captured by the information length.

Author Contributions

These authors contributed equally to this work. All authors have read and agree to the published version of the manuscript.

Funding

This research was in part funded by the Leverhulme Trust Research Fellowship (RF-2018-142-9).

Conflicts of Interest

The authors declare no conflict of interest.

Appendix A. Information Length and Infinitesimal Relative Entropy

We consider two nearby PDFs p 1 = p ( x , t 1 ) and p 2 = p ( x , t 2 ) at time t = t 1 and t 2 and the limit of a very small δ t = t 2 t 1 to do Taylor expansion of D [ p 1 , p 2 ] = d x p 2 ln ( p 2 / p 1 ) by using
t 1 D [ p 1 , p 2 ] = d x p 2 t 1 p 1 p 1 ,
2 t 1 2 D [ p 1 , p 2 ] = d x p 2 ( t 1 p 1 ) 2 p 1 2 t 1 2 p 1 p 1 ,
t 2 D [ p 1 , p 2 ] = d x t 2 p 2 + t 2 p 2 ln p 2 ln p 1 ,
2 t 2 2 D [ p 1 , p 2 ] = d x t 2 2 p 2 + ( t 2 p 2 ) 2 p 2 + t 2 2 p 2 ln p 2 ln p 1 .
In the limit t 2 t 1 = t ( p 2 p 1 = p ), Equations (A1)–(A4) give us
lim t 2 t 1 t 1 D [ p 1 , p 2 ] = lim t 2 t 1 t 2 D [ p 1 , p 2 ] = d x t p = 0 , lim t 2 t 1 2 t 1 2 D [ p 1 , p 2 ] = lim t 2 t 1 2 t 2 2 D [ p 1 , p 2 ] = d x ( t p ) 2 p = 1 τ 2 .
Up to O ( ( d t ) 2 ) ( d t = t 2 t 1 ), Equation (A5) and D ( p 1 , p 1 ) = 0 lead to
D [ p 1 , p 2 ] = 1 2 d x ( t p ( x , t ) ) 2 p ( x , t ) ( d t ) 2 ,
and thus the infinitesimal distance d l ( t 1 ) between t 1 and t 1 + d t as
d l ( t 1 ) = D [ p 1 , p 2 ] = 1 2 d x ( t 1 p ( x , t 1 ) ) 2 p ( x , t 1 ) d t .
By summing d t ( t i ) for i = 0 , 1 , 2 , . . . , n 1 (where n = t / d t ) in the limit d t 0 , we have
lim d t 0 i = 0 n 1 d l ( i d t ) = lim d t 0 i = 0 n 1 D [ p ( x , i d t ) , p ( x , ( i + 1 ) ] d t 0 t d t 1 d x ( t 1 p ( x , t 1 ) ) 2 p ( x , t 1 ) = L ( t ) ,
where L ( t ) is the information length.

References

  1. Benzi, R.; Sutera, A.; Vulpiani, A. The mechanism of stochastic resonance. J. Phys. A 1981, 14, L453–457. [Google Scholar] [CrossRef]
  2. Nicolis, C.; Nicolis, G. Stochastic aspects of climate transitions-additive fluctuations. Tellus 1981, 33, 225–234. [Google Scholar] [CrossRef]
  3. Fauve, S.; Heslot, F. Stochastic resonance in a bistable system. Phys. Lett. 1983, 97, 5–7. [Google Scholar] [CrossRef]
  4. Jung, P.; Hänggi, P. Stochastic nonlinear dynamics modulated by external periodic forces. EPL 1989, 8, 505–510. [Google Scholar] [CrossRef]
  5. Gang, H.; Nicolis, G.; Nicolis, C. Periodically forced Fokker–Planck equation and stochastic resonance. Phys. Rev. A 1990, 42, 2030–2041. [Google Scholar] [CrossRef] [PubMed]
  6. Jung, P.; Hänggi, P. Amplification of small signals via stochastic resonance. Phys. Rev. A 1991, 44, 8032–8042. [Google Scholar] [CrossRef]
  7. Jung, P. Periodically driven stochastic systems. Phys. Rep. 1993, 234, 175–295. [Google Scholar] [CrossRef]
  8. Reimann, P.; Schmid, G.J.; Hänggi, P. Universal equivalence of mean first-passage time and Kramers rate. Phys. Rev. E 1999, 60, R1–R4. [Google Scholar] [CrossRef]
  9. Lehmann, J.; Reimann, P.; Hänggi, P. Surmounting oscillating barriers: Path-integral approach for weak noise. Phys. Rev. E 2000, 62, 6282–6303. [Google Scholar] [CrossRef]
  10. Heneghan, C.; Chow, C.C.; Collins, J.J.; Imhoff, T.T.; Lowen, S.B.; Teich, M.C. Information measures quantifying aperiodic stochastic resonance, Phys. Rev. E 1996, 54, R2228–R2231. [Google Scholar]
  11. Robinson, J.W.C.; Asraf, D.E.; Bulsara, A.R.; Inchiosa, M.E. Information-theoretic distance measures and a generalization of stochastic resonance. Phys. Rev. Lett. 1998, 81, 2850–2853. [Google Scholar] [CrossRef]
  12. Goychuk, I.; Hänggi, P. Stochastic resonance in ion channels characterized by information theory. Phys. Rev. E 2000, 61, 4272–4280. [Google Scholar] [CrossRef] [PubMed]
  13. Goychuk, I. Information transfer with rate-modulated Poisson processes: A simple model for nonstationary stochastic resonance. Phys. Rev. E 2001, 64, 21909. [Google Scholar] [CrossRef] [PubMed]
  14. McDonnell, M.D.; Stocks, N.G.; Pearce, C.E.M.; Abbott, D. Stochastic Resonance: From Suprathreshold Stochastic Resonance to Stochastic Signal Quantization; Cambridge University Press: Cambridge, UK, 2008. [Google Scholar]
  15. Goychuk, I.; Hänggi, P. Nonstationary stochastic resonance viewed through the lens of information theory. Eur. Phys. J. B 2009, 69, 29–35. [Google Scholar] [CrossRef]
  16. Meyer, B. Optimal information transfer and stochastic resonance in collective decision making. Swarm Intell. 2017, 11, 131–154. [Google Scholar] [CrossRef]
  17. Gillard, N.; Belin, E.; Chapeau-Blondeau, F. Enhancing qubit information with quantum thermal noise. Physica A 2018, 507, 219–230. [Google Scholar] [CrossRef]
  18. Nicholson, S.B.; Kim, E. Investigation of the statistical distance to reach stationary distributions. Phys. Lett. A 2015, 379, 83–88. [Google Scholar] [CrossRef]
  19. Heseltine, J.; Kim, E. Novel mapping in non-equilibrium stochastic processes. J. Phys. 2016, 49, 175002. [Google Scholar] [CrossRef]
  20. Kim, E.; Lee, U.; Heseltine, J.; Hollerbach, R. Geometric structure and geodesic in a solvable model of nonequilibrium process. Phys. Rev. E 2016, 93, 062127. [Google Scholar] [CrossRef]
  21. Nicholson, S.; Kim, E. Structures in sound: Analysis of classical music using the information length. Entropy 2016, 18, 258. [Google Scholar] [CrossRef]
  22. Tenkès, L.-M.; Hollerbach, R.; Kim, E. Time-dependent probability density functions and information geometry in stochastic logistic and Gompertz models. J. Stat. Mech. 2017, 2017, 123201. [Google Scholar] [CrossRef]
  23. Kim, E.; Lewis, P. Information length in quantum systems. J. Stat. Mech. 2018, 2018, 043106. [Google Scholar] [CrossRef]
  24. Kim, E. Investigating information geometry in classical and quantum systems through information length. Entropy 2018, 20, 574. [Google Scholar] [CrossRef] [PubMed]
  25. Jacquet, Q.; Kim, E.; Hollerbach, R. Time-dependent probability density functions and attractor structure in self-organised shear flows. Entropy 2018, 20, 613. [Google Scholar] [CrossRef]
  26. Suzuki, H.; Hashizume, Y. Expectation parameter representation of information length for non-equilibrium systems. Physica A 2019, 517, 400–408. [Google Scholar] [CrossRef]
  27. Frieden, B.R. Science from Fisher Information; Cambridge University Press: Cambridge, UK, 2004. [Google Scholar]
  28. Kramers, H.A. Brownian motion in a field of force and the diffusion model of chemical reactions. Physica 1940, 7, 284–304. [Google Scholar] [CrossRef]
  29. Risken, H. The Fokker–Planck Equation: Methods of Solution and Applications; Springer: Berlin, Germany, 1996. [Google Scholar]
Figure 1. The Probability Density Functions (PDFs) p ( x , t ) at four times throughout the cycle, with the numbers n = 0 3 beside individual curves corresponding to t = n T / 4 mod ( T ) . All three panels are for ω = 10 4 and A = 0.04 , and (a) D = 0.01 , (b) D = 0.0324 , (c) D = 0.1 .
Proceedings 46 00010 g001
Figure 2. The maxima over the cycle of 0 p ( x , t ) d x , as functions of the noise level D. The numbers 2 to 6 beside individual curves correspond to ω = 10 2 to 10 6 . (a) A = 0.02 , (b) A = 0.04 . The thick dashed curves show results from System (10). The dotted vertical lines are at D res given by System (9) for ω = 10 2 to 10 6 ; note how well these values agree with the maxima over D of the corresponding curves.
Proceedings 46 00010 g002
Figure 3. The top row shows G ( t ) = 0 p ( x , t ) d x , and the bottom row the corresponding W ( t ) = d d t G ( t ) . All three solutions are for ω = 10 4 , (a) D = 0.023 , (b) D = 0.025 , (c) D = 0.027 , and A = 0.02 , 0.04 and 0.08 as indicated by the numbers beside individual curves.
Proceedings 46 00010 g003
Figure 4. E ( t ) as a function of time throughout the period T. All three panels are for ω = 10 4 , (a) D = 0.01 , (b) D = 0.0324 , (c) D = 0.1 , and A = 0.02 , 0.04 and 0.08 as indicated by the numbers beside individual curves.
Proceedings 46 00010 g004
Figure 5. L over one cycle, as functions of the noise level D. The numbers 2 to 6 beside individual curves correspond to ω = 10 2 to 10 6 . (a) A = 0.02 , (b) A = 0.04 . The thick dashed curves are L = 4 A / 1.4 D 1 / 2 . As in Figure 2, the dotted vertical lines are at D res given by (9) for ω = 10 2 to 10 6 ; note how well these values again agree with the maxima of the corresponding curves.
Proceedings 46 00010 g005
Publisher’s Note: MDPI stays neutral with regard to jurisdictional claims in published maps and institutional affiliations.

