1. Introduction
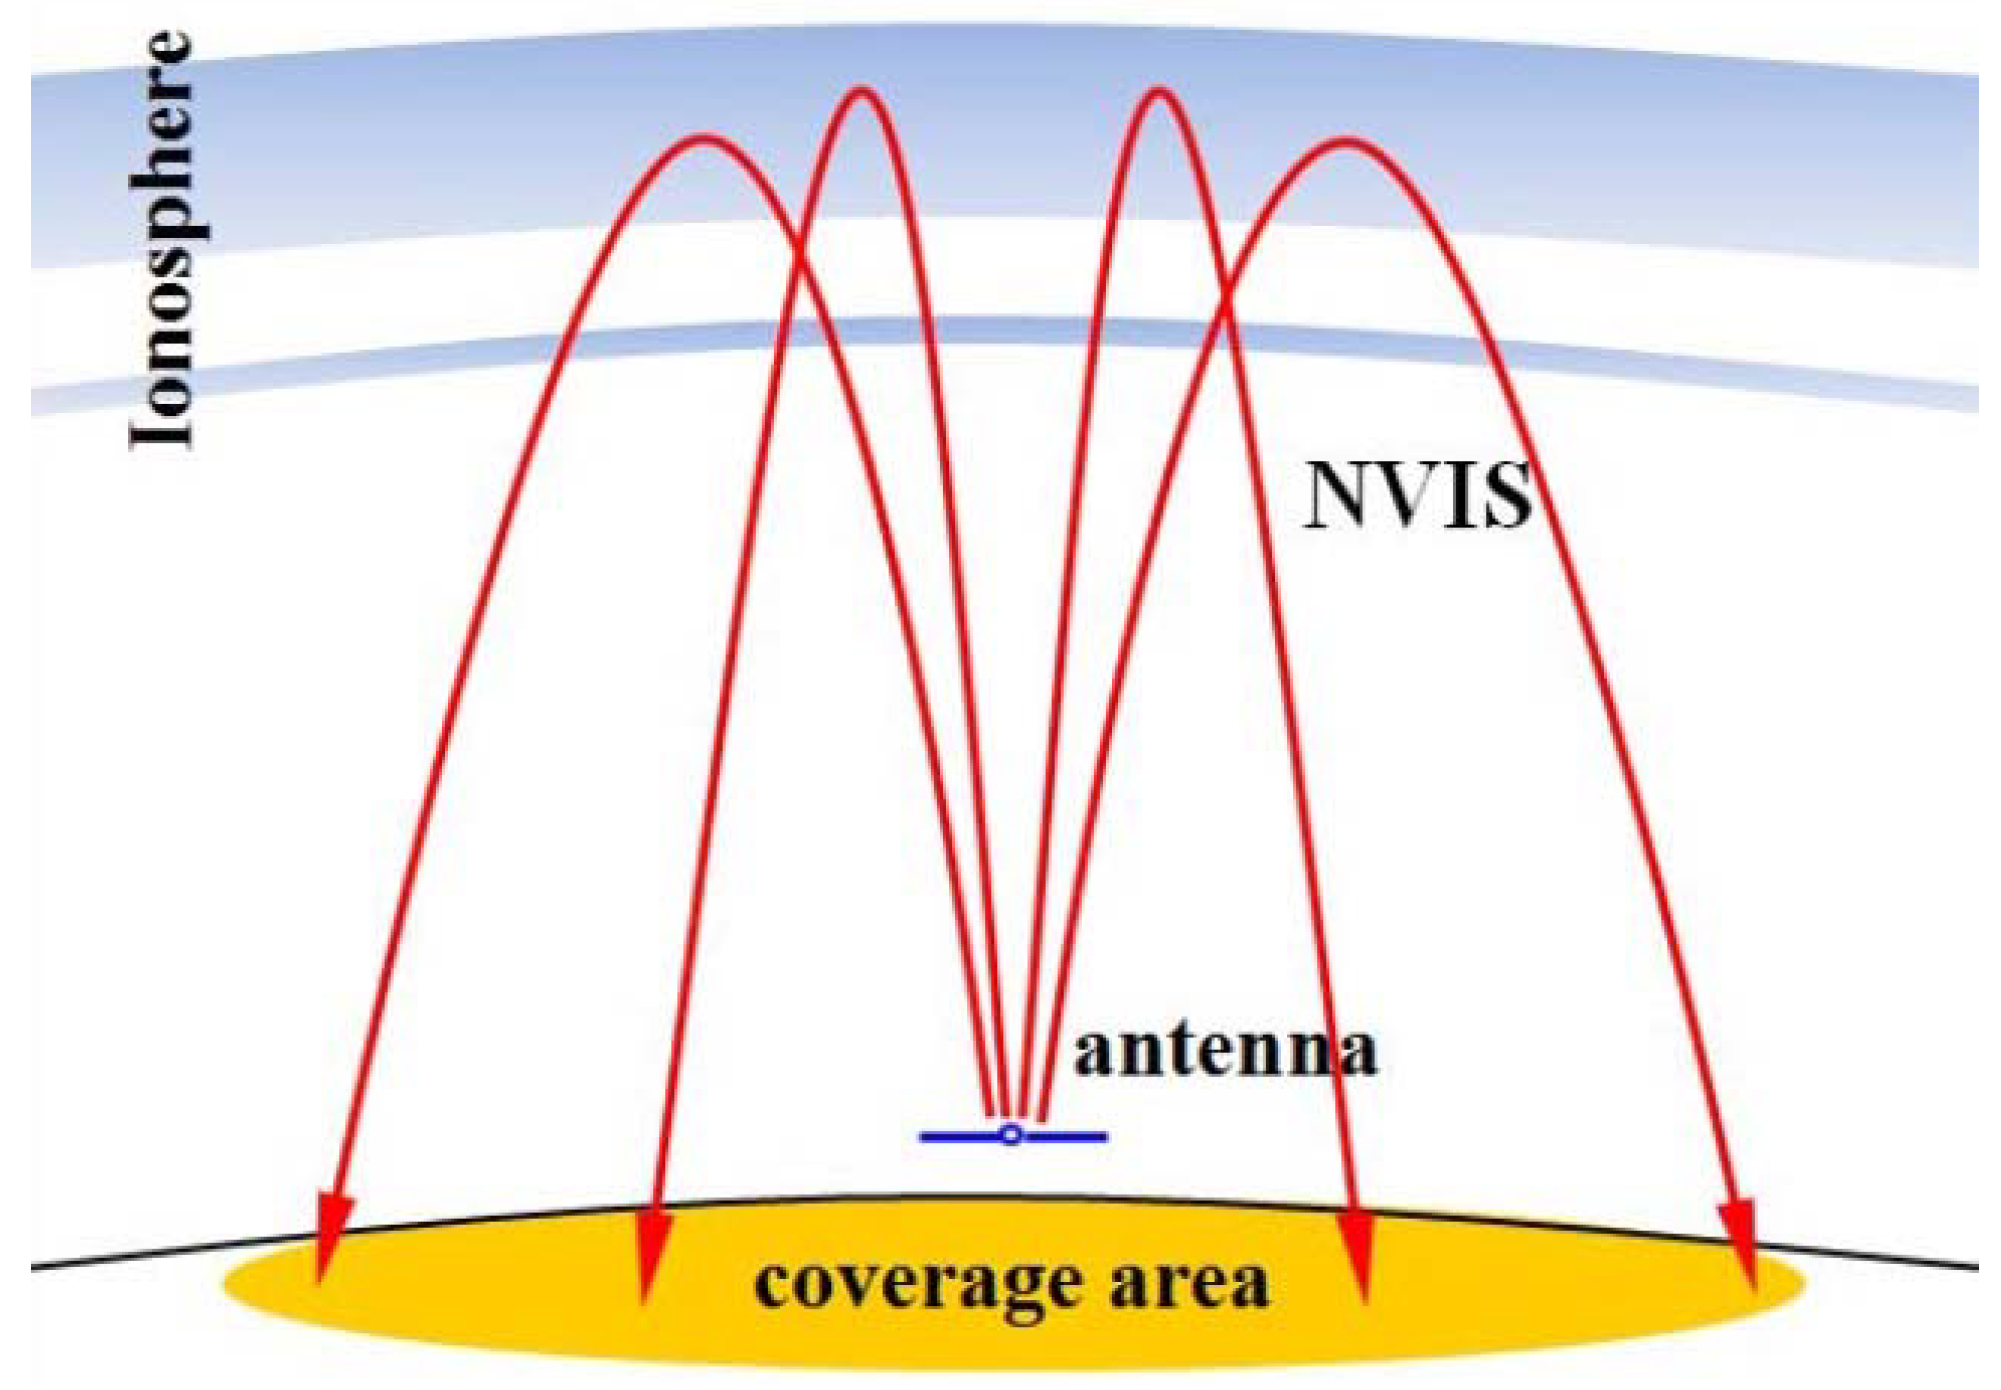
Interest in radio communication using a beyond line of sight technique named Near Vertical Incidence Skywave (NVIS) propagation has increased, mainly for both emergency communications and for sensing in remote areas [
1]. This ionospheric propagation technique enables communication over large areas without the need for fixed infrastructure or satellite time. A radio signal taking advantage of the NVIS propagation mode is broadcast straight up into the ionosphere. The returning signal is refracted back to Earth and spread out over a much larger area (see
Figure 1). Thanks to the near vertical radiation angles, large obstructions such as buildings and mountains do not shadow or obscure the radio signal transmit paths [
2], making NVIS a true beyond line of sight technique.
In order to design the physical layer of an NVIS modem [
4] for communications in mid-latitudes [
5], we design a set of ionospheric soundings to measure the channel parameters. These soundings were conducted by a Lowell Digisonde 4D Ionospheric sounder [
6] located at the Ebro Observatory (40.8 N, 0.5 E). The goal of these tests was to collect and analyse data in order to model the performance of an ionospheric NVIS channel. The purpose of this paper is to describe the parameters analyzed in the designed soundings, and to conduct the first approach to a clustering using that data, to reach the definition of a channel model. We claim to define a model with a good, a regular and a bad scenario (which we will call the good, the ugly and the bad). For that purpose, we pretend to cluster the collected information about the channel performance, taking into account the most relevant parameters to define the propagation of the channel, which, on the other side, we already know have strong dependencies between them [
5].
This paper is structured as follows: The NVIS sounding characteristics are detailed in
Section 2, followed by the first clustering approaches described in
Section 3, and finally the conclusions and future work are detailed in
Section 4.
2. NVIS Sounding Characteristics
In this section we describe the basic principles of the ionosphere as a communications channel, and its effects over the transmitted signal. We also describe the particular NVIS parameters that are measured in the designed soundings. They will be used to describe the channel performance depending on the frequency of transmission and the hour of the day.
2.1. The Ionosphere as a Communications Channel
The ionosphere is a region of the upper atmosphere where sufficient ionisation exists to affect the propagation of radio waves. Generally this region is considered to be between approximately 50 km and several Earth radii [
5]. Ionisation in this region is a result of the interaction between atmospheric molecules and solar radiation. Many complex factors influence the free electron density, resulting from the ionisation of atmospheric molecules. The main contributing factors are the incidence angle of solar radiation, hence latitude is important, the amount of solar radiation, hence factors such as season and diurnal cycle, and the relative density and composition of the atmosphere, hence altitude is important. In addition, the factors leading to the creation of free electrons and many other phenomena such as atmospheric turbulence, weather and even gravitational waves can provide a significant influence on localise electron density.
Many factors lead to the creation and destruction of free electrons and as such characterise the ionosphere as an extremely hostile communications channel. Even with this hostility, modern requirements for beyond line of sight communications demand practical solutions to mitigate or compensate for these affects. One of the common mitigation strategies is to utilise a wide spread of transmission frequencies and intelligently select the one that maximises throughput or propagation quality.
Obviously the distance a radio wave propagates within such a hostile region limits the communication effectiveness of the channel. In this sense, NVIS propagation is an excellent compromise for the challenges of such a hostile channel. NVIS channel uses the beyond line of sight characteristics of typical ionospheric channels but limits the distance traversed within the hostile environment.
2.2. NVIS Parameters of Interest
We will characterise our NVIS channel as a tapped delay line as presented in Equation (
1). This tapped delay line combines all the parameters we collected during this sounding campaign. The stratification typically associated within the ionosphere leads to a scenario where a single point source transmission may have multiple points of refraction, and hence multiple propagation paths between a transmitter and a receiver, we refer to this effect as multipath propagation. Each of the
paths from Equation (
1) will arrive at a receiver with a different delay,
. For each path, we collect data on the spreading in both time and frequency using a near impulsive transmission signal. We define the time spreading of each path at delay
as the single path delay spread
. The total delay spread of a channel at time sample
t is
is the delay from the first received path to the final received path for a single channel, so
. Due to the turbulent nature of the ionosphere, each propagating path will shift in frequency depending on the relative motion encountered along the propagation path. This frequency change will have two components, a Doppler shift and a Doppler spread. We use Doppler shift to represent the frequency change resulting in the average relative motion of the ionosphere on a propagation path. Doppler spread is modelled as a distribution representing the non-deterministic motion of the ionosphere along the propagation path.
In this equation, is a scalar that represents the relative amplitude factor of the n-th path at time t, represents the single path delay spread of the n-th path, and finally represents the Doppler shift and Doppler spread of path n-th at time t.
In this paper we detail the evaluation of these parameters, because they are crucial for the future definition of the channel model. They influence the channel propagation in a different manner; if the total delay spread of a channel is longer than the duration of a transmitted symbol, several symbols will mix together, effectively interfering with each other. Clearly if the current symbol is mixed with previous symbols, the reception and decoding is more complex. It should be clear that relative amplitude for each path significantly changes the ratio of the desired SNR having a relevant impact on reception quality. Finally, the Doppler shift and Doppler spread will change the synchronisation between the transmitter and the receiver, resulting in uncertainty. Depending on the relative motion of the ionosphere and hence magnitude of the Doppler, this uncertainty may increase the complexity of decoding any transmitted symbols in the receiver.
3. Selection of Channels with Similar Performance
An NVIS channel model could be obtained from the previously described data, but we have, on one hand, some data missing due to bad channel performance for some frequencies. On the other hand, the dependencies between the measured parameters are not easily separable, so an algorithm for detailing the good, the bad and the ugly channel performance in terms of measured parameters is needed.
3.1. Description of the Parameters
Only two of the five described channel sounding parameters have been used to perform the tests. We leave the entire set of parameters for future work. In this work, the parameters we used are:
We decided to consider these two parameters for the first clustering due to their relevance in the quality of the channel propagation.
3.2. Description of the Algorithms
In this section, we describe the K-Means algorithm which has been used to classify the NVIS data-set [
7]. K-Means is an unsupervised learning algorithm that groups the samples in a dataset into a fixed number of (K) clusters. A cluster is a subset of samples sharing similarities in their features.
In K-Means, clusters are defined around centroids. A centroid is a point in space which is located at the same distance from multiple samples. The default implementation of the K-Means uses the squared Euclidean distance to compute the separation between a sample and a centroid. Despite the existence of non-standard implementations using alternative distance functions, they were not used in our work.
The algorithm uses an iterative refinement approach to find an optimal solution from an initial state. The initial state consists of K centroids, which are randomly chosen unless prior knowledge about the dataset can be leveraged. For each iteration two steps are performed. The first step is to assign each sample to its nearest centroid using the distance function. Secondly, the position of all centroids is redefined by computing the arithmetical mean of all the samples which belong to them. These steps are repeated until convergence is achieved or a maximum number of iterations is reached.
The convergence of the algorithm to a global optimum is not guaranteed. Depending on the implementation, results may be influenced by the points chosen as centroids in the initial state. To minimize the negative impact of this behaviour, the results presented in this paper were obtained using a multi-pass implementation of K-Means which uses randomized restarts between each pass.
3.3. Preliminary Clustering Results
The results of the preliminary clustering are shown in
Figure 2. Up to eight different clusters are found in the three situations.
Figure 2a takes into account only the Doppler spread measured in the sounding of the channel.
Figure 2b considers of only the information coming from the delay spreads.
Figure 2c corresponds to the clustering of all the data considering both groups of parameters. In the vertical axis we can find the sounding frequency, and in the horizontal axis the time of the day when the sounding was performed. The different colors in the figure show the classification of the eight resulting clusters.
Results show that the influence of the two parameters is not equivalent. Observing
Figure 2c presents a group of eight clusters very similar to the ones shown in
Figure 2b—which correspond to delay spread only—with slight changes due to the influence of the Doppler spread.
4. Conclusions and Future Work
In this paper we present the results of the first approach to the ionospheric parameters measured in a sounding campaign conducted with a Lowell Digisonde from the Ebro Observatory in October 2014. The preliminary results given by the K-Means algorithm show that both tests conducted, one with the Doppler spread measurements and the other with the delay spread measurements, lead us to eight clusters, which is a large number in terms of channel design. Future work will be focused on reevaluating the data to be reduced to 3–4 clusters, with which we can manage to design a variant ionospheric channel model. Another interesting fact is that, in these first tests, where we selected only two of the five described measured parameters, the delay spread configuration in the clusters was mainly maintained when we conducted the final test, aggregating the two parameters (both Doppler spread and delay spread). The preliminary results shown in this paper encourage us to follow the research line clustering the measured parameters in order to design an NVIS channel model. Future work is also focused on testing the clustering with the three other parameters, and even including more variables in the clustering algorithm to evaluate if the clusters fit closer to what in communications theory would be described as a good, a bad and a regular channel propagation.


