Proceeding Paper

Development of a Low-Cost Instrumentation System Applied to an Electrolytic Cell †

by
Gemírson de Paula dos Reis
1,*,
Saulo Neves Matos
1,
Alan Kardek Rêgo Segundo
1,
Elisângela Martins Leal
2 and
Robson Lage Figueiredo
1
1
Department of Control and Automation Engineering, Universidade Federal de Ouro Preto, Campus Ouro Preto, Ouro Preto, MG 35400-000, Brazil
2
Department of Mechanical Engineering, Universidade Federal de Ouro Preto, Campus Ouro Preto, Ouro Preto, MG 35400-000, Brazil
*
Author to whom correspondence should be addressed.
Presented at the 6th International Electronic Conference on Sensors and Applications, 15–30 November 2019; Available online: https://ecsa-6.sciforum.net/
Proceedings 2020, 42(1), 35; https://doi.org/10.3390/ecsa-6-06586
Published: 14 November 2019

Abstract

:
Humanity’s growing long-term energy demand will be the opportunity for new energy generation sources. In this scenario, the use of hydrogen as an energy source has become an interesting alternative to energy production, as the use of fossil fuels can lead to harmful consequences, such as the emission of greenhouse gases. This paper presents the development of a low-cost instrumentation system for monitoring the temperature, current, voltage, and gas flow rate of a dry electrolytic cell. Through the electrolysis process, the cell generates a hydrogen-rich gas which is used as an additive in an internal combustion engine to reduce pollutant gas emissions and primary fuel consumption. The measured variables are presented as a function of the time to analyze the behavior of the electrolyzer. The main advance reported in this work is related to the use of a low-cost sensor for a hydrogen-rich gas flow measurement, in which calibration was performed indirectly using a rotameter as a reference. The calibration curve adjusted to the experimental data by linear regression presented a coefficient of determination of 0.9957. Thus, the use of the low-cost sensor is a feasible alternative for measuring the electrolysis gas generated by the cell.

1. Introduction

According to Seger [1], humanity consumed about 17.4 terawatts of energy in 2015, and that number tends to increase with population growth. It is projected that in 2040, an increase of 28% in energy demand compared with the year 2015 [2]. With this high-energy consumption, especially in emerging countries and with the excessive use of fossil fuels, there is a need for energy alternatives to supply future generations [3].
Greenhouse gas emissions such as carbon dioxide (CO2) from burning fossil fuels are considered by experts to cause global warming and health problems, such as respiratory and cardiovascular disease [4].
Among the possibilities of using renewable energy is the hydrogen economy. The direct combustion of hydrogen produces a significant amount of energy-releasing water vapor, that is, a non-polluting substance into the environment [3]. Hydrogen is a clean fuel with a lower calorific value of 120,000 kJ/kg and a self-ignition temperature of 858 K [5]. It produces only water as a combustion product and can be used in fuel cells. The hydrogen economy predicts a new economic paradigm [6].
Hydrogen can be generated from renewable sources, nuclear and carbon capture, and sequestration fossil fuels [7]. It is noteworthy to obtain hydrogen by the process of water electrolysis, having, as products, hydrogen (H2) and oxygen (O2), so that obtaining hydrogen generates only pure hydrogen and oxygen (hydrogen in greater proportion) as products, therefore the electrolysis gas being a hydrogen-rich [8].
The addition of small percentages of hydrogen in the combustion process enables the reduction of greenhouse gas emissions (mainly CO2) and the reduction of diesel fuel consumption in compression ignition engines [9]. According to Saravanan [5], when adding 30% of hydrogen to diesel oil, it is possible to increase the efficiency of the motor by 5.1% [10]. With the electrolysis gas in the diesel engine, there is a 5.7% reduction in diesel fuel consumption to a concentration of 20.0 g/L of KOH in distilled water [10].
Studies in Otto cycle engines indicate that the use of hydrogen as a gasoline additive can increase thermal efficiency by 4%, combustion by 0.6%, and power by 545 W, reducing fossil fuel consumption [11]. For another study, the electrolysis gas allows an average increase of 19.1% in the motor torque, and 13.5%, 5%, and 14% reduction in carbon monoxide, hydrocarbon, and specific fuel consumption emissions, respectively [12]. Given the above, this work aims to develop a low-cost sensor for the instrumentation of an electrolytic cell to allow its use in an internal combustion engine.

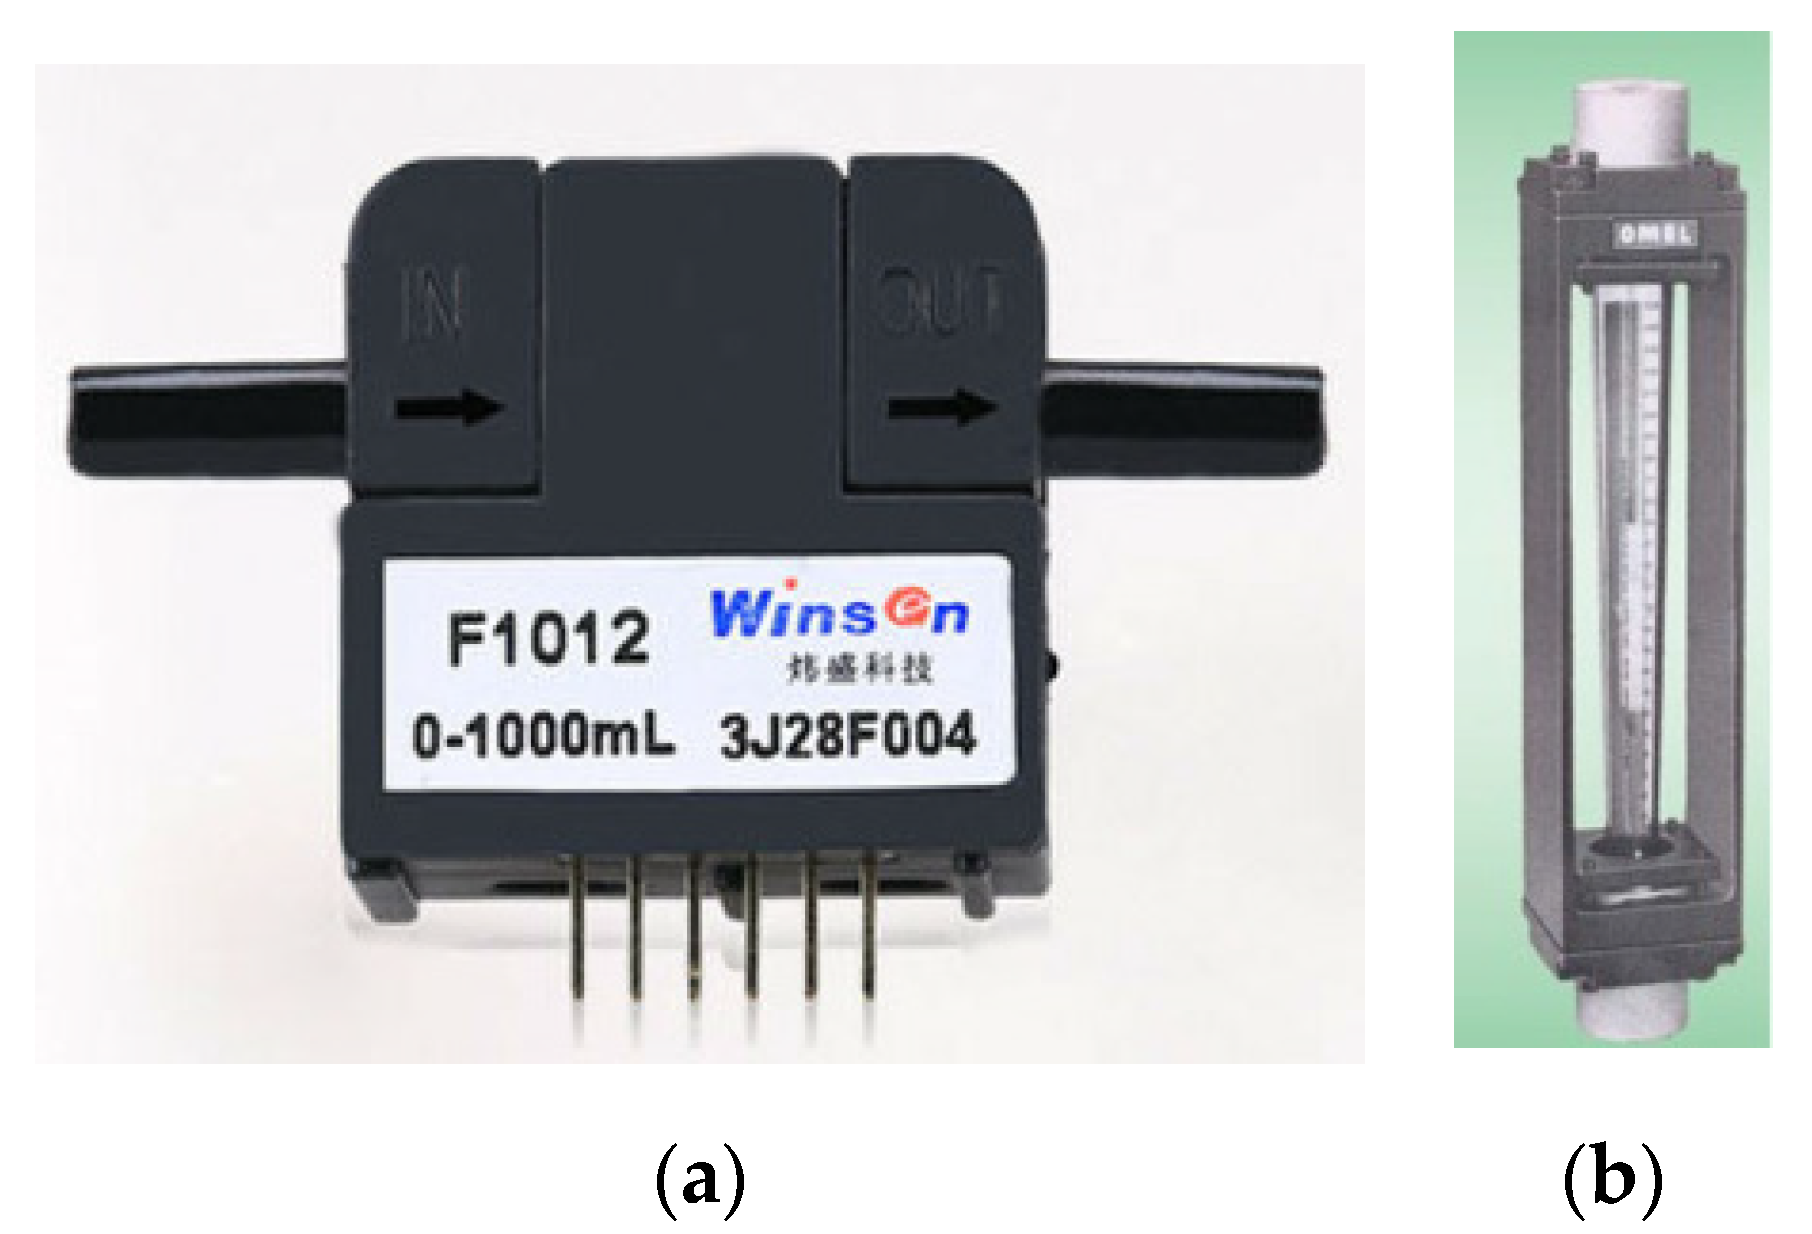
2. Materials and Methods

The instrumentation system uses the Arduino platform to perform the acquisition and preprocessing of the electric current, voltage, temperature, and flow data of the electrolytic cell electrolysis gas. The electrolytic cell chemical solution has a concentration of 20.0 g/L of potassium hydroxide diluted in distilled water to produces electrolysis gas.
The measurement of the incoming electric current in the electrolytic cell is made through the ACS712 current sensor (Figure 1a). This sensor uses the hall effect to detect the magnetic field generated by the current flow, producing at the sensor output (connected to analog pin 1 of the Arduino) a voltage proportional to the detected current of 66 mV/A.
The voltage measurement is made by the 0–25 V DC voltage sensor, Figure 1b. The sensor has the principle of voltage division. That is, a voltage is applied to the associated resistors in series and the voltage drop over the desired resistor is determined. With the voltage meter module, it is possible to perform analog measurements of up to five times the input voltage, since the measurement range of the Arduino analog to digital converter is 0–5 V.
The DS18B20 sensor measures temperature during the procedure (Figure 1c), providing a 12-bit digital output. It operates in the range of −55 °C to 125 °C and has an accuracy of ±0.5 °C over the range of −10 °C to 85 °C. The digital output of the sensor is connected to the Arduino digital input (pin 2).
For electrolysis gas flow measurement, the low-cost Winsen F1012 sensor shown in Figure 2a is used and measures the volumetric gas flow with high precision in the measuring range between 0 and 2000 mL/min at the electrolytic cell outlet. This sensor adopts the thermodynamic principle to detect gas flow through a temperature sensor that has the function of measuring gas flow by temperature gradient measured by two wires that convert this temperature difference into a linear analog voltage output [16].
The rotameter, shown in Figure 2b, is characterized by an operation based on the equilibrium of the weight, drag, and thrust forces on the float, made of stainless steel AISI 316 or PTFE, which moves as the gas flow increases inside its glass tubing [17].
The calibration of the hydrogen flow sensor of the electrolytic cell was performed indirectly, which is characterized by measuring a quantity employing an auxiliary device. The value of the measured quantity need not be well known, but it must be stable. Calibration is performed simultaneously between the measurement system to be calibrated and the standard or reference calibration system [18].
The system calibration is important to enable electrolysis flow gas measurement. Electrolysis is the breakdown of the water molecule (H2O) in hydrogen and oxygen due to the influence of electric current passing through the cell with the aid of an electrolyte [19]. Electric energy is the driving force of the chemical reaction in which substances are decomposed into ions due to the passage of electric current in an electrochemical process. Thus, the transformation of electrical energy into chemical energy will occur. The water molecule splits, producing positive hydrogen ions that migrate to the negatively charged cell cathode, where they are reduced to form hydrogen gas (H2). On the other electrode, the positively charged anode receives negative oxygen ions for O2 production [20].
During the F1012 flow sensor calibration procedure, a rotameter was used as a reference instrument whose measurement uncertainty is 0.1 g/h. Both sensors were connected in series with the gas output of the electrolytic cell. Thus, indirect calibration is performed by simultaneously measuring the electrolysis gas mass flow by the F1012 sensor and the rotameter.
For supplying the rectangular plate electrolytic cell, a single channel FA-2030 Instrutherm Digital DC power supply, voltage up to 32 V, current up to 20 A, electrolytic cell, and bubbler are used. A direct current source (DC Source) powers the system and the Arduino Uno R3.
After the calibration between the low cost sensor (F1012) and the rotameter, the cell input electric current is measured using the ACS712 current sensor, as well as the voltage, temperature, and electrolysis gas flow through the 0–25 V DC voltage module, DS18B20 and F1012 sensors, respectively, which are connected to the Arduino Uno R3.

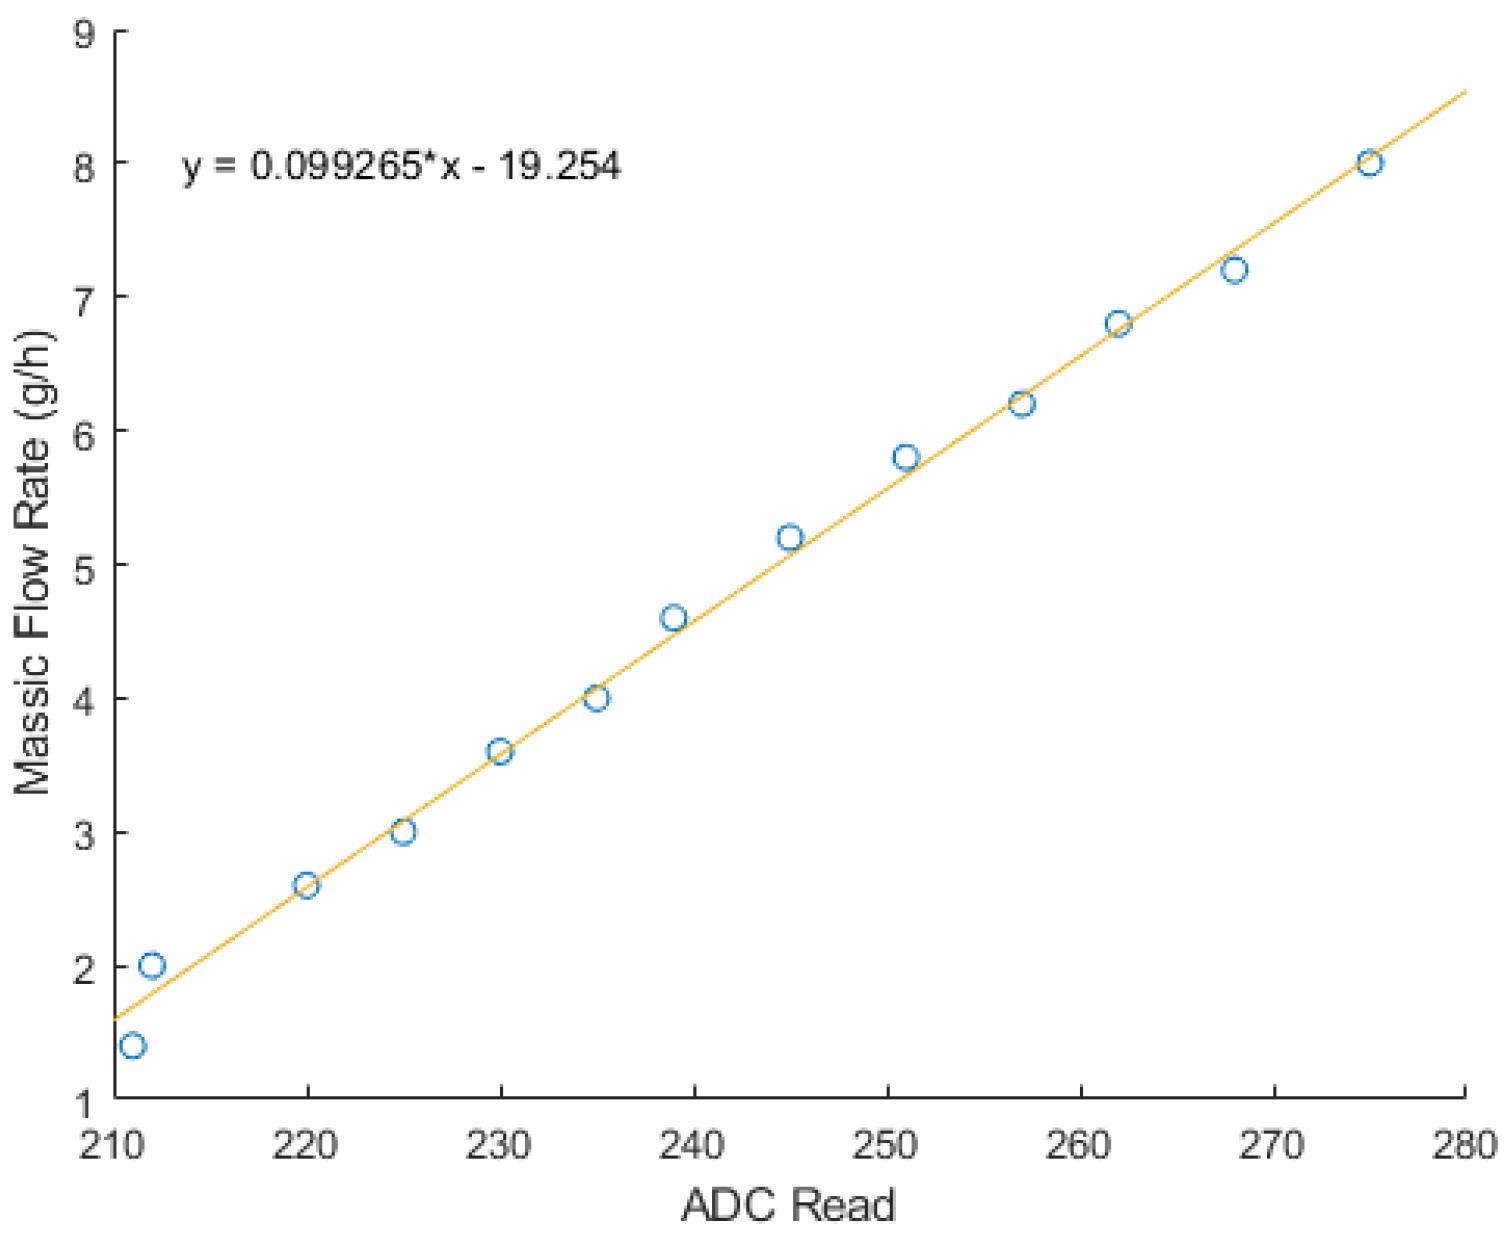
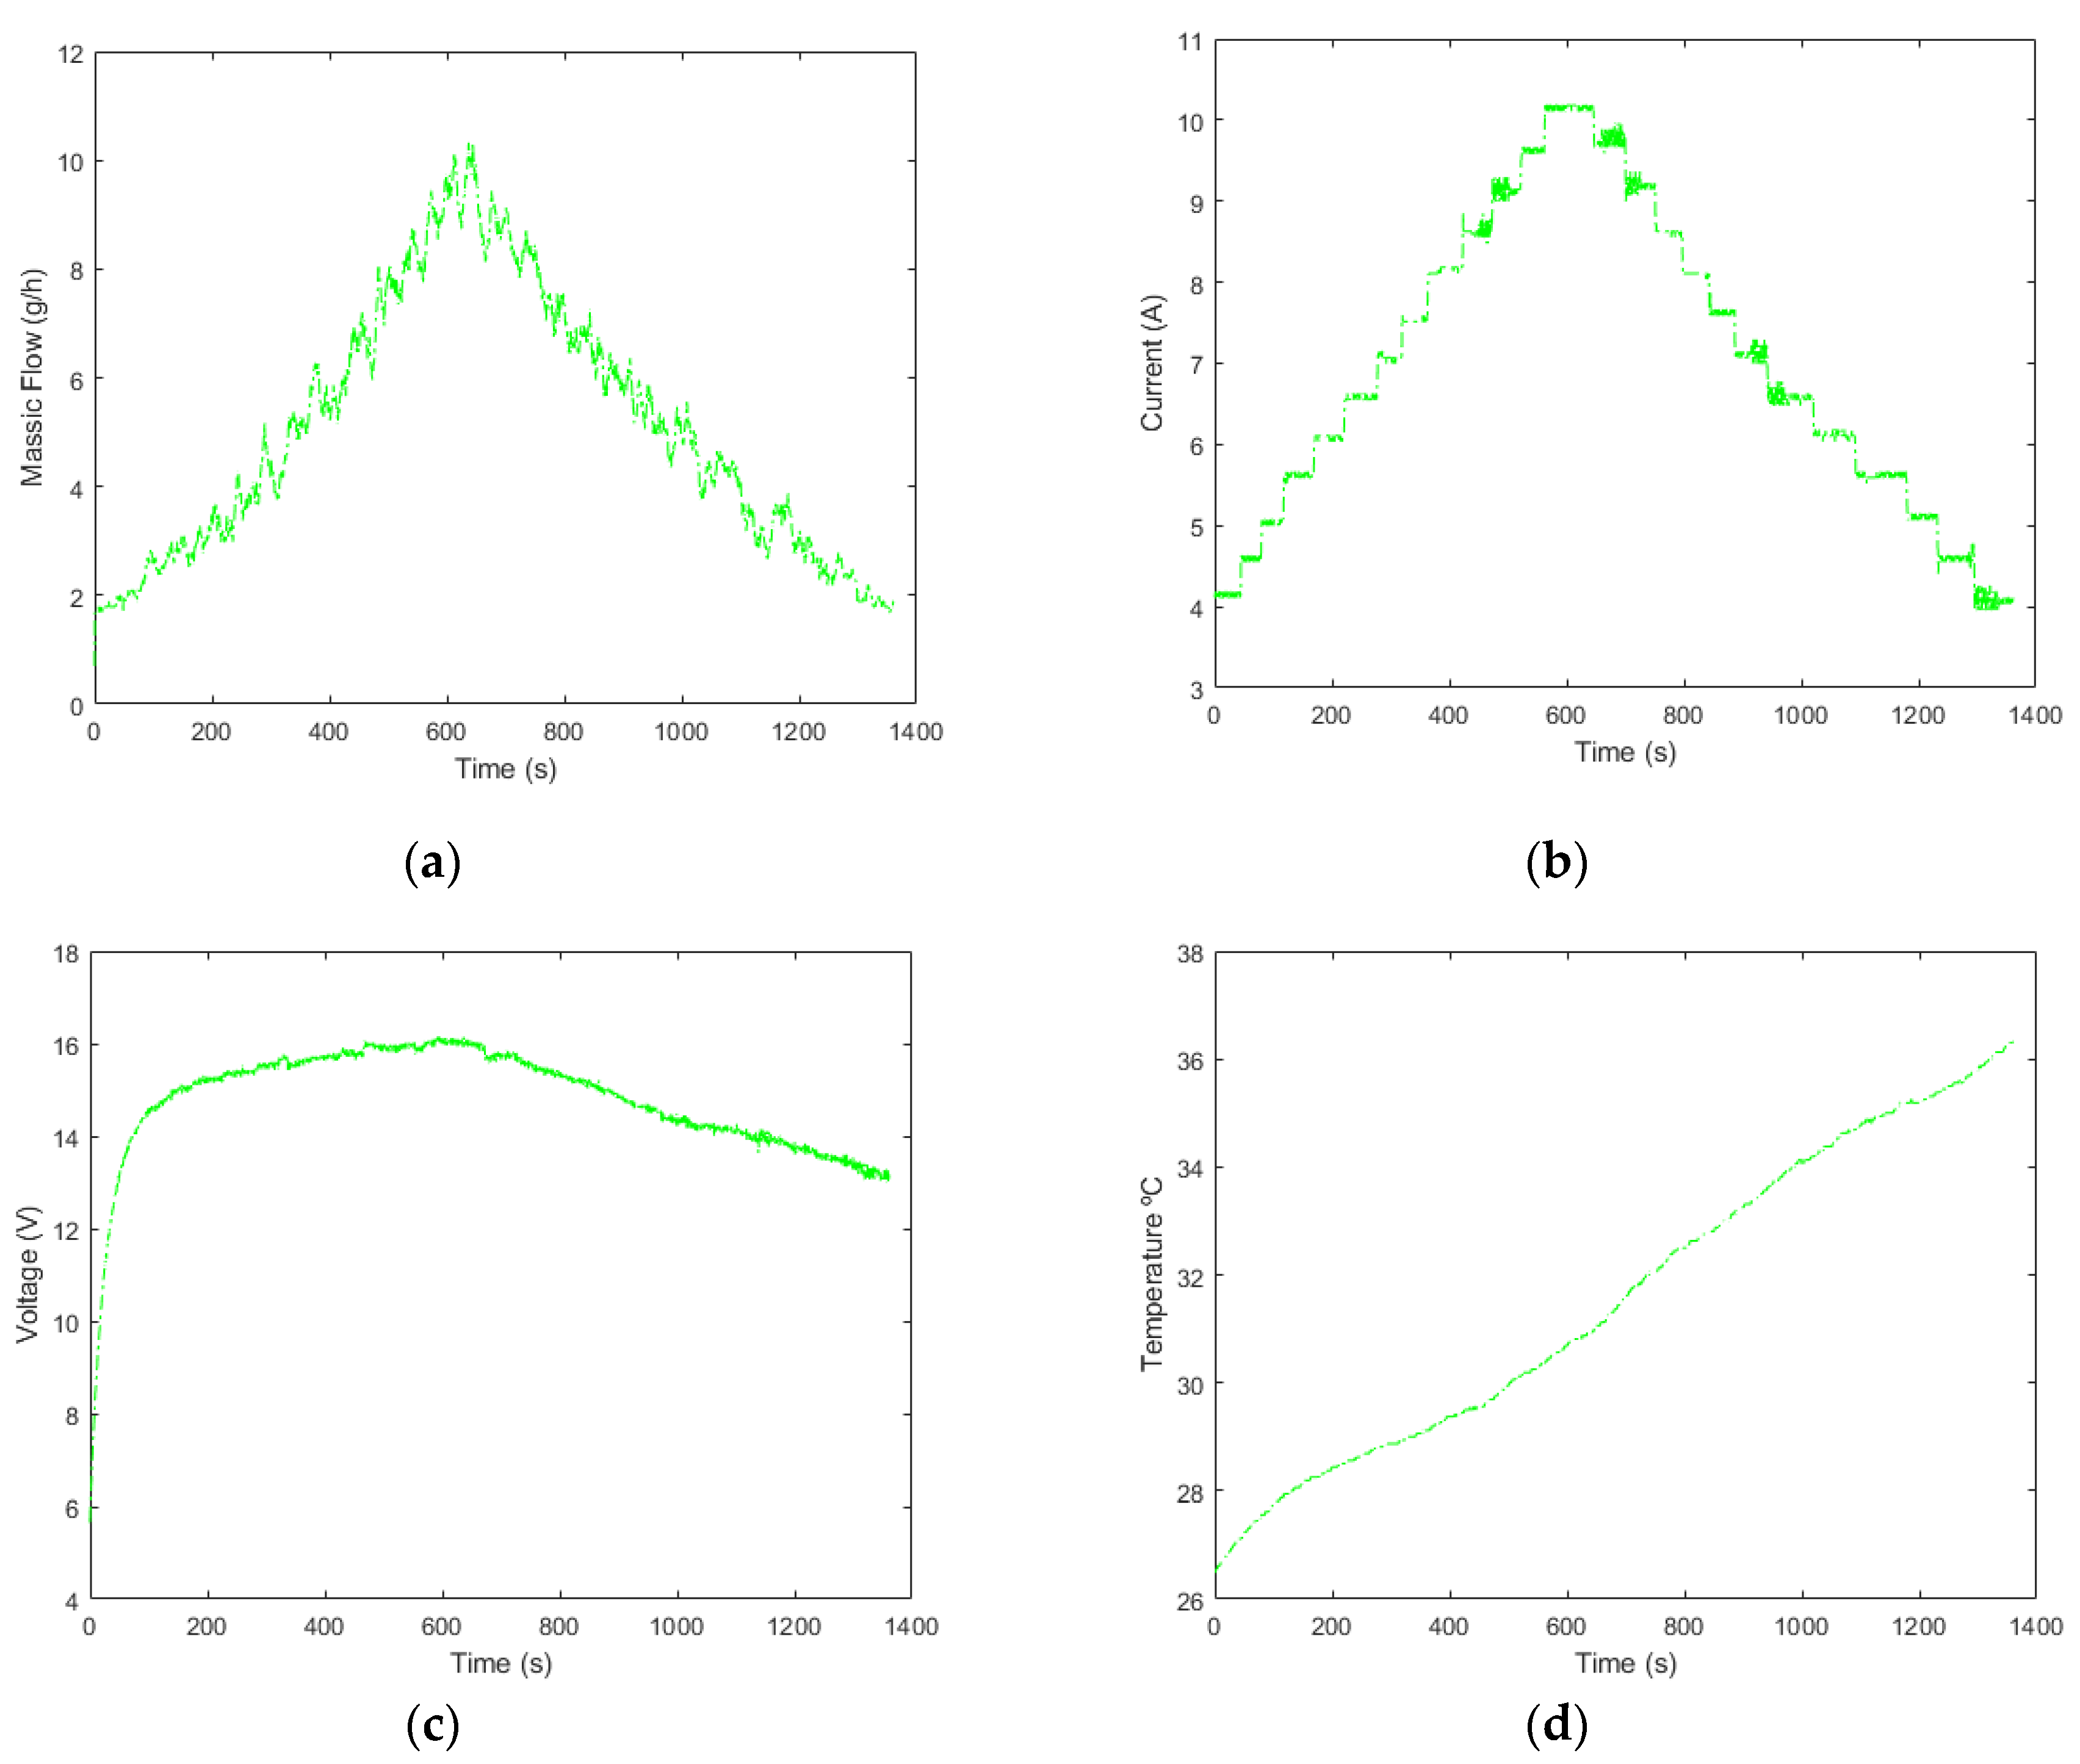
3. Results and Discussion

By linear regression, a first-order calibration curve was obtained between the measurements performed by the F1012 gas sensor rotameter. The found model presented a coefficient of determination equal to 0.9957, shown in Figure 3, which indicates the percentage of total variation around the average explained by the model.
The electrolytic cell test was performed for 23 min and 20 s by applying a continuous electric current (bench source) that was increased from 4 A to 10 A and decreasing from 10 A to 4 A so that the data collection and analysis of electrolysis gas flow, voltage, and temperature of the electrolytic cell are made. Figure 4a shows the results of mass flow, the electrical current applied to the system is shown in Figure 4b, the voltage applied to the system is shown in Figure 4c, and measured cell temperature is shown in Figure 4d.
Figure 4a,b show a similar growth trend (between 4 A to 10 A) between the flow of electrolysis gas and electric current as a function of time. There is a reduction in the flow of the electrolysis gas as there is a reduction of the electric current from 10 A to 4 A. Besides, the voltage (V) increases from 6 V (at 4 A) to 16 V (at 10 A) in 600 seconds as shown in Figure 4c. From this point, the voltage drops to 14 V (at 4 A) at the end of the bench test.
Finally, in Figure 4d is showed the behavior of the temperature measured in the electrolytic cell, which presents the growth of approximately 26 °C to 36.5 °C during the time (growth of the electric current between 4 A and 10 A and the decreasing of the electric current between 10 A and 4 A).

4. Conclusions

The development of the low-cost flow sensor (Winsen, model F1012) applied in an electrolytic cell presented in the calibration a coefficient of determination equal to 0.9957. Thus, the use of the low-cost sensor proved to be a feasible alternative for measuring the electrolysis gas in the cell.
The low-cost sensor saves approximately 97% on the project, given the market price for hydrogen flow sensors with similar characteristics.

Acknowledgments

The authors give thanks to the Universidade Federal de Ouro Preto, Instituto Tecnológico Vale, CAPES, and FAPEMIG.

Conflicts of Interest

The authors declare no conflict of interest.

References

  1. Seger, B. Global Energy Consumption: The Numbers for Now and in the Future; DTU Orbit, Kgs.: Lyngby, Denmark, 2016. [Google Scholar]
  2. EIA. Today in energy. U. S. Energy Information Administration. 2017. Available online: https://www.eia.gov/todayinenergy/detail.php?id=32912 (accessed on 20 October 2019).
  3. Benemann, J. Hidrogênio: Combustível do Futuro Hydrogen: Future Fuel. Ensaios Cienc. Cienc. Biol. Agrar. Saúde 2016, 20, 122–126. [Google Scholar]
  4. Braga, A.; Pereira, L.; Böhm, G.; Saldiva, P. Poluição atmosférica e saúde humana. Rev. USP 2001, 51, 58–71. [Google Scholar] [CrossRef]
  5. Saravanan, N.; Nagarajan, G.; Dhanasekaran, C.; Kalaiselvan, K. Experimental investigation of hydrogen port fuel injection in DI diesel engine. Int. J. Hydrogen Energy 2007, 32, 4071–4080. [Google Scholar] [CrossRef]
  6. CGEE. Hidrogênio energético no Brasil: Subsídios para políticas de competitividade, 2010–2015; Tecnologias críticas e sensíveis em setores prioritários: Brasília, Brazil, 2010. [Google Scholar]
  7. Knob, D. Geração de hidrogênio por eletrólise da água utilizando energia solar fotovoltaica; 125 f. Dissertação (Mestrado em Ciências na Área de Tecnologia Nuclear - Materiais); Instituto de Pesquisas Energéticas e Nucleares, Autarquia associada à Universidade de São Paulo: São Paulo, Brazil, 2013. [Google Scholar]
  8. Leroy, R.L.; Janjua, M.B.I.; Renaud, R.L.U. Analysis of time-variation effects in water electrolyzers. J. Electrochem. Soc. 2012, 2, 126–674. [Google Scholar] [CrossRef]
  9. Bari, S.; Esmaeil, M.M. Effect of H2/O2 addition in increasing the thermal efficiency of a diesel engine. Fuel 2010, 89, 378–383. [Google Scholar] [CrossRef]
  10. Figueiredo, R.L. Desenvolvimento de um sistema de monitoramento aplicado a um motogerador a diesel com injeção de gás de eletrólise visando redução de consumo de combustível; Dissertação (Mestrado Profissional em Instrumentação, Controle e Automação de Processos de Mineração), Universidade Federal de Ouro Preto e Instituto Tecnológico Vale: Ouro Preto, Brazil, 2018; 82p. (In Portuguese) [Google Scholar]
  11. Cervantes, M.; Jiménez, R.F.E.; Aguilar, J.F.G.; Morales, J.G.; Peregrino, V.O. Experimental Study on the Performance of Controllers for the Hydrogen Gas Production Demanded by an Internal Combustion Engine. Energies 2018, 11, 2157. [Google Scholar] [CrossRef]
  12. Yilmaz, A.C.; Uludamar, E.; Aydin, K. Effect of hydroxy (HHO) gas addition on performance and exhaust emissions in compression ignition engines. Int. J. Hydrogen Energy 2010, 35, 11366–11372. [Google Scholar] [CrossRef]
  13. Tecnotronics. Available online: https://www.tecnotronics.com.br/modulo-medidor-de-corrente-acs712-30a-arduino.html?gclid=CjwKCAjw_uDsBRAMEiwAaFiHa5Flpkuz712k_ePpQDnuNEO2rRw6PCTekdfNbV11Nm9X4KAeDENHIRoCzPoQAvD_BwE (accessed on 8 October 2019).
  14. Byteflop. Sensores. Módulo Sensor de Tensão 0-25V DC. 2019. Available online: https://www.byteflop.com.br/modulo-sensor-de-tensao-0-25v-dc (accessed on 3 June 2019).
  15. Robótica Store. Sensor de Temperatura DS18B20 à prova d’água. 2019. Available online: https://robotica.store/produto/sensor-temperatura-ds18b20-waterproof/?v=19d3326f3137 (accessed on 3 July 2019).
  16. Winsen. Micro Flow Sensor Manual. Available online: https://www.winsen-sensor.com/d/files/PDF/Micro%20Flow%20Sensor/F1012%20Flow%20sensor%20-%20Manual%20V2.1.pdf (accessed on 23 April 2019).
  17. Omel. Boletim técnico. Rotâmetros modelo “N”. 2014. Available online: http://www.omel.com.br/cms-lang/wp-content/uploads/2014/07/Catalogo_rotametro_4N.pdf (accessed on 2 April 2019).
  18. Júnior, A.G.; De Sousa, A.R. Fundamentals of Scientific and Industrial Metrology; Manole: Barueri, Brazil, 2008. (In Portuguese) [Google Scholar]
  19. Santilli, R.M. A new gaseous and combustible form of water. Int. J. Hydrogen Energy 2006, 31, 1113–1128. [Google Scholar] [CrossRef]
  20. Ivy, J. Summary of Electrolytic Hydrogen Production: Milestone Completion Report; No. NREL/MP-560-36734; National Renewable Energy Lab.: Golden, CO, USA, 2004. [Google Scholar]
Figure 1. (a) current sensor [13]; (b) voltage sensor [14]; (c) temperature sensor [15].
Proceedings 42 00035 g001
Figure 2. (a) gas flow sensor [16] Winsen; (b) rotameter [17].
Proceedings 42 00035 g002
Figure 3. Winsen sensor calibration, F1012 model.
Proceedings 42 00035 g003
Figure 4. Results of (a) electrolysis gas mass flow (g/h) as function of time (s); (b)electric current (A) as function of time (s); (c) voltage (V) as function of time (s); (d) temperature (°C) as function of time (s).
Proceedings 42 00035 g004
Publisher’s Note: MDPI stays neutral with regard to jurisdictional claims in published maps and institutional affiliations.

