Proceeding Paper

Greenhouse Detection from Color Infrared Aerial Image and Digital Surface Model †

1
Department of Space Sciences and Technologies, Akdeniz University, Antalya 07058, Turkey
2
Department of Urban and Regional Planning, Faculty of Architecture, Akdeniz University, Antalya 07058, Turkey
*
Author to whom correspondence should be addressed.
Presented at the 6th International Electronic Conference on Sensors and Applications, 15–30 November 2019; Available online: https://ecsa-6.sciforum.net/.
Proceedings 2020, 42(1), 29; https://doi.org/10.3390/ecsa-6-06548
Published: 14 November 2019

Abstract

:
Greenhouse detection is important with respect to urban and rural planning, yield estimation and crop planning, sustainable development, natural resource management, and risk analysis and damage assessment. The aim of this study is to detect greenhouse areas by using color and infrared orthophoto (RGB-NIR), topographic map, and Digital Surface Model (DSM) approaches. The study was implemented in the Kumluca district of Antalya, Turkey, which includes intensive greenhouse areas. In this study, color and infrared orthophotos, a normalized Digital Surface Model (nDSM), Normalized Difference Vegetation Index (NDVI), and Visible Red-Based Built-Up Index (VrNIR-BI) were used, and the greenhouse areas were detected using an Object-Based Image Analysis (OBIA). In this process, the optimum scale parameter was determined automatically by the Estimation of Scale Parameter2 (ESP2) tool and Multi Resolution Segmentation (MRS) was used as the segmentation algorithm. In the classification stage, K-Nearest Neighbor (K-NN), Random Forest (RF), and Support Vector Machine (SVM) classification techniques were used, and the accuracies of the classification results were compared. The obtained results demonstrated that greenhouse areas can be determined from color and infrared orthophoto and DSM data successfully by using the OBIA. The highest overall accuracy was obtained when the SVM classifier was used, with 94.80%.

1. Introduction

Greenhouse extraction is important area of research, and creating and updating greenhouse information systems is vital for urban and rural planning, yield estimation, crop planning, and risk analysis and damage assessment in case of natural disaster. The fast and accurate detection of greenhouses automatically from remote sensing imagery saves labor and time. With the development of digital image analysis and processing methods, the greenhouse detection process has become easier and faster when compared with traditional techniques. After examining studies about greenhouse detection from remotely sensed data, it can be stated that the classification techniques are widely used. The most widely used classification technique for greenhouse detection found in the literature is the Maximum Likelihood Classification. Carvajal et al. [1,2] used the Artificial Neural Networks Classifier for greenhouse detection. In addition, there are studies that use machine learning algorithms [3,4,5] and unsupervised image classification [6,7] for greenhouse extraction. Alternatively, there is a considerable amount of research about greenhouse detection using Object-Based Image Classification [8,9,10,11,12]. In these studies, the K-Nearest Neighbor (K-NN) classifier was generally used as the classification algorithm.
The aim of this study is to detect greenhouse areas from color infrared orthophotos and Digital Elevation Models (DEMs) using Object-Based Image Analysis (OBIA). The Normalized Difference Vegetation Index (NDVI) and Visible Red-Based Built-Up Index (VrNIR-BI) were calculated using the bands of the orthophoto image. The obtained indices and the normalized Digital Surface Model (nDSM) were added to the orthophoto as additional bands, and the greenhouse areas were obtained with OBIA. Three different machine learning algorithms were used in the classification stage, and the results were compared.

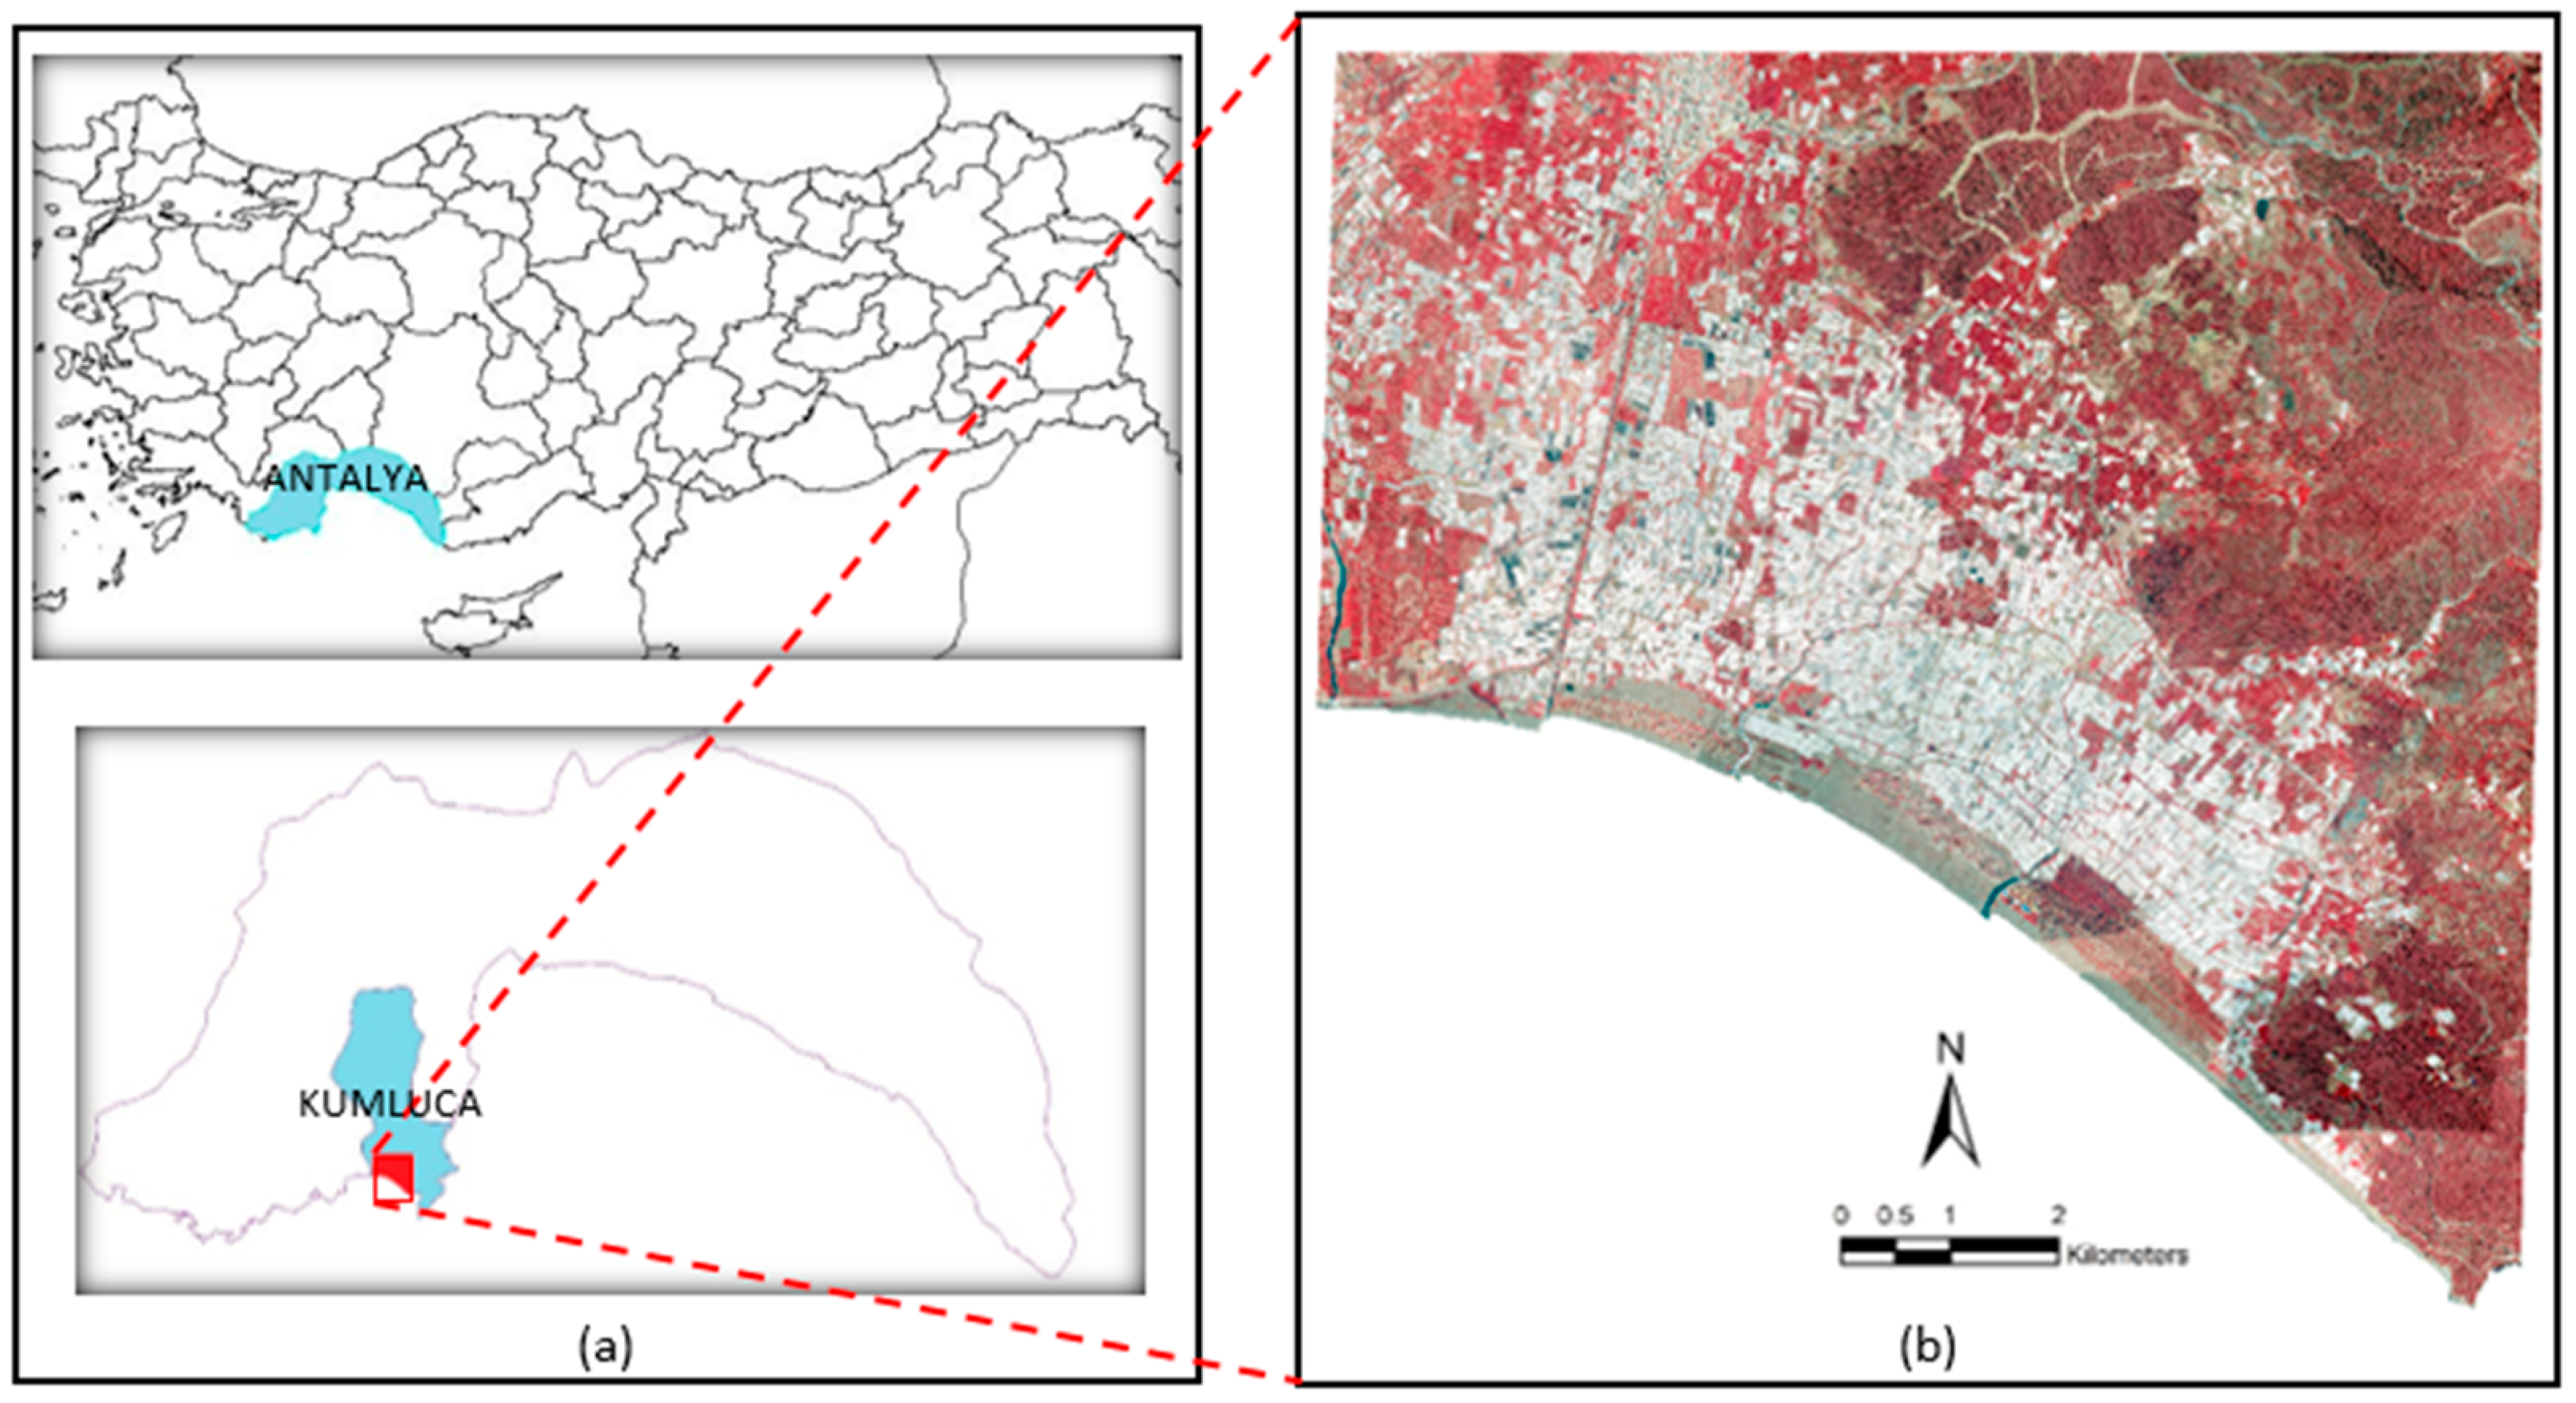
2. Study Area and Data Sets

Antalya province is one of the primary cities in Turkey for greenhouse farming, with its climatic and ecological characteristics and geographical structure. Thirty-seven per cent of the greenhouse areas in Turkey were located in Antalya province by the year 2018 [13]. In this study, the Kumluca district of Antalya was selected as the study area, because an important part of the greenhouses is located in this district. Kumluca is in the first rank in terms of greenhouse areas in Antalya [13]. The study area and its location are given in Figure 1.
The data used in this study were: (1) color infrared orthophoto, (2) Digital Elevation Models, and (3) topographic maps. The color infrared orthophoto and Digital Surface Model (DSM) data were obtained from the General Directorate of Mapping. The orthophoto was collected with a 0.30 m Ground Sampling Distance (GSD) in 2012, having Blue, Green, Red, and NIR bands. The DSM, which includes 3D manmade objects and topography, had been generated from stereo aerial images by automatic matching, and its spatial resolution is 5 m and in a 90% confidence interval it has ±3m vertical accuracy. The topographic maps were used for Digital Terrain Model (DTM) generation.

3. Methodology

In this study, there were basically two steps for greenhouse detection from color infrared orthophoto and DSM: (1) the preparation of additional bands, and (2) object-based image classification. In the first stage, the NDVI and Visible Red-Based Built-Up Index (VrNIR-BI) indices were computed using the bands of the orthophoto, and nDSM was generated by subtracting DTM from DSM. In the object-based image classification stage, initially Multi-Resolution Segmentation (MRS) was performed, and then machine learning algorithms, namely K-Nearest Neighbour (K-NN), Random Forests (RF), and Support Vector Machines (SVM), were used for image classification.

3.1. The Preparation of Additional Bands

The NDVI and VrNIR-BI images were computed utilizing the red (BRED) and NIR (BNIR) bands of the orthophoto by the Formulas (1) and (2), respectively. The threshold values that were determined by Otsu thresholding were applied to these indices, and threshold applied indices were used as additional bands in the classification process. The NDVI is an index used for determining vegetation areas. On the other hand, VrNIR-BI is an index used to detect built-up areas [14]
NDVI = (BNIR − BRED)/(BNIR + BRED)
VrNIR-BI = (BRED − BNIR)/(BRED + BNIR)
In addition, nDSM, which is an important data for detecting 3D objects, was used as additional band, and it was generated by subtracting DTM from DSM. In this study, DTM was generated by using topographic maps.

3.2. Object-Based Image Classification

The first stage of object-based image classification is segmentation. It is an important stage that affects the classification result directly. There are different algorithms for segmentation, which are: Chessboard, Quadtree Based, Contrast Split, Multi-Resolution, Spectral Difference, Multi-Threshold, and Contrast Filter. When the literature on Object-Based Greenhouse detection has been examined, it was seen that the most commonly used segmentation algorithm is MRS [12,15]. Some parameters need to be set by the user during the segmentation. These parameters differ from image to image. The parameters used in segmentation are scale, shape, and compactness. The Estimation of Scale Parameter2 (ESP2) tool is available for the automatic detection of the scale parameter. This tool was recommended by Dragut et al. in 2014 [15].
For the determination of the scale parameter, the shape and compactness parameters should be determined. When previous studies were examined, it was found that the compactness value was fixed at 0.5 and the shape value was adjusted so that it was not greater than the compactness value [16,17]. Therefore, in this study the compactness value was fixed at 0.5 and the shape parameter value was given as 0.1, 0.3, and 0.5. Then, Local Variance (LV) graphs of the obtained results were examined and the lowest LV level was observed when the shape value was 0.5. As a result, the scale parameter was determined as 103, using both shape and compactness values as 0.5 (Table 1). In this study, since level1 has the most appropriate segments visually, level1 was used. The obtained MRS result using these parameters were quite successful, and it was demonstrated that the determined parameters were useful for greenhouse detection.
After segmentation, in the classification stage three different machine learning algorithms were used: K-NN, RF, and SVM classifiers. Initially, 6 classes were determined by analyzing the study area: Greenhouse, Building 1, Building 2, Road, Bareland and Vegetation. Then, 30 segments per class were collected for training, while 60 segments per class were collected for testing. Same training and testing samples were used for K-NN, RF and SVM classifications.
K-NN is one of the most popular machine learning classifiers. It is a non-parametric and supervised classification and the k parameter plays an important role in K-NN classification. In this study k value is determined as 1. The RF is an ensemble learning technique and uses a bagging-based approach. The maximum tree value was selected as 50 in this study. SVM is a machine learning algorithm that is generated for binary classification and then extended for multi-class problems [18]. It works quite well even using limited training areas. In this study, Radial Basis Function which is most popular kernel, was used. The C and gamma parameters were determined as 1000 and 0.00001, respectively.
Finally, for accuracy assessment error matrices were generated and the machine learning algorithms were compared for selecting the best result.

4. Results and Discussion

The obtained classification results indicate the success of the OBIA for greenhouse detection. The K-NN, RF, and SVM results are given in Figure 2. The K-NN, RF, and SVM classification results were assessed using collected testing segments and error matrices were generated. The classification accuracies (Producer’s Accuracies—PA; User’s Accuracies—UA; Overall Accuracies) are given in Table 2. The overall accuracies were computed as 83.47, 81.46, and 94.80 for the K-NN, RF, and SVM classifiers, respectively.
When the Producer’s Accuracy values of the “greenhouse” class were analyzed, the SVM classifier provided the highest accuracy with 96.88; the RF classifier follows SVM with 82.51, and the lowest accuracy was obtained when the K-NN classifier was used with 78.21%. When the User’s Accuracy values were analyzed, similarly the highest accuracy was obtained when the SVM classifier was used (98.10). However, the RF classifier gave the lowest User’s Accuracy value with 88.90%.
When the Producer’s and User’s Accuracies of the classes were analyzed, for each classifier the “vegetation” class has the highest accuracies and the lowest accuracies were obtained for the “road” class.

5. Conclusions

In this study, greenhouse areas were obtained from color and infrared orthophoto and nDSM images using Object-Based Image Classification. The NDVI, VrNIR-BI and nDSM images were used in the classification process. In the segmentation stage, the ESP2 tool and MRS were used. In the classification stage, the K-NN, RF and SVM machine learning classifiers were used and their performances were compared. The obtained classification results indicated that greenhouse areas can be detected accurately and effectively from color and infrared orthophoto and nDSM using OBIA. Although all three machine learning algorithms provided quite high accuracies, the highest overall accuracy was computed when the SVM classifier was used.

Funding

This work was supported by the General Directorate of Mapping (HGM), Turkey. The data used in this study are provided by HGM for the project named as “Detection of Greenhouse Areas Using Color Infrared Orthophoto and Digital Elevation Model (in Turkish)”.

Acknowledgments

We would like to thank Gokhan ARASAN (Lieutenant Engineer, HGM) for data acquisition.

Conflicts of Interest

The authors declare no conflict of interest.

References

  1. Carvajal, F.; Crizanto, E.; Aguilar, F.J.; Agüera, F.; Aguilar, M.A. Greenhouses detection using an artificial neural network with a very high resolution satellite image. In Proceedings of the International Archives of Photogrammetry, Remote Sensing and Spatial Information Sciences, Vienna, Austria, 12–16 July 2006; XXXVI, Part 2. pp. 37–42. [Google Scholar]
  2. Carvajal, F.; Agüera, F.; Aguilar, F.J.; Aguilar, M.A. Relationship between atmospheric corrections and training-site strategy with respect to accuracy of greenhouse detection process from very high resolution imagery. Int. J. Remote Sens. 2010, 31, 2977–2994. [Google Scholar] [CrossRef]
  3. Koc-San, D. Evaluation of different classification techniques for the detection of glass and plastic greenhouses from WorldView-2 satellite imagery. J. Appl. Remote Sens. 2013, 7, 073553. [Google Scholar] [CrossRef]
  4. Koc-San, D.; Sonmez, N.K. Plastic and glass greenhouses detection and delineation from worldview-2 satellite imagery. In Proceedings of the International Archives of the Photogrammetry, Remote Sensing and Spatial Information Sciences, XXIII ISPRS Congress, Prague, Czech Republic, 12–19 July 2016; XLI-B7, pp. 257–262. [Google Scholar] [CrossRef]
  5. Celik, S.; Koc-San, D. Greenhouse Detection Using Aerial Orthophoto and Digital Surface Model. In Intelligent Interactive Multimedia Systems and Services 2017; De Pietro, G., Gallo, L., Howlett, R., Jain, L., Eds.; KES-IIMSS 2017. Smart Innovation, Systems and Technologies; Springer: Cham, Switzerland, 2015; Volume 76, pp. 51–59. [Google Scholar] [CrossRef]
  6. Pala, E.; Tasdemir, K.; Koc-San, D. Unsupervised extraction of greenhouses using approximate spectral clustering ensemble. In Proceedings of the IEEE International Geoscience and Remote Sensing Symposium (IGARSS), Milan, Italy, 26–31 July 2015; pp. 4668–4671. [Google Scholar]
  7. Tasdemir, K.; Koc-San, D. Unsupervised extraction of greenhouses using WorldView-2 images. In Proceedings of the IEEE Geoscience and Remote Sensing Symposium, Quebec City, QC, Canada, 13–18 July 2014; pp. 4914–4917. [Google Scholar]
  8. Aguilar, M.A.; Bianconi, F.; Aguilar, J.F.; Fernandez, I. Object-Based Greenhouse Classification from GeoEye-1 and WorldView-2 Stereo Imagery. Remote Sens. 2014, 6, 3554–3582. [Google Scholar] [CrossRef]
  9. Aguilar, M.A.; Vallario, A.; Aguilar, F.J.; Lorca, A.G.; Parente, C. Object-Based Greenhouse Horticultural Crop Identification from Multi-Temporal Satellite Imagery: A Case Study in Almeria, Spain. Remote Sens. 2015, 7, 7378–7401. [Google Scholar] [CrossRef]
  10. Agüera, F.; Liu, J.G. Automatic greenhouse delineation from Quickbird and Ikonos satellite images. Comput. Electron. Agric. 2009, 66, 191–200. [Google Scholar] [CrossRef]
  11. Chaofan, W.; Jinsong, D.; Ke, W.; Ligang, M.; Tahmassebi, A.R.S. Object-based classification approach for greenhouse mapping using Landsat-8 imagery. Int. J. Agric. Biol. Eng. 2016, 9, 79–88. [Google Scholar] [CrossRef]
  12. Novelli, A.; Aguilar, M.A.; Nemmaoui, A.; Aguilar, F.J.; Tarantino, E. Performance evaluation of object based greenhouse detection from Sentinel-2 MSI and Landsat 8 OLI data: a case study from Almeria (Spain). Int. J. Appl. Earth Obs. 2016, 52, 403–411. [Google Scholar] [CrossRef]
  13. TSI (Turkish Statistical Institute). Available online: http://www.tuik.gov.tr/PreTablo.do?alt_id=1001 (accessed on 18 July 2019).
  14. Estoque, C.R.; Murayama, Y. Classification and change detection of built-up lands from Landsat-7 ETM+ and Landsat-8 OLI/TIRS imageries: a comparative assessment of various spectral indices. Ecol. Indic. 2015, 56, 205–217. [Google Scholar] [CrossRef]
  15. Dragut, L.; Csilik, O.; Eisank, C.; Tiede, D. Automated parameterisation for multi-scale image segmentation on multiple layers. ISPRS J. Photogramm. Remote Sens. 2014, 88, 119–127. [Google Scholar] [CrossRef] [PubMed]
  16. Kavzoglu, T.; Yildiz, M. Parameter-Based Performance Analysis of Object-Based Image Analysis Using Aerial and Quikbird-2 Images. ISPRS Annals of the Photogrammetry. Remote Sens. Spat. Inf. Sci. 2014, II-7, 31–37. [Google Scholar]
  17. Liu, D.; Xia, F. Assessing object-based classification: advantages and limitations. Remote Sens. Lett. 2010, 1, 187–194. [Google Scholar] [CrossRef]
  18. Koc-San, D. Approaches for Automatic Urban Building Extraction and Updating from High Resolution Satellite Imagery. Ph.D. Thesis, Middle East Technical University, Ankara, Turkey, 2009. Unpublished work. [Google Scholar]
Figure 1. Study area: (a) the location of Antalya in Turkey, and the Kumluca district in Antalya; and (b) a color infrared orthophoto of the study area.
Proceedings 42 00029 g001
Figure 2. (a) Color infrared orthophoto of the study area and the Object-Based Image Analysis (OBIA) results using: (b) K-Nearest Neighbor (K-NN) classifier, (c) Random Forest (RF) classifier, and (d) Support Vector Machine (SVM) classifier.
Proceedings 42 00029 g002
Table 1. The scale parameters obtained by the ESP2 tool and the shape and compactness parameters.
ShapeCompactnessScale Parameter
0.10.5117
0.30.5113
0.50.5103
Table 2. The Producer’s Accuracy (PA), User’s Accuracy (UA), and Overall Accuracies using the K-NN, RF, and SVM classifiers.
ClassesK-NNRFSVM
PAUAPAUAPAUA
Greenhouse78.2191.8482.5188.9096.8898.10
Building 189.2156.5787.4170.2495.4494.67
Building 292.4371.3485.9861.9882.6397.47
Road57.1362.1653.7246.4982.1084.94
Bareland83.4984.1474.8383.7594.9990.80
Vegetation100100100100100100
Overall Accuracy83.4781.4694.80
Publisher’s Note: MDPI stays neutral with regard to jurisdictional claims in published maps and institutional affiliations.

