Human Activity Recognition Based on Deep Learning Techniques †


Speech Technology Group, Information Processing and Telecomunications Center, E.T.S.I. Telecomunicación, Universidad Politécnica de Madrid (UPM), 28040 Madrid, Spain
*
Author to whom correspondence should be addressed.
†
Presented at the 6th International Electronic Conference on Sensors and Applications, 15–30 November 2019; Available online:https://ecsa-6.sciforum.net/.
Proceedings 2020, 42(1), 15; https://doi.org/10.3390/ecsa-6-06539
Published: 14 November 2019
(This article belongs to the Proceedings of The 6th International Electronic Conference on Sensors and Applications)
Abstract
:Deep learning techniques are being widely applied to Human Activity Recognition (HAR). This paper describes the implementation and evaluation of a HAR system for daily life activities using the accelerometer of an iPhone 6S. This system is based on a deep neural network including convolutional layers for feature extraction from accelerations and fully-connected layers for classification. Different transformations have been applied to the acceleration signals in order to find the appropriate input data to the deep neural network. This study has used acceleration recordings from the MotionSense dataset, where 24 subjects performed 6 activities: walking downstairs, walking upstairs, sitting, standing, walking and jogging. The evaluation has been performed using a subject-wise cross-validation: recordings from the same subject do not appear in training and testing sets at the same time. The proposed system has obtained a 9% improvement in accuracy compared to the baseline system based on Support Vector Machines. The best results have been obtained using raw data as input to a deep neural network composed of two convolutional and two max-pooling layers with decreasing kernel sizes. Results suggest that using the module of the Fourier transform as inputs provides better results when classifying only between dynamic activities.
1. Introduction
Human Activity Recognition (HAR) has become an important research field due to its wide range of applications such as tracking of sport performance [1], patients monitoring in medicine [2] [3] or supervision of elderly people at home [4].
In the literature, it is possible to find several HAR studies using on on-body sensors [5] or smartphones [6]. The later have become popular all over the world and provide numerous sensors such as accelerometers and gyroscopes that allow acquiring data from people who continuously carry those every day in a less invasive way.
Signal processing has been applied to acceleration signals in order to provide the best input configuration for the classification system. Some works have directly used raw data whereas others have performed frequency transforms like Fourier transform or a combination of both strategies [7].
Deep learning architectures have been used for both feature extraction and activity classification. In recent research, Convolutional Neural Networks (CNNs) [8] and Recurrent Neural Networks (RNNs) [9] have been applied as core of deep learning systems for HAR.
Research works on HAR propose unique signal processing and deep learning techniques for classifying the physical activities included in the dataset.
The purpose of this work is to build a deep learning system for classifying activities, comparing different inputs transforms. This way, it would be possible to select the most appropriate deep learning and signal processing strategies for recognizing several types of activities. This study reaches the best results for the used dataset.
2. Materials and Methods
This section provides a description of the dataset, the signal processing, the deep learning architecture and the cross-validation methodology used in this study.
2.1. Dataset
For this work, we used the MotionSense dataset, which contains recordings of six different physical activities (walking downstairs, walking upstairs, sitting, standing, walking and jogging), performed by 24 subjects. These subjects wore in their trousers’ front pocket an iPhone 6S with accelerometer and gyroscope sensors, collecting data sampling at 50 Hz. The influence of the accelerometer accuracy is negligible because the average bias of the accelerometer is less than 0.004 g [10]. The experiment took place at the Queen Mary University of London’s Mile End campus.
2.2. Signal Processing
We implemented a signal processing chain for data collection: pre-process module, segmentation and transformation. First, we performed a linear interpolation of raw sensory data from the accelerometer for dealing with wireless data loss. Second, we used Hamming windowing to divide the data into 3-s windows (150 samples per window) separated by 1 s. Each window was labeled by the mode of the classes included in the sample sequence. Third, we used two data formats as input of the deep learning architecture. On the one hand, we directly used raw data in time domain. Acceleration signals from static activities such as sitting or standing have a particular behavior in time domain: they keep an almost constant value. On the other hand, we expanded each window to 256 points using zero padding. After that, we obtained the module of the Fast Fourier Transform (FFT). Since the FFT is symmetric, we obtained a 128-point representation of the spectrum in the 0–25 Hz frequency band. From this representation, we selected the first 100 points of the spectrum corresponding approximately to the 0–20 Hz frequency range, discarding negligible energy above 20 Hz in these signals. Dynamic activities such as walking or jogging are characterized by energy and periodicity, which is noticeable in the frequency domain. Figure 1 represents the signal processing performed to the acceleration signals. In the dataset, we have a total of 27,762 windows.
2.3. Deep Learning Architecture
We implemented a basic deep learning architecture for both inputs: raw data and FFT module. After that, we adjusted this architecture by increasing the number of convolutional layers and modifying the kernels’ configuration.
The deep learning architecture that provides the best performance was composed of two convolutional and two max-pooling layers with decreasing kernel sizes, as it is shown in Figure 2.
During experimentation, we used several variations of this architecture to select the most appropriate configuration for each type of input (raw data or FFT). In these configurations, we used decreasing kernel sizes in convolutional and max-pooling layers. This way, we reduced the kernel size of the second convolutional layer. The pooling kernel size was half of the previous convolutional kernel size. These kernel sizes had the format (1,y) when raw data was used in order to extract dependences in time from each coordinate while they had (3,y) when the FFT module was used in order to extract dependences over the three coordinates in the frequency domain.
Regarding the learning algorithm, we used the validation set to adjust the main parameters of the deep learning architecture: 15 epochs, batch_size equal to 100 and ReLU as the activation function in all intermediate layers. The optimizer was fixed to the root-mean-square propagation method using a 0.0005 learning rate and categorical cross entropy as loss function. We used the Glorot uniform initializer, also called Xavier uniform initializer, to set the kernel weights of the convolutional layers.
2.4. Subject-Wise Cross-Validation
In this study, we used a subject-wise three-fold cross-validation. For each iteration, we divided data from the 24 subsets into three subsets: one subset including data from 16 subjects (around 20,000 windows) was used for training, one subset including data from 4 subjects was used for testing and one subset including data from 4 subjects was used for validation. Figure 3 shows the subsets for the three iterations of subject-wise cross-validation. This way, recordings from the same subject did not appear in training and testing subsets at the same experiment.
During experimentation, we selected the performance of the testing subset considering the number of epochs that minimizes the error in the validation subset.
3. Results
Table 1 shows the mean of accuracy for the subject-wise three-fold cross-validation when classifying six activities with raw data as input. This table summarizes the experiments performed including different configurations of the network. The kernel size of each layer is indicated in the table. For example, the configuration that obtains the best results (95.28%) uses two convolutional layers and two max-pooling layers: the first convolutional kernel has (1,15) size and its corresponding pooling kernel has (1,8) size while the second convolutional kernel has (1,10) size and its corresponding pooling kernel has (1,5) size.
Table 2 shows the mean of accuracy for the subject-wise three-fold cross-validation when classifying six activities with the FFT module as input. This table summarizes the experiments performed including different configurations of the network. The configuration that obtained better results (94.19%) used a convolutional layer and a max-pooling layer: the convolutional kernel has (3,6) size and its corresponding pooling kernel has (1,3) size.
These results are considerably better than those reported in a previous work [11] using Support Vector Machines (SVMs): 86.33% of accuracy.
During this work, we decided to perform experiments for different types of movements. First, we classified among the four dynamic activities in the dataset (walking downstairs, walking upstairs, walking and jogging) using both raw data and the FFT module as input. Results show that the system provides 88.18% of accuracy using raw data input and 90.14% of accuracy when the FFT module is used. The same experiments were performed over static activities (sitting and standing) but there were no significant differences in the results.
4. Discussion
Results obtained in the previous section validate the use of CNNs for feature extraction and activity classification comparing to SVMs technique used in previous work.
Results suggest that decreasing the kernel size in consecutive convolutional layers and halving this size to pooling kernels allows extracting relevant information from signals in the deep neural network.
It is important to select the architecture of the deep neural network depending on the input data. Results show that two convolutional layers are needed for extracting features from raw data signals, while one convolutional layer is enough when using the FFT module. This suggests that computing the FFT to raw data is equivalent to introducing these raw data into one convolutional layer of the deep learning architecture.
Dynamic activities are characterized by periodicity and energy distribution in the frequency domain, which is essential to distinguish among activities such as walking and jogging. It was found that using the FFT module as neural network input provides better results when recognizing dynamic activities comparing to using raw data.
5. Conclusions
This paper described the implementation and evaluation of a HAR system for daily life activities using acceleration signals from MotionSense dataset. This system was based on a deep neural network including convolutional layers for feature extraction and fully-connected layers for classification. This study performed different transformations to find the most appropriate input data format to the deep neural network. The best results were obtained using raw data as input to the deep neural network, composed of two convolutional and two max-pooling layers with decreasing kernel sizes. These results showed a 9% improvement in accuracy compared to the baseline system. Results suggested that using the module of the Fourier transform as input provides better results when classifying only between dynamic activities.
Author Contributions
Conceptualization, M.G.-M., M.S.-H. and R.S.-S.; methodology, M.G.-M., M.S.-H. and R.S.-S.; software, M.G.-M. and M.S.-H.; validation, M.G.-M. and R.S.-S.; formal analysis, M.G.-M.; investigation, M.G.-M. and M.S.-H.; resources, R.S.-S.; data curation, M.G.-M. and M.S.-H.; writing—original draft preparation, M.G.-M. and M.S.-H.; writing—review and editing, R.S.-S.; visualization, M.G.-M.; supervision, R.S.-S.; project administration, R.S.-S.; funding acquisition, R.S.-S. All authors have read and agreed to the published version of the manuscript.
Funding
This research was funded by MINECO with AMIC (MINECO, TIN2017-85854-C4-4-R), and CAVIAR (MINECO, TEC2017-84593-C2-1-R) projects. We gratefully acknowledge the support of NVIDIA Corporation with the donation of the Titan X Pascal DPU used for this research.
Acknowledgments
Authors thank all the other members of the Speech Technology Group for the continuous and fruitful discussion on these topics.
Conflicts of Interest
The authors declare no conflict of interest.
References
- Stetter, B.J.; Ringhof, S.; Krafft, F.C.; Sell, S.; Stein, T. Estimation of Knee Joint Forces in Sport Movements Using Wearable Sensors and Machine Learning. Sensors 2019, 17, 3690. [Google Scholar] [CrossRef] [PubMed]
- Gil-Martin, M.; Montero, J.M.; San-Segundo, R. Parkinson’s Disease Detection from Drawing Movements Using Convolutional Neural Networks. Electronics 2019, 8, 907. [Google Scholar] [CrossRef]
- Kurban, O.C.; Yildirim, T. Daily Motion Recognition System by a Triaxial Accelerometer Usable in Different Positions. IEEE Sens. J. 2019, 19, 7543–7552. [Google Scholar] [CrossRef]
- Kanjo, E.; Younis, E.M.G.; Ang, C.S. Deep learning analysis of mobile physiological, environmental and location sensor data for emotion detection. Inf. Fusion 2019, 49, 46–56. [Google Scholar] [CrossRef]
- San-Segundo, R.; Blunck, H.; Moreno-Pimentel, J.; Stisen, A.; Gil-Martn, M. Robust Human Activity Recognition using smartwatches and smartphones. Eng. Appl. Artif. Intell. 2018, 72, 190–202. [Google Scholar] [CrossRef]
- Ni, Q.; Cleland, I.; Nugent, C.; Hernando, A.B.G.; de la Cruz, I.P. Design and assessment of the data analysis process for a wrist-worn smart object to detect atomic activities in the smart home. Pervasive Mob. Comput. 2019, 56, 57–70. [Google Scholar] [CrossRef]
- Yang, J.B.; Minh Nhut, N.; San, P.P.; Li, X.L.; Krishnaswamy, S. Deep Convolutional Neural Networks On Multichannel Time Series for Human Activity Recognition. In Proceedings of the Twenty-Fourth International Joint Conference on Artificial Intelligence (Ijcai), Buenos Aires, Argentina, 25–31 July 2015; pp. 3995–4001. [Google Scholar]
- Edel, M.; Koppe, E. Binarized-BLSTM-RNN based human activity recognition. In Proceedings of the 7th International Conference on Indoor Positioning and Indoor Navigation (IPIN), Alcalá de Henares, Madrid, Spain, 4–7 October 2016; p. 7. [Google Scholar] [CrossRef]
- Kos, A.; Tomazic, S.; Umek, A. Evaluation of Smartphone Inertial Sensor Performance for Cross-Platform Mobile Applications. Sensors 2016, 16, 477. [Google Scholar] [CrossRef] [PubMed]
- Malekzadeh, M.; Clegg, R.G.; Cavallaro, A.; Haddadi, H. Protecting Sensory Data against Sensitive Inferences. In Proceedings of the 1st Workshop on Privacy by Design in Distributed Systems, Porto, Portugal, 23–26 April 2018. [Google Scholar] [CrossRef]
Figure 1.
Signal processing performed to the acceleration signals.
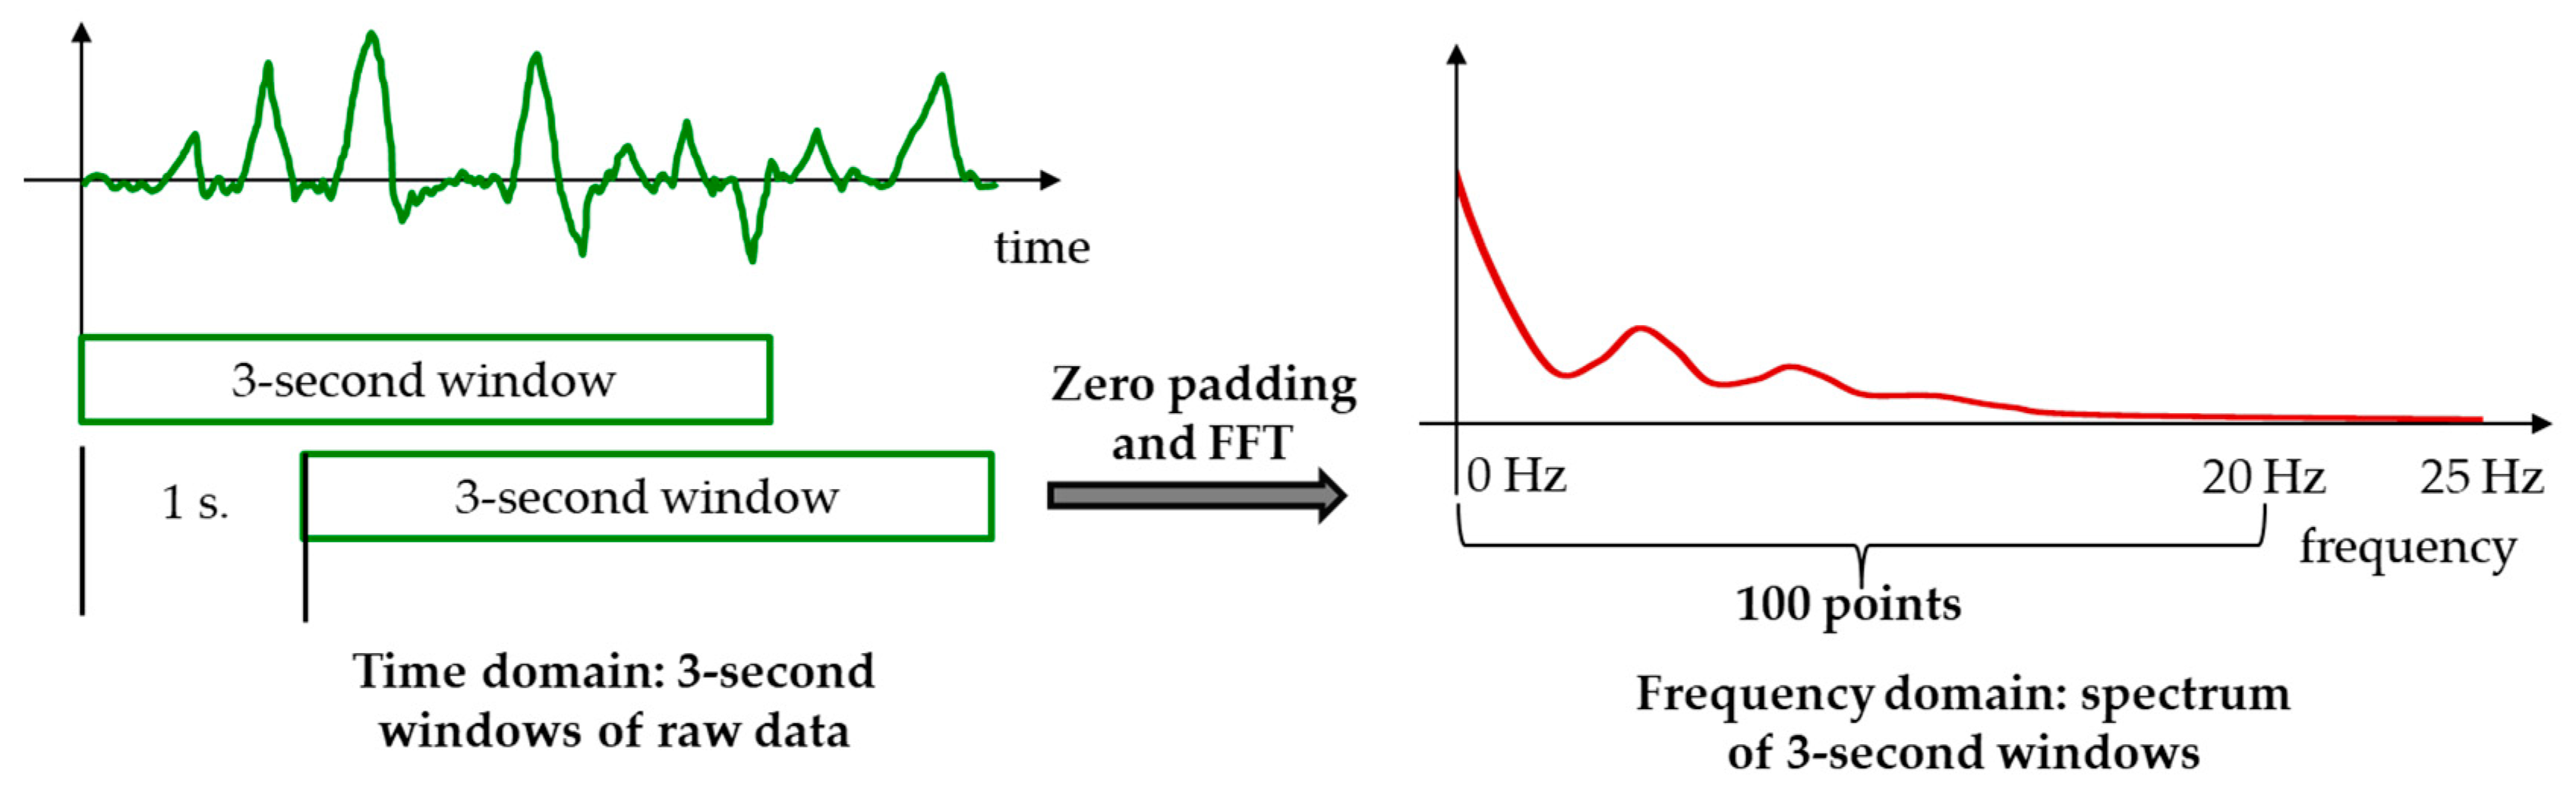
Figure 2.
Deep learning architecture used in this work.

Figure 3.
Subsets for subject-wise cross-validation.


Table 1.
Experiments using raw data for classifying 6 activities.
| Number of Convolutional Layers | Convolutional Kernels Size (x,y) | Pooling Kernels Size (x,y) | Accuracy (%) |
|---|---|---|---|
| 1 | (1,10) | (1,5) | 91.23 ± 0.55 |
| 1 | (1,15) | (1,8) | 92.92 ± 0.50 |
| 1 | (1,20) | (1,10) | 93.21 ± 0.49 |
| 1 | (1,30) | (1,15) | 91.95 ± 0.53 |
| 2 | (1,10)/(1,10) | (1,5)/(1,5) | 92.50 ± 0.51 |
| 2 | (1,15)/(1,10) | (1,8)/(1,5) | 95.28 ± 0.41 |
| 2 | (1,15)/(1,15) | (1,8)/(1,8) | 93.39 ± 0.48 |
| 2 | (1,20)/(1,10) | (1,10)/(1,5) | 91.93 ± 0.53 |
| 2 | (1,20)/(1,15) | (1,10)/(1,8) | 93.77 ± 0.47 |
| 2 | (1,20)/(1,20) | (1,10)/(1,10) | 93.63 ± 0.47 |
| 2 | (1,30)/(1,20) | (1,15)/(1,10) | 91.55 ± 0.54 |
Table 2.
Experiments using the FFT module for classifying 6 activities.
| Number of Convolutional Layers | Convolutional Kernels Size (x,y) | Pooling Kernels Size (x,y) | Accuracy (%) |
|---|---|---|---|
| 1 | (3,3) | (1,2) | 93.34 ± 0.48 |
| 1 | (3,6) | (1,3) | 94.19 ± 0.45 |
| 1 | (3,9) | (1,5) | 93.00 ± 0.49 |
| 2 | (3,3)/(3,3) | (1,2)/(1,2) | 93.13 ± 0.49 |
| 2 | (3,6)/(3,6) | (1,3)/(1,3) | 92.83 ± 0.50 |
| 2 | (3,6)/(3,3) | (1,3)/(1,2) | 93.39 ± 0.48 |
Publisher’s Note: MDPI stays neutral with regard to jurisdictional claims in published maps and institutional affiliations. |
© 2019 by the authors. Licensee MDPI, Basel, Switzerland. This article is an open access article distributed under the terms and conditions of the Creative Commons Attribution (CC BY) license (https://creativecommons.org/licenses/by/4.0/).
Share and Cite
MDPI and ACS Style
Gil-Martín, M.; Sánchez-Hernández, M.; San-Segundo, R. Human Activity Recognition Based on Deep Learning Techniques. Proceedings 2020, 42, 15. https://doi.org/10.3390/ecsa-6-06539
AMA Style
Gil-Martín M, Sánchez-Hernández M, San-Segundo R. Human Activity Recognition Based on Deep Learning Techniques. Proceedings. 2020; 42(1):15. https://doi.org/10.3390/ecsa-6-06539
Chicago/Turabian StyleGil-Martín, Manuel, Marcos Sánchez-Hernández, and Rubén San-Segundo. 2020. "Human Activity Recognition Based on Deep Learning Techniques" Proceedings 42, no. 1: 15. https://doi.org/10.3390/ecsa-6-06539