Physiological Impact of Vibration and Noise in an Open-Air Magnetic Resonance Imager: Analysis of a PPG Signal of an Examined Person †


Abstract
:1. Introduction
2. Analysis and Processing of the PPG Signal
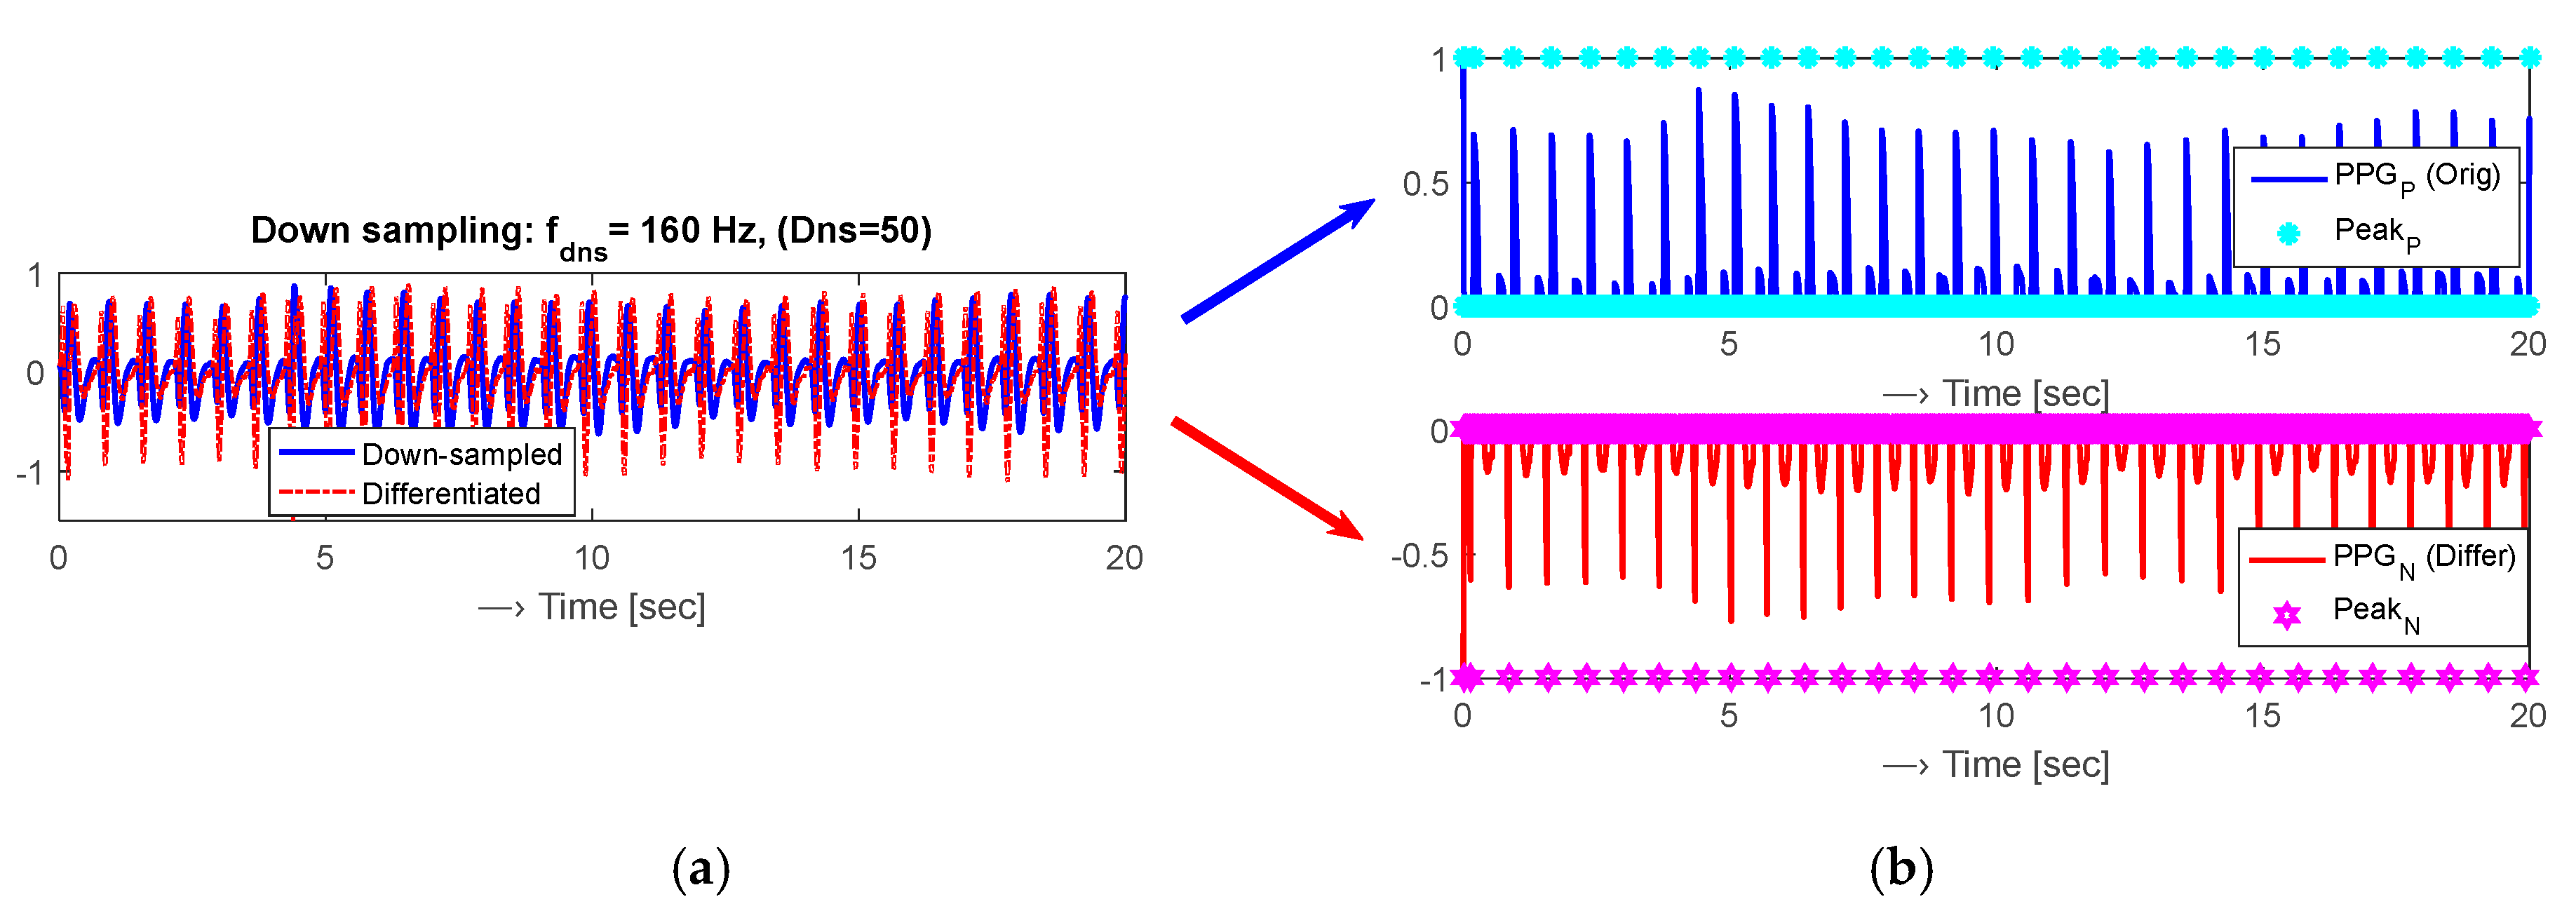
- down-sampling the original PPG signal sampling frequency fs by a factor of Dns: fdns = fs/Dns,
- normalization of the down-sampled PPG signal to the range of <–1~1>,
- calculation of the first derivative,
- determination of the positive/negative polarity of the down-sampled/differentiated PPG signal —see an example for a selected region of interest (ROI) of 20 s in Figure 1,
- localization of maximum peak positions in the PPG signals separately for both polarities.
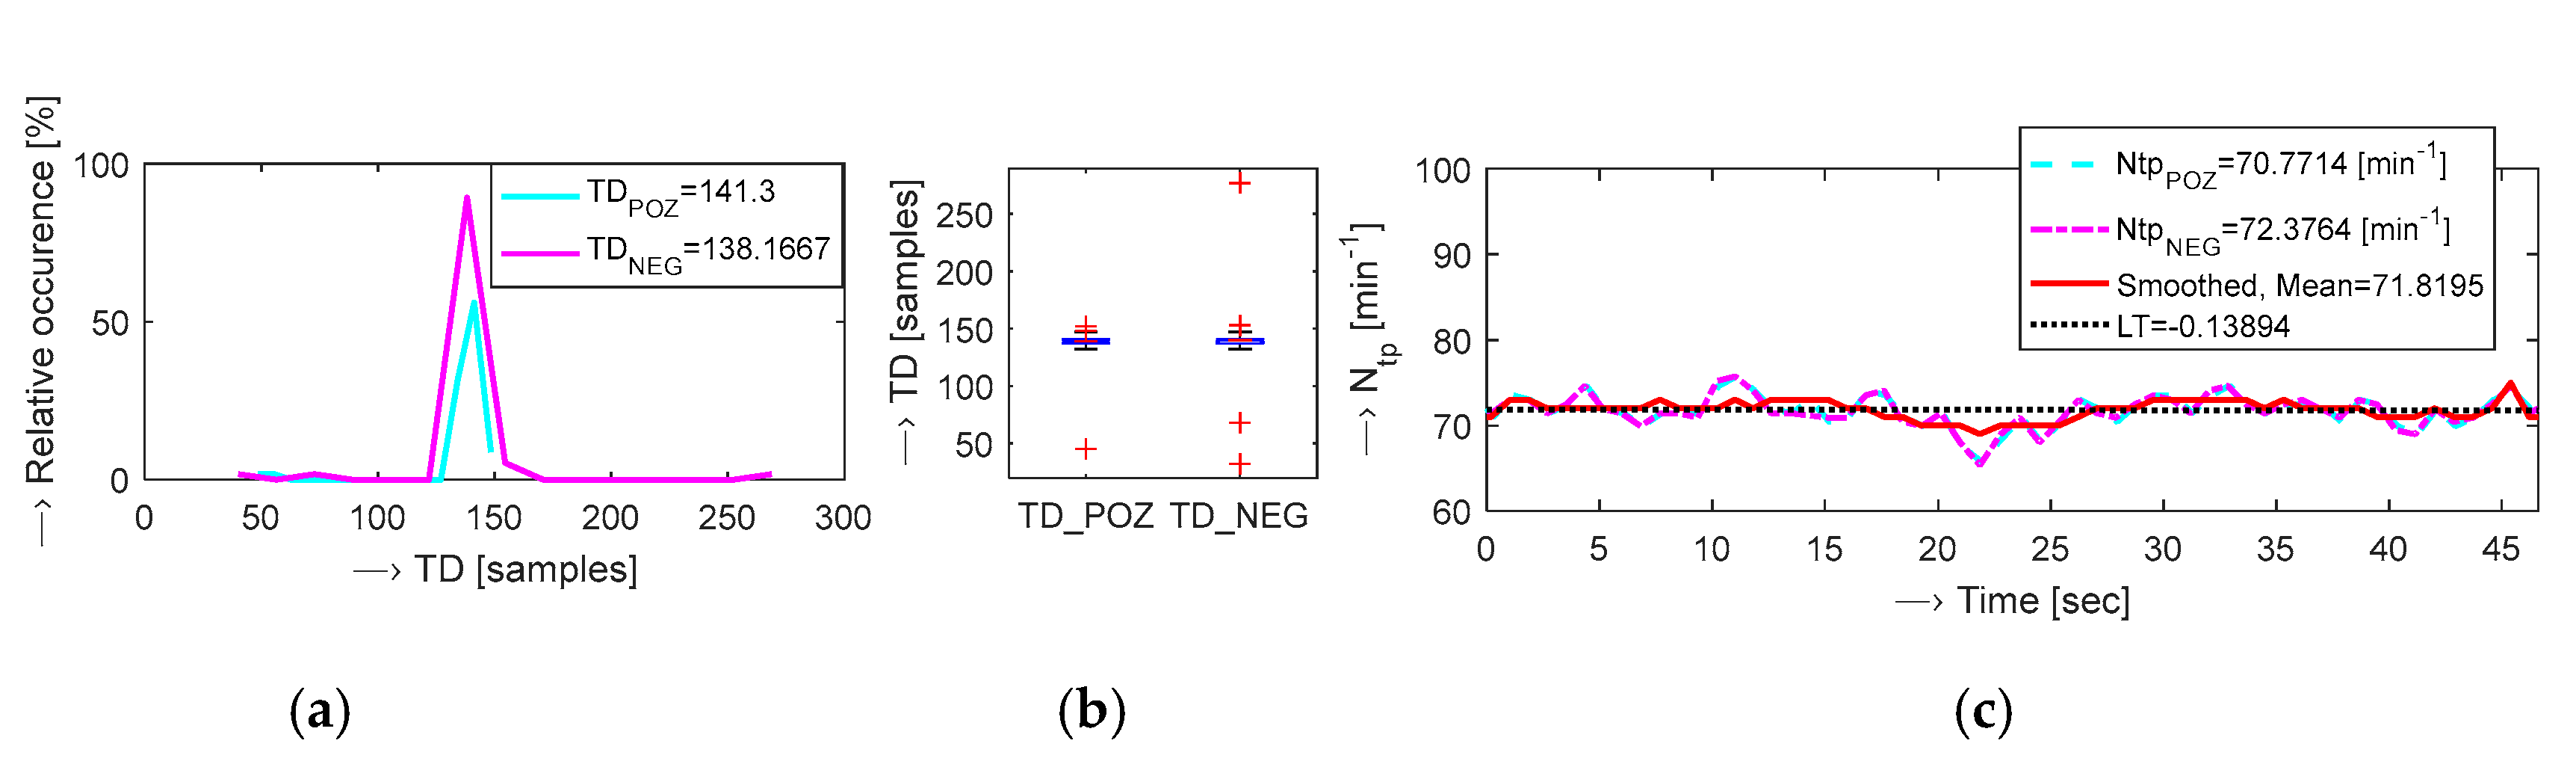
- calculation of time distances (TD) between the localized peaks (in samples) of both analyzed polarities of the PPG signal determined from the whole recorded time duration,
- building of histograms and box plots of basic statistical analysis (mean, minimum, maximum, and standard deviation) of the obtained TD values—separately for each signal polarity,
- finding the maximum occurrence of the peak distances and calculation of the number of heart beats for both polarities Ntppoz and Ntpneg [min−1].
3. Proposed Method for Analysis of MRI Vibration and Noise Effects by PPG Signal Measurement
4. Experiments and Results
- The first auxiliary experiments comprised measurement and comparison of three different types of portable BP and HR measuring devices. We compared the precision and stability of the HR values measured directly by investigated devices and determined from PPG signals with the main aim to choose the best device for the main measurement inside the MRI tomograph.
- The main measuring experiment with the tested person lying in the MRI scanning area (with an MR scan sequence running or “silent”—with no scanner activity) and his/her PPG signal recorded simultaneously for further analysis and processing. In these experimental phases the BP and HR parameters of the tested person were measured also manually by a portable BPM.
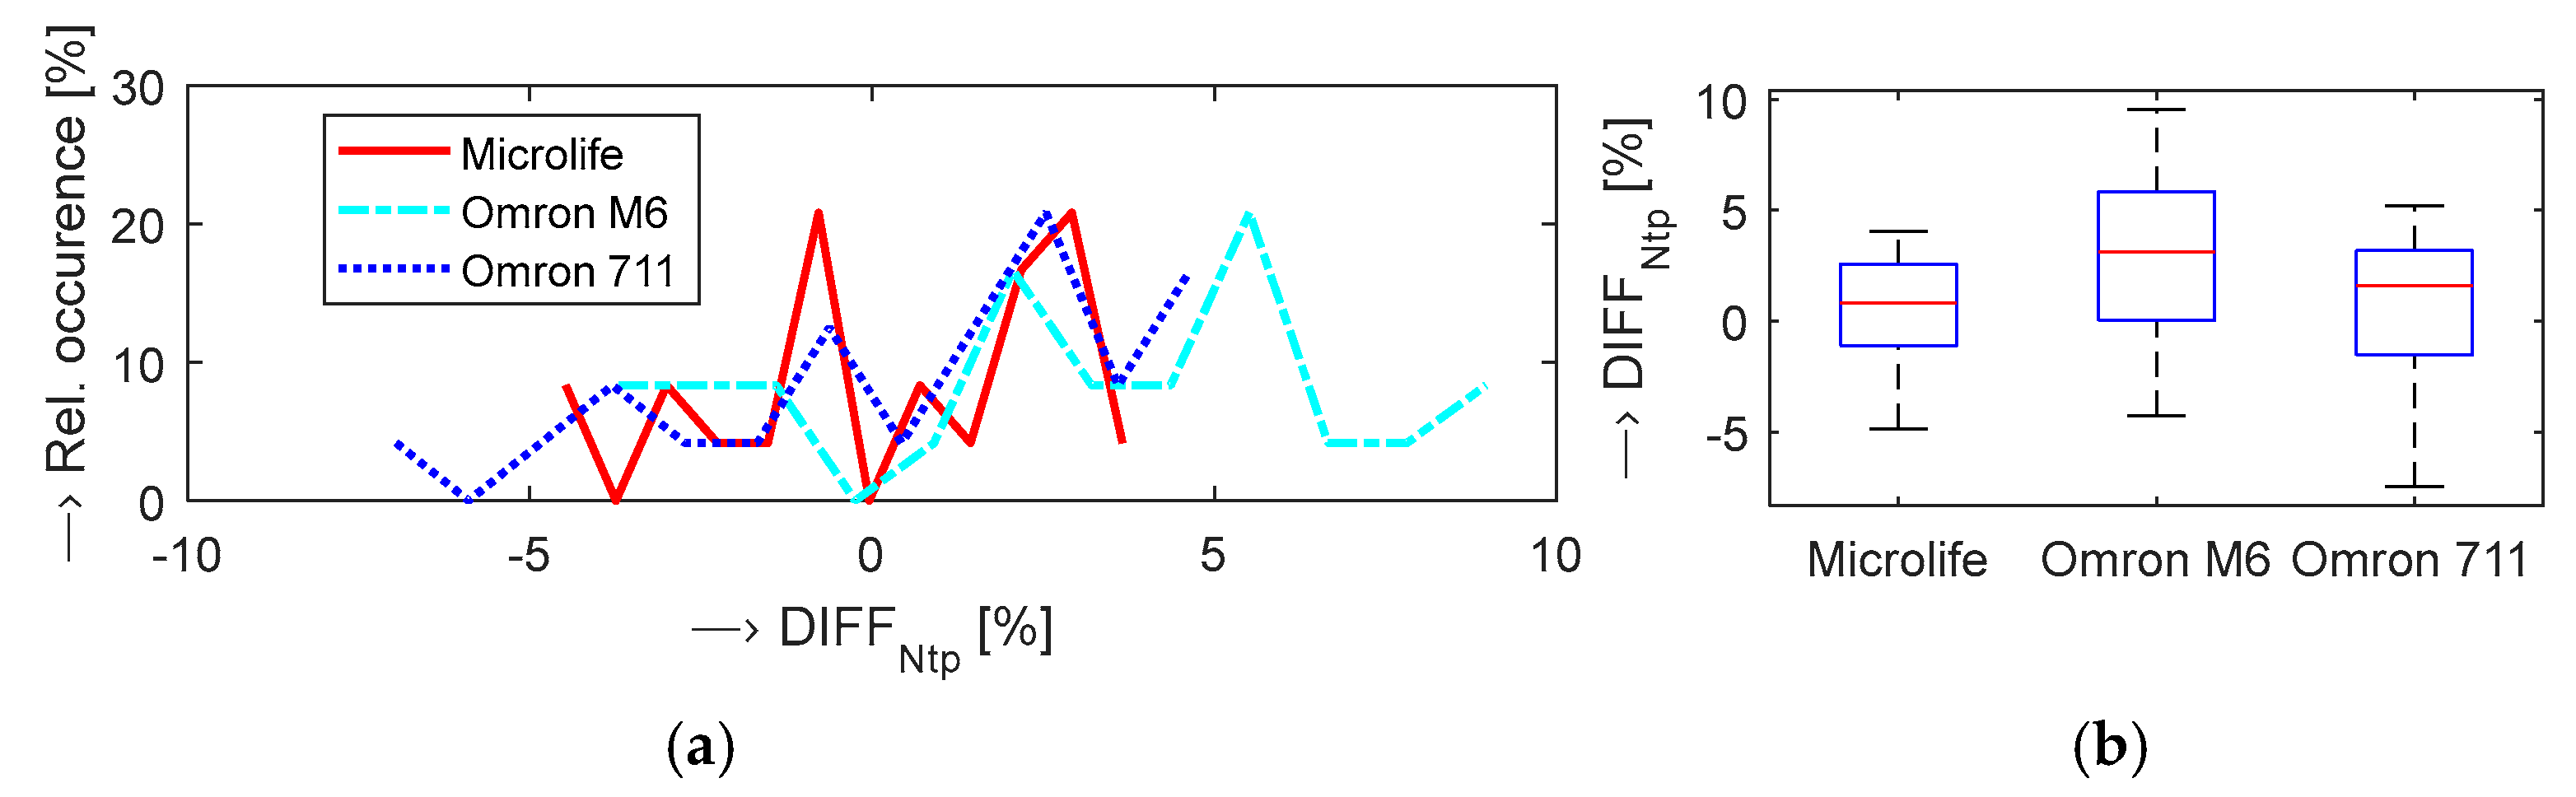
4.1. Comparion of the Blood Pressure Monitor Accuracy
- automatic blood pressure monitor with stroke risk detection BP A150-30 AFIB and a comfortable cuff (of 22–42 cm) produced by the Microlife AG (further called “Microlife”),
- Omron M6 upper arm BPM with Intelligent Wrap Cuff Technology by Omron (further called “Omron M6”),
- Omron HEM-711 DLX with Comfit Cuff by Omron (further called “Omron 711”).
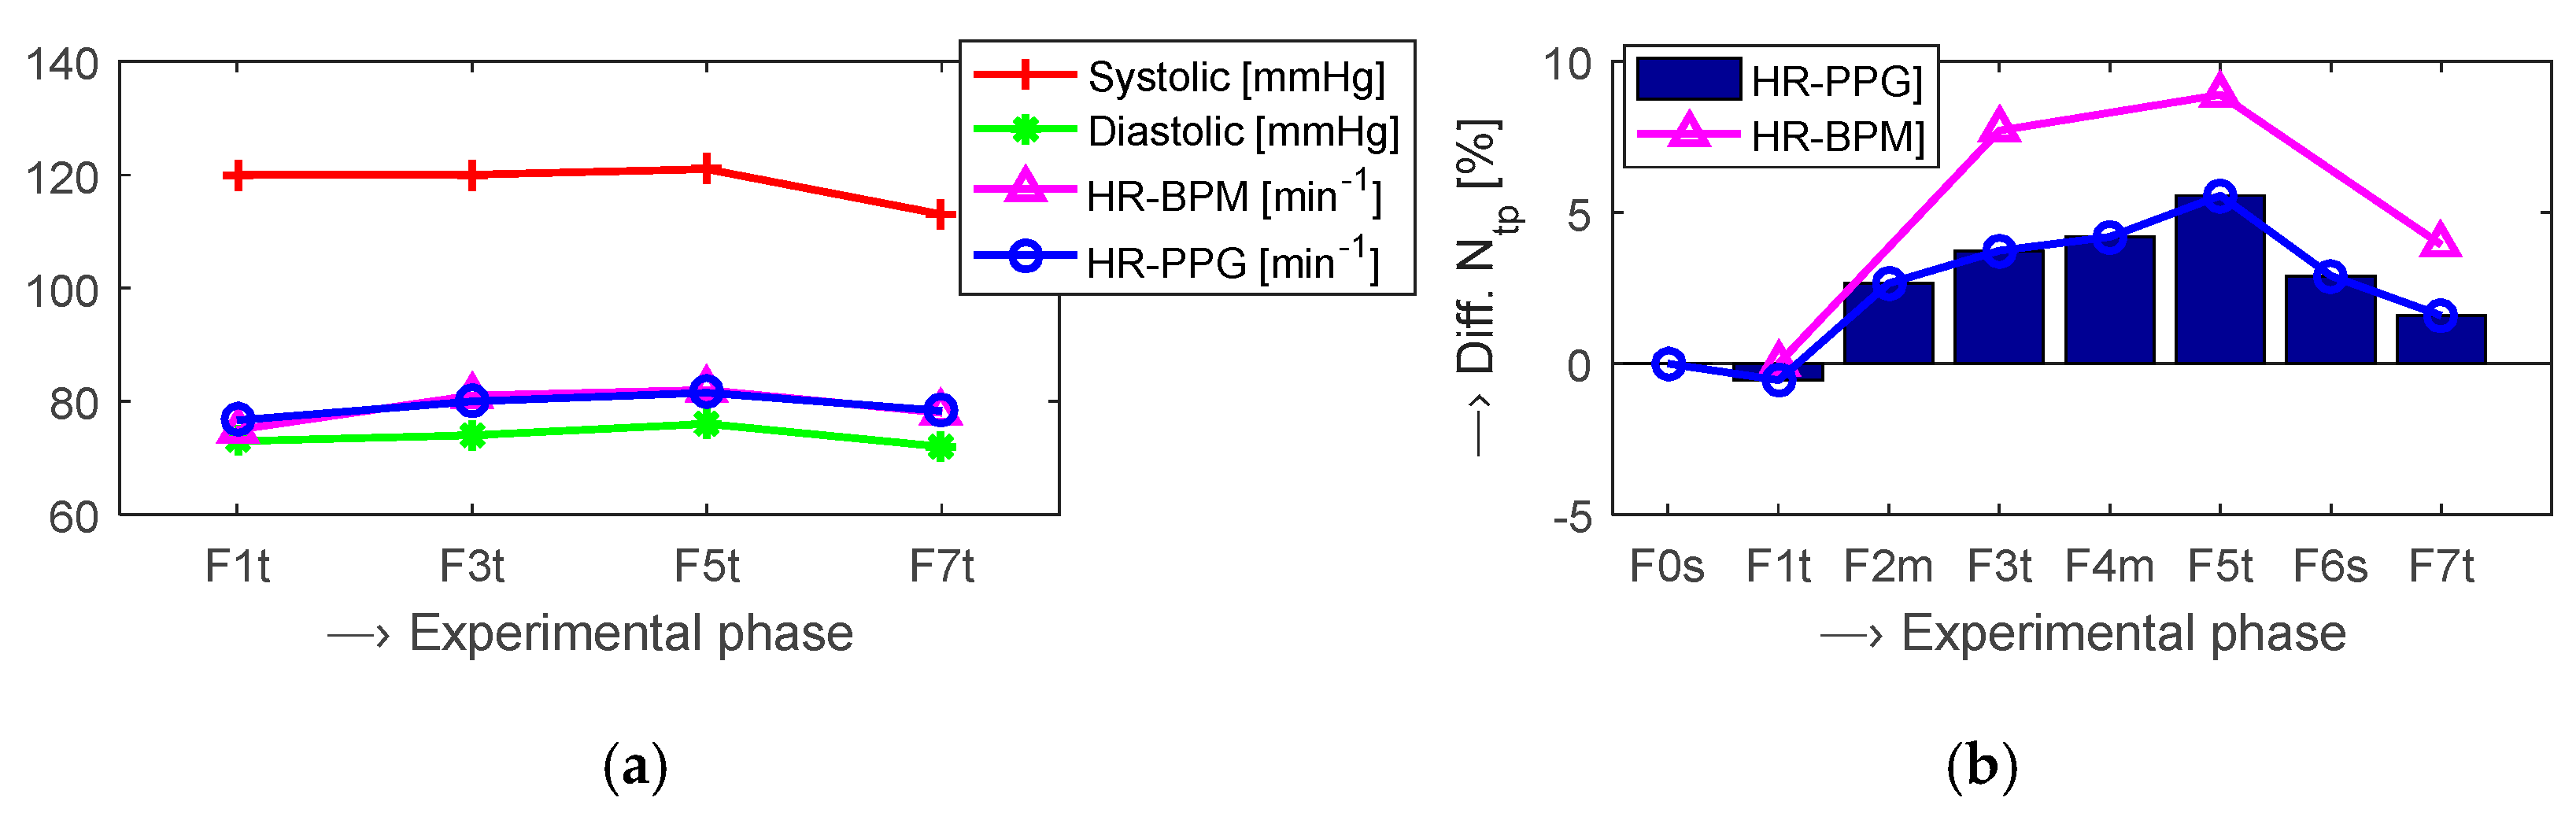
4.2. Description of the Main Measuring Experiment in the Scanning Area of the MRI Device
5. Discussion and Conclusions
Author Contributions
Funding
Acknowledgments
Conflicts of Interest
References
- Fischbach, K.; Kosiek, O.; Friebe, B.; Wybranski, C.; Schnackenburg, B.; Schmeisser, A.; Smid, J.; Ricke, J.; Pech, M. Cardiac Magnetic Resonance Imaging Using an Open 1.0T MR Platform: A Comparative Study ith a 1.5T Tunnel System. Pol. J. Radiol. 2017, 82, 498–505. [Google Scholar] [CrossRef]
- Esaote, S.P.A. E-Scan Opera. User’s Manual; Revision A; Esaote: Genoa, Italy, 2008. [Google Scholar]
- Hu, S.; Peris, V.A.; Echiadis, A.; Zheng, J.; Shi, P. Development of effective photoplethysmographic measurement techniques: From contact to non-contact and from point to imaging. In Proceedings of the 2009 Annual International Conference of the IEEE Engineering in Medicine and Biology Society, Minneapolis, MN, USA, 3–6 September 2009. [Google Scholar] [CrossRef]
- Daimiwal, N.; Sundhararajan, M.; Shriram, R. Comparative analysis of LDR and OPT 101 detectors in reflectance type PPG sensor. In Proceedings of the International Conference on Communication and Signal Processing (ICCSP), Melmaruvathur, India, 3–5 April 2014. [Google Scholar] [CrossRef]
- Mohan, P.M.; Nagarajan, V.; Das, S.R.; Rajesh, M. Heart rate measurement from wearable Photoplethysmographic sensor using Spot and tracking methods. In Proceedings of the 2015 International Conference on Communications and Signal Processing (ICCSP), Melmaruvathur, India, 2–4 April 2015; pp. 1276–1280. [Google Scholar] [CrossRef]
- Přibil, J.; Přibilová, A.; Frollo, I. Comparison of mechanical vibration and acoustic noise in the open-air MRI. Appl. Acoust. 2016, 105, 13–23. [Google Scholar] [CrossRef]
- Přibil, J.; Přibilová, A.; Frollo, I. Vibration and noise in magnetic resonance imaging of the vocal tract: Differences between whole-body and open-air devices. Sensors 2018, 18, 1112. [Google Scholar] [CrossRef]
- Přibil, J.; Přibilová, A.; Frollo, I. Influence of the human body mass in the open-air MRI on acoustic noise spectrum. Acta IMEKO 2016, 5, 81–86. [Google Scholar] [CrossRef]
- Fischer, J.; Abels, T.; Ozen, A.C.; Echternach, M.; Richter, B.; Bock, M. Magnetic resonance imaging of the vocal fold oscillations with sub-millisecond temporal resolution. Magn. Reson. Med. 2020. [Google Scholar] [CrossRef] [PubMed]

| Phase | Description | Status | Measurement | TDUR 2 [s] |
|---|---|---|---|---|
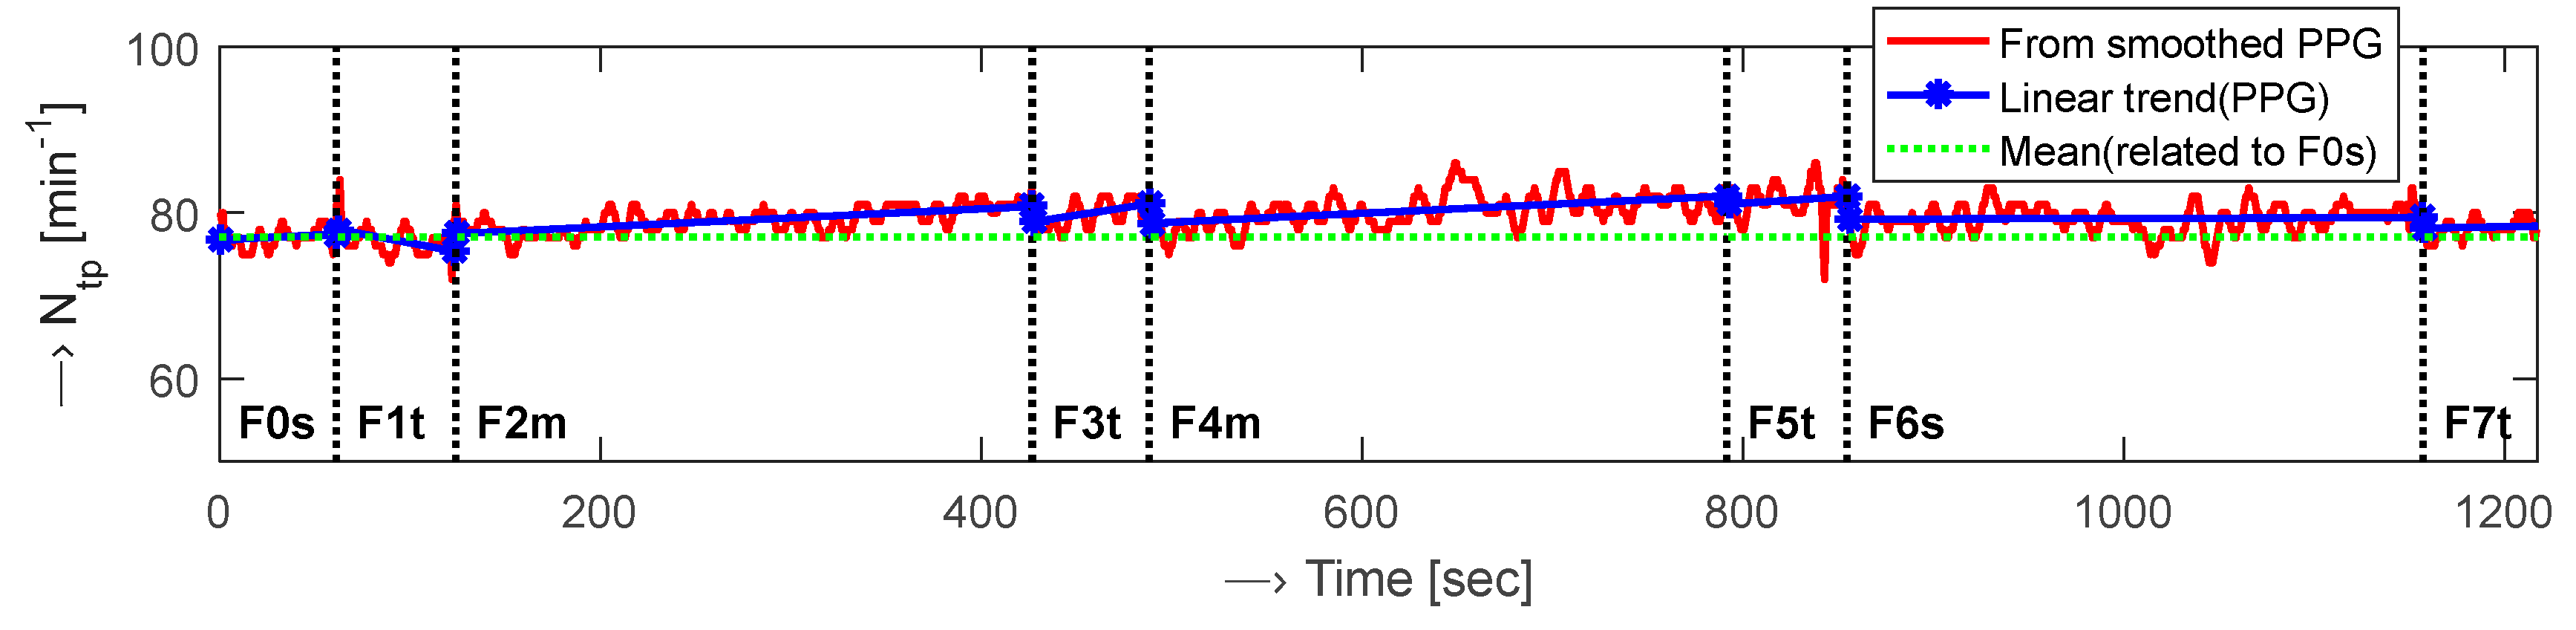
| F0s | Initial and adaptation | Silent 1 | PPG signal recording | 60 |
| F1t | 1st BP and HR measurement | Silent 1 | by BPM & PPG recording | 60 |
| F2m | 1st vibration/noise exposition | MRI scanning | PPG signal recording | 300 |
| F3t | 2nd BP and HR measurement | MRI scanning | by BPM & PPG recording | 60 |
| F4m | 2nd vibration/noise exposition | MRI scanning | PPG signal recording | 300 |
| F5t | 3rd BP and HR measurement | MRI scanning | by BPM & PPG recording | 60 |
| F6s | Relax after expositions | Silent 1 | PPG signal recording | 300 |
| F7t | 4st BP and HR measurement | Silent 1 | by BPM & PPG recording | 60 |
| Phase | From PPG Signal 1 | BP and HR by BPM Device 2 | ||
|---|---|---|---|---|
| Ntp | BPSYST | BPDIAST | HR | |
| F0s | 0 (0) | − | − | − |
| F1t | 1.18 (0.46) | 0 (0) | 0 (0) | 0 (0) |
| F2m | 1.75 (0.54) | − | − | − |
| F3t | 2.65 (0.67) | 1.93 (0.88) | −1.44 (0.52) | 6.06 (0.70) |
| F4m | 2.77 (0.82) | − | − | − |
| F5t | 4.14 (1.06) | 2.67 (0.78) | −1.95 (0.59) | 7.94 (0.74) |
| F6s | 3.04 (0.86) | − | − | − |
| F7t | 2.39 (0.61) | 1.33 (0.89) | −0.09 (0.70) | 5.77 (0.67) |
Publisher’s Note: MDPI stays neutral with regard to jurisdictional claims in published maps and institutional affiliations. |
© 2019 by the authors. Licensee MDPI, Basel, Switzerland. This article is an open access article distributed under the terms and conditions of the Creative Commons Attribution (CC BY) license (https://creativecommons.org/licenses/by/4.0/).
Share and Cite
Přibil, J.; Přibilová, A.; Frollo, I. Physiological Impact of Vibration and Noise in an Open-Air Magnetic Resonance Imager: Analysis of a PPG Signal of an Examined Person. Proceedings 2020, 42, 14. https://doi.org/10.3390/ecsa-6-06631
Přibil J, Přibilová A, Frollo I. Physiological Impact of Vibration and Noise in an Open-Air Magnetic Resonance Imager: Analysis of a PPG Signal of an Examined Person. Proceedings. 2020; 42(1):14. https://doi.org/10.3390/ecsa-6-06631
Chicago/Turabian StylePřibil, Jiří, Anna Přibilová, and Ivan Frollo. 2020. "Physiological Impact of Vibration and Noise in an Open-Air Magnetic Resonance Imager: Analysis of a PPG Signal of an Examined Person" Proceedings 42, no. 1: 14. https://doi.org/10.3390/ecsa-6-06631