Acoustic Location of Bragg Peak for Hadrontherapy Monitoring †


1
Institut d’Investigació per a la Gestió Integrada de les Zones Costaneres (IGIC), Universitat Politècnica de València (UPV), Gandia, 46730 València, Spain
2
Centro Tecnológico Naval y del Mar (CTN), Fuente Álamo, 30320 Murcia, Spain
3
Institut de Matemàtica Multidisciplinar, Universitat Politècnica de València (UPV), 46022 València, Spain
*
Author to whom correspondence should be addressed.
†
Presented at the 5th International Electronic Conference on Sensors and Applications, 15–30 November 2018; Available online: https://ecsa-5.sciforum.net.
Proceedings 2019, 4(1), 6; https://doi.org/10.3390/ecsa-5-05747
Published: 14 November 2018
(This article belongs to the Proceedings of 5th International Electronic Conference on Sensors and Applications)
Abstract
:Hadrontherapy makes it possible to deliver high doses of energy to cancerous tumors by using the large energy deposition in the Bragg-peak. However, uncertainties in the patient positioning and or in the anatomical parameters can cause distortions in the calculation of the dose distribution. In order to maximize the effectiveness of heavy particle treatments, an accurate monitoring system of the deposited dose depending on the energy, the beam time, and the spot size is necessary. The localized deposition of this energy leads to the generation of a thermoacoustic pulse that can be detected using acoustic technologies. This article presents different experimental and simulation studies of the acoustic localization of thermoacoustic pulses by generating similar signals that have been captured with a set of sensors around the samples. In addition, numerical simulations have been done where thermoacoustic pulses are emitted for the specific case of a proton beam of 100 MeV.
1. Introduction
The processes by which a source is located, recording the propagation signals received in several sensors, and analyzing them to determine the source position is known as the location of a source [1]. There are many localization techniques proposed for wireless sensor networks [2,3]. However, in this article, a three-dimensional localization to solve the estimation of an acoustic source in a homogeneous medium is introduced. The use of acoustic sensors to locate sound sources in such practical systems is of great interest but needs further development and improved performance systems. The research has significant potential for many applications in medicine, physics, engineering, and underwater acoustics. The method to locate tumor tissue is based on a computed tomography scan to find the area that will then be radiated by heavy particles in the Bragg peak region [4]. However, uncertainties in the patient positioning and or in the anatomical parameters can increase the uncertainty during the radiotherapy. In these cases, acoustic source localization in medical applications has gained a lot of interest in recent years owing to the necessity of improving the monitoring of tumor tissue in hadrontherapy treatments. Linear sensors can be employed for acoustic source localization in a noise environment using time delay estimation. The method presented here is based on the TDOA (time difference of arrival) [5] technique that performs very well in the localization of an acoustic event in both two-dimensional and three-dimensional space decreasing the error while increasing the number of sensors. The acoustic signal is generated and detected by piezoelectric sensors in known positions and using a DAQ system to record the signal. Differences in the signal propagation path from the source lead to different phases in the detected signal. Therefore, cross-correlation analysis is used to estimate the delays of arrivals accurately.
The pressure source localization of the Bragg peak in hadrontherapy can also be used to identify the regions of local heat released due to energy deposition. This pressure is related to the beam energy, the temporal pulse width, and the number of protons by the pulse. For this reason, the source assessed in this article, presents a pressure above the threshold of detection [6].
2. Overview of Approach
Techniques based on cross-correlation and generalized correlation (GCC) [7] have been employed to determinate the time difference of arrival of the signals (TDOA) given its computational cost and accuracy of the results. To obtain a better estimate of the TDOA, is convenient to filter the signal before its integration as shown in Figure 1.
The cross-correlation between the signal and filtered by the filters and , is expressed as a function of the power spectral density as:
where indicates conjugated complex and is a frequency-dependent weight function. Due to finite observations we can only obtain an estimate of . Therefore, to obtain the TDOA the following expression will be used:
For each pair of sensors, the TDOA is taken as the time delay that maximizes the cross-correlation between the filtered signals of both sensors, that is: A general model for three dimensional (3-D) estimation of a source using receivers is developed. To obtain the location of the source, we start by knowing the spatial position of a certain number of sensors . Let , the position of the source to be located, the distance between the source and the i-th sensor will be:
The range difference between receivers with respect to the first receiver is:
where is the sound velocity in the medium, is the range difference distance between the first receiver and the i-th receiver, is the distance between the first receiver and the source, and is the estimated TDOA between the first receiver and the i-th receiver.
There are different methods to solve this type of system of equations. In this case, a generalized Newton-Raphson method has been used. Particularly, the location of the source in each simulation and experiment has been computed by defining a maximum error volume for each coordinate of 0.1 mm. The robustness of similar studies for the localization of transient acoustic pulses can be found in the literature [8].
3. Studies and Results
In this section, the results of the applications of the localization method are described. Studies about simulations, experimental measures with harmonic, sine sweep signals, and bipolar pulses, closer and closer to the temporal shape of the acoustic pulse from the Bragg peak have been done. The measurements were evaluated in a water tank with a water volume of . A TC4014 sensor with receiving sensitivity and a frequency response from to was used. The positions of the sensors are shown in Section 3.2. The transmitter was a ring piezoelectric ceramic with a transmitting sensitivity (typical) at and a vertical directivity omnidirectional at . The external and internal radius of the ring are and , respectively, with in thickness shape. Figure 2 shows the transmitting voltage response (TVR) and directivity of the piezoelectric transmitter.
3.1. Numerical Simulation
To evaluate the localization algorithm described, the reconstruction of the location of a Gaussian pulse source of is simulated from the reception of four sensors located on the lateral surface of different coordinates. Figure 3 shows the position of the sensors and source in the space for the simulated model. In this simulation, the sources are always into the volume described by the coordinates of the sensors.
To evaluate the algorithm, the volume of the cube has been modified between to . The positions of the sensors are shown in Table 1 where represents the size of the edges, that is, the values of edges were .
The results of the reconstructed position obtained by the algorithm for the four source positions are shown in Table 2. These were evaluated by a computer with Core i5 2.4 GHz processor, 16 Gb in ram memory, and a 500 Gb in SSD. To solve the reconstructed position the algorithm needed a mean time of , so it could be implemented for real-time applications.
Table 2 also shows the deviation of the position of the simulated source with respect to the position of the source. These reconstructed positions do not exceed , the real position for all the studied cases. Once satisfactory results of the localization algorithm have been obtained by simulating different source points in know sensor positions, the localization method has been evaluated experimentally as described below.
3.2. Experimental Localization with Armonic Signals
The piezoelectric transmitter was situated in two different positions inside the tank with four sensors. The positions referring to the left-corner of the tank are shown in the Table 3.
Three different signals were emitted: a sine signal, a sine signal, both with five cycles per signal, and a sweep signal from to during . The signal has been filtered previously with a pass-band filter from to and the cross-correlation method has been used to detect the start time of arrival on the sensors. An example is shown in Figure 4.
The results of the reconstructed positions are shown in Table 4 where the real position of the emitter and the resulting position after applying the localization algorithm can be observed.
3.3. Experimental Localization with Thermoacoustic Signals
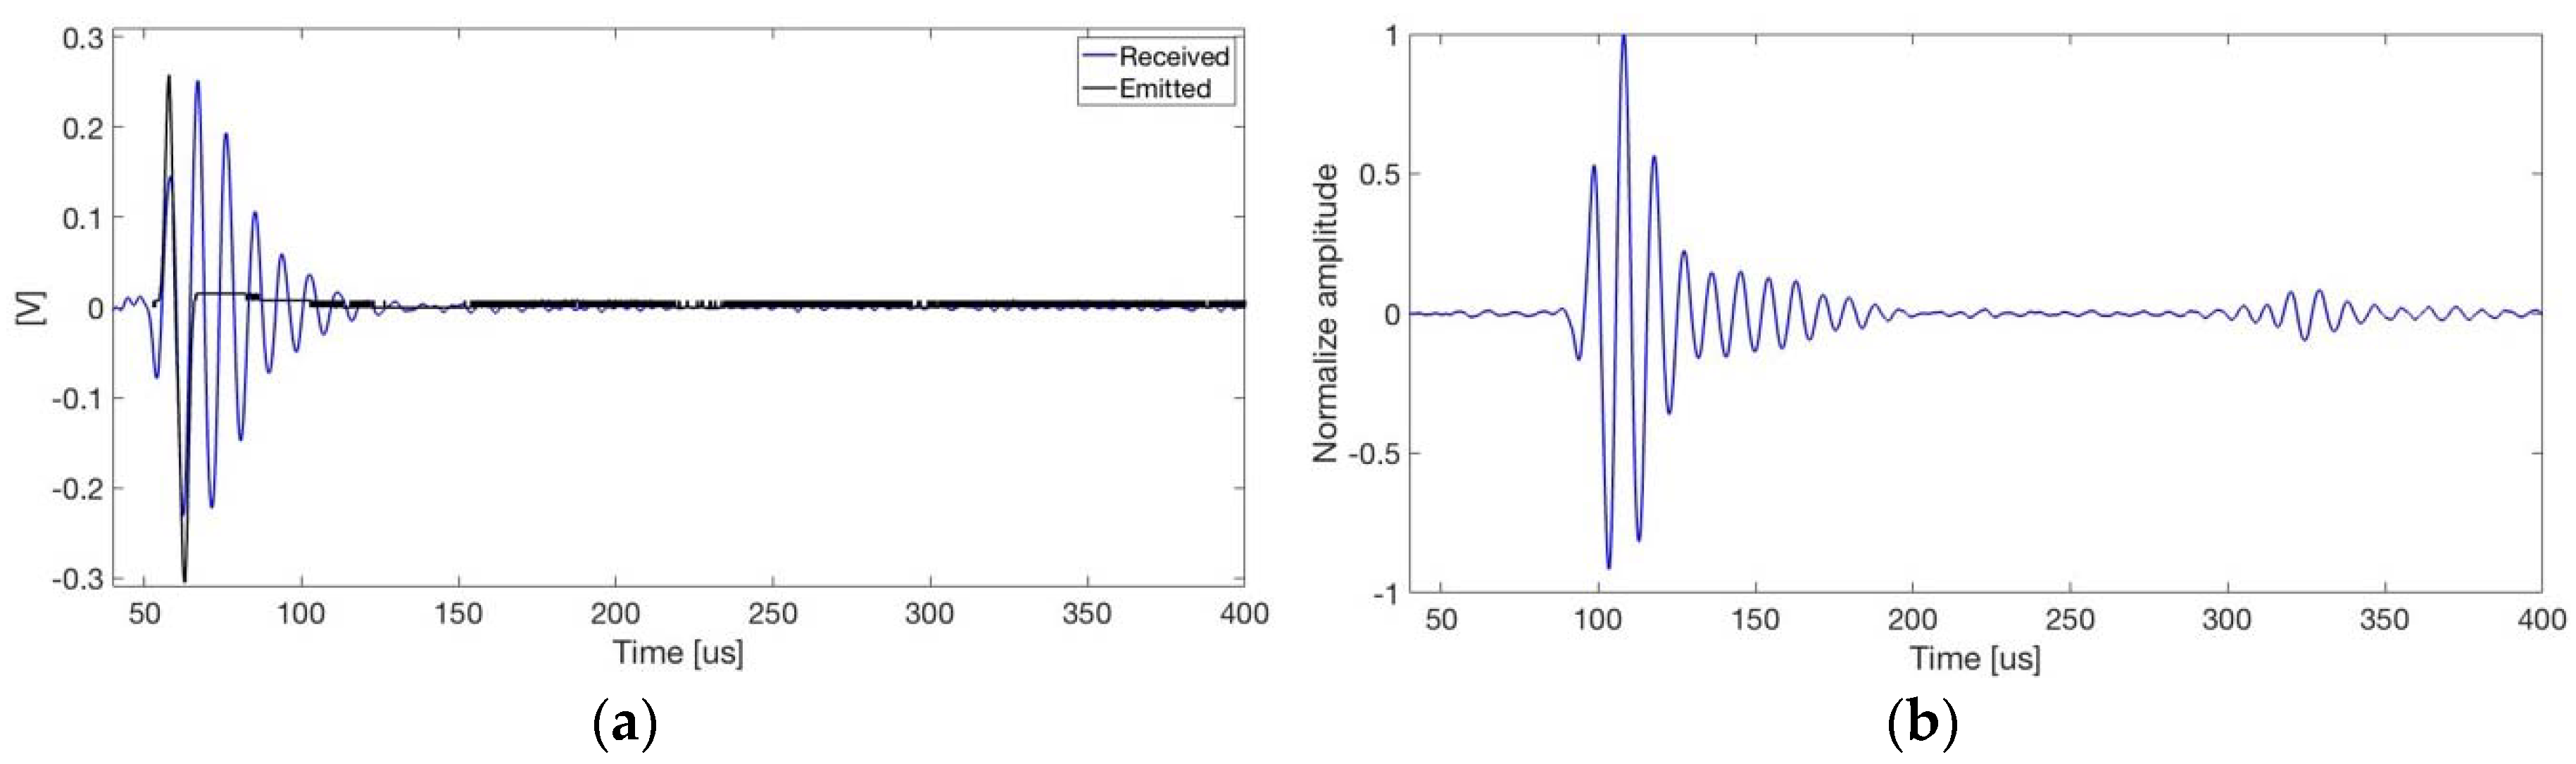
To simulate the propagation of the pulse generated in the Bragg peak on a large scale, a bipolar pulse was generated by a thermoacoustic model [9] for a proton beam with the typical beam time, spot size and number of protons per pulse that are used in hadrontherapy treatment. This signal is the result of proton interactions with tissue [10]. Also, this pulse was compared with different studies about Bragg peak behavior in the experimental analysis [6,10,11] to determinate the frequency and pressure of the signal generated. Figure 5 shows the signal emitted by the piezoelectric ceramic and the recorded signal in one of the sensors.
4. Conclusions
The proposed localization method for the Bragg peak location in hadrontherapy has been tested in different numerical simulations and experiments using different kinds of signals. In all of them, the results of time of arrival were successful using the cross-correlation method and the uncertainty in the reconstructed position is small and close to the one needed for the application. Moreover, the computational cost of the method is low, as shown for the case of the four sensors studied. So, to have a computational time smaller than 1 s should not be an issue even for the case that the number of sensors will be increased. Thus, the technique is valid for the real-time application.
Conflicts of Interest
The authors declare no conflict of interest.
References
- Kundu, T. Acoustic source localization. Ultrasonics 2014, 54, 25–38. [Google Scholar] [CrossRef] [PubMed]
- Moore, D.; Leonard, J.; Rus, D.; Teller, S. Robust distributed network localization with noisy range measurements. In Proceedings of the 2nd international conference on Enbedded networked sensor systems, Baltimore, MD, USA, 3–5 November 2004. [Google Scholar]
- Niculescu, D.S. Ad Hoc Positioning System (APS). In Proceedings of the Global Telecommunications Conference, San Antonio, TX, USA, 25–29 November 2001. [Google Scholar]
- Bortfeld, T. An analytical approximation of the Bragg curve for therapeutic proton beams. Med. Phys. 1998, 24, 2024–2033. [Google Scholar] [CrossRef] [PubMed]
- Gustafsson, F.; Gunnarsson, F. Positioning using time-difference of arrival measurements. In Proceedings of the International conference on Acoustic, Speech and Signal Processing, Hong Kong, China, 6–10 April 2003. [Google Scholar]
- Ahmad, M.; Xiang, L.; Yousefi, S.; Xing, L. Theorical detection threshold of the proton-acoustic range verification technique. Med. Phys. 2015, 42, 5735–5744. [Google Scholar] [CrossRef] [PubMed]
- Knapp, C.; Carter, G. The generalized correlation method for estimation of time delay. IEE Tran. Acoust. Speech Signal Process. 1976, 24, 320–327. [Google Scholar] [CrossRef]
- Felis, I. Tecnologías Acústicas para la Detección de Materia Oscura. Diseño y desarrollo de un detector Geyser. Ph.D. Thesis, Universidad Politécnica de Valencia, Valencia, Spain, 2017. [Google Scholar]
- Assmann, W.; Kellnberger, S.; Reinhardt, S.; Lehrack, S.; Edlich, A.; Thirolf, P.G.; Moser, M.; Dollinger, G.; Omar, M.; Ntziachristos, V.; et al. Ionoacoustic characterization of the proton Bragg peak with submillimeter accuracy. Med. Phys. 2015, 42, 567–574. [Google Scholar] [CrossRef] [PubMed]
- Jones, K.C.; Segnal, C.M.; Avery, S. How proton pulse characteristics influence protoacoustic determination of proton-beam range: Simulation studies. Phys. Med. Biol. 2016, 61, 2213–2242. [Google Scholar] [CrossRef] [PubMed]
- Jones, K.C.; Witztum, A.; Sehgal, C.M.; Avery, S. Proton beam characterization by proton-induced acoustic emission: Simulation studies. Phys. Med. Biol. 2014, 59, 6549–6563. [Google Scholar] [CrossRef] [PubMed]
Figure 1.
Scheme for obtaining time of arrival (TOA).
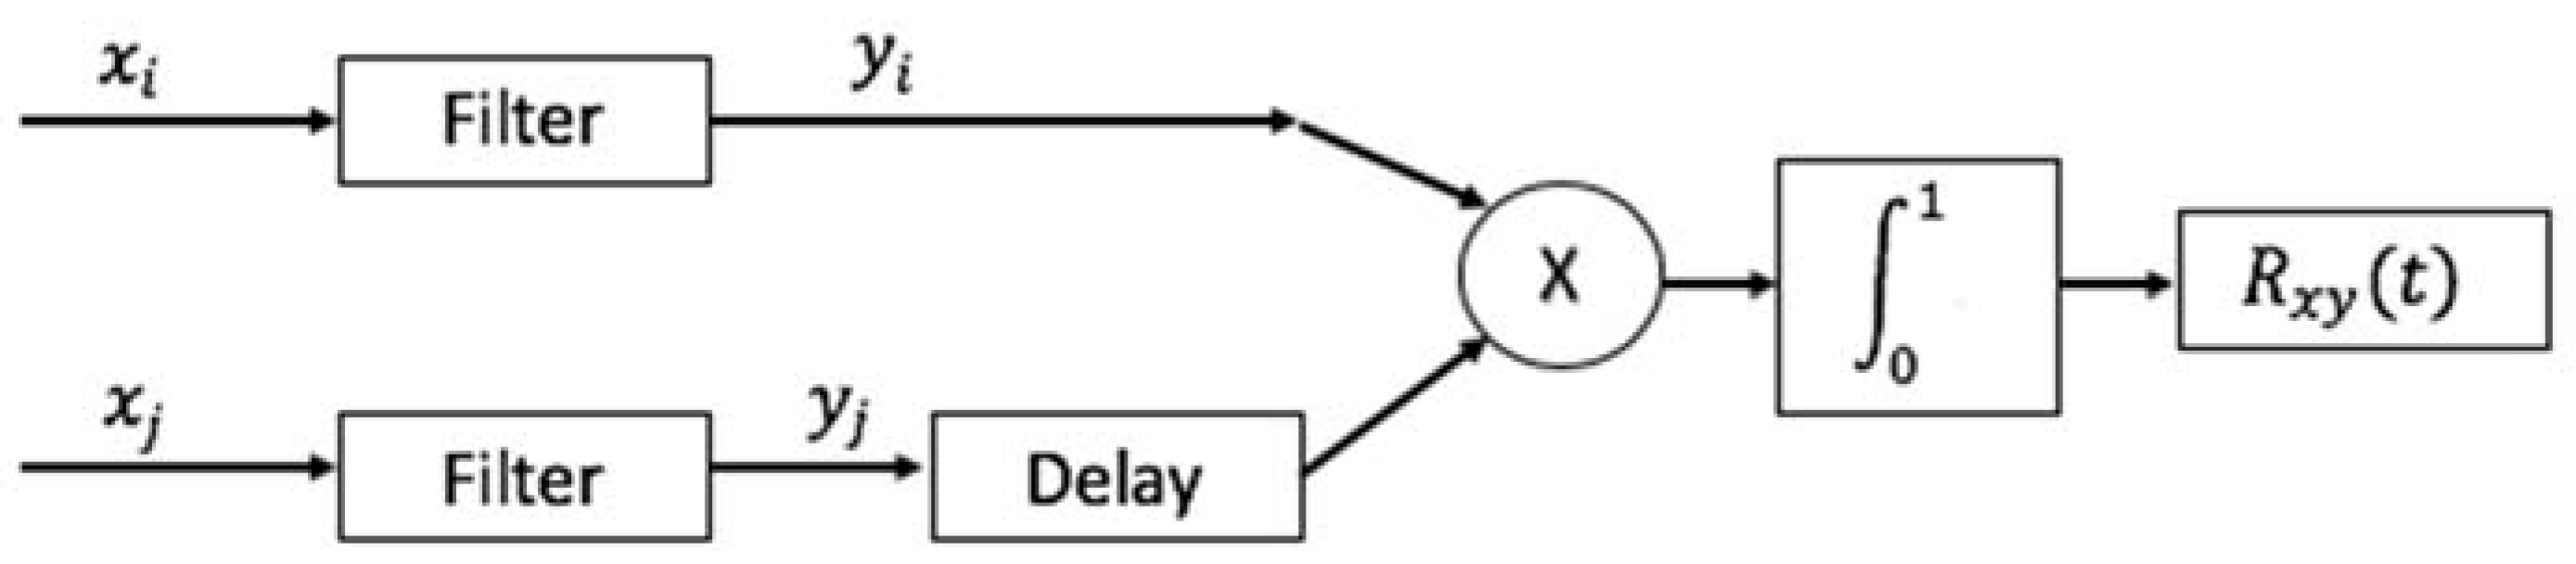
Figure 2.
(a) Transmitting voltage response (TVR) for the piezoelectric ring transmitter; (b) directivity at 100, 200, and 300 kHz.
Figure 2.
(a) Transmitting voltage response (TVR) for the piezoelectric ring transmitter; (b) directivity at 100, 200, and 300 kHz.

Figure 3.
Volume proposed to evaluate the localization algorithm. In this case, four sensors (black points) have been situated on the faces around the cube. Inside, three events will be simulated in different positions. The positions of the sensors and sources are shown in Table 1. This figure shows 1 point of source (blue point).
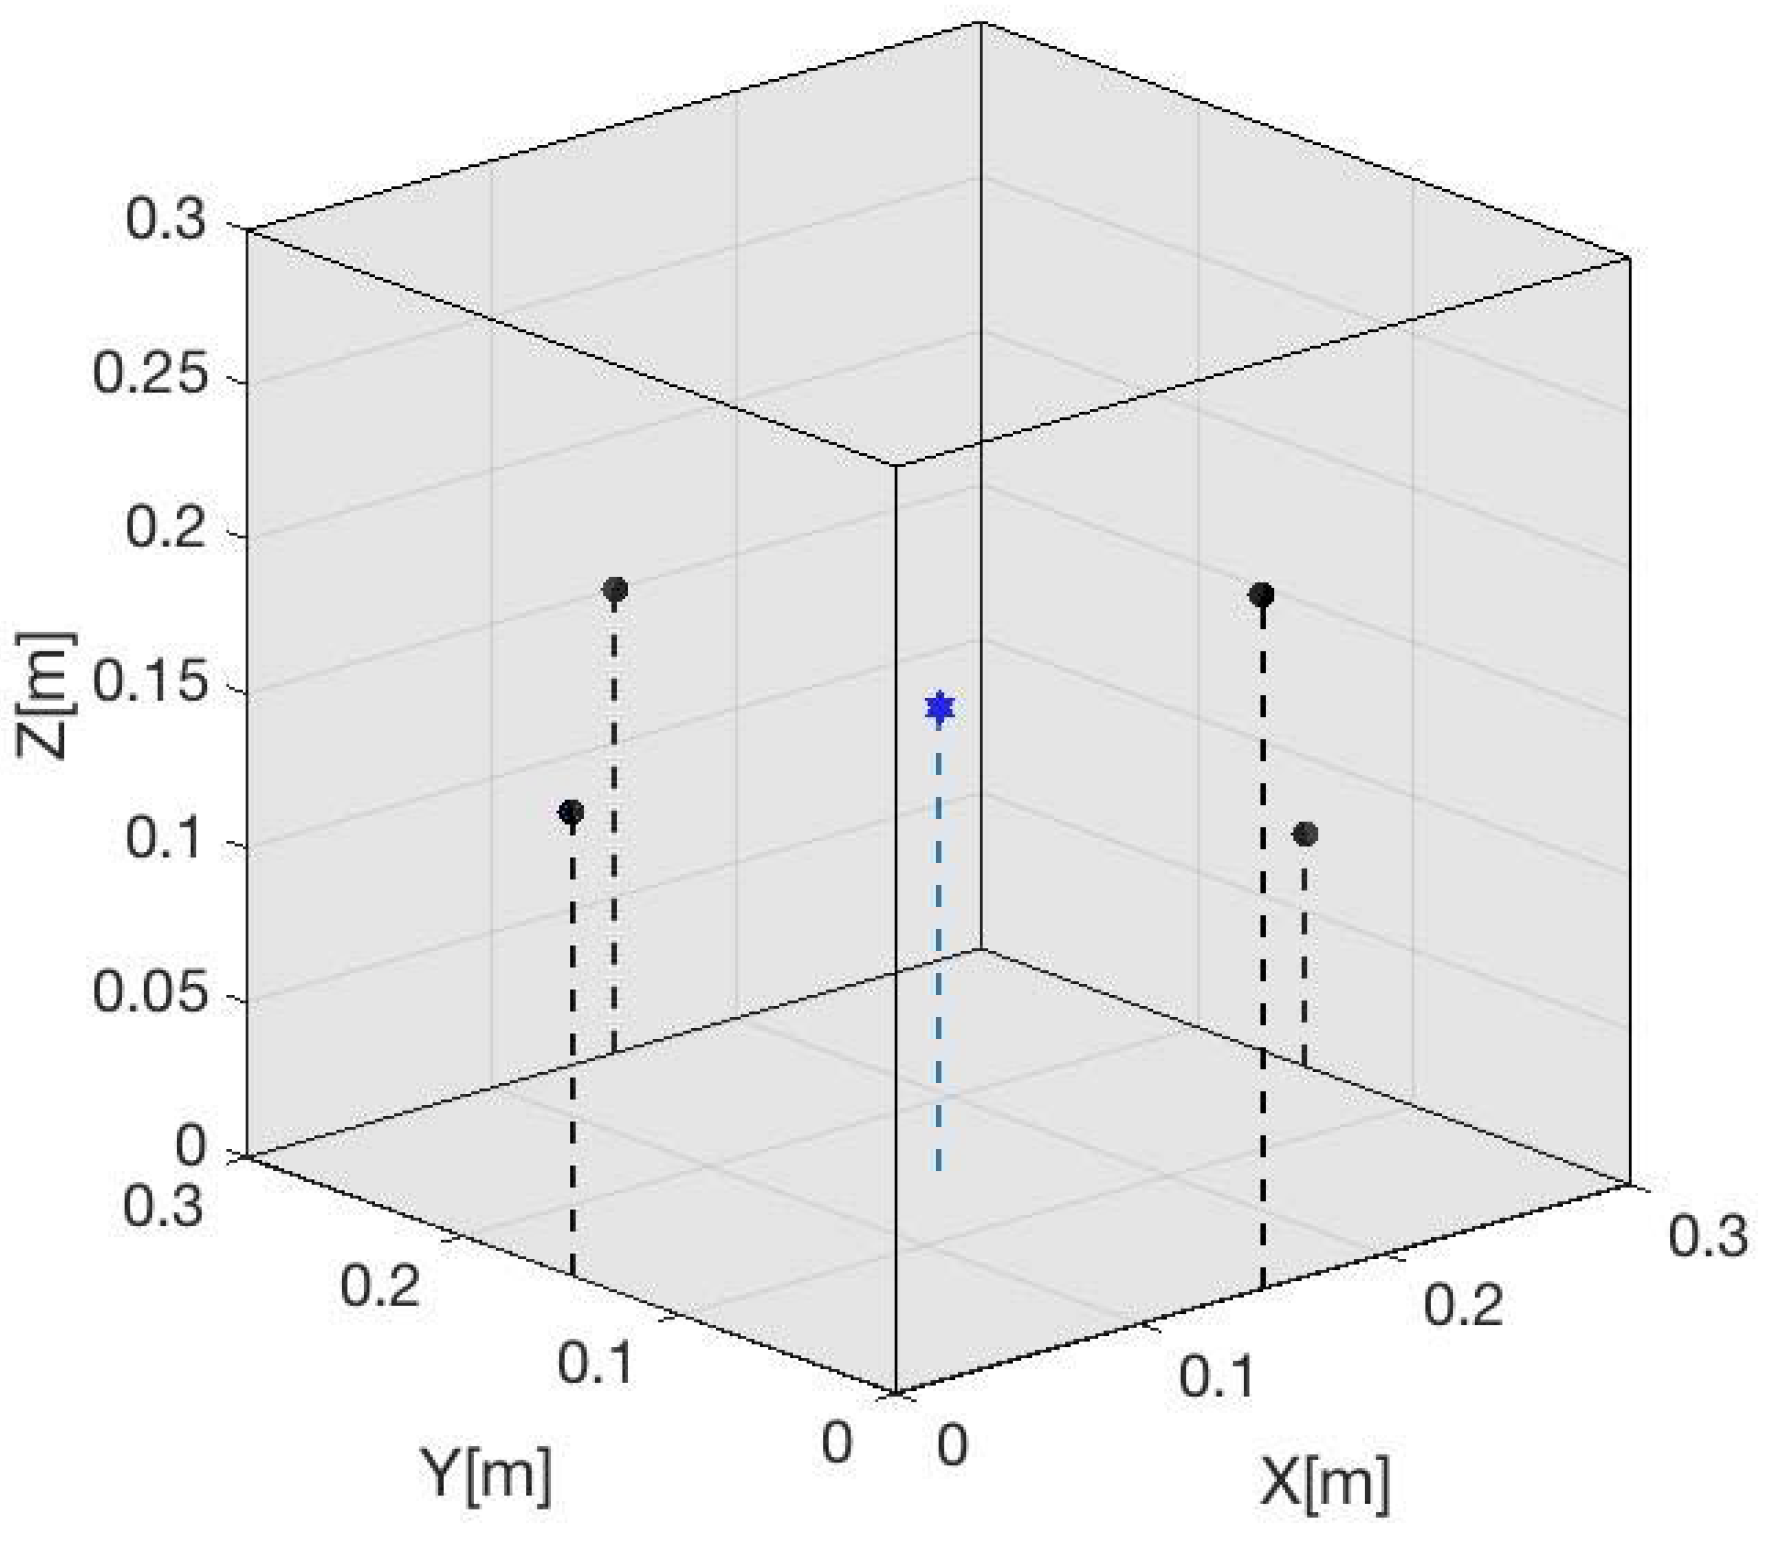
Figure 4.
(a) Example of sine sweep signal emitted and received; (b) Cross-correlation between the emitted and received signals.
Figure 4.
(a) Example of sine sweep signal emitted and received; (b) Cross-correlation between the emitted and received signals.
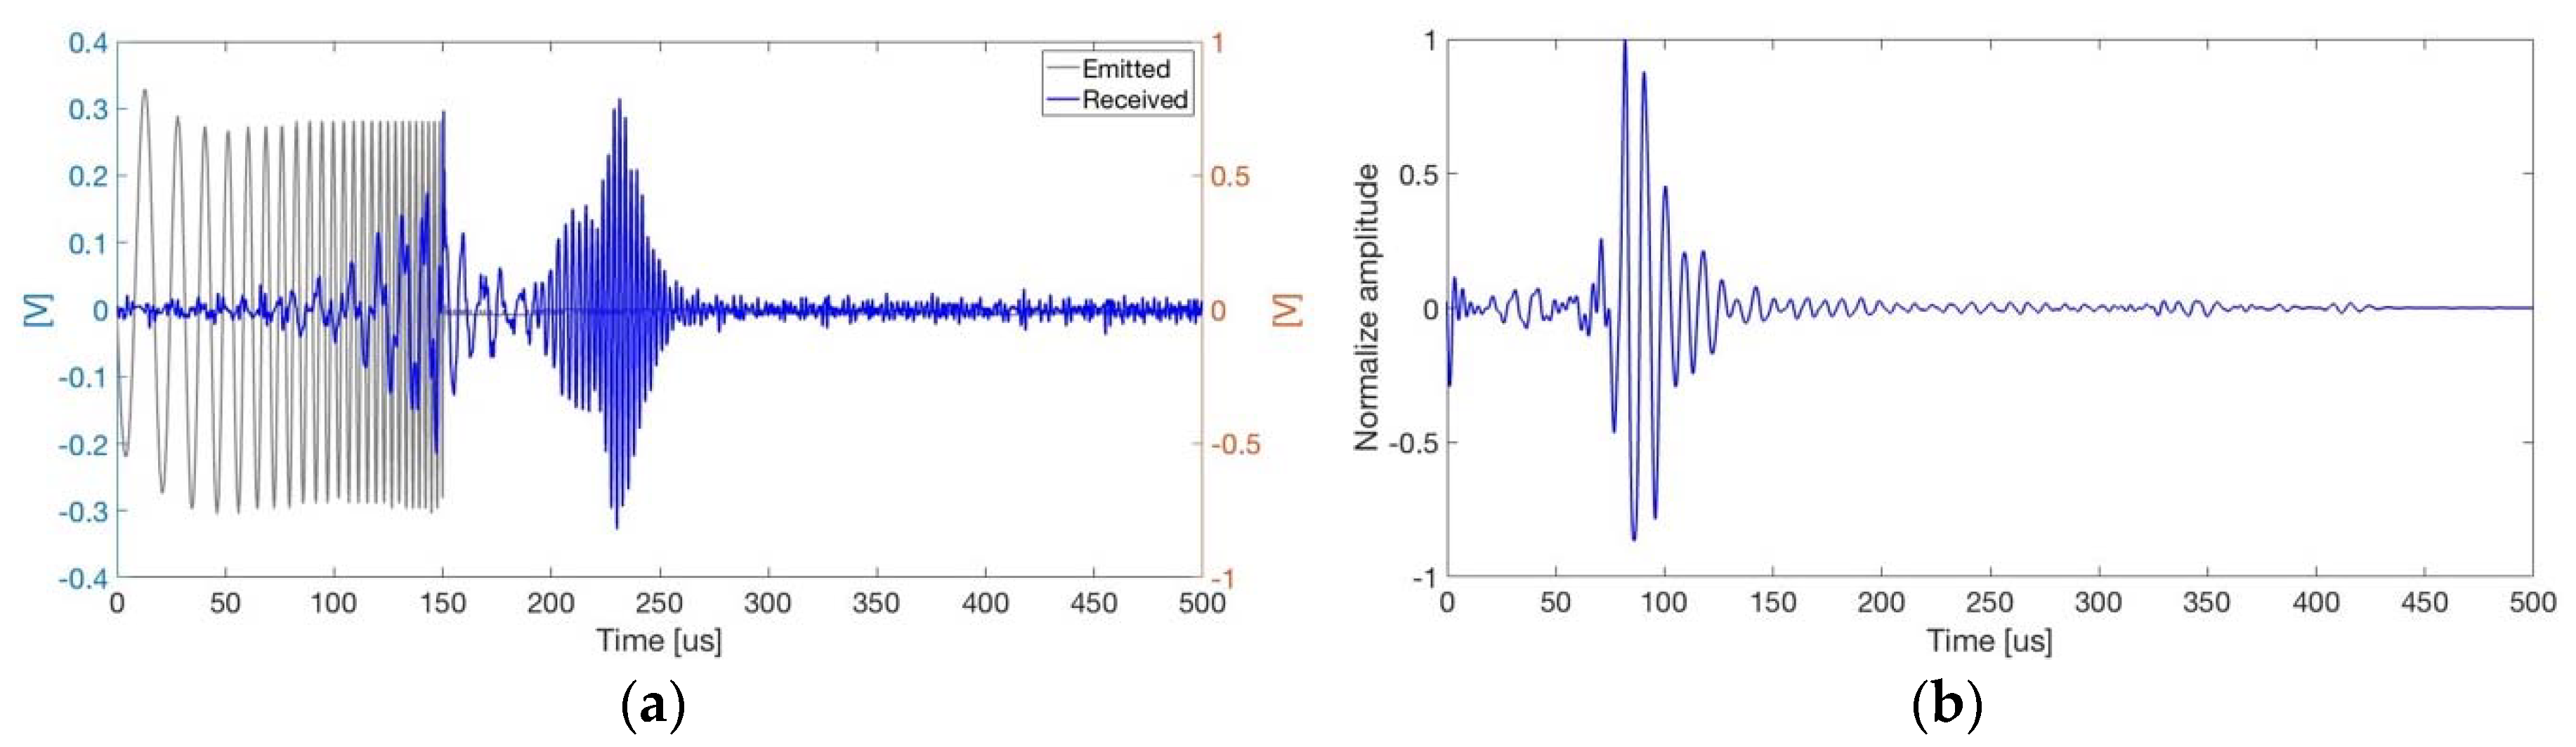
Figure 5.
(a) Signal generated (black) by the piezoelectric ring ceramic and received signal (blue) from TC4014 sensor in one of the measurement positions. The bipolar pulse generated by the thermoacoustic model has the following characteristics: the energy of the beam is , with a temporal profile and protons per pulse; (b) Cross-correlation of the emitted and received signal.

Table 1.
Positions of the sensors and the source in the simulated.
| Axis | Sensors | Source (mm) | |||||
|---|---|---|---|---|---|---|---|
| 1 | 2 | 3 | 4 | 1 | 2 | 3 | |
| X | H/2 | 0.0 | H/2 | H | 150 | 100 | 80 |
| Y | 0.0 | H/2 | H | H/2 | 150 | 180 | 100 |
| Z | 3H/4 | H/2 | H/2 | H/4 | 150 | 150 | 180 |
Table 2.
Real and estimated positions of three different sources depending on the increase of the volume.
Table 2.
Real and estimated positions of three different sources depending on the increase of the volume.
| Real Position (mm) | 1 | 2 | 3 | 4 | 5 | |
|---|---|---|---|---|---|---|
| X | 100 | 100.10 ± 0.11 | 100.10 ± 0.10 | 100.10 ± 0.10 | 94.00 ± 0.42 | 100.0 ± 0.01 |
| Y | 100 | 100.10 ± 0.10 | 98.00 ± 0.14 | 100.10 ± 0.11 | 96.00 ± 0.28 | 100.0 ± 0.01 |
| Z | 100 | 100.10 ± 0.10 | 96.00 ± 0.28 | 101.20 ± 0.14 | 94.00 ± 0.42 | 100.0 ± 0.01 |
| X | 100 | 100.00 ± 0.01 | 100.0 ± 0.01 | 100.0 ± 0.01 | 100.0 ± 0.01 | 102.0 ± 1.4 |
| Y | 180 | 100.20 ± 0.56 | 100.20 ± 0.56 | 181.2 ± 1.4 | 150 ± 21 | 163 ± 12 |
| Z | 150 | 100.10 ± 0.32 | 100.1 ± 00.35 | 147.4 ± 1.8 | 146 ± 21 | 145.8 ± 3.0 |
| X | 80 | 80.00 ± 0.01 | 78.0 ± 1.4 | 85.0 ± 4.5 | 71.0 ± 8.0 | 87.0 ± 4.9 |
| Y | 100 | 100.00 ± 0.01 | 98.0 ± 2.2 | 106.0 ± 5.2 | 93.0 ± 6.4 | 105.0 ± 3.5 |
| Z | 180 | 180.10 ± 0.10 | 178.0 ± 1.4 | 186.0 ± 5.3 | 168 ± 12 | 189.0 ± 6.4 |
Table 3.
Positions of the sensors and the source inside the tank.
| Axis | Sensors (mm) | Source (mm) | ||||
|---|---|---|---|---|---|---|
| 1 | 2 | 3 | 4 | 1 | 2 | |
| X | 600 | 500 | 400 | 500 | 410 | 450 |
| Y | 550 | 450 | 540 | 650 | 450 | 540 |
| Z | 380 | 280 | 340 | 340 | 350 | 330 |
Table 4.
Real and estimated positions of two different harmonic sources inside the tank.
| Axis | Real Position (mm) | Sine 100kHz | Sine 150kHz | Sweep Signal |
|---|---|---|---|---|
| X | 450 | 459.0 ± 9.0 | 460.0 ± 9.3 | 460.0 ± 9.2 |
| Y | 540 | 540.00 ± 0.72 | 540.00 ± 0.55 | 540.00 ± 0.43 |
| Z | 330 | 340.0 ± 9.2 | 330.00 ± 0.18 | 330.00 ± 0.32 |
| X | 410 | 401.0 ± 8.9 | 416.0 ± 5.7 | 418.0 ± 7.0 |
| Y | 450 | 448.0 ± 1.3 | 450.00 ± 0.44 | 450.00 ± 0.56 |
| Z | 350 | 352.0 ± 1.8 | 350.00 ± 0.36 | 350.00 ± 0.65 |
Table 5.
Real and estimated positions of the bipolar pulse signal in two different positions.
| Axis | Real Position (mm) | Sine 100 kHz |
|---|---|---|
| X | 450 | 459.0 ± 8.8 |
| Y | 540 | 540.00 ± 0.52 |
| Z | 330 | 330.00 ± 0.12 |
| X | 410 | 414.0 ± 3.3 |
| Y | 450 | 450.00 ± 0.52 |
| Z | 350 | 350.00 ± 0.49 |
© 2018 by the authors. Licensee MDPI, Basel, Switzerland. This article is an open access article distributed under the terms and conditions of the Creative Commons Attribution (CC BY) license (https://creativecommons.org/licenses/by/4.0/).
Share and Cite
MDPI and ACS Style
Otero, J.; Ardid, M.; Felis, I.; Herrero, A. Acoustic Location of Bragg Peak for Hadrontherapy Monitoring. Proceedings 2019, 4, 6. https://doi.org/10.3390/ecsa-5-05747
AMA Style
Otero J, Ardid M, Felis I, Herrero A. Acoustic Location of Bragg Peak for Hadrontherapy Monitoring. Proceedings. 2019; 4(1):6. https://doi.org/10.3390/ecsa-5-05747
Chicago/Turabian StyleOtero, Jorge, Miguel Ardid, Ivan Felis, and Alicia Herrero. 2019. "Acoustic Location of Bragg Peak for Hadrontherapy Monitoring" Proceedings 4, no. 1: 6. https://doi.org/10.3390/ecsa-5-05747