2D Deconvolution Using Adaptive Kernel †


Max-Planck-Institut für Plasmaphysik, Boltzmannstrasse 2, 85748 Garching, Germany
*
Author to whom correspondence should be addressed.
†
Presented at the 39th International Workshop on Bayesian Inference and Maximum Entropy Methods in Science and Engineering, Garching, Germany, 30 June–5 July 2019.
Proceedings 2019, 33(1), 6; https://doi.org/10.3390/proceedings2019033006
Published: 21 November 2019
(This article belongs to the Proceedings of The 39th International Workshop on Bayesian Inference and Maximum Entropy Methods in Science and Engineering)
Abstract
:An analysis tool using Adaptive Kernel to solve an ill-posed inverse problem for a 2D model space is introduced. It is applicable for linear and non-linear forward models, for example in tomography and image reconstruction. While an optimisation based on a Gaussian Approximation is possible, it becomes intractable for more than some hundred kernel functions. This is because the determinant of the Hessian of the system has be evaluated. The SVD typically used for 1D problems fails with increasing problem size. Alternatively Stochastic Trace Estimation can be used, giving a reasonable approximation. An alternative to searching for the MAP solution is to integrate using Marcov Chain Monte Carlo without the need to determine the determinant of the Hessian. This also allows to treat problems where a linear approximation is not justified.
1. Introduction
An Adaptive Kernel model formulated in 2D is introduced, with the application of analysing data from an infrared camera system in order to determine surface heat loads. A key ingredient to solve this problem efficiently is the use of automatic differentiation (AD). The fast availability of gradients increases the efficiency and reliability of the optimisation significantly. However, the combination of matrix operations and AD results in a poor scaling of the demanded memory for increasing system size. In extending the model from 1D to 2D, this is the mayor obstacle. Stochastic Trace Estimation as alternative way to deal with large matrices is investigated and together with the SVD compared against results obtained by Marcov Chain Monte Carlo.
The forward model is based on a non-linear heat diffusion solver and the measurement system in form of Planck’s Law. The classic version of the numerical tool THEODOR—a solver for the heat diffusion equation—used at ASDEX Upgrade and other machines solves the heat diffusion equation in two dimensions—1D surface and into the depth, further more referred to as 1D. Numerical tools for the general 2D case—2D surface plus depth—exist, e.g. [1], but are only used for deterministic calculations. A former contribution [2] introduced a Bayesian approach with THEODOR as forward model, called Bayesian THEODOR (BayTH). Its capabilities were extended from 1D to 2D data. This includes the forward model based on THEODOR and the Aadaptive Kernel (AK) model. The latter is used to describe our quantity of interest, the heat flux impinging on the surface.
The shape and temporal evolution of the heat flux pattern of a magnetically confined plasma onto the first wall is of great interest for fusion research. Heat flux densities of several / poses a threat to the exposed material [3,4]. The heat flux distribution is a footprint of the transport in the plasma edge [5,6]. Understanding the transport in the plasma edge is important to predict the behaviour of larger devices, aiming for a future fusion power plant. No direct measurement of the heat flux in the plasma is available. A method with sufficient spatial and temporal resolution to analyse many effects is to measure the thermal response of the target material, where the plasma deposits thermal energy. The impinging heat raises the temperature of the material, which itself transports the heat via conduction into the bulk. From the measured temporal evolution of the surface temperature, the heat flux into the material is deduced.
2. Forward Model
2.1. Heat Diffusion
The forward model for the heat transport in the target material is based on the THEODOR code, as described in [7]. Figure 1 shows an example: a rectangular cross section through the material, the colour-coding represents the temperature distribution in the tile.
The heat transport in the divertor target is described by heat diffusion, with a non-linear diffusion coefficient with respect to the temperature.
Here and are the mass density and specific heat capacity of the material. The temperature T is furthermore substituted by the heat potential
leading to the semi-linear differential equation
With the diffusivity beeing related to the conductivity via
This system is solved using the finite difference implicit Euler scheme with operator splitting. The spatial derivative is split into three parts: two along the surface— and —and a part into the depth of the tile . This leads to three tridiagonal systems, which are solved successively using the Thomas Algorithm [8].
2.2. Measurement System—Infrared Thermography
The second part of the forward calculation connects the behaviour of the target with the measurement system. Infrared (IR) thermography is based on Planck’s Law, describing radiation emitted from surfaces with finite temperature. emitted from the surface of materials with finite temperature. Knowing material parameters like the emissivity allows to deduce the surface temperature from measuring the emitted photon flux and vice versa [2]. The modelled surface temperature translates into the photon rate emitted by the surface. For given integration times of the sensor, the photon rate observed through the aperture is translated into the counted photons. For systems where electronic noise can be neglected, the uncertainty of the signal is dominated by the photon statistics. The signal to compare to are counts, integers obtained by an analog-to-digital-converter, which are typically a fraction of the observed photons.
Figure 2 shows an image of the IR camera in ASDEX Upgrade (AUG) for the upper divertor during a discharge. The corners of the tile are clearly warmer than most of the exposed tile surface. This highlights the need of a 2D evaluation.
3. Heatflux Model: Adaptive Kernel
To describe the surface heat flux distribution a multi-resolution model is used. A detailed description for the 1D variant can be found in [2,9]. Another approach is introduced in [10], including an iterative method to reduce the number of kernels—respective pixon in the reference.
The noise level for our application is expected to vary in time and space, as the amount of emitted radiation depends on the temperature of the surface area, which can be strongly peaked. Instead of using a global regularisation term, the Aadaptive Kernel approach allows a self consistent determination of the best resolution.
For an inverse problem with measured data and linear model —for this application a discrete formulation of equation (3)—we want to deduce our quantity of interest from
Here is the noise or uncertainty of the measurement—e.g., zero mean normal distributed. For the forward modelling we describe our quantity of interest with Aadaptive Kernel. They are expressed in terms of another linear system
with a hidden image and a smoothing matrix depending on another set of parameters, the kernel widths . In total we find the model prediction for the likelihood
where can have an arbitrary resolution and the regularisation is part of the inference.
As kernel function the normal distribution is used, characterised by the distance to its centre x and its width . As upper limit for the kernel widths the system size or a physical reasonable limit may be used. For the lower limit the distance between the kernels is a good measure. For a normal distribution it is recommended to evaluate the error function for the contributions instead of a point wise evaluation of the exponential function. This ensures normalisation and a more smooth transition for small kernel widths, say :
For the 2D case the kernel function has to be generalised from an 1D to a 2D distribution. The simplest approach for any 1D distributions is to use the outer product of two independent distributions along the two axes. Figure 3 shows an example for two perpendicular, independent normal distributions located at different positions along their axis. This is justified for signals with a fast axis, which is aligned to one of the kernel axis. A more general treatment can be desirable and would include an angle between the elliptical kernel and the image or the kernel expressed via a covariance matrix with three independent entries.
For this work the outer product of two Gaussian kernels is used, which allows faster computation and normalisation than a rotated kernel system. Therefore, per kernel there are three parameters: amplitude , kernel widths and . In addition to these 3 parameters for kernel, there is a weight for the entropic prior for the hidden image [11].
The wider—hence smoother—the kernel, the smoother the resulting function. By using not a fixed width, but treating the width of every kernel as hyper parameter, the best resolution is found via model selection. This works implicitly, as Bayes Theorem acknowledges the increasing anti-correlation of neighbouring kernels for increasing kernel width.
This approach has been shown to work well for positive additive distributions (PADs) [9] like spectroscopy and depth profiles.
3.1. Model Selection and Effective Number of Degrees of Freedom (eDOF)
The degrees of freedom are an important quantity for model comparison, as additional DOFs typically improve the likelihood, while not necessarily gaining more information about the system. For the Aadaptive Kernel, the complexity is described by the transfer matrix, mapping the hidden image into the model space. In the simplest case is the unit matrix, corresponding to a 1 to 1 map from hidden image to model function f without smoothing. Note that this matrix is not in general square, e.g., for more or less kernels than cells in the model space for over- or under-sampling.
A more detailed explanation of the effective degrees of freedom can be found in [9]. Applying the evidence approximation to the probability distribution of the kernel widths b given the data , assuming the distributions is peaked around a set of optimal widths
leaves us with the marginal
Expanding its logarithm to second order around the best kernel weights leads to
with the hessian of . For a linear operator the result is
is expressed as
Here is a diagonal matrix containing the inverse of the—uncorrelated—data uncertainties . The term is the contribution from the entropic prior on . Expressing the determinant with the product of the eigenvalues of this matrix, the model weight enters the log probability via the sum of the logarithm of its eigenvalues:
A straight forward approximation for the logdet of is to evaluate the pseudo-determinants, formed from the singular values. For large systems and the use of an automatic differentiation library the SVD leads to before mentioned problems.
When using MCMC—or similar integration techniques—no explicit model selection is necessary. When a flat model is able to describe the data, neighbouring amplitudes become stronger anti-correlated for larger kernel widths, increasing the prior volume in the high-likelihood region. Hence, large kernel widths are favoured when compatible with the data. For ∼100 kernels an optimisation routine searching for the MAP solution is faster, in which case the weight for the anti-correlated amplitudes for a set of kernel widths has to be taken into account.
4. Exploring the Parameter Space
For optimisation the routine e04wdc from NAG [12] is used, facilitating gradient information for the cost function. The C++ code uses the adept [13] library to efficiently determine the gradient vector of the posterior with respect to all input parameters.
4.1. Automatic Differentiation
Optimisation algorithms generally benefit from gradient information of the cost function. Straight forward is the use of finite difference FD, where usually one or two additional function calls are made with perturbed input parameters to estimate the gradient.
An alternative is given by automatic differentiation (AD), also known as algorithmic differentiation. An overview of libraries for various languages can be found on http://www.autodiff.org/. Here, the gradient is internally calculated via the exact differential based on algebraic equations in the algorithm.
When the functions involved map from a N dimensional space to a scalar—like the posterior—a single backward propagation—called inverse-mode differentiation—is enough to obtain the full Jacobian vector. This takes about 3–10 times the computation time compared to a simple function call. This becomes beneficial for functions depending on several—say more than 5—parameters with the additional benefit of more precise differentials. Also, no finite step width like for FD has to be chosen to find an optimum between numerical cutoff and approximation of the slope.
A drawback is the increased memory consumption, as most libraries create what is called a tape to store the path from input variables to cost function. This allows to calculate the contribution of each expression to the overall gradient as well as to use conditionals. As the problem size increases, the matrices and number of operations increase, affecting the size of the tape.
Using stochastic algorithms instead of the SVD to obtain the logdet—described in more details in Section 5—scales less strong in computation time as well as in memory consumption with the problem size, which allows to use the AD implementation for larger problems.
4.2. Computation Time
For the shown example with 1200 parameters the number of function calls from a standard parameter distribution—constant values for hidden image and kernel widths, initial likelihood about for 400 data points—is on the order of some thousand. On the shown example, the bottle neck is the evaluation of the log determinant, independent of the method used—with some seconds for the full evaluation. The solving time is therefore on the order of 5 to 60 per frame. For similar consecutive frames, where the last parameter set is a good starting point for the optimisation, this can drop to about 1 min.
An alternative is to use Marcov Chain Monte Carlo MCMC to explore the parameter space. This circumvents the calculation of the logdet all together. The run-time of the forward model for a reasonable system size is on the order of 1 —without the need to compute the kernel matrix explicitly and taking the system response into account. However, for kernels we already have to deal with 1200 parameter. Using 1000 sweeps—each representing a sequential scan through the parameters—and 10 bins leads to about function evaluations. Assuming a run-time of per call, this sums up to 116 days of computation. For the shown example, the forward model evaluation took about , which corresponds to about 7 .
On this scale, minimisation seems to be the only feasible way, although the logdet determination becomes cumbersome. Alternatively Hamiltonian Monte Carlo can make use of the gradient information, which speeds up the process significantly. However, the comparison presented is based on results from classic MCMC.
5. Comparison of SVD, STE and MCMC in Regard to Model Selection
In this section, the model selection described in Section 3.1 is discussed for large problems. Large in this sense means parameter, which is expected for our 2D Data.
Figure 4a shows the reference heat flux density for the further comparison with pixels, on which a dense set of kernels—one for every pixel—will be applied. Starting with a tile at equilibrium at 80 , the resulting synthetic data after 50 is shown in Figure 4b.
5.1. MCMC
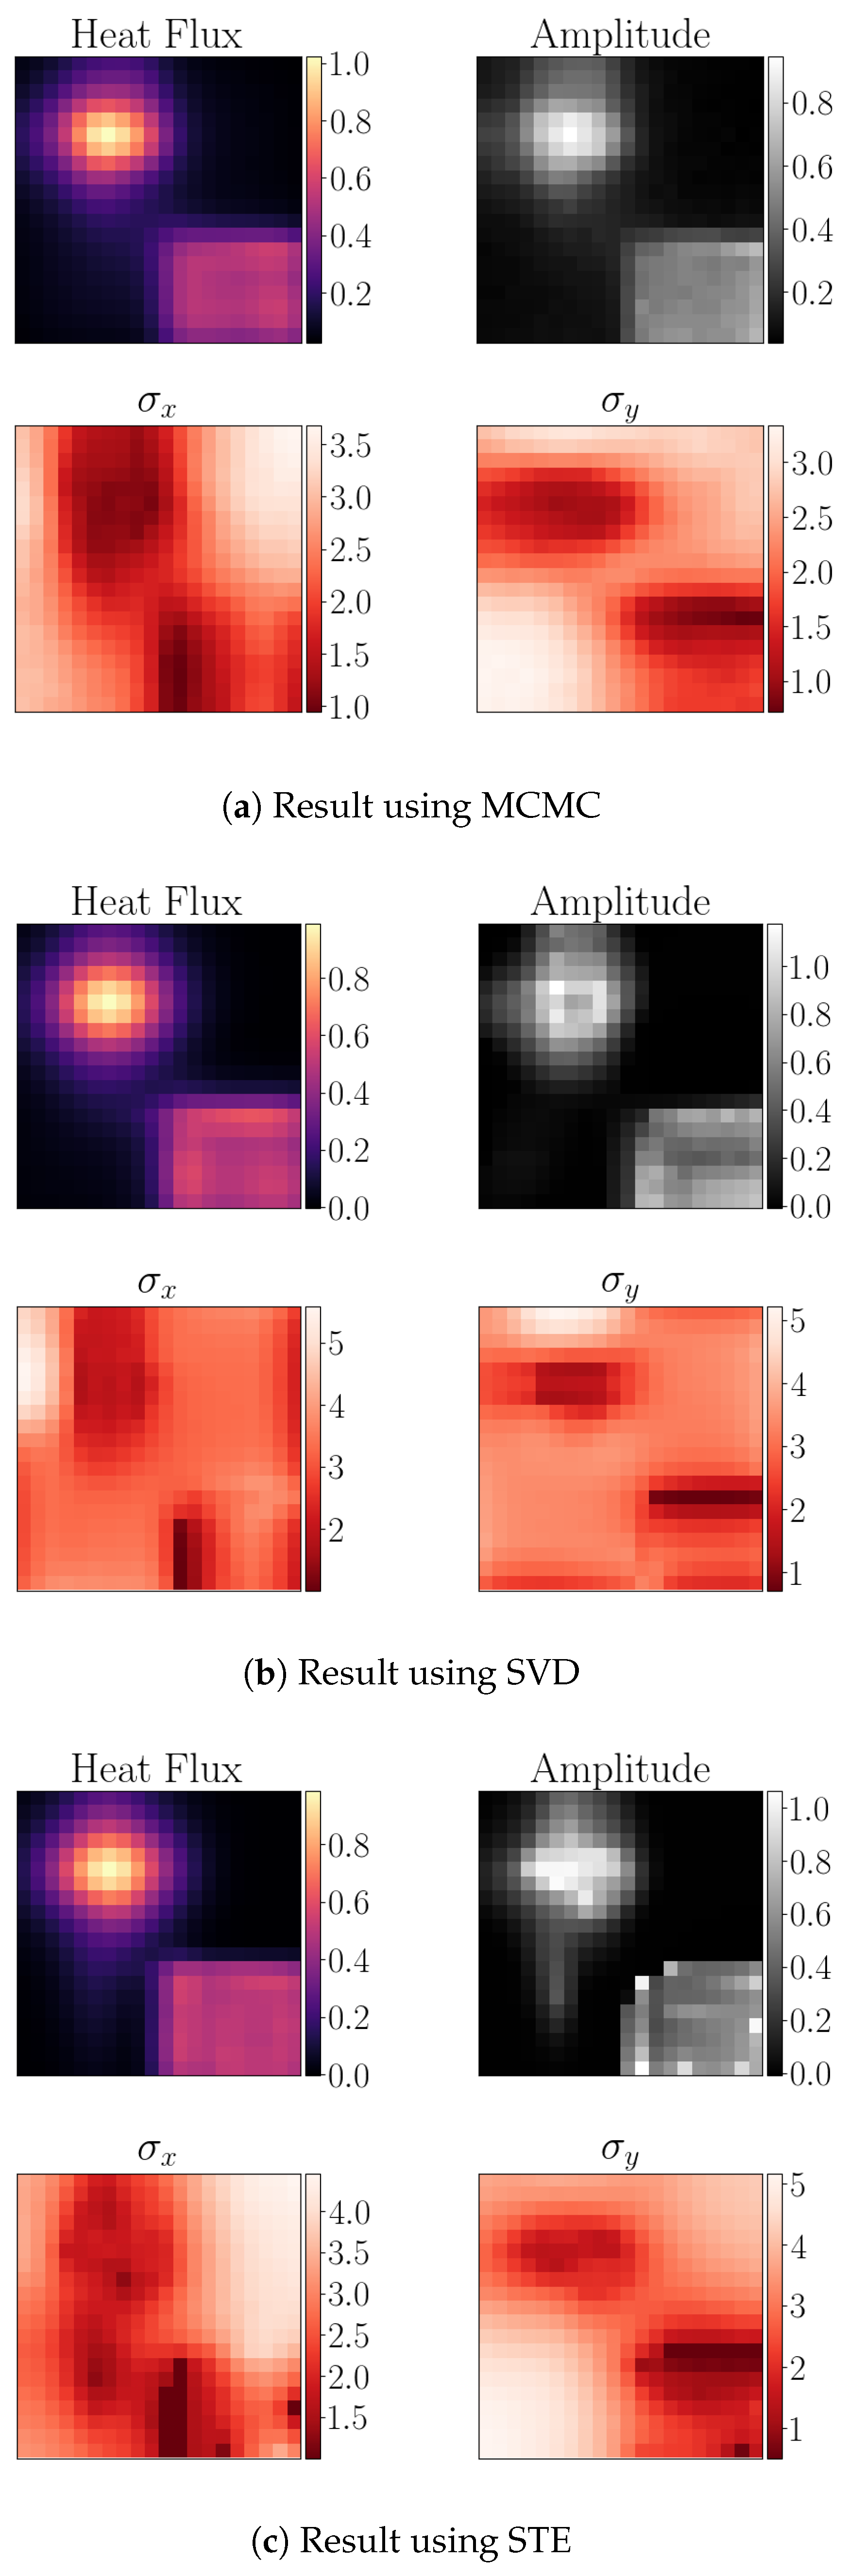
Classic Metropolis Hastings Monte Carlo serves as reference for the distributions of the amplitudes and kernel widths. For 1200 parameters the integration is still feasible, see Section 4.2. Figure 5a shows the reconstructed heat flux pattern—top left—the spatial amplitude distribution—top right—and in the bottom the distributions for the kernel width along the horizontal axis— and the vertical axis . At the edges of the step function the Aadaptive Kernel width represent the sharp transition.
5.2. SVD
Instead of determining the eigenvalues of Equation (14), the singular values composition is used, which is available as robust algorithm. Run time scales typically with O, which is feasible for small systems of around 100 kernels—resulting in a matrix—with calculation times on the millisecond scale. For the shown test system with kernels, the SVD for the matrix takes about 100 . The distribution of the kernel width is sharper at the edges of the step in the bottom right than for the MC result. As the kernel width acts as regularisation and the resulting heat flux pattern is virtually identical, the logdet evaluation is justified. Especially given the speedup from about 10 hours to about 10 min per frame.
Total memory including adjoints: B and time per function call including gradient evaluation is 1600 –2000 . Without the gradient information, the values are 70 B and 100 .
By increasing the image resolution by a factor of 2—leading to pixels and kernels—the computation time without gradients increases to 13 and the overall memory demand is 730 B. With gradients, the memory demand exceeds 120 B, which is the upper limit on the used computer system.
5.3. Stochastic Trace Estimation—STE
For larger matrices, the SVD becomes too expensive in terms of time and memory consumption. An alternative is to sample the matrix with test-vectors, in order to estimate the result of a function—like the logarithm—applied the eigenvalues of the matrix. This is known as Stochastic Trace Estimation STE. This is based on moments gained by matrix-vector multiplications, see e.g., [14,15]. The resulting distributions are shown in Figure 5c, which come close to the results of the SVD. The downside is, that the number of test-vectors and the order of the expansion has to be set a-priori for the optimisation procedure. For the shown example the expansion order is 10 and 50 test-vectors have been used.
Using adjoints the total memory demand is B and time per function call is 2000 . Without the gradient information, the values are 70 B and 100 . The computation time and memory demand scale linear with both, the number of test-vectors and expansion order.
Even for larger matrices, the memory demand and computation time can be controlled by the order of expansion and test vectors used. Used on a case with pixels and kernels—overall 4801 parameters—the time raises to 10 s and the memory to 730 B without gradients. Including gradients, the computation time increases to 20 for 10 vectors and expansion order 10, the memory demand is about 200 B per test vector and expansion order. Intermittent evaluation of the gradients is possible to free the memory, as the results are independent. For 20 vectors and 10 orders, the memory demand is just above 100 B.
5.3.1. Remark 1
For large matrices, the matrix matrix product turns out to be memory consuming in the adjoint formulation. More memory-efficient implementations become necessary for increasing matrix sizes beyond —here about 20 B are reserved for the matrix multiplication.
In addition to the SVD and STE, a conjugate gradient method was tested as well. However, due to the iterative nature the determination of the gradients mostly fails. In addition, although the precision of the result can be controlled, jumps in the logdet for slight changes to the kernel matrix prohibit the use in an optimisation routine. This limits the alternatives to the SVD for large matrices—to the authors knowledge—to the STE approach.
5.3.2. Remark 2
For the IR system it seems natural to place a kernel for every pixel. This however is probably not needed for most cases, especially when the profile has some known decay lengths. An example is the heat flux which may vary fast—on a few pixels basis—along the poloidal orientation, but slow along the toroidal orientation. For application to large data sets the number of kernels needed should be investigated beforehand to reduce the problem size.
6. Conclusions
A 2D formulation of the Adaptive Kernel model is introduced, including the means of using it in combination with an optimisation routine respecting the model selection via logdet. As the use of the SVD is limited in regard of the system size, the Stochastic Trace Estimation is suggested as alternative and shows comparable results.
Treating 2D distributions with the Aadaptive Kernel model is viable with modern techniques and computation power. While long time series of time dependent data stay challenging to analyse, single images or short sequences can be treated with this probabilistic framework. Key-ingredient in this presentation is gradient information, to navigate efficiently in high-dimensional spaces.
Integration with Monte Carlo Methods is generally possible, with the benefit not to have to calculate the determinant. However, for many parameters and a non-trivial forward model—with respect to the computation time—this analysis can be infeasibly slow. For smaller test cases it is the method of choice, to check the results of the logdet evaluation, which includes some approximations.
Author Contributions
“Conceptualization, D.N. and U.vT.; Methodology, D.N. and U.vT.; Software, D.N.; Validation, D.N.; Formal Analysis, D.N., U.vT.; Investigation, D.N.; Resources, D.N. and U.vT.; Data Curation, D.N.; Writing – Original Draft Preparation, D.N.; Writing – Review & Editing, D.N.; Visualization, D.N.; Supervision, D.N. and U.vT.; Project Administration, D.N.; Funding Acquisition, U.vT.”
Funding
This work has been carried out within the framework of the EUROfusion Consortium and has received funding from the Euratom research and training programme 2014–2018 under grant agreement No. 633053. The views and opinions expressed herein do not necessarily reflect those of the European Commission.
Conflicts of Interest
The authors declare no conflict of interest.
Abbreviations
The following abbreviations are used in this manuscript:
| AD | Automatic Differentiation |
| AK | Adaptive Kernel |
| AUG | ASDEX Upgrade |
| MCMC | Marcov Chain Monte Carlo |
| STE | Stochastic Trace Estimation |
| SVD | Singular Value Decomposition |
References
- Kang, C.S.; Lee, H.H.; Oh, S.; Lee, S.G.; Wi, H.M.; Kim, Y.S.; Kim, H.S. Study on the heat flux reconstruction with the infrared thermography for the divertor target plates in the KSTAR tokamak. Rev. Sci. Instrum. 2016, 87, 083508. [Google Scholar] [CrossRef] [PubMed]
- Nille, D.; von Toussaint, U.; Sieglin, B.; Faitsch, M. Probabilistic Inference of Surface Heat Flux Densities from Infrared Thermography. In Bayesian Inference and Maximum Entropy Methods in Science and Engineering; Polpo, A., Stern, J., Louzada, F., Izbicki, R., Takada, H., Eds.; Springer: Cham, Switzerland, 2018; pp. 55–64. [Google Scholar] [CrossRef]
- Bazylev, B.; Janeschitz, G.; Landman, I.; Pestchanyi, S.; Loarte, A.; Federici, G.; Merola, M.; Linke, J.; Zhitlukhin, A.; Podkovyrov, V.; et al. ITER transient consequences for material damage: Modelling versus experiments. Phys. Scr. 2007, 2007, 229. [Google Scholar] [CrossRef]
- Li, M.; You, J.H. Interpretation of the deep cracking phenomenon of tungsten monoblock targets observed in high-heat-flux fatigue tests at 20 MW/m2. Fusion Eng. Des. 2015, 101, 1–8. [Google Scholar] [CrossRef]
- Goldston, R. Heuristic drift-based model of the power scrape-off width in low-gas-puff H-mode tokamaks. Nucl. Fusion 2012, 52, 013009. [Google Scholar] [CrossRef]
- Stangeby, P.; Chankin, A. Simple models for the radial and poloidal E × B drifts in the scrape-off layer of a divertor tokamak: Effects on in/out asymmetries. Nucl. Fusion 1996, 36, 839. [Google Scholar] [CrossRef]
- Herrmann, A.; Junker, W.; Günther, K.; Bosch, S.; Kaufmann, M.; Neuhauser, J.; Pautasso, G.; Richter, T. Energy flux to the ASDEX-Upgrade diverter plates determined by thermography and calorimetry. PPCF 1995, 37, 17. [Google Scholar] [CrossRef]
- Press, W.; Teukolsky, S.A.; Vetterling, W.T.; Flannery, B.P. Numerical Recipes, 3rd ed.; Cambridge University Press: Cambridge, UK, 2007. [Google Scholar]
- Fischer, R.; Mayer, M.; von der Linden, W.; Dose, V. Enhancement of the energy resolution in ion-beam experiments with the maximum-entropy method. Phys. Rev. 1997, 55, 6667–6673. [Google Scholar] [CrossRef]
- Puetter, R.C. Pixon-based multiresolution image reconstruction and the quantification of picture information content. Int. J. Imaging Syst. Technol. 1999, 6, 314–331. [Google Scholar] [CrossRef]
- Skilling, J. Classic Maximum Entropy. In Maximum Entropy and Bayesian Methods: Cambridge, England, 1988; Springer: Dordrecht, The Netherlands, 1989; pp. 45–52. [Google Scholar] [CrossRef]
- The NAG C Library, The Numerical Algorithms Group (NAG), Oxford, United Kingdom. Available online: www.nag.com (accessed on 15 July 2016).
- Hogan, R. Fast Reverse-Mode Automatic Differentiation Using Expression Templates in C++. ACM Trans. Math. Softw. 2014, 40, 26:1–26:24. [Google Scholar] [CrossRef]
- Skilling, J. The Eigenvalues of Mega-dimensional Matrices. In Maximum Entropy and Bayesian Methods: Cambridge, England, 1988; Springer: Dordrecht, The Netherlands, 1989; pp. 455–466. [Google Scholar] [CrossRef]
- Fitzsimons, J.K.; Granziol, D.; Cutajar, K.; Osborne, M.A.; Filippone, M.; Roberts, S.J. Entropic Trace Estimates for Log Determinants. CoRR 2017, abs/1704.07223. [Google Scholar]
Figure 1.
Sketch of the cross section of the target material with the temperature encoded in the colour. From measured surface temperatures the spatially resolved heat flux density impinging onto the surface has to be deduced. The lateral boundary conditions allow no heat transport while the back side is in contact with a coolant.
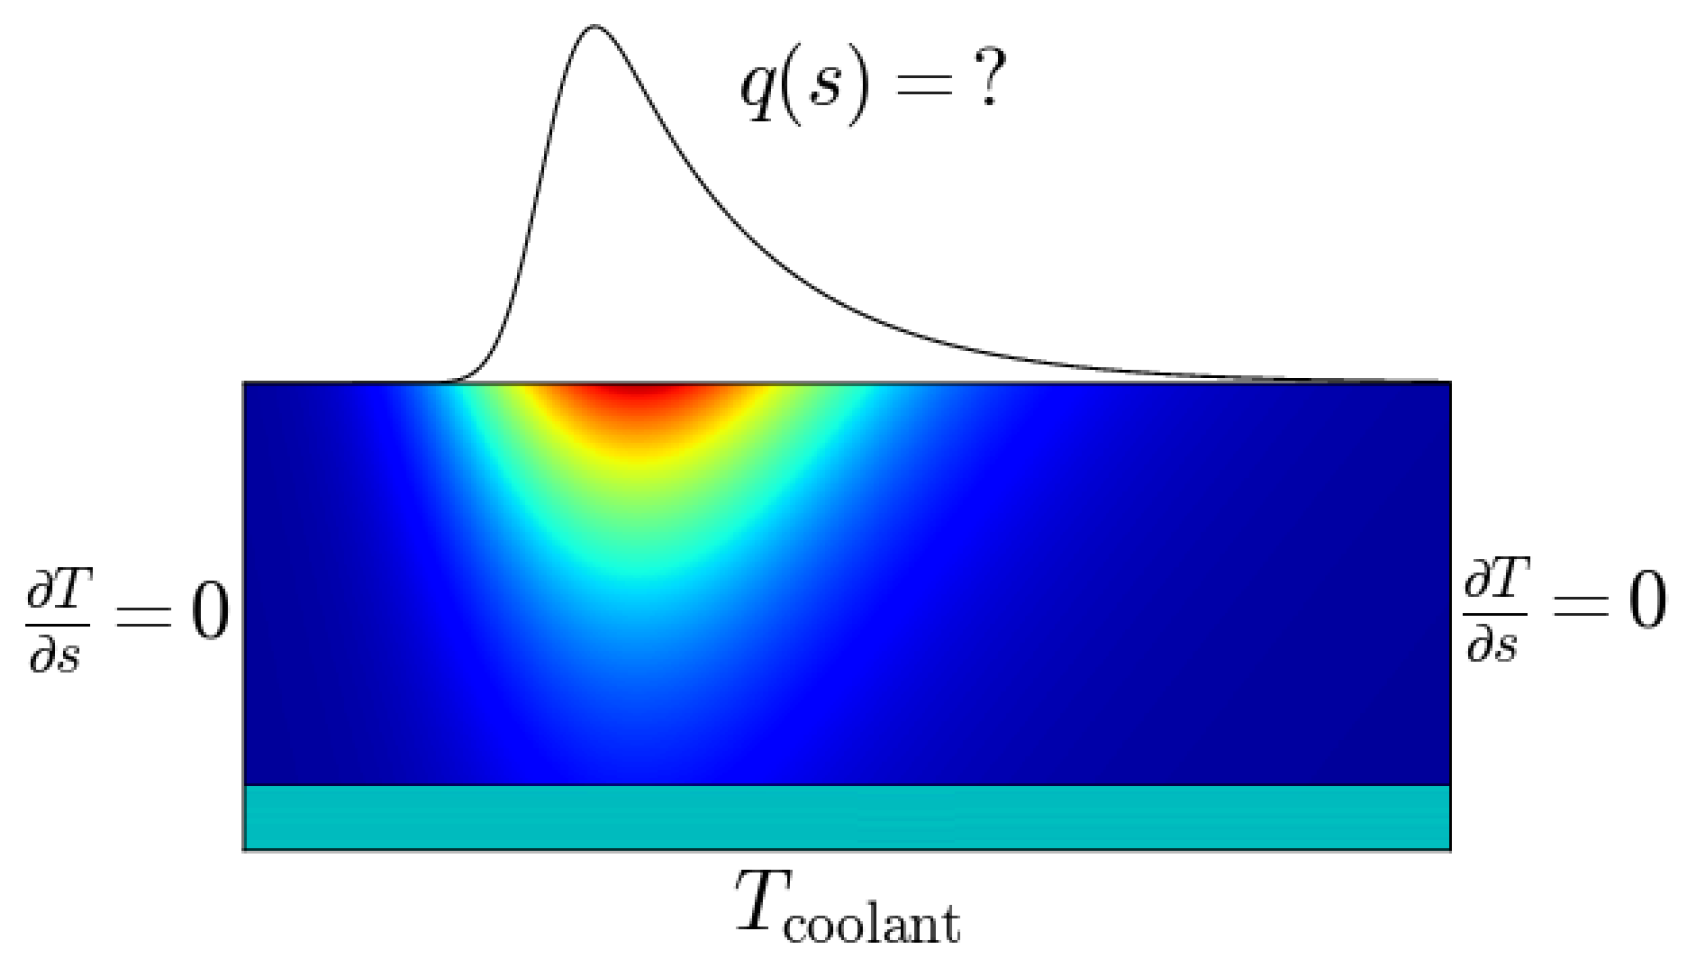
Figure 2.
IR camera image in AUG during discharge 34549 on the upper divertor. The signal at the edges differs from the bulk and even neighbouring tiles show different responses. The toroidal symmetry approximation breaks.
Figure 2.
IR camera image in AUG during discharge 34549 on the upper divertor. The signal at the edges differs from the bulk and even neighbouring tiles show different responses. The toroidal symmetry approximation breaks.
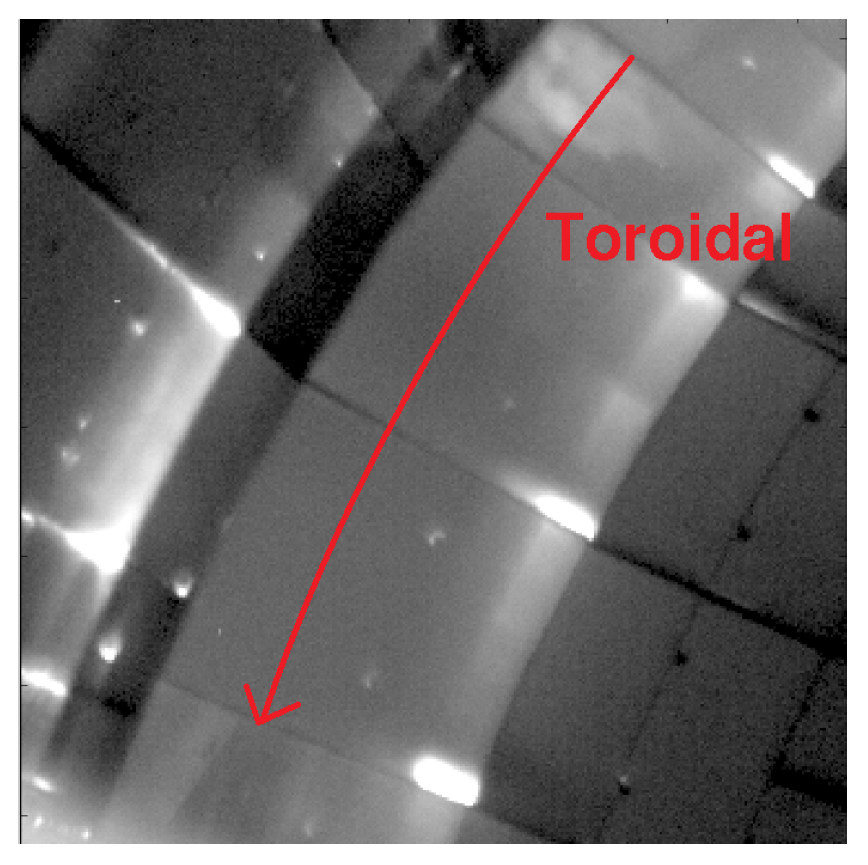
Figure 3.
Example for the 2D kernel function as outer product of two Gaussians.

Figure 4.
(a) Reference heat flux pattern. Peak: along x-axis a Cauchy distribution with width of 5 pixel, along y-axis a gaussian with width of 6 pixel. Peak set to 1 . Bottom right corner overwritten with a plateau of . (b) Resulting IR data—in counts—after 50 exposure to the heat flux pattern shown in (a).
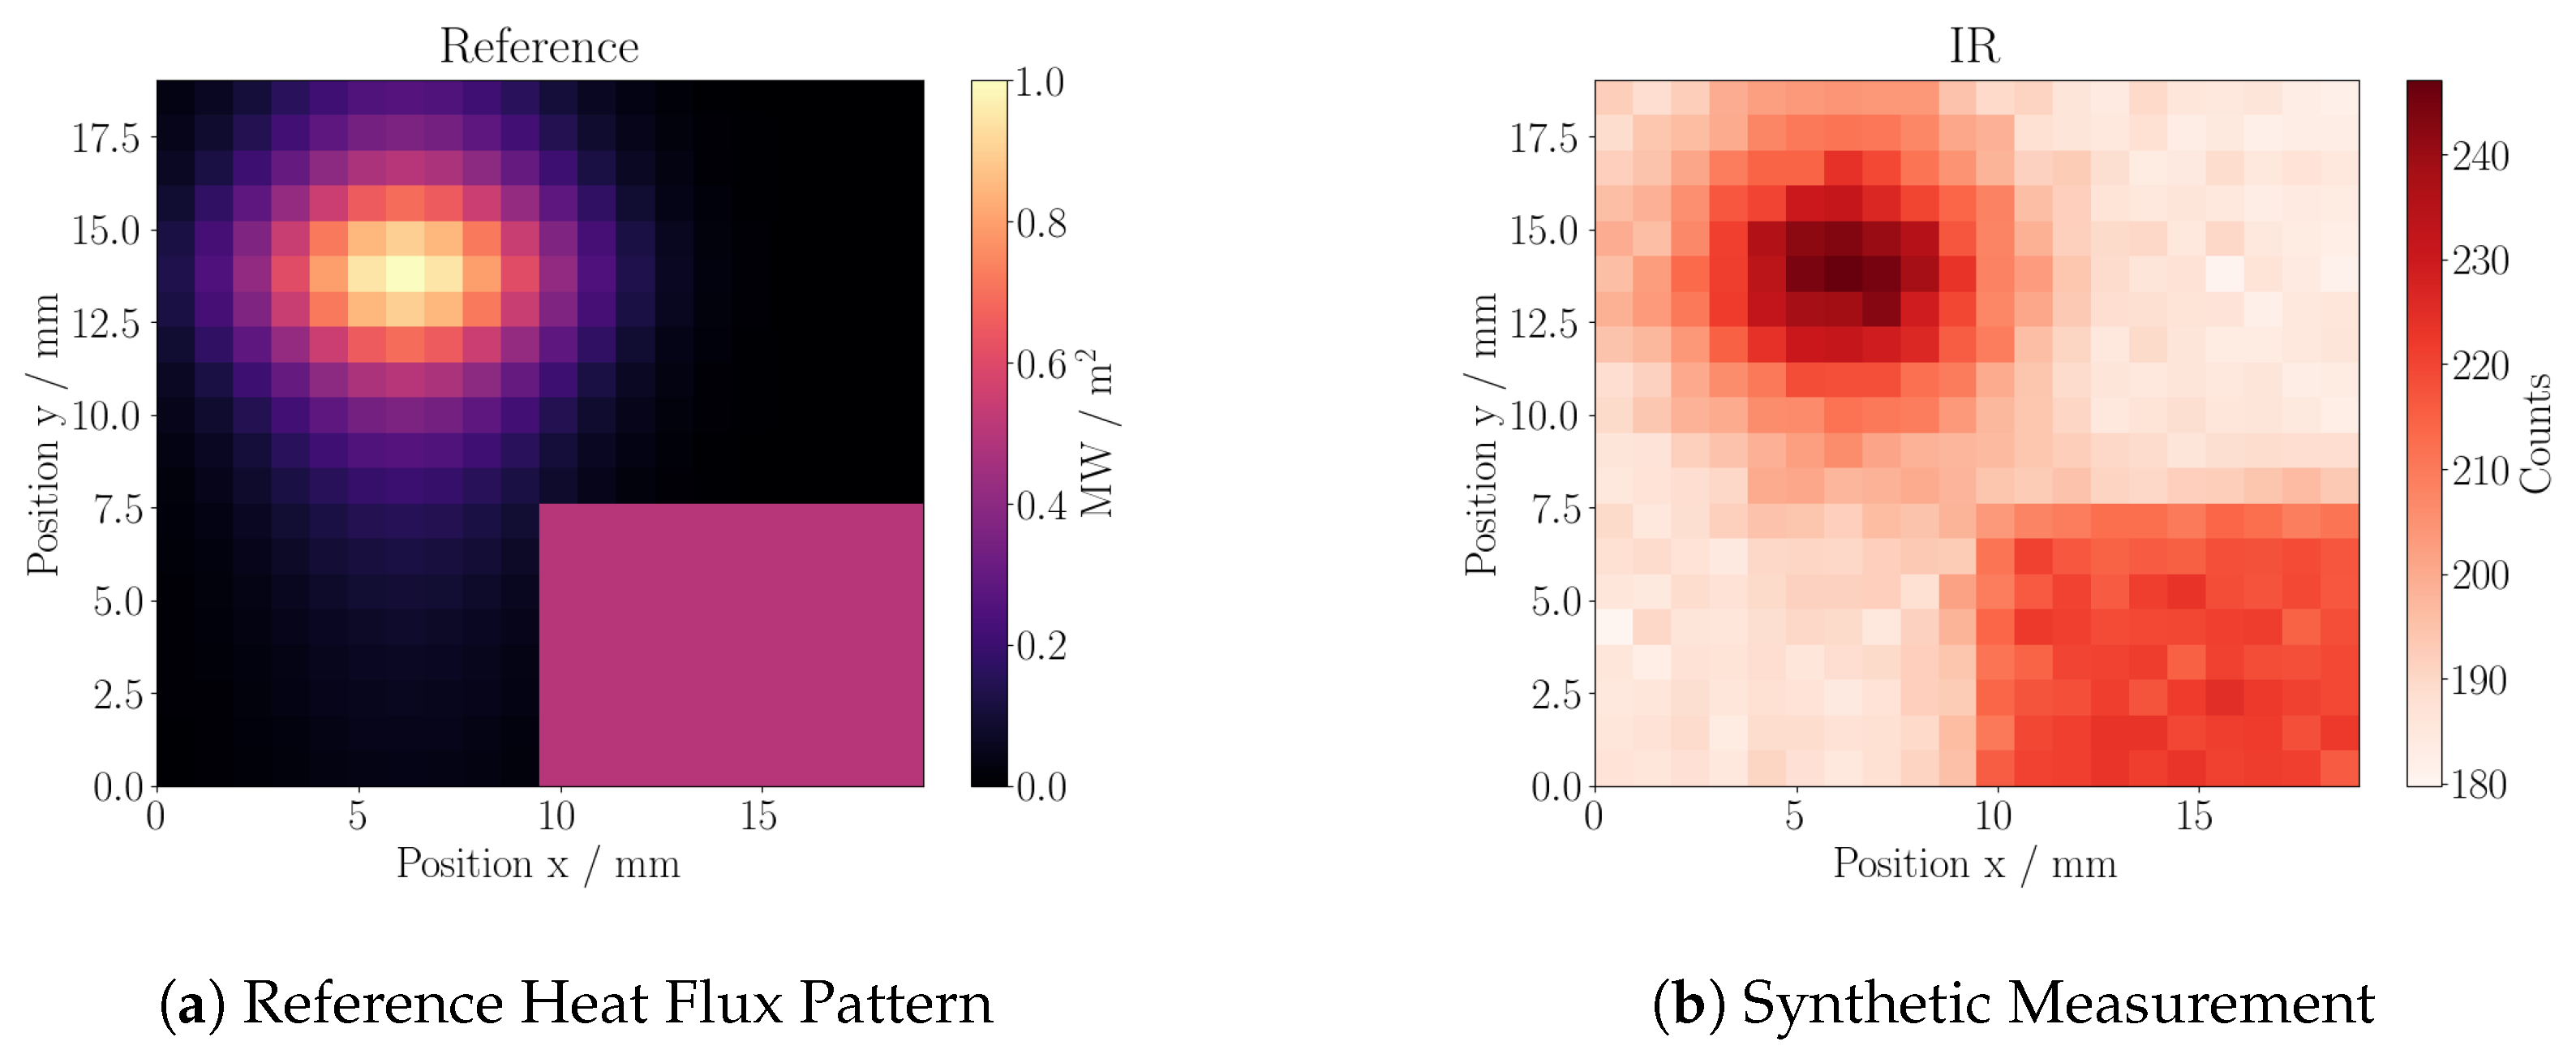
Figure 5.
Comparison between the three approaches. Structure of subplots: top left—Heat Flux Pattern. Top right—amplitudes of each kernel. Bottom left—kernel width along x-axis. Bottom right—kernel width along y-axis.
Figure 5.
Comparison between the three approaches. Structure of subplots: top left—Heat Flux Pattern. Top right—amplitudes of each kernel. Bottom left—kernel width along x-axis. Bottom right—kernel width along y-axis.
Publisher’s Note: MDPI stays neutral with regard to jurisdictional claims in published maps and institutional affiliations. |
© 2019 by the authors. Licensee MDPI, Basel, Switzerland. This article is an open access article distributed under the terms and conditions of the Creative Commons Attribution (CC BY) license (https://creativecommons.org/licenses/by/4.0/).
Share and Cite
MDPI and ACS Style
Nille, D.; Toussaint, U.v. 2D Deconvolution Using Adaptive Kernel. Proceedings 2019, 33, 6. https://doi.org/10.3390/proceedings2019033006
AMA Style
Nille D, Toussaint Uv. 2D Deconvolution Using Adaptive Kernel. Proceedings. 2019; 33(1):6. https://doi.org/10.3390/proceedings2019033006
Chicago/Turabian StyleNille, Dirk, and Udo von Toussaint. 2019. "2D Deconvolution Using Adaptive Kernel" Proceedings 33, no. 1: 6. https://doi.org/10.3390/proceedings2019033006