A New Approach to the Formant Measuring Problem †


Artificial Intelligence Laboratory, Vrije Universiteit Brussel, Pleinlaan 2, 1050 Brussels, Belgium
*
Authors to whom correspondence should be addressed.
†
Presented at the 39th International Workshop on Bayesian Inference and Maximum Entropy Methods in Science and Engineering, Garching, Germany, 30 June–5 July 2019.
Proceedings 2019, 33(1), 29; https://doi.org/10.3390/proceedings2019033029
Published: 25 December 2019
(This article belongs to the Proceedings of The 39th International Workshop on Bayesian Inference and Maximum Entropy Methods in Science and Engineering)
Abstract
:Formants are characteristic frequency components in human speech that are caused by resonances in the vocal tract during speech production. They are of primary concern in acoustic phonetics and speech recognition. Despite this, making accurate measurements of the formants, which we dub “the formant measurement problem” for convenience, is as yet not considered to be fully resolved. One particular shortcoming is the lack of error bars on the formant frequencies’ estimates. As a first step towards remedying this, we propose a new approach for the formant measuring problem in the particular case of steady-state vowels—a case which occurs quite abundantly in natural speech. The approach is to look at the formant measuring problem from the viewpoint of Bayesian spectrum analysis. We develop a pitch-synchronous linear model for steady-state vowels and apply it to the open-mid front unrounded vowel [ɛ] observed in a real speech utterance.
Keywords:
Bayesian inference; general linear model; steady-state; vowel; formant; acoustic phonetics1. Introduction
Formants are characteristic frequency components in human speech that are caused by resonances in the vocal tract (VT) during speech production and occur both in vowels and consonants. Fant (1960) [1] systematized the then relatively young science of acoustic phonetics with his acoustic theory of speech production, often called the source-filter model, which has since become the dominant paradigm. At that time, the source-filter model, which is formulated in the language of linear time-invariant system theory, justified the practice of deriving formants from power spectra as prominent local maxima in the power spectral envelope of appropriately windowed and processed speech signals. From this point of view each formant is characterized by three parameters describing the local maximum associated with it: the maximum’s center frequency (called the formant frequency), its bandwidth and its peak amplitude.
The concept of a formant is fundamental to phonetics and automated speech processing. For example, formants are considered to be primary features for distinguishing vowel classes, speech perception and for inferring speaker identity, sex and age. Despite this fundamental status—and despite a long history of work on vowel formants starting out with [2]—the issue of making accurate measurements of the formant parameters, which we dub “the formant measurement problem” for convenience, is as yet not considered to be fully resolved (e.g., [3,4,5]). Accordingly, a large amount of formant measurement methods exist in the literature, of which most rely on linear predictive (LPC) analysis. The fundamental cause underlying the formant measurement problem is that most of these methods yield formant frequency estimates (the main quantity of interest) that are sensitive to various user-made choices, such as the form and length of the tapering window form or the number of poles in LPC analysis (e.g., [6,7]). In other words, measuring formants currently requires rather careful fine-tuning while speech is notorious for its variability [8]. In addition, there currently seems to be no way to put error bars on the formant frequency, bandwidth and amplitude measurements.
In this paper an attempt is made to tackle the formant measuring problem for an important special case, i.e., steady-state vowels (SSVs). The usual definition of the SSV is the steady-state portion of a vowel, i.e., the time interval in which the VT configuration can be taken to be approximately fixed on the time scale of the pitch period, which is on the order of 5 ms. The fixed VT implies that the SSV is characterized by formants with unchanging frequency and bandwidth through time. In contrast, the SSV model in this paper allows the formant amplitudes and pitch periods to change over time, but this change is expected to be small due to the steady state. As such, SSVs can be recognized in natural speech as a semi-periodic string of typically about 3 to 5 pitch periods [9].
By modeling SSVs in the time domain with a pitch-synchronous linear model, it becomes possible to apply the machinery of Bayesian spectrum analysis [10,11] to the formant measuring problem. Our approach shows several promises:
- Ability to derive error bars on the formant frequencies, bandwidths and peak amplitudes.
- Elimination of windowing and averaging procedures. A typical method to measure formants in a SSV is to slide over the signal with a tapering window, estimate the formant frequency, bandwidth and peak amplitude in each window, and then to average these estimates over the windows [9]. In our approach, the pitch-synchronous nature of the model eliminates any windowing procedure (and thus various user-made choices) by making use of the pitch period as a natural time scale [12]. In addition, the formant frequencies and bandwidths are estimated simultaneously in each period, which can be understood as a generalized averaging operation over pitch periods ([11] Section 7.5).
- “Automatic” model order determination. This is done by inferring the most probable model order given the SSV (and the model). This can be contrasted with traditional LPC analysis, where the number of poles must be decided by the user on the basis of several well-established guidelines, but where the final judgment ultimately remains qualitative. However, in the current approach, the proposed model (including the prior pdfs) is still too simple to guarantee satisfactory model order determination in all cases.
Compared to standard LPC analysis, there are three main disadvantages of our approach:
- Limited applicability: we only model SSVs, though possible extensions are discussed in the conclusion of the paper.
- Though the inference algorithm described below is efficient and relatively fast compared to typical problems in numerical Bayesian inference, it is still much slower than LPC analysis. For example, all calculations for the SSV [ɛ] discussed below took about half a minute.
2. SSV Model
The model of a SSV proposed here is inspired by Ladefoged [15]’s picture of speech; that is, the pulses in the speech waveforms coincide with glottal closing instants (GCIs). The GCIs causing the pulses in the speech waveforms is illustrated by the electroglottograph (EGG)—see Figure 1.
2.1. Individual Pitch Periods
According to Ladefoged, in each pitch period of length T these pulses excite the VT such that the resulting speech waveform consists of a superposition of Q decaying resonances
This is a model of the formants in the time domain where Q is the number of formants (i.e., damped sinusoids), and are the amplitudes, and and are the frequency [rad Hz] and the decay constant [Hz] of formant j, respectively. Thus if we take , we model the first two formants of a pitch period which are denoted as F1 and F2. The frequency of F1 is and its decay constant is , and similarly for F2.
Ladefoged’s model has considerable merit [12,15], but it does not incorporate the effects of the glottal flow derivative (dGF) during the open phase of the pitch period. During this phase, the glottal flow weakly excites the VT which can be roughly approximated with a simple differentiation ([17] p. 3). For this reason, we consider the dGF instead of the glottal flow itself. In Figure 1 the baselines marked in blue roughly indicate the dGF trends, which are clearly not negligible in the open phase of the pitch period as they become the dominant effect in that phase. There are indications that this a general effect [12,17]. As the dGF can be taken to vary relatively slowly, we propose to model it by a polynomial of order . Thus the model function for one pitch period of length T is
where the are the numerically convenient Legendre polynomials and the are their amplitudes and .
With the above model for individual pitch periods we can use Bayesian spectrum analysis to obtain the posterior distribution of the , which are the parameters of interest as they describe the Q formants. Suppose the SSV consists of n predetermined pitch periods such that the SSV is defined by the string , i.e.,
is the waveform of the ith pitch period which consists of samples. Then we assume that
where , i.e., the pdf for the errors is white noise with constant power. An example of a fit of the model function in Equation (4) to one pitch period i is shown in Figure 2.
Since the model function is a linear combination of basis functions (which depend on ), this model is an instance of the well-known general linear model [18]. It is possible to marginalize over the amplitudes together with the noise level : assuming uniform priors, we arrive at the typical Student-t distribution (written in non-standard form) ([11] p. 35)
Here is the number of basis functions, and is the sufficient statistic for the problem, obtained in the standard way [19] from the projections of the data on the orthogonalized basis functions which are linear combinations of the basisfunctions appearing in Equation (2). The sufficient statistic can be seen as a generalization of the Schuster periodogram [10], to which it reduces in the case that and and the frequencies are well separated (i.e., for ).
2.2. Multiple Pitch Periods: SSV
We model an SSV as a string of independent pitch periods that share the same formants (see Figure 3); that is, the formant frequencies and decay constants , as well as the noise power are kept fixed across the pitch periods, as well as the order parameters P and Q.
The other parameters are again marginalized over, once again assuming uniform priors, and we arrive at the simplest generalization of Equation (5):
The assumption of independent pitch periods—while knowing that these are in fact perfectly correlated, being almost periodical—has an important effect on the error bars of the final estimates which is comparable to using uninformative priors; the effect is to make the error bars conservative, because the uncertainties in the amplitudes etc. transfer to the posterior marginal error bars on the frequencies and decay constants in . Any correlation put into the model can only decrease this uncertainty, and thus decrease the magnitude of the error bars [11]. Bretthorst has shown this explicitly for the case of correlated errors which in our story would apply to adjacent pitch periods [20]. Since the frequency estimates are already sharp (see the next section for an example) from the viewpoint of what one is used to in acoustic phonetics [3], this issue (i.e., overly conservative error bars for the frequency estimates) seems perfectly acceptable as it buys us very convenient analytical expressions for the posterior . However, the error bars on the decay rates and the amplitudes are quite broad, and improving the accuracy of their estimates is desirable in certain applications.
2.3. Estimation
We perform a Gaussian approximation at the maximum a posteriori point , which is found by optimizing Equation (6) with the Levenberg-Marquardt algorithm [21]. This approximation lets us estimate the posterior covariances (of which the diagonal gives the desired error bars) and lets us crudely estimate the posterior probability of the polynomial order and number of formants . “Crudely” because our priors are uninformative, so we can hardly expect model comparison as guided by to give satisfactory results (relative to all the things we know about the data—correlations, acceptable physical forms, etc.—but did not tell probability theory).
3. Application on a Steady-State Portion of [ɛ]
We apply the model to a steady-state portion of the vowel [ɛ] (the second ‘e’ in “etcetera”) consisting of pitch periods shown in Figure 4.
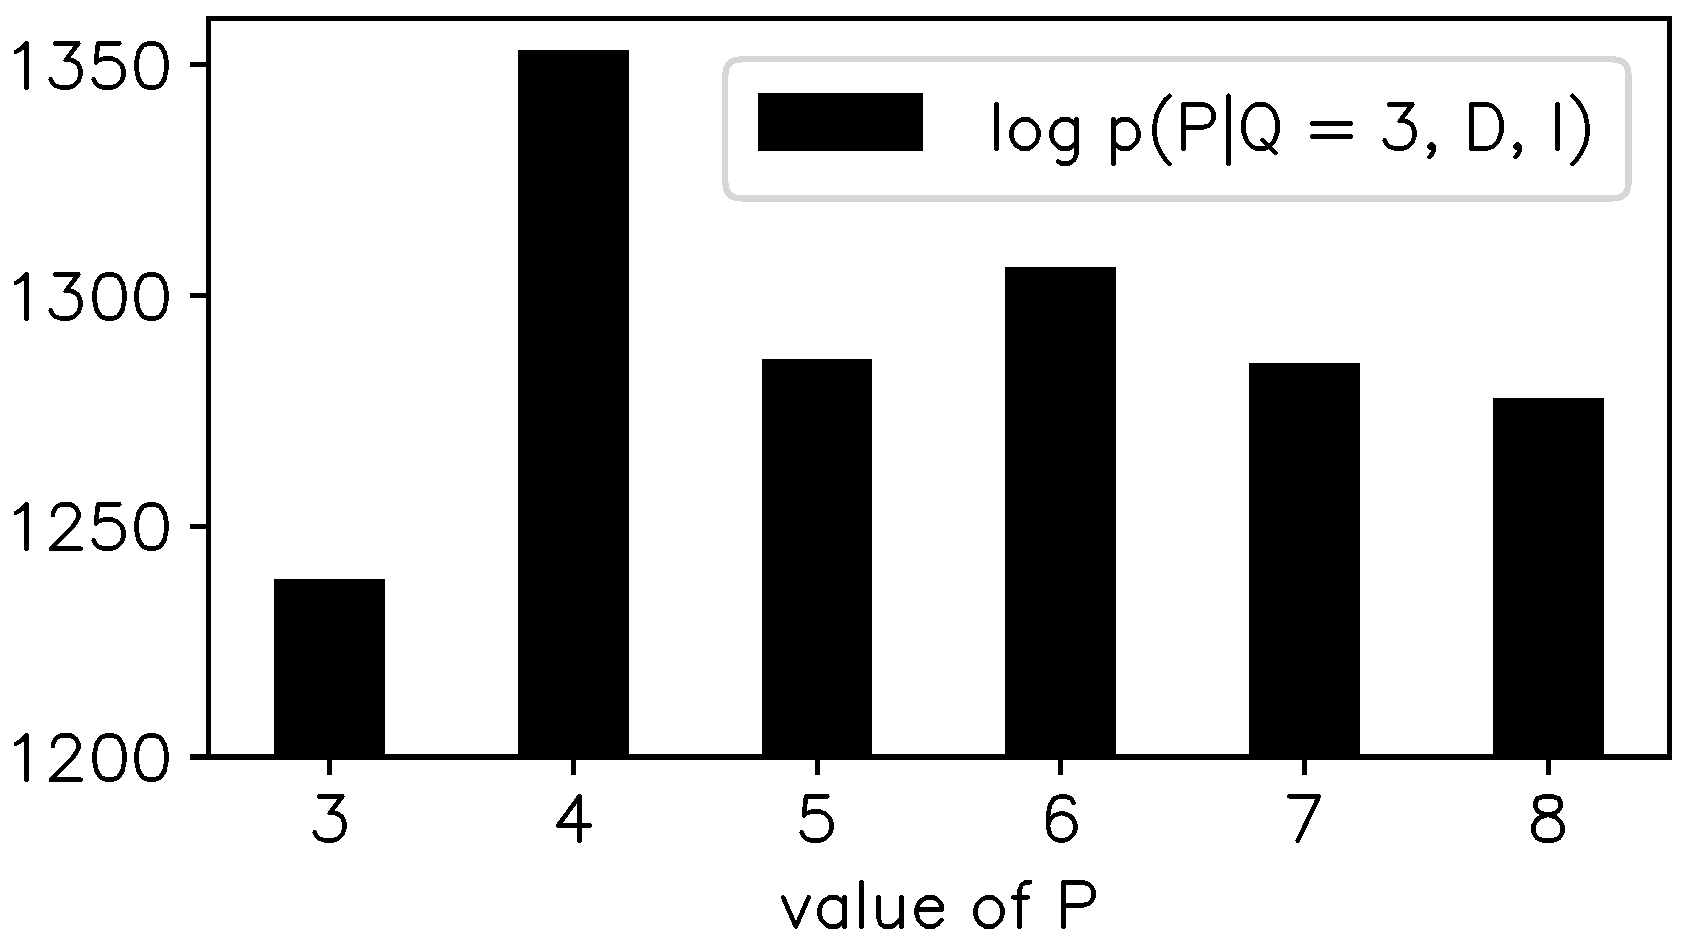
Before applying the model, the order parameters P and Q must be chosen. For simplicity we set , i.e., we are interested in the first three formants, which is a typical case. Figure 5 shows the posterior , where now the former parameters of interest have been integrated out using the Gaussian approximation. The preferred value of P is clearly . Unfortunately, the choice yields unphysical results as the inferred sinusoids are not damped but actually grow considerably during the pitch periods. The same goes for . These unphysical results can arise because we did not restrict in the parameter space. The choices do yield physical results, and the estimates for the formants depend only slightly on the actual value of P in this range (remember that is the order of the Legendre polynomial describing the slowly varying baseline).
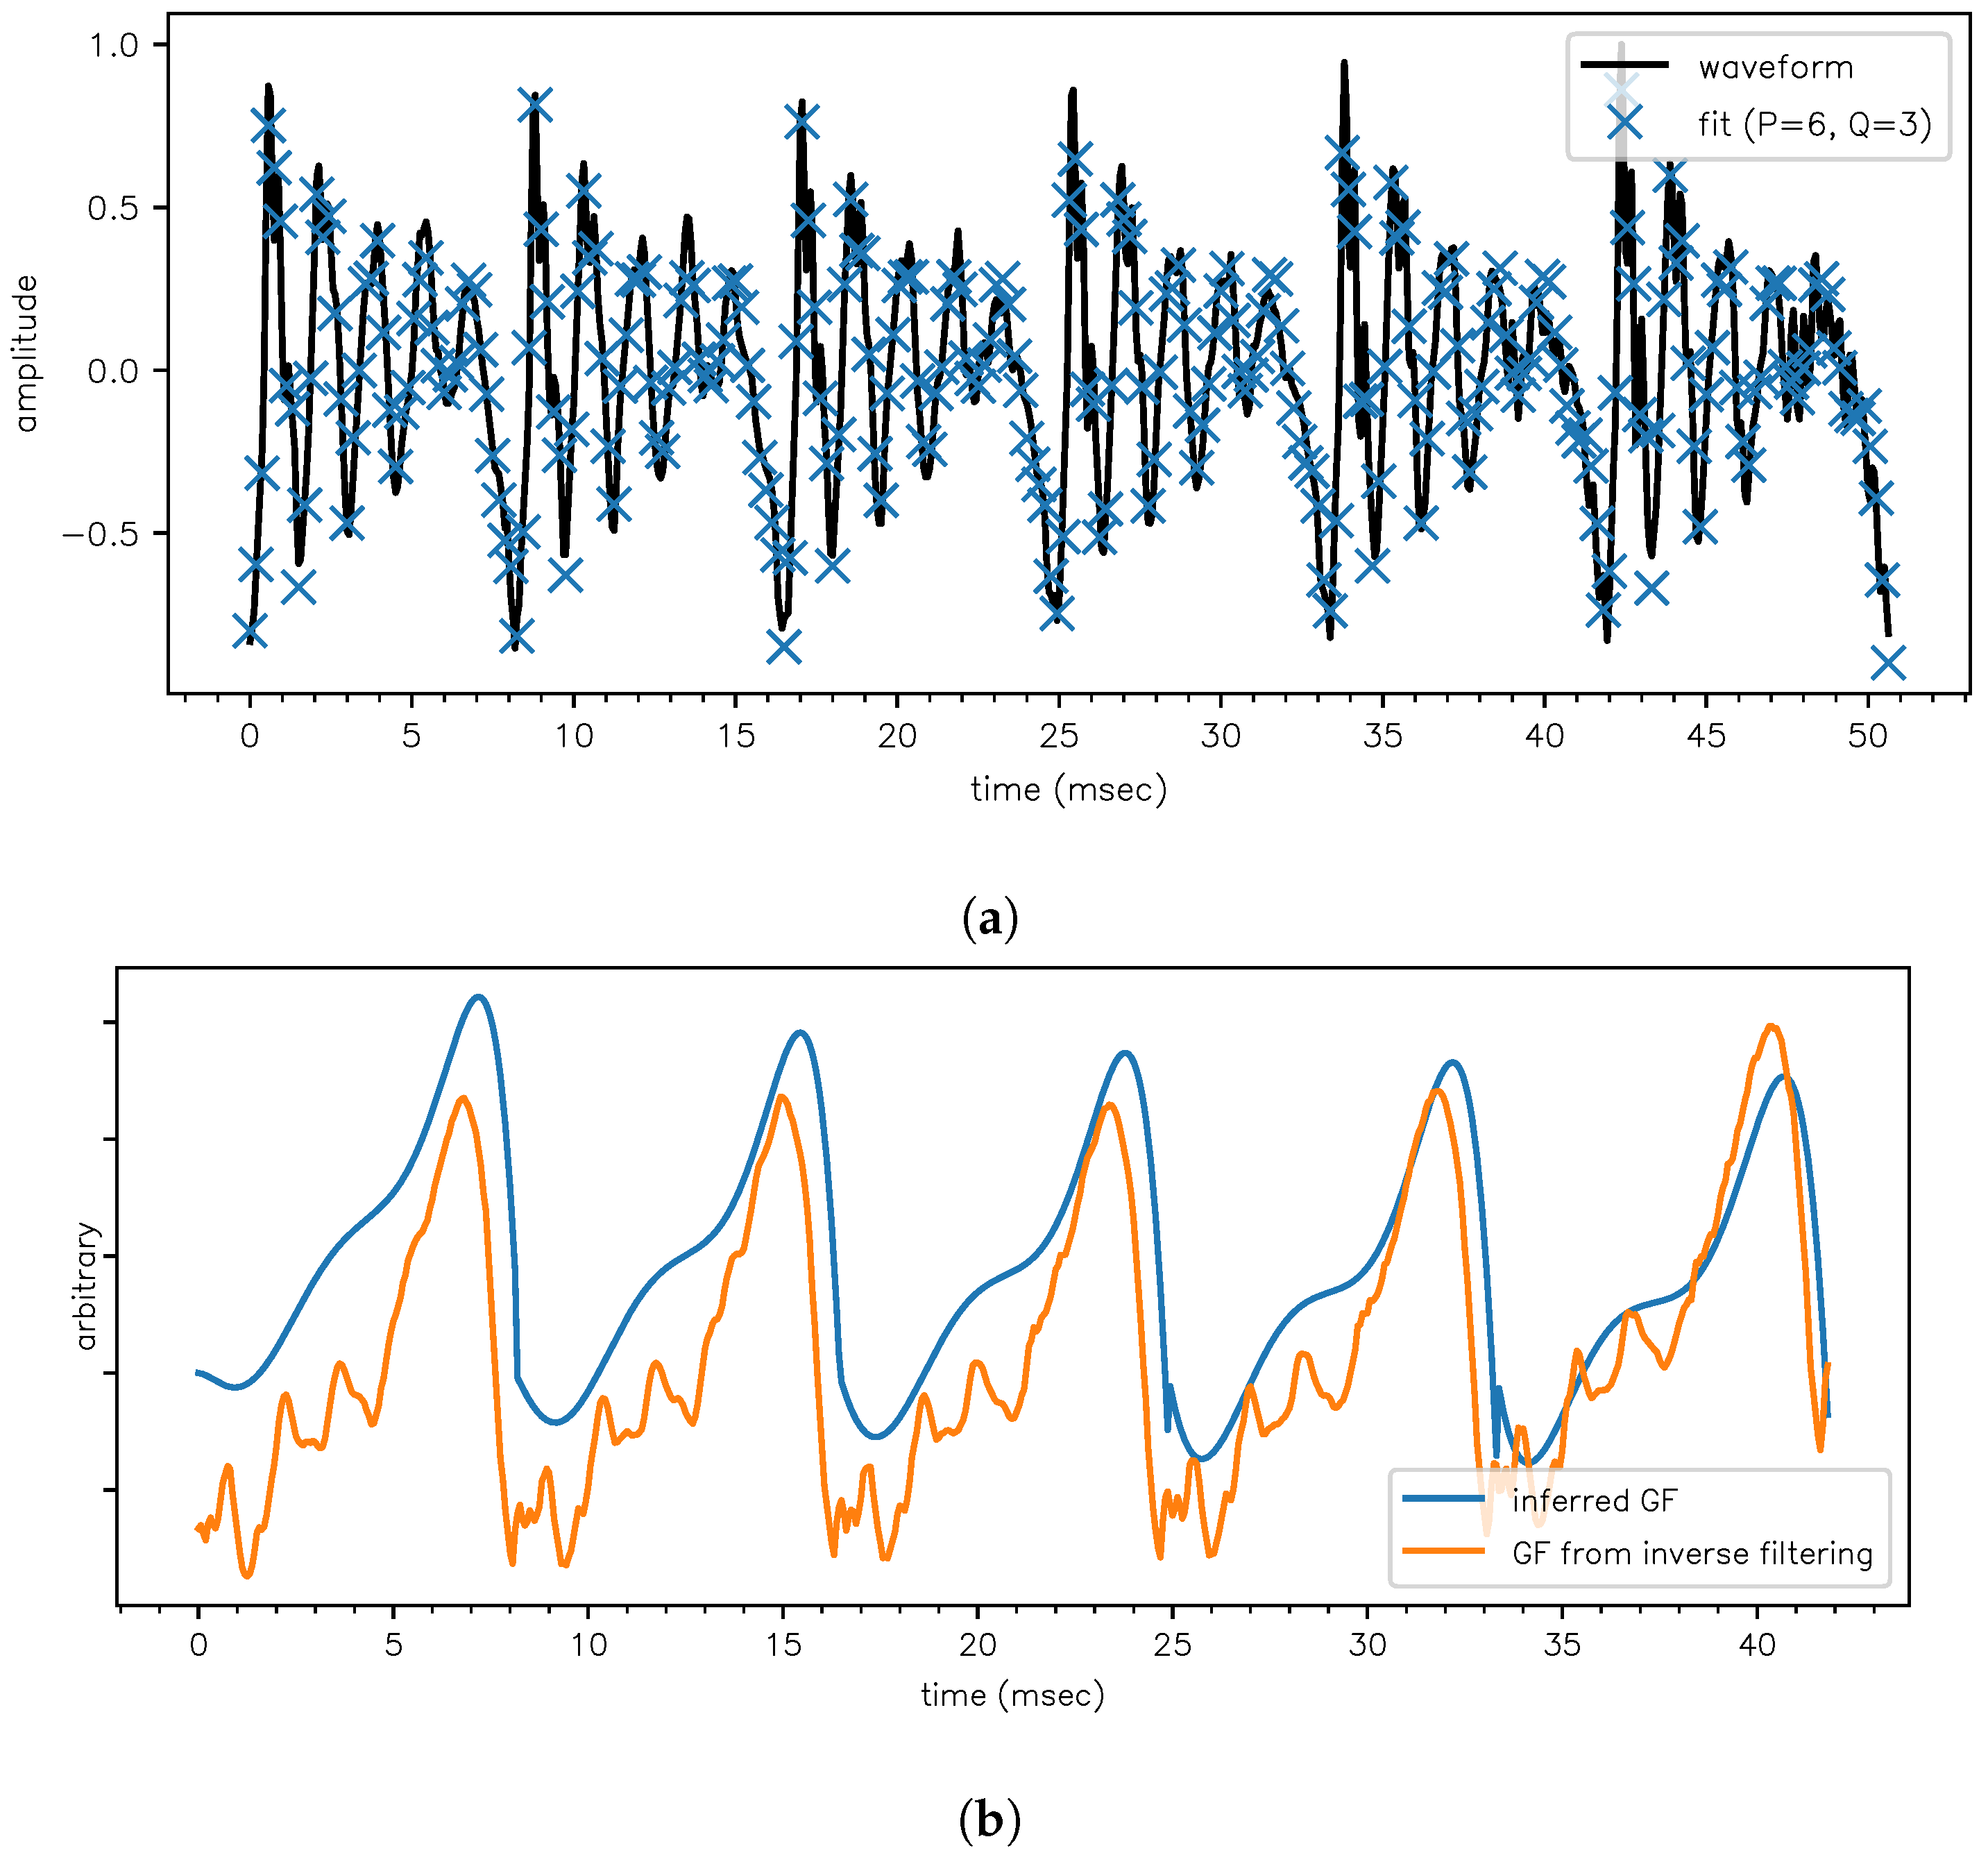
Finally, Figure 6 shows the results for . Despite the fact that we can estimate the formant frequencies, bandwidths and peak amplitudes, we only compare the formant frequencies to a standard LPC analysis. The reason is that the comparison of the bandwidths and peak amplitudes between our model and the LPC model is not well defined, as on the one hand the LPC bandwidths depend on the size of the LPC window used; and on the other hand the formant amplitudes are allowed to vary between pitch periods in our model. The actual formant frequency estimates are (at two standard deviations):
- (F1)est = 658 ± 2 Hz at −2.0 ± 0.1 dB/ms
- (F2)est = 1463 ± 10 Hz at −2.9 ± 0.5 dB/ms
- (F3)est = 2660 ± 10 Hz at −3.0 ± 0.7 dB/ms
The formant frequency estimates calculated with LPC on the entire steady-state portion is:
- (F1)LPC = 670 Hz
- (F2)LPC = 1491 Hz
- (F3)LPC = 2771 Hz
We calculated these with Praat [23], a popular tool in acoustic phonetics. The discrepancies might seem large (on the order of 50 Hz) but this is actually quite acceptable in acoustic phonetics. While much more work is needed to understand the discrepancy, the basic reason is quite clear: LPC analysis can be interpreted as an all-pole expansion of the spectrum of a (windowed) segment of speech to estimate the formants in that window. But Jaynes [10] and Bretthorst [11] showed clearly that the spectrum is only an optimal estimator for frequency content (more precisely: spectral lines) if six conditions are met ([11] p. 20), of which two are very clearly violated in the estimation of formant frequencies in SVVs. The two conditions state that the data must not contain a constant component and that there is no evidence of a low frequency. But these conditions do not hold because of the slowly varying dGF components, perhaps to the point that the spectrum is not just a suboptimal estimator, but a potentially misleading one. This misleading nature (i.e., local maxima in spectra do not designate actual harmonic content) has been shown for economical data [24], where data often need to be “detrended”, which is exactly what we do here.
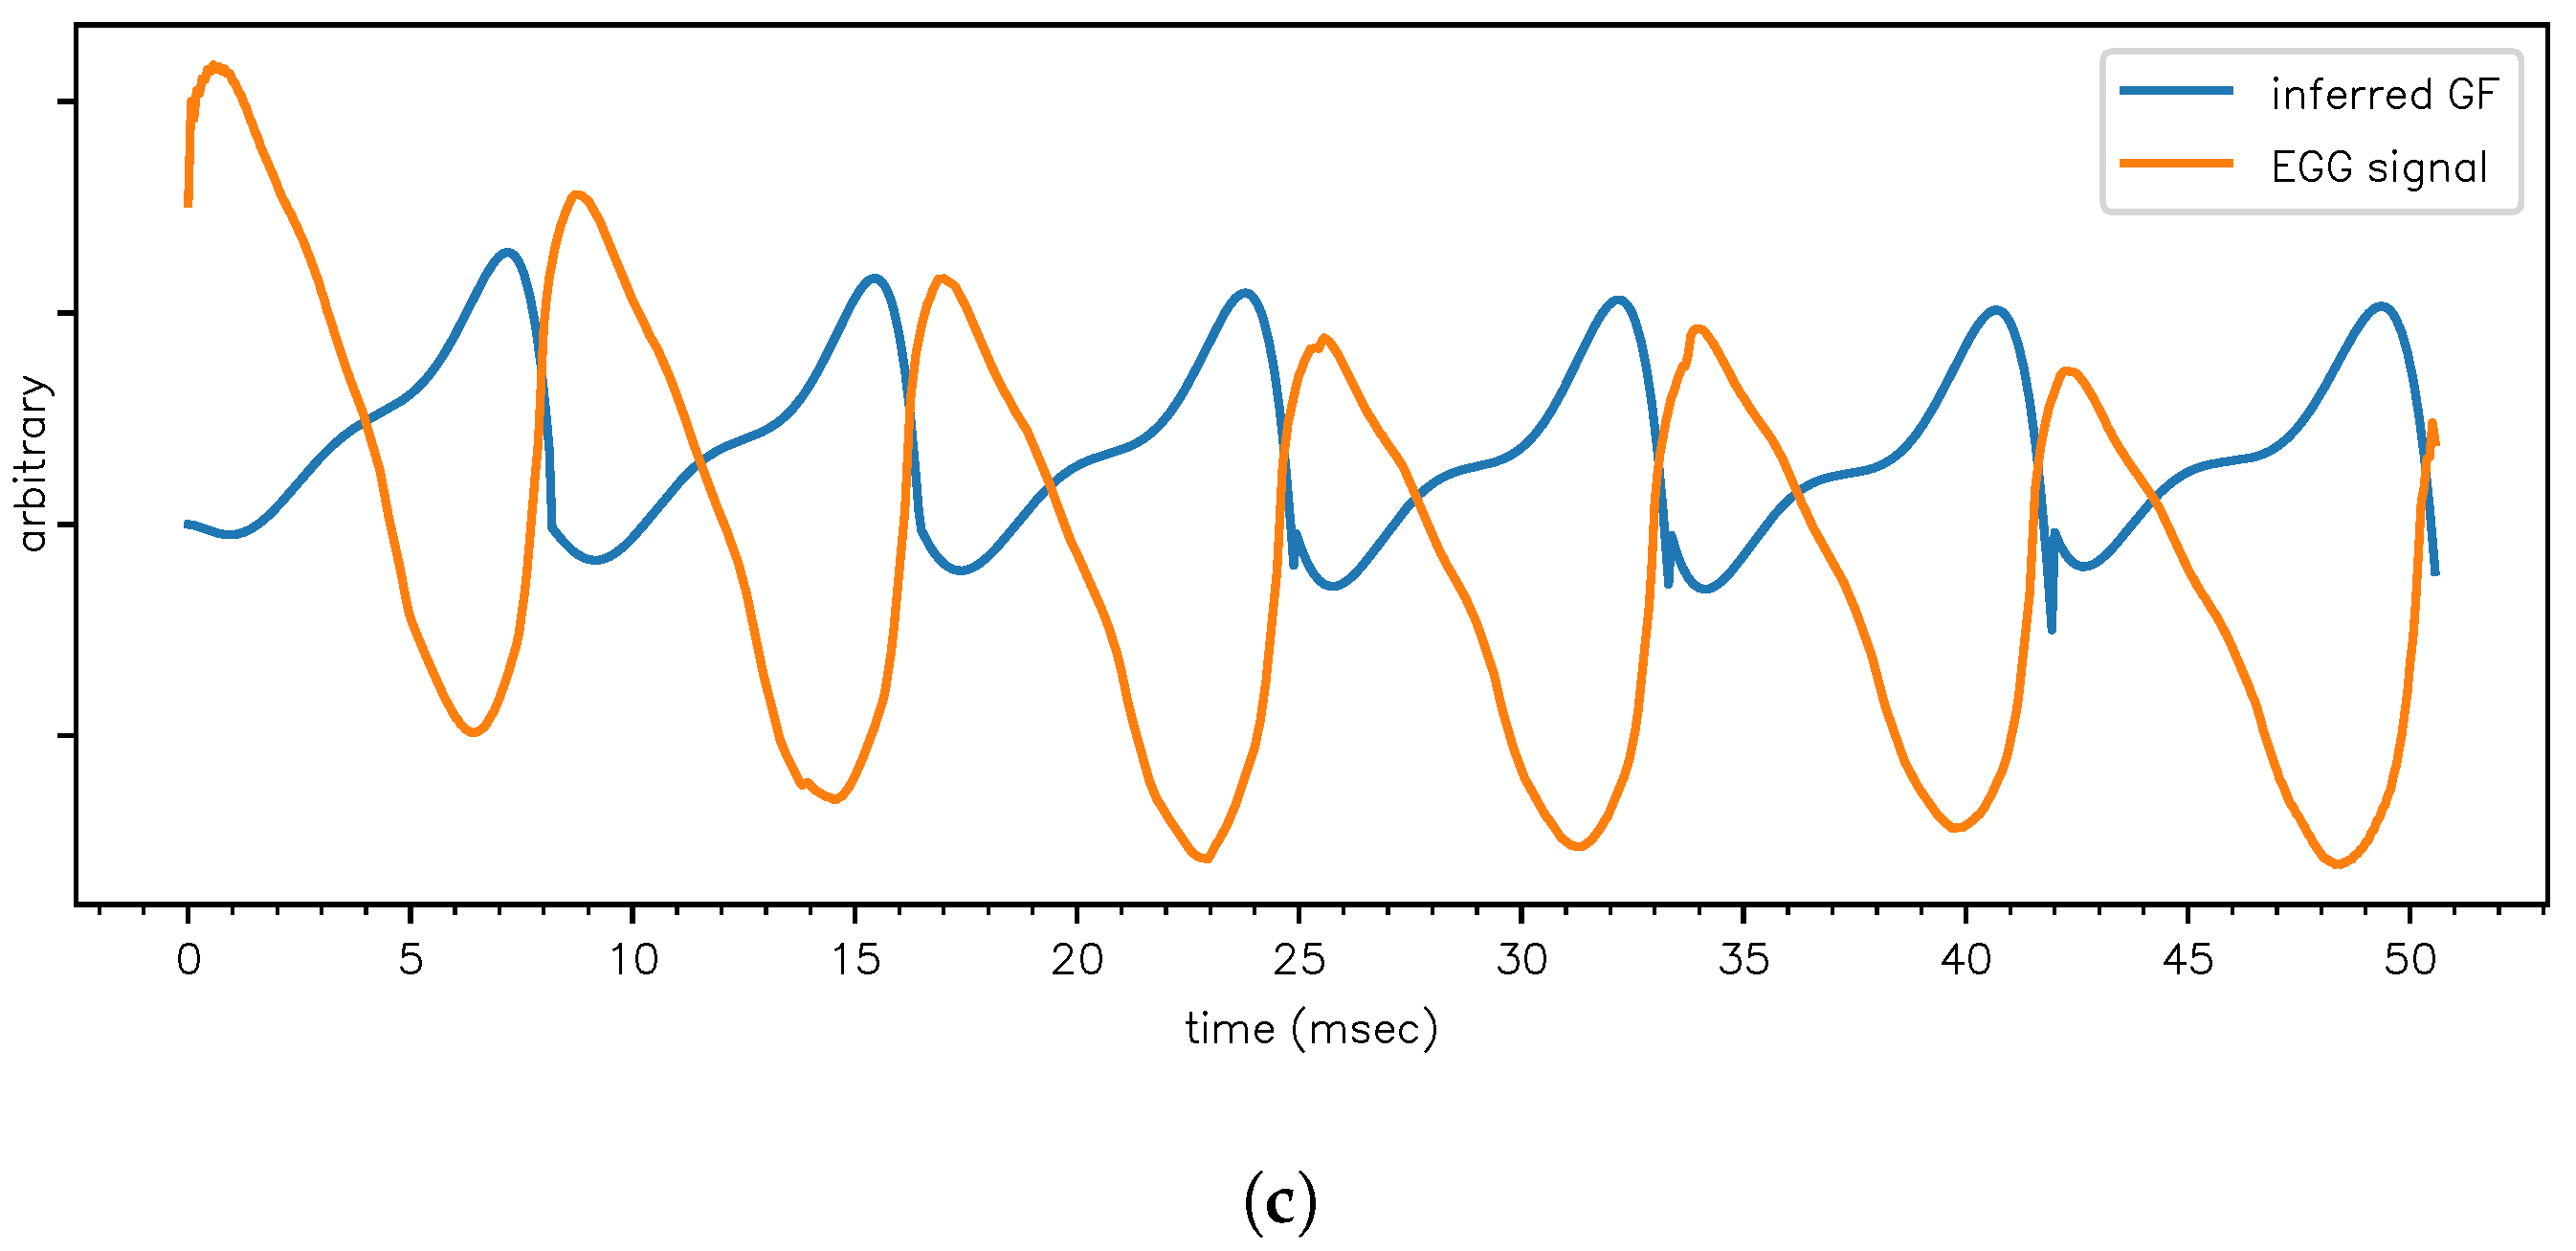
Figure 6.
Application of the model to a SSV /ɛ/ in order to estimate the frequency and decay constants of F1, F2, F3. (a) Fit to the data shown in Figure 4. (b) We can estimate the dGF waveform via the amplitudes , and integrating this estimate yields the glottal flow (GF) waveform. As an independent qualitative check, in this subplot the GF is compared to a GF obtained via inverse filtering [25]. (c) The estimated GF waveform (the same as in plot (c)) is now compared to the EGG signal which was simultaneously recorded with the /ɛ/ waveform [22]. A high value of the EGG means that the glottis is closed, so the GF must be small. A low value of the EGG means that the glottis is open, and the GF should be big (as air from the lungs can escape outward). This anticorrelation is perfectly observed.
4. Conclusions
Though we have shown that this approach holds some promises, a lot more work is needed before anything definitive can be asserted; in particular work is underway in which the method will be systematically compared to a “ground truth“ to test its validity using a speech production simulation with known glottal flow and formants. In addition, the model would benefit greatly from making the estimation of the pitch periods part of the inference, rather than requiring it as a given; using more informative priors is also expected to improve the model order inference (e.g., it is known that there are typically about three resonances of significance, for a human vocal tract, below about 3500 Hz ([26] p. 20)). Finally, for shorter pitch periods (i.e., higher fundamental frequency of speech) the model is expected to deteriorate, as we do not allow the damped sines to “leak“ into the next pitch period. Thus a more elaborate model would have to include nearest-neighbor interactions between adjacent pitch periods.
Applications of high-accuracy formant measurements equipped with error bars should be plentiful, but two examples worthwhile are forensic speaker identification (e.g., [27]) and medical diagnosis (e.g., [28]). Remarkably, the field of forensic phonetics seems to have adopted a Bayesian methodology [29,30], so perhaps in the future this model could deliver quantities directly for use in their likelihood ratios [6].
4.1. Possible Extensions
This approach can be extended to non-stationary vowels (i.e., non-SSVs) by explicitly modeling the formant tracks (e.g., by parametrization or by a free-form model [31]); one would then get error-bars on the tracks. The pitch period model (Equation (5)) might be extendable to a restricted class of consonants called plosives (such as [k]), insofar the plosive mechanism is qualitatively similar to the glottal closure [32].
Author Contributions
Conceptualization and writing: M.V.S. and B.d.B.; methodology and analysis: M.V.S.
Funding
This research was supported by the Research Foundation Flanders (FWO) under grant number G015617N.
Conflicts of Interest
The authors declare no conflict of interest.
References
- Fant, G. Acoustic Theory of Speech Production; Mouton: Den Haag, The Netherlands, 1960. [Google Scholar]
- Hermann, L. Phonophotographische Untersuchungen. Pflügers Arch. Eur. J. Physiol. 1889, 45, 582–592. [Google Scholar] [CrossRef]
- Fulop, S.A. Speech Spectrum Analysis; Signals and Communication Technology; Springer: Berlin, Germany, 2011; OCLC: 746243279. [Google Scholar]
- Kent, R.D.; Vorperian, H.K. Static Measurements of Vowel Formant Frequencies and Bandwidths: A Review. J. Commun. Disord. 2018, 74, 74–97. [Google Scholar] [CrossRef] [PubMed]
- Maurer, D. Acoustics of the Vowel; Peter Lang: Bern, Switzerland, 2016. [Google Scholar]
- Harrison, P. Making Accurate Formant Measurements: An Empirical Investigation of the Influence of the Measurement Tool, Analysis Settings and Speaker on Formant Measurements. Ph.D. Thesis, University of York, York, UK, 2013. [Google Scholar]
- Vallabha, G.K.; Tuller, B. Systematic Errors in the Formant Analysis of Steady-State Vowels. Speech Commun. 2002, 38, 141–160. [Google Scholar] [CrossRef]
- Peterson, G.E.; Barney, H.L. Control Methods Used in a Study of the Vowels. J. Acoust. Soc. Am. 1952, 24, 175–184. [Google Scholar] [CrossRef]
- Rabiner, L.R.; Schafer, R.W. Introduction to Digital Speech Processing. Found. Trends Signal Process. 2007, 1, 1–194. [Google Scholar] [CrossRef]
- Jaynes, E.T. Bayesian Spectrum and Chirp Analysis; Springer: Dordrecht, The Netherlands, 1987; pp. 1–29. [Google Scholar]
- Bretthorst, G.L. Bayesian Spectrum Analysis and Parameter Estimation; Springer Science & Business Media: Berlin, Germany, 1988. [Google Scholar]
- Chen, C.J.; Miller, D.A. Pitch-Synchronous Analysis of Human Voice. J. Voice 2019. [Google Scholar] [CrossRef] [PubMed]
- Boersma, P. Should Jitter Be Measured by Peak Picking or by Waveform Matching. Folia Phoniatr. Et Logop. 2009, 61, 305–308. [Google Scholar] [CrossRef] [PubMed]
- Wise, J.; Caprio, J.; Parks, T. Maximum likelihood pitch estimation. IEEE Trans. Acoust. Speech Signal Process. 1976, 24, 418–423. [Google Scholar] [CrossRef]
- Ladefoged, P. Elements of Acoustic Phonetics; University of Chicago Press: Chicago, IL, USA, 1996. [Google Scholar]
- Miller, D.G.; Schutte, H.K. Characteristic Patterns of Sub-and Supraglottal Pressure Variations within the Glottal Cycle. In Proceedings of the Transcripts of the Thirteenth Symposium on Care of the Professional Voice, New York, NY, USA; 1984; pp. 70–75. [Google Scholar]
- Doval, B.; D’Alessandro, C.; Henrich, N. The Spectrum of Glottal Flow Models. Acta Acust. United Acust. 2006, 92, 1026–1046. [Google Scholar]
- Ó Ruanaidh, J.J.K.; Fitzgerald, W.J. Numerical Bayesian Methods Applied to Signal Processing; Statistics and Computing; Springer New York: New York, NY, USA, 1996. [Google Scholar] [CrossRef]
- Fitzgerald, P.; Godsill, S.J.; Kokaram, A.C. Bayesian Methods in Signal and Image. Bayesian Stat. 1999, 6, 239–254. [Google Scholar]
- Bretthorst, G.L. Bayesian Spectrum Analysis on Quadrature NMR Data with Noise Correlations. In Maximum Entropy and Bayesian Methods; Springer: Berlin, Germany, 1989; pp. 261–273. [Google Scholar]
- Press, W.H.; Teukolsky, S.A.; Vetterling, W.T.; Flannery, B.P. Numerical Recipes in C: The Art of Scientific Computing, 2nd Ed. ed; Cambridge University Press: New York, NY, USA, 1992. [Google Scholar]
- Kominek, J.; Black, A.W. The CMU Arctic speech databases. In Proceedings of the Fifth ISCA Workshop on Speech Synthesis, Pittsburgh, PA, USA, June 14-16, 2004. [Google Scholar]
- Boersma, P.; Weenink, D.J.M. Praat, a system for doing phonetics by computer. Glot Int. 2002, 5, 341–345. [Google Scholar]
- Sanchez, J. Application of Classical, Bayesian and Maximum Entropy Spectrum Analysis to Nonstationary Time Series Data. In Maximum Entropy and Bayesian Methods; Springer: Berlin, Germany, 1989; pp. 309–319. [Google Scholar]
- Alku, P. Glottal Inverse Filtering Analysis of Human Voice Production—A Review of Estimation and Parameterization Methods of the Glottal Excitation and Their Applications. Sadhana 2011, 36, 623–650. [Google Scholar] [CrossRef]
- Rabiner, L.R.; Juang, B.H.; Rutledge, J.C. Fundamentals of Speech Recognition; PTR Prentice Hall: Englewood Cliffs, NJ, USA, 1993; Volume 14. [Google Scholar]
- Becker, T.; Jessen, M.; Grigoras, C. Forensic Speaker Verification Using Formant Features and Gaussian Mixture Models. In Proceedings of the Ninth Annual Conference of the International Speech Communication Association, Brisbane, Australia, September 22-26, 2008. [Google Scholar]
- Ng, A.K.; Koh, T.S.; Baey, E.; Lee, T.H.; Abeyratne, U.R.; Puvanendran, K. Could Formant Frequencies of Snore Signals Be an Alternative Means for the Diagnosis of Obstructive Sleep Apnea? Sleep Med. 2008, 9, 894–898. [Google Scholar] [CrossRef] [PubMed]
- Bonastre, J.F.; Kahn, J.; Rossato, S.; Ajili, M. Forensic Speaker Recognition: Mirages and Reality. S. Fuchs/D 2015, 255. [Google Scholar] [CrossRef]
- Nolan, F. Speaker Identification Evidence: Its Forms, Limitations, and Roles. In Proceedings of the Conference “Law and Language: Prospect and Retrospect”, Levi, Finnish, Lapland, 2001; pp. 1–19. [Google Scholar]
- Sivia, D.; Skilling, J. Data Analysis: A Bayesian Tutorial; OUP: Oxford, UK, 2006. [Google Scholar]
- Chen, C.J. Elements of Human Voice; World Scientific: Singapore, 2016. [Google Scholar]
Figure 1.
(After [12,16]; reproduced with kind permission.) The EGG signal is the electrical conductance between two electrodes placed on the neck. When the glottis is closed, the measured conductance is high, and vice versa. The EGG signal is displayed in the bottom panel. In the top panel the synchronized speech waveform is plotted and three individual pitch periods are shown. From comparing the top and bottom panel, it is evident that the pulses in the speech waveform occur when the EGG signal rises sharply; i.e., when the glottis closes. Additionally, there are two phases (closed-open) within each pitch period in which the damping of the speech waveform seemingly changes; this is primarily due to the glottal waveform which becomes prominent at the end of the pitch periods as the glottis is reaching its maximum aperture. The blue baseline drawn in the top panel by simple visual inspection is related to the time derivative of the glottal flow (dGF). A second and smaller effect causing the pitch periods to exhibit two phases is the extra coupling to the subglottal cavities (such as the lungs) of the acoustic waves in the VT when the glottis opens; this causes these waves to decay faster.
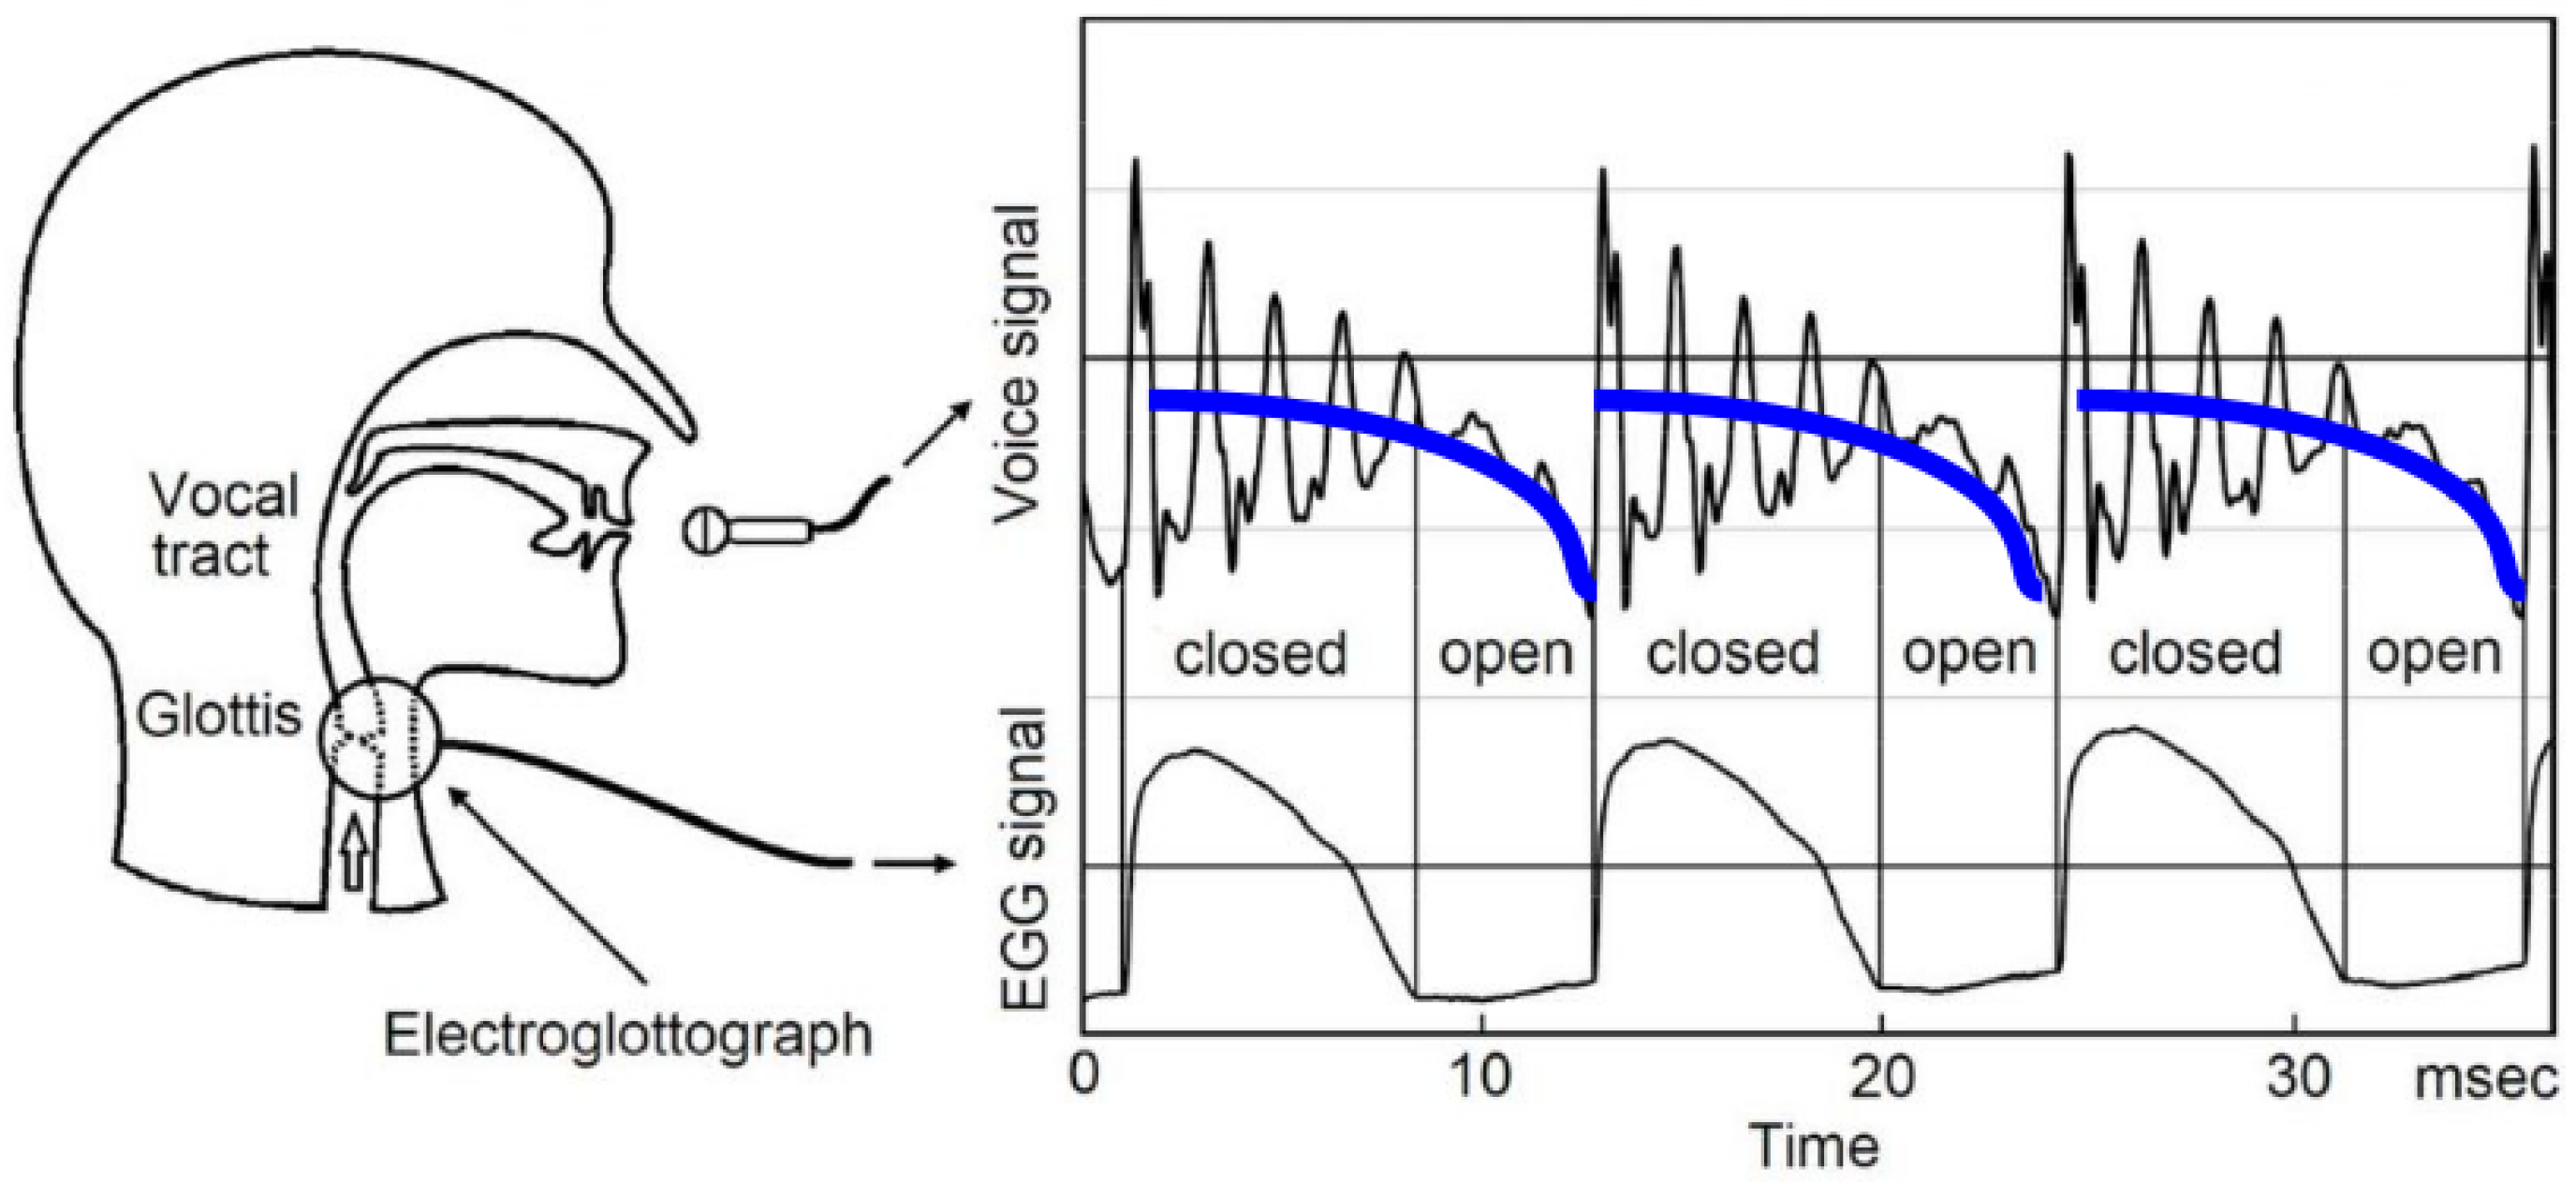
Figure 2.
One pitch period extracted from a SSV /ɛ/ plotted as samples (the dots) together with the model function fit (smooth line).
Figure 2.
One pitch period extracted from a SSV /ɛ/ plotted as samples (the dots) together with the model function fit (smooth line).
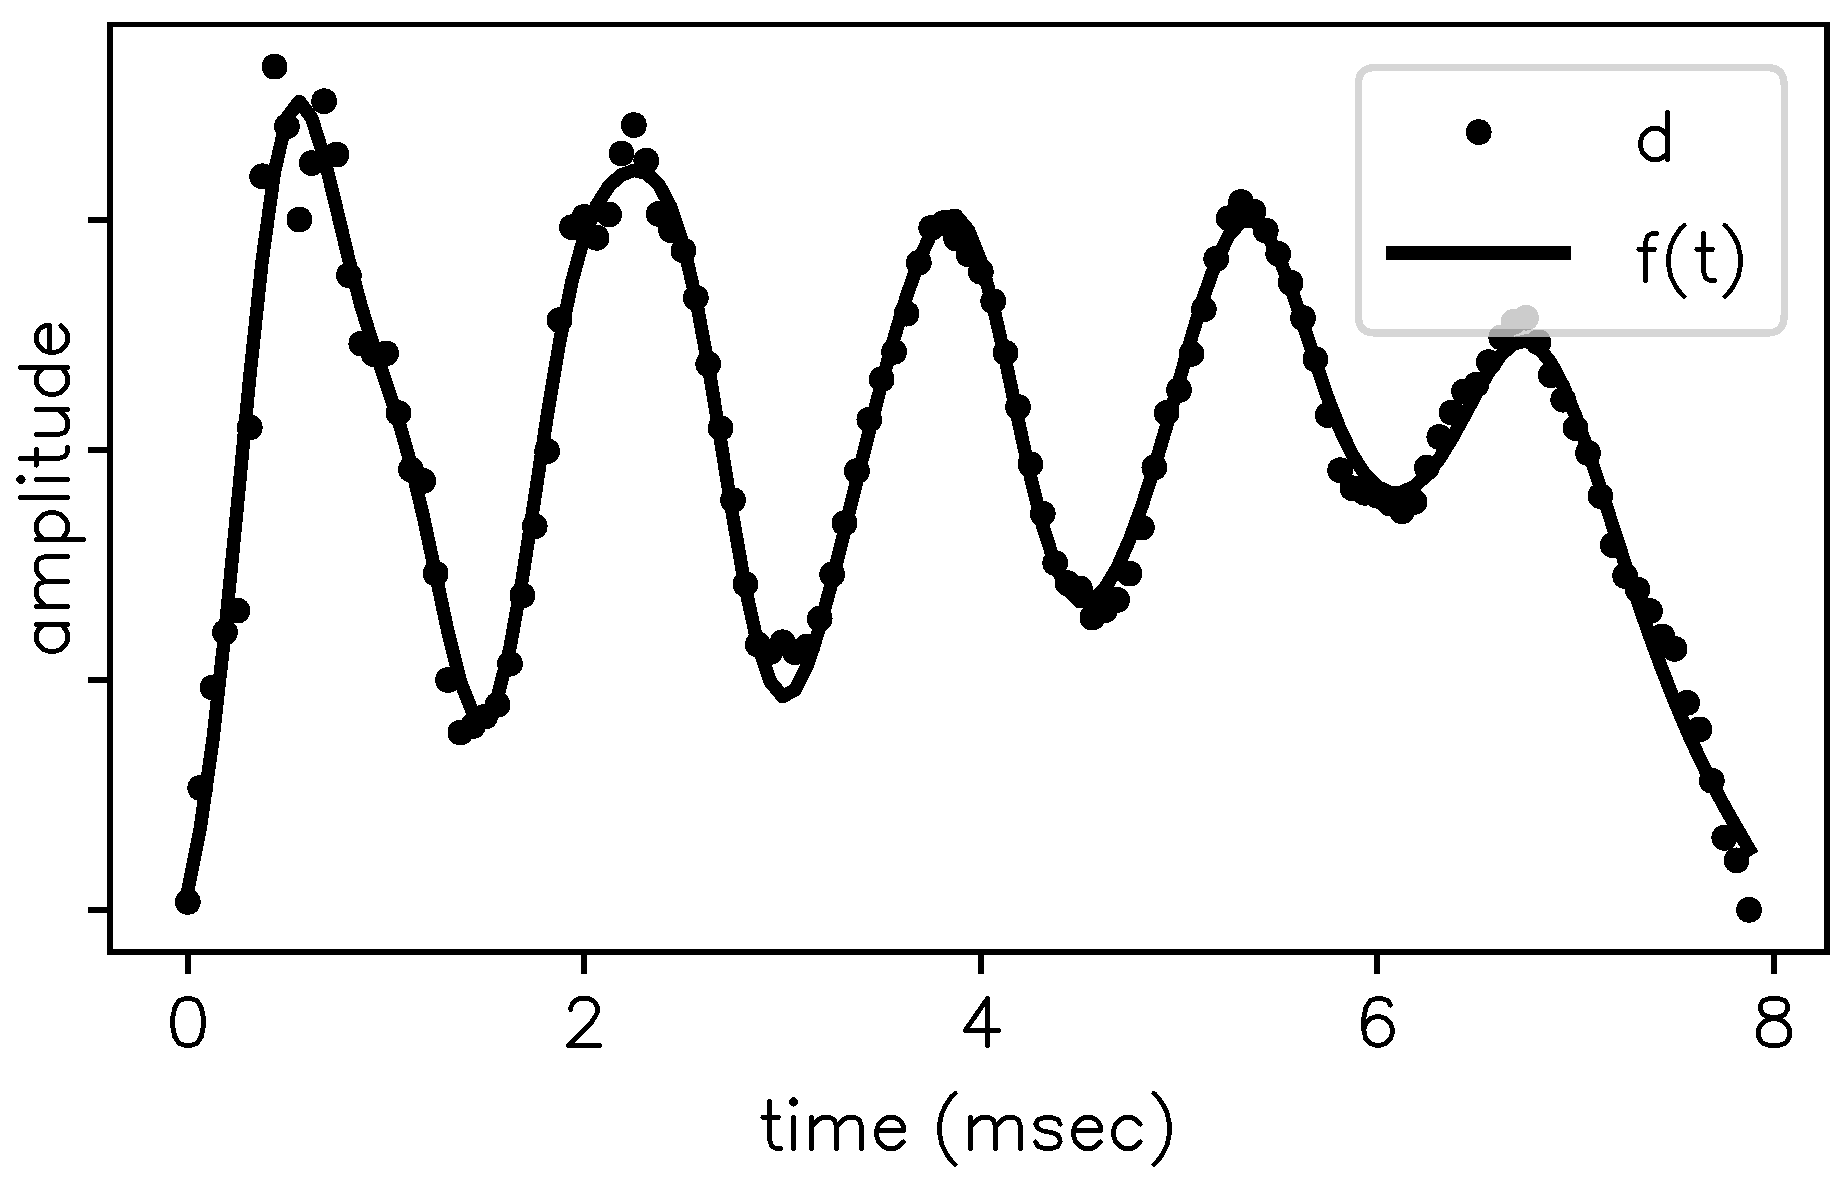
Figure 3.
A model of the SSV (in this case an /ɛ/, which is also used in the next section) consists of several model functions strung together, as shown in this plot by giving each such model function its own color. The model functions are fitted to the individual pitch periods but are “frustrated” by their having to share the formant frequencies and decay constants .
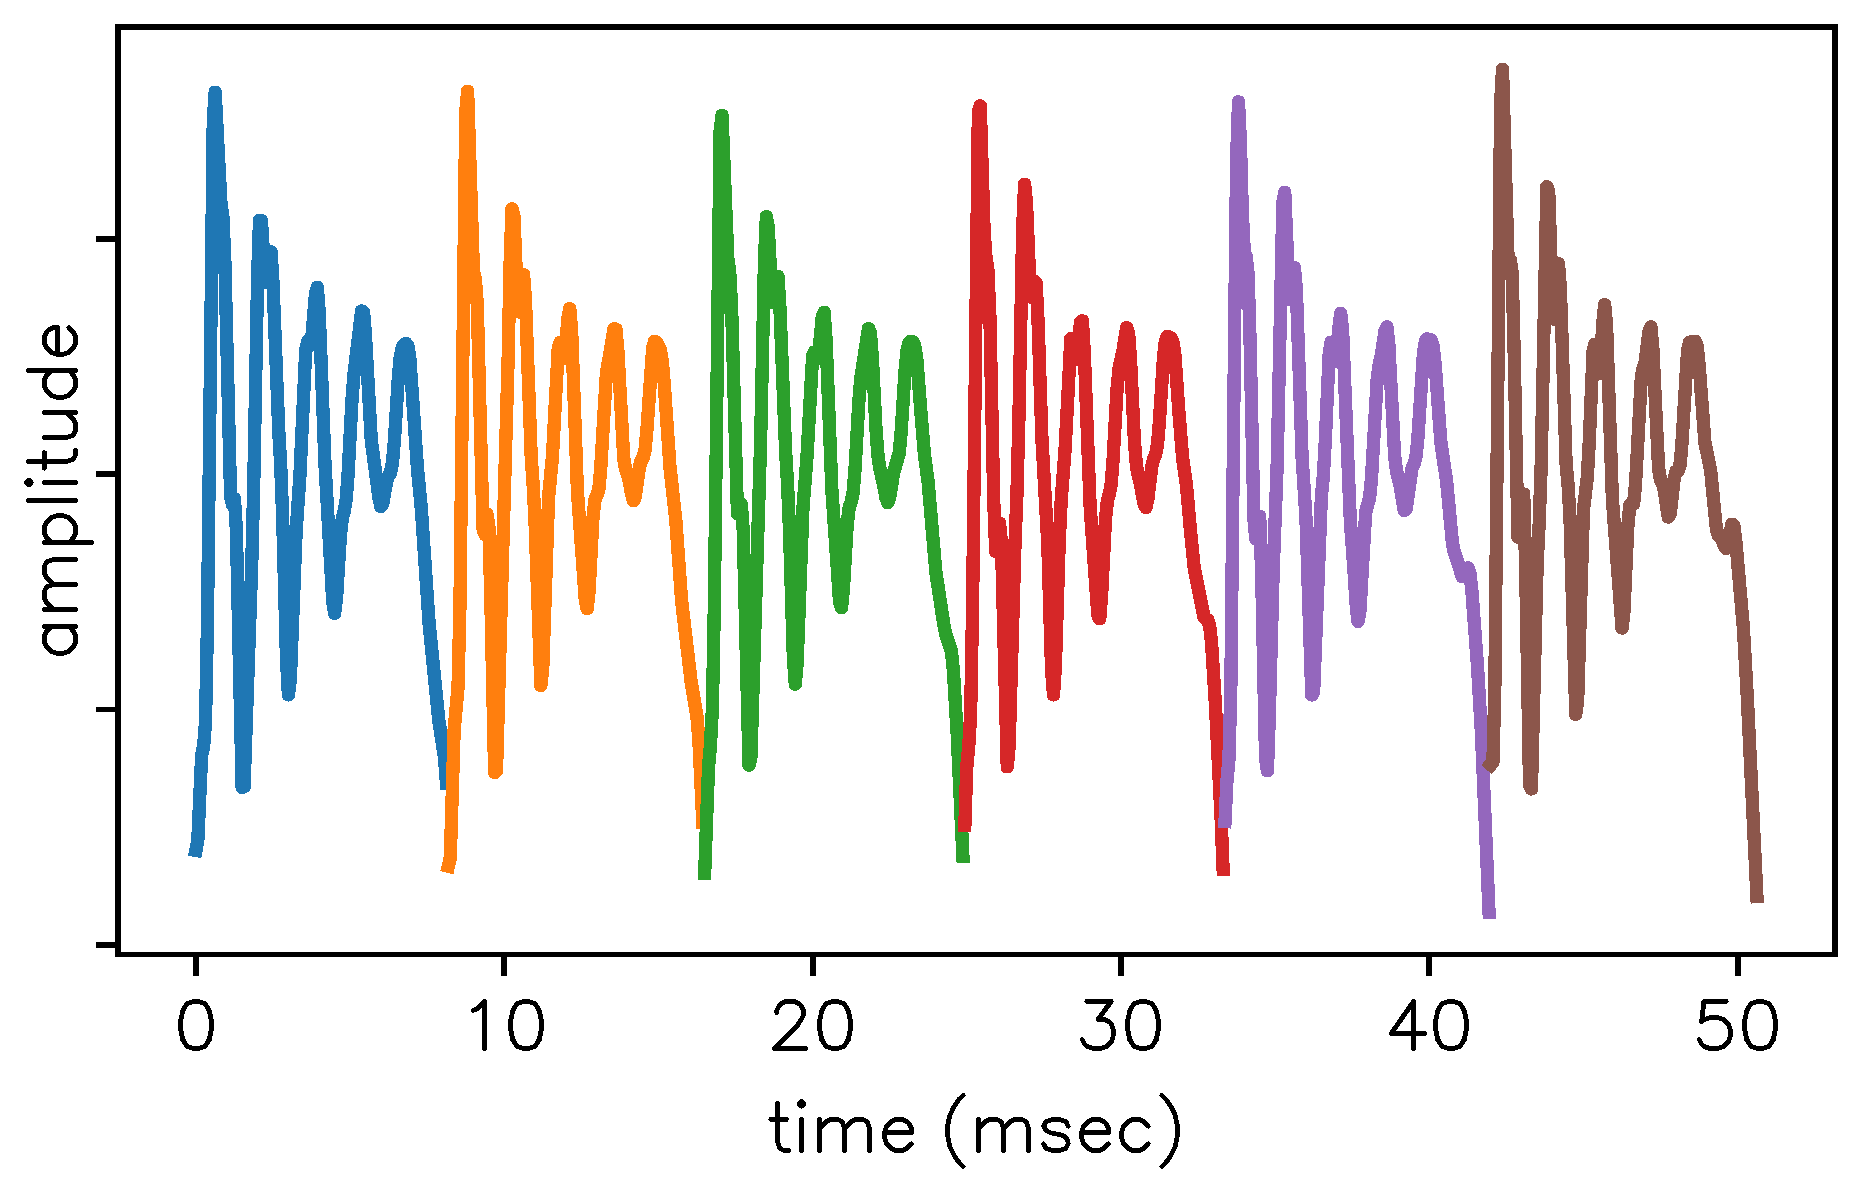
Figure 4.
Steady-state portion of [ɛ] consisting of six pitch periods. Extracted from the CMU ARCTIC database [22], speaker BDL, sentence a0001.wav, from 2.847 to 2.898 sec at 16 kHz (no downsampling was done).
Figure 4.
Steady-state portion of [ɛ] consisting of six pitch periods. Extracted from the CMU ARCTIC database [22], speaker BDL, sentence a0001.wav, from 2.847 to 2.898 sec at 16 kHz (no downsampling was done).
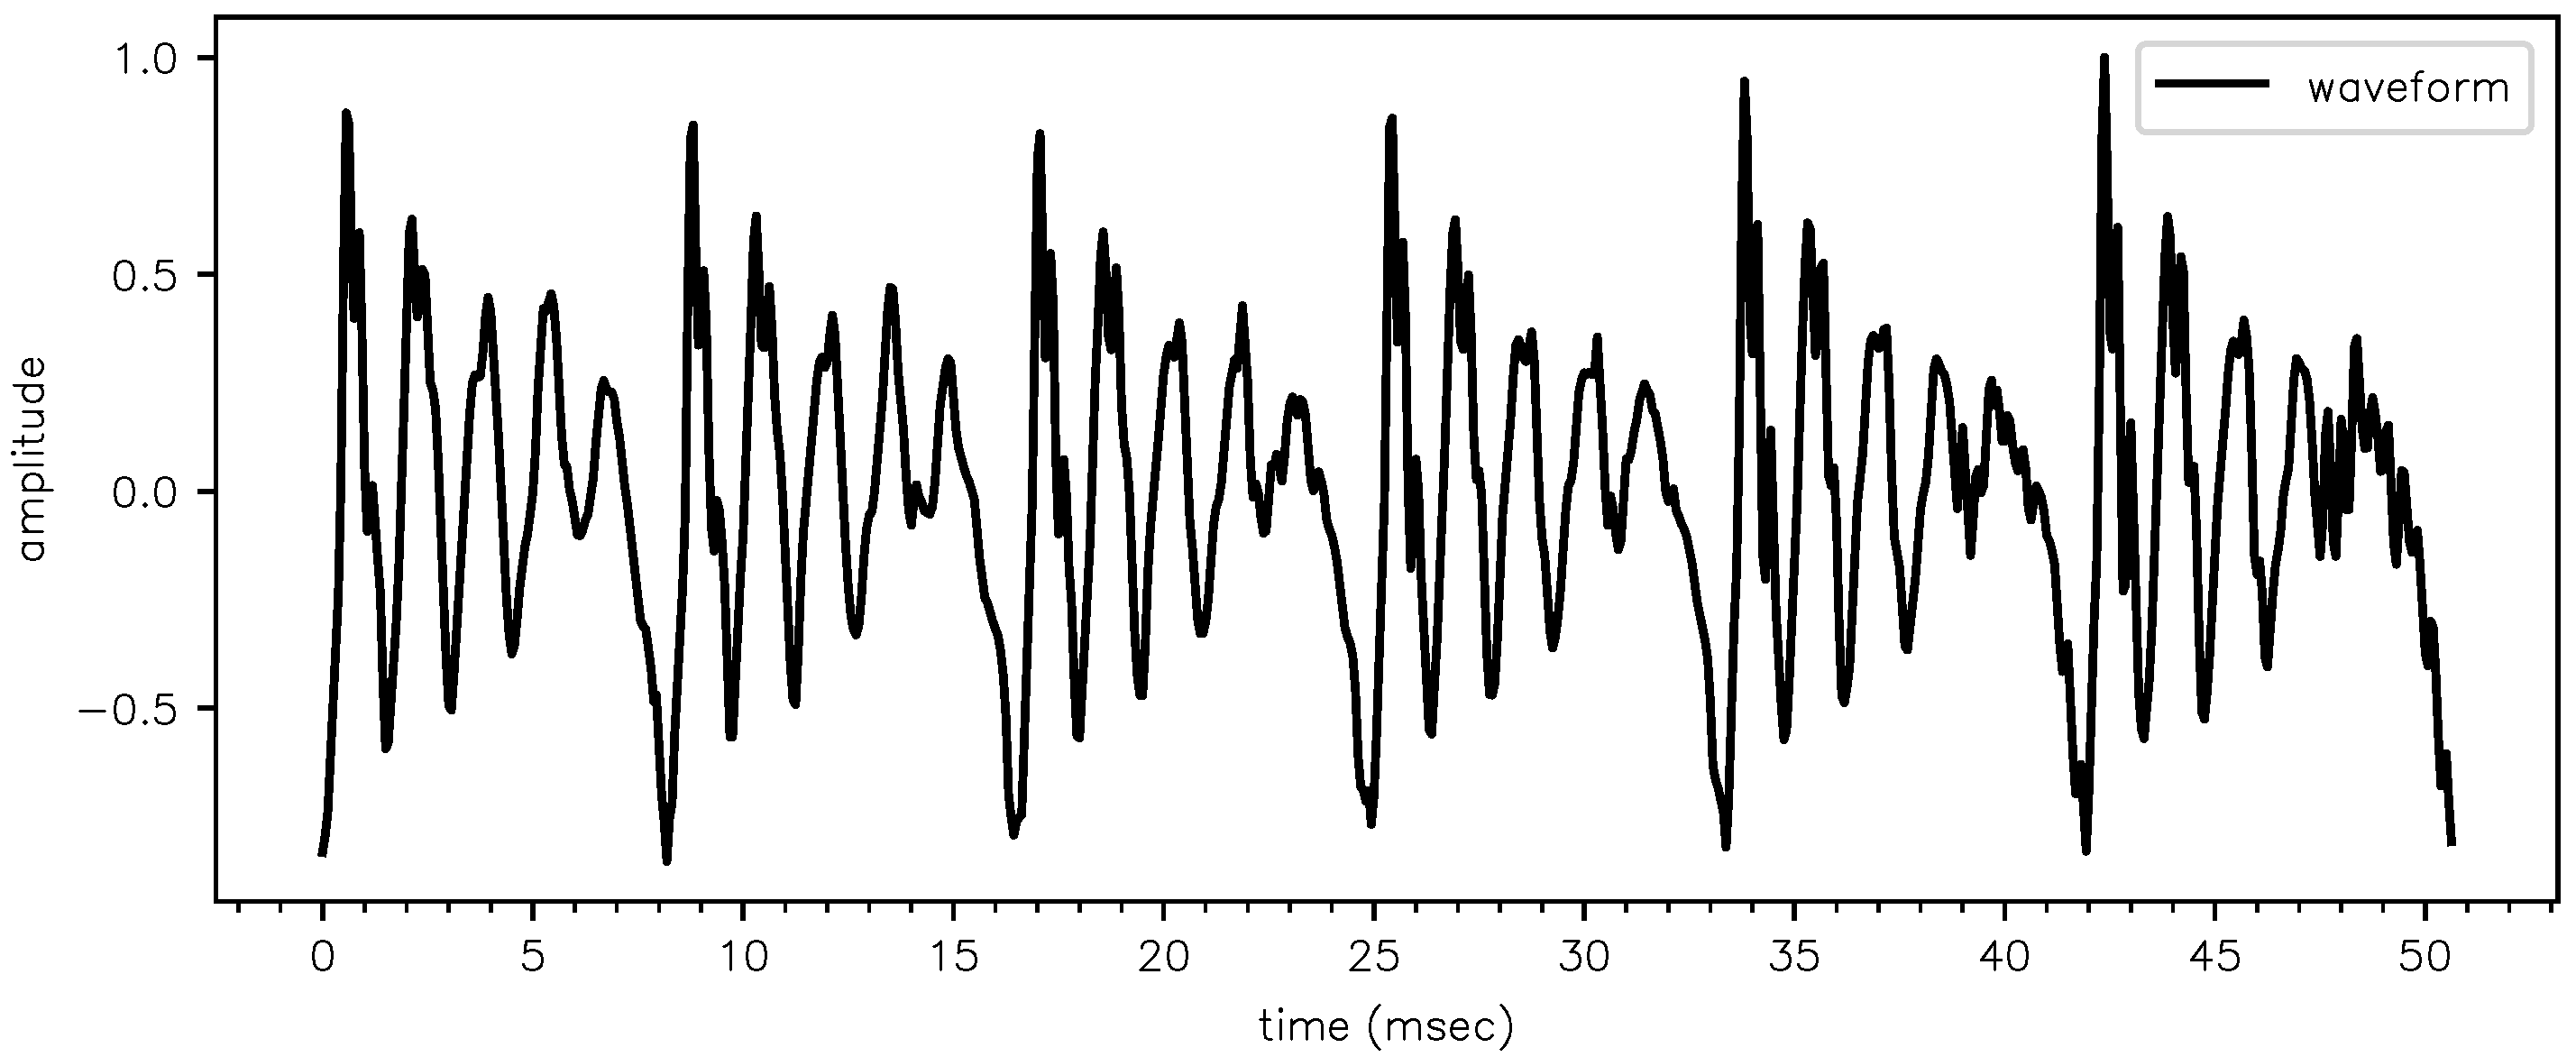
Figure 5.
The posterior probability for the SSV /ɛ/.
© 2019 by the authors. Licensee MDPI, Basel, Switzerland. This article is an open access article distributed under the terms and conditions of the Creative Commons Attribution (CC BY) license (http://creativecommons.org/licenses/by/4.0/).
Share and Cite
MDPI and ACS Style
Van Soom, M.; de Boer, B. A New Approach to the Formant Measuring Problem. Proceedings 2019, 33, 29. https://doi.org/10.3390/proceedings2019033029
AMA Style
Van Soom M, de Boer B. A New Approach to the Formant Measuring Problem. Proceedings. 2019; 33(1):29. https://doi.org/10.3390/proceedings2019033029
Chicago/Turabian StyleVan Soom, Marnix, and Bart de Boer. 2019. "A New Approach to the Formant Measuring Problem" Proceedings 33, no. 1: 29. https://doi.org/10.3390/proceedings2019033029