Flash Thermography Mapping of Degradation Patterns in Archaeological Glass †
by
 , and
, and
Jacopo Melada
, 
Nicola Ludwig
*,
Francesca Micheletti
,
Jacopo Orsilli
,
Marco Gargano
and
Letizia Bonizzoni
Dipartimento di Fisica “Aldo Pontremoli” Università degli Studi di Milano,, Milano, 20133, Italy
*
Author to whom correspondence should be addressed.
†
Presented at the 15th International Workshop on Advanced Infrared Technology and Applications (AITA 2019), Florence, Italy, 17–19 September 2019.
Proceedings 2019, 27(1), 5; https://doi.org/10.3390/proceedings2019027005
Published: 16 September 2019
(This article belongs to the Proceedings of The 15th International Workshop on Advanced Infrared Technology and Applications)
Abstract
:The process of degradation in artefacts subjected to centuries of burial can be of great relevance above all in archaeological glass. Infrared thermography is a non-destructive method allowing to map the defects of the glass substrate, both produced during its manufacturing (e.g., bubbles and inclusions) and due to ageing. This research is focused on the use of different flash thermography methods for the mapping of superficial flakes on Roman glasses dating back to the I and II century A.D. The effectiveness of active thermography methods is evaluated to map degraded portions of archaeological glass considering their semitransparency and specific optical absorption.
1. Introduction
Infrared Thermography (IRT) is a deep-rooted investigation tool in conservation and diagnosis of cultural heritage due to its noninvasiveness [1,2]. In this work we weighed up the possibility of using an active thermography-based methodology to evaluate the conservation status of archaeological glass, semitransparent to visible radiation. Thus, the purpose of this work is the comparison of different active thermography methods to study degradation effects on semitransparent materials. In such kind of materials, the heat diffusion inside the sample cannot be modeled according to the most known 1D solutions of the Fourier equation in solid semi-infinite media afterword a Dirac-like pulse thermal stimulation (i.e., flash lamps) [3]. Several authors already considered the problems of inspection of semitransparent materials by optically excited thermography [3,4,5]; some other studies deal with the different penetration depth of visible and near infrared light in paper-based artefacts [6,7]. Our approach consists in a first step using different optically heating methods to evaluate the possibility of identifying the presence of glass flake on the surface as a thermal anomaly with respect to the unaltered material. Considering also the optical characteristics of the archaeological objects, we use flash lamps with different spectral distribution. Furthermore, in order to verify how far from the condition of Dirac-like pulse we are working, we use a long square pulse of about 10 seconds. In the second phase of this research we apply different processing methods to analyze the thermograms sequences after the flash pulse to obtain the most reliable thermal contrast between sound and defective areas. Statistical multivariate analysis (PCT) [8] and high order statistic methods, in particular the one based on the 4th standardize central moment (kurtosis) [9,10] have been compared for all the different heating processes used.
2. Materials, Their Problems and Methods of Analysis
2.1. Roman Glass
All the analyzed artefacts were found in the necropolis of Oleggio (Italy) in a Roman sepulchral area archaeologically dated between the Augustan Age and the end of the first century A.D. The analyzed artefacts are mainly bottles of different shapes and usage which also reflect a distinction between accurate manufacturing and poor production.
2.2. Archaeological Glass Degradation
The main degradation process of archaeological glass is the leaching out of alkali ions from the glass network [10]. This phenomenon is strictly connected to the burial conditions and to the amount of Sodium and/or Potassium in the glass itself [11]. Alkali migrates towards the surface moving through the 3D silicon-oxygen network and they are replaced by hydrogen ions coming from the water molecule. Those de-alkalinized layers are usually silica-rich and hydrated [10]. The formation of distinct and overlapping leached layers results in a final crust with thickness varying from 1 µm to 25 µm [12]. These thin layers are irregular, slightly separated and can peel or flake. The layers produce optical interference resulting in iridescent colours typical of ancient glass. These high hygroscopic layers can cause condensation processes which promote further weathering. In general, according to the degradation level, weathered glass can have several visual effects, beyond iridescence: dulling, opaque weathering, a total loss of glassy nature, pitting, cracking of the surface, and discoloration (Figure 1a,b) [13,14].
2.3. Thermographic Inspections
The thermograms sequences for each sample were acquired with an Avio R500EX-Pro (8–14 µm) using a typical pulse thermography setup [1]. The thermal pulse is provided by two Godox WITSTRO AD360 (360 W) flashes. In order to obtain different excitation pulses having diverse spectral power distribution, we use two different color correction filters placed in front of the flash lamps (Figure 2).
2.4. Other Inspections
This work is part of a larger project aimed to the characterization of the archaeological glass collection from the Museo Civico Etnografico Archeologico Fanchini of Oleggio (Italy). X-ray fluorescence (XRF) and fibre optic reflectance UV-VIS-NIR spectroscopy (FORS) in transmission mode were utilized to gain the chemical compositional of the samples (glass matrix and chromophores). In this way it is possible to evaluate the influence of the composition of the vitreous matrix to the thermographic response.
3. Results
Figure 3 presents some results obtained from sample 1462: the thermal contrast between the sound areas and the defective areas is visible only for a few tenths of a second following the flash pulse.
The thermographic response to the different spectral distributions of flash pulses is dissimilar (Figure 4). White flash pulse (4a) and blue flash pulse (4b) kurtograms show comparable results. Red flash pulse (4c) response displays a lower range of kurtosis values and an overall low contrast. Square pulse response (4d) exhibits no detectable flakes meaning there are no differences in the cooling rate of the sample; the only differences that can be noted are the different thickness of the glass.
4. Conclusion
In this work, we verify the applicability of flash thermography to semitransparent colored materials showing that different results can be obtained by changing the spectral irradiance of the flash depending on color of glass itself. As a first encouraging result, we obtained different map of kurtosis contrast with different irradiation spectra. Concerning the analysis methods, the kurtosis method shows to be less time-demanding to give the same results of PCT analysis. Finally, as a future step, the flash thermography would allow us to determine the deep of degradation that it is known in its turn to be linked to the age of the material itself.
Author Contributions
All authors were involved in discussing data and in writing the manuscript, contributed to discussion of content for the article and reviewed the manuscript before submission.
Funding
This research received no external funding.
Acknowledgments
The authors are very grateful to Jacopo Colombo and the Museo Civico Etnografico Archeologico Fanchini of Oleggio (Italy) for providing the samples.
Conflicts of Interest
The authors declare no conflict of interest.
References
- Gavrilov, D.; Maev, R.G.; Almond, D.P. A review of imaging methods in analysis of works of art: Thermographic imaging method in art analysis. Can. J. Phys. 2014, 92, 341–364. [Google Scholar] [CrossRef]
- Candoré, J.C.; Bodnar, J.L.; Detalle, V.P.; Grossel, P. Non-destructive testing of works of art by stimulated infrared thermography. Eur. Phys. J. Appl. Phys. EDP Sci. 2012, 57. [Google Scholar] [CrossRef]
- Altenburg, S.J.; Weber, H.; Krankenhagen, R. Thickness determination of semitransparent solids using flash thermography and an analytical model. Quant. Infrared Thermogr. J. 2018, 15, 95–105. [Google Scholar] [CrossRef]
- Bernegger, R.; Altenburg, S.J.; Roellig, M.; Maierhofer, C. Applicability of a 1D analytical model for pulse thermography of laterally heterogeneous semitransparent materials. Int. J. Thermophys. 2018, 39, 39. [Google Scholar] [CrossRef]
- Benítez, H.D.; Ibarra-Castanedo, C.; Bendada, A.; Maldague, X.; Loaiza, H.; Caicedo, E. Definition of a new thermal contrast and pulse correction for defect quantification in pulsed thermography. Infrared Phys. Technol. 2008, 51, 160–167. [Google Scholar] [CrossRef]
- Caruso, G.; Paoloni, S.; Orazi, N.; Cicero, C.; Zammit, U.; Mercuri, F. Quantitative evaluations by infrared thermography in optically semi-transparent paper-based artefacts. Measurement 2019, 143, 258–266. [Google Scholar] [CrossRef]
- Missori, M.; Pulci, O.; Teodonio, L.; Violante, C.; Kupchak, I.; Bagniuk, J.; Łojewska, J.; Mosca Conte, A. Optical response of strongly absorbing inhomogeneous materials: Application to paper degradation. Phys. Rev. B 2014, 89, 054201. [Google Scholar] [CrossRef]
- Marinetti, S.; Grinzato, E.; Bison, P.G.; Bozzi, E.; Chimenti, M.; Pieri, G.; Salvetti, O. Statistical analysis of IR thermographic sequences by PCA. Infrared Phys. Technol. 2004, 46, 85–91. [Google Scholar] [CrossRef]
- Madruga, F.J.; Ibarra-Castanedo, C.; Conde, O.M.; Maldague, X.P.; López-Higuera, J.M. Enhanced contrast detection of subsurface defects by pulsed infrared thermography based on the fourth order statistic moment, kurtosis. In Proceedings of the Thermosense XXXI, International Society for Optics and Photonics, Orlando, FL, USA, 2009; p. 72990U. [Google Scholar]
- Madruga, F.J.; Ibarra-Castanedo, C.; Conde, O.M.; López-Higuera, J.M.; Maldague, X. Infrared thermography processing based on higher-order statistics. NDT & E Int. 2010, 43, 661–666. [Google Scholar]
- Fermo, P.; Andreoli, M.; Bonizzoni, L.; Fantauzzi, M.; Giubertoni, G.; Ludwig, N.; Rossi, A. Characterisation of Roman and Byzantine glasses from the surroundings of Thugga (Tunisia): Raw materials and colours. Microchem. J. 2016, 129, 5–15. [Google Scholar] [CrossRef]
- Jackson, C.M.; Greenfield, D.; Howie, L.A. An assessment of compositional and morphological changes in model archaeological glasses in an acid burial matrix. Archaeometry 2012, 54, 489–507. [Google Scholar] [CrossRef]
- Römich, H.; López, E. Research on corrosion phenomena of archaeological glass. In Proceedings of the First international conference Hyalos-vitrum-glass: History, technology and conservation of glass and vitreous materials in the Hellenistic world, Greece, 2002; pp. 241–247. [Google Scholar]
- Newton, R.G.; Davison, S. Conservation of Glass; Butterworth & Co. (Publishers) Ltd.: London, UK, 1989. [Google Scholar]
Figure 1.
(a) Sample 1462. (b) Digital microscope image (120×) of a detached flake.

Figure 2.
(a) Transmittance spectra of the color filters. (b)Pseudo-Transmittance spectra of the sample 1462.
Figure 2.
(a) Transmittance spectra of the color filters. (b)Pseudo-Transmittance spectra of the sample 1462.
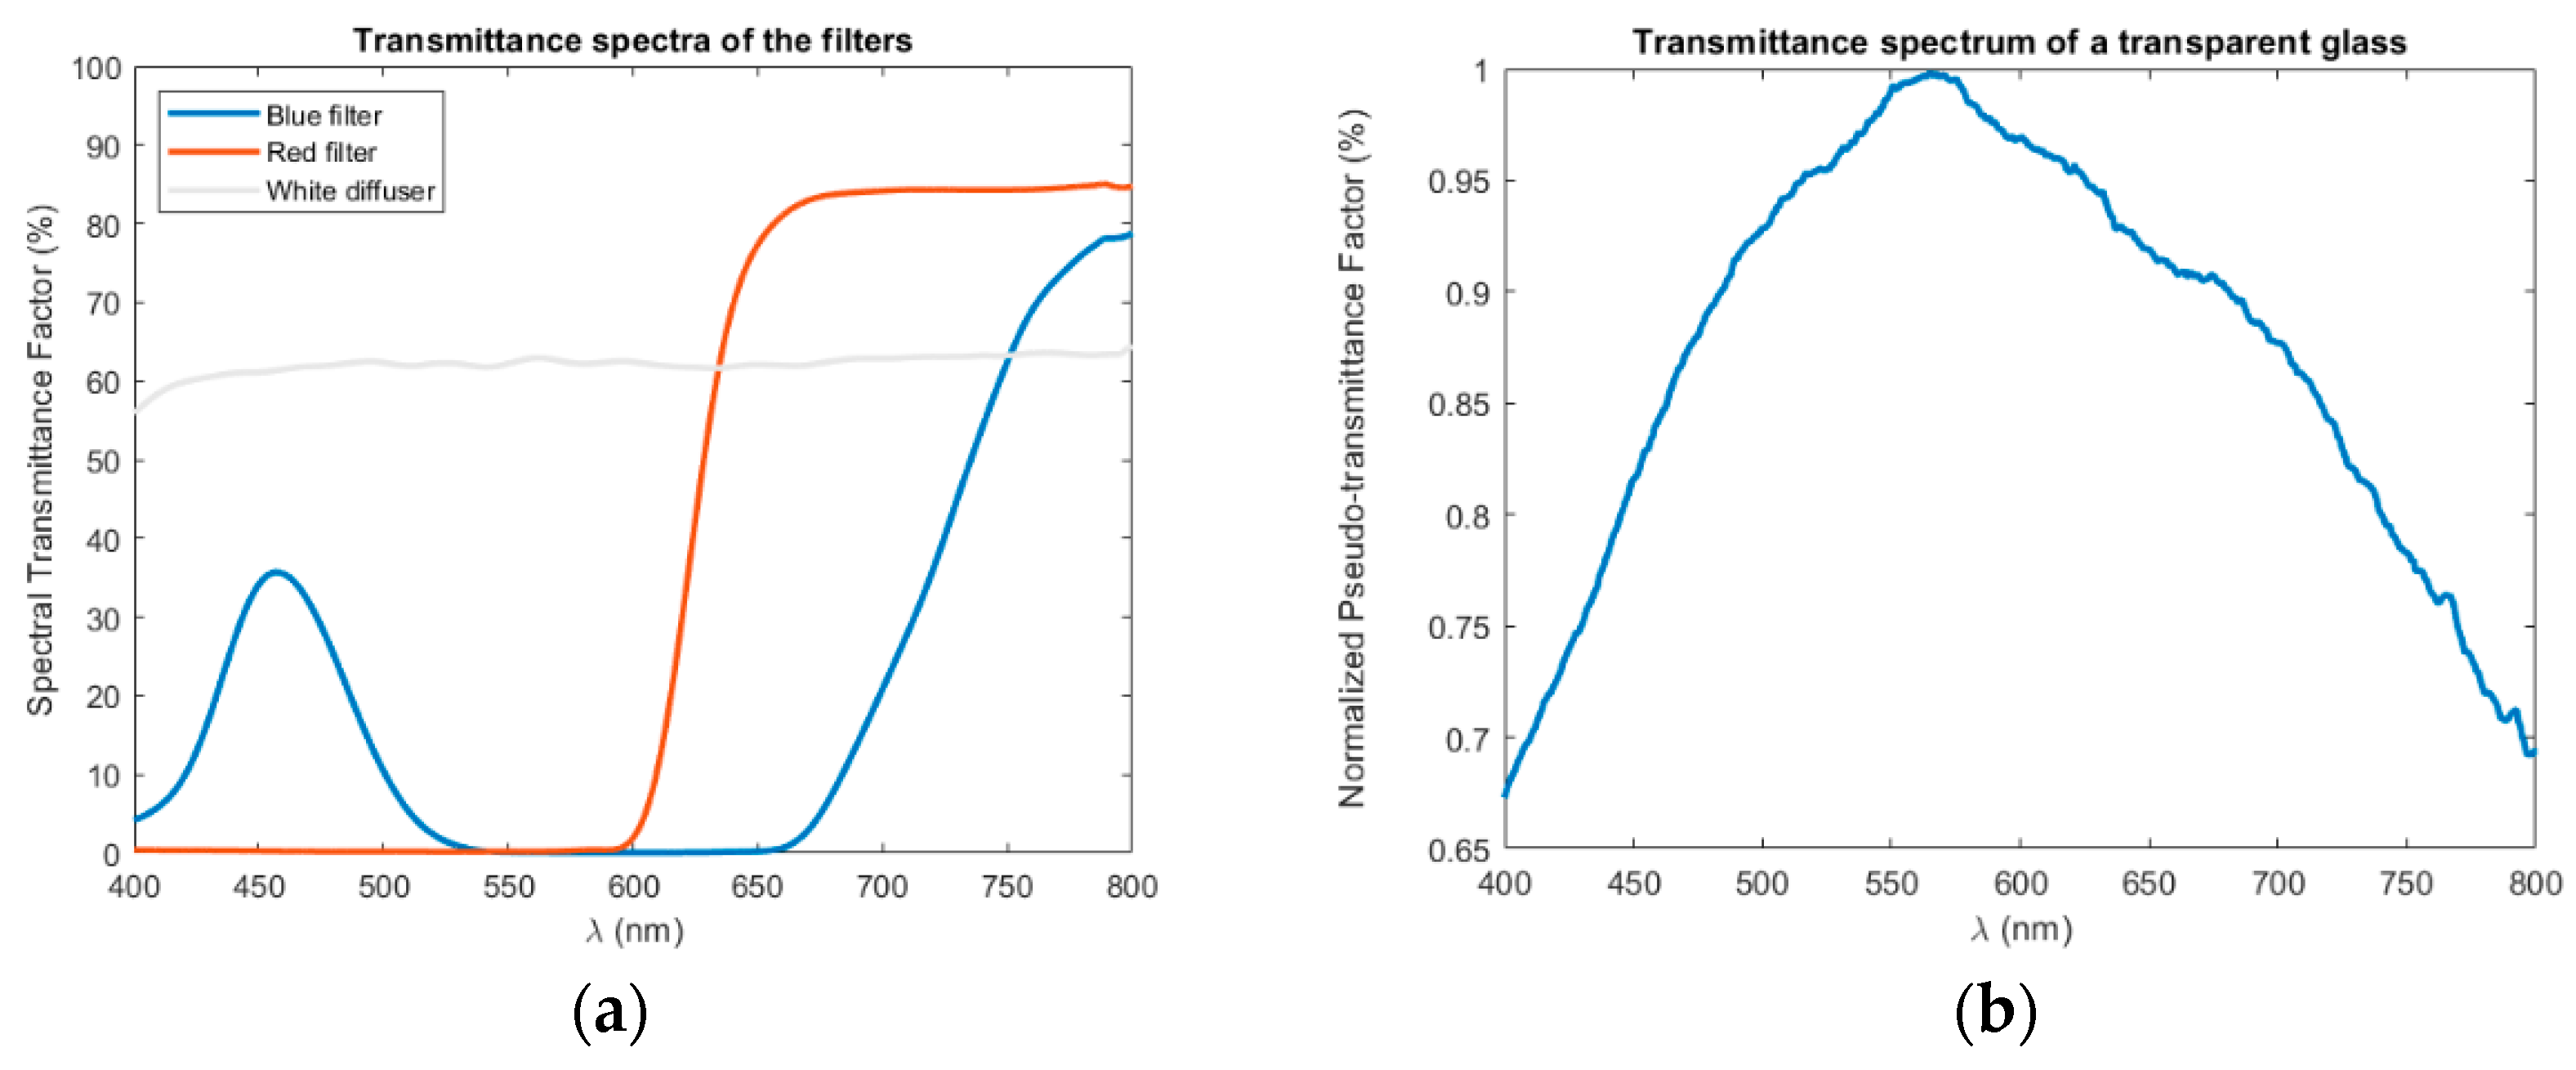
Figure 3.
Raw thermogram sequence of the sample 1462 using flash lamps with white diffuser: (a) before the excitation pulse, (b) 0.03 second after pulse, (c) 0.24 second after pulse, (d) 1 second after pulse.
Figure 3.
Raw thermogram sequence of the sample 1462 using flash lamps with white diffuser: (a) before the excitation pulse, (b) 0.03 second after pulse, (c) 0.24 second after pulse, (d) 1 second after pulse.
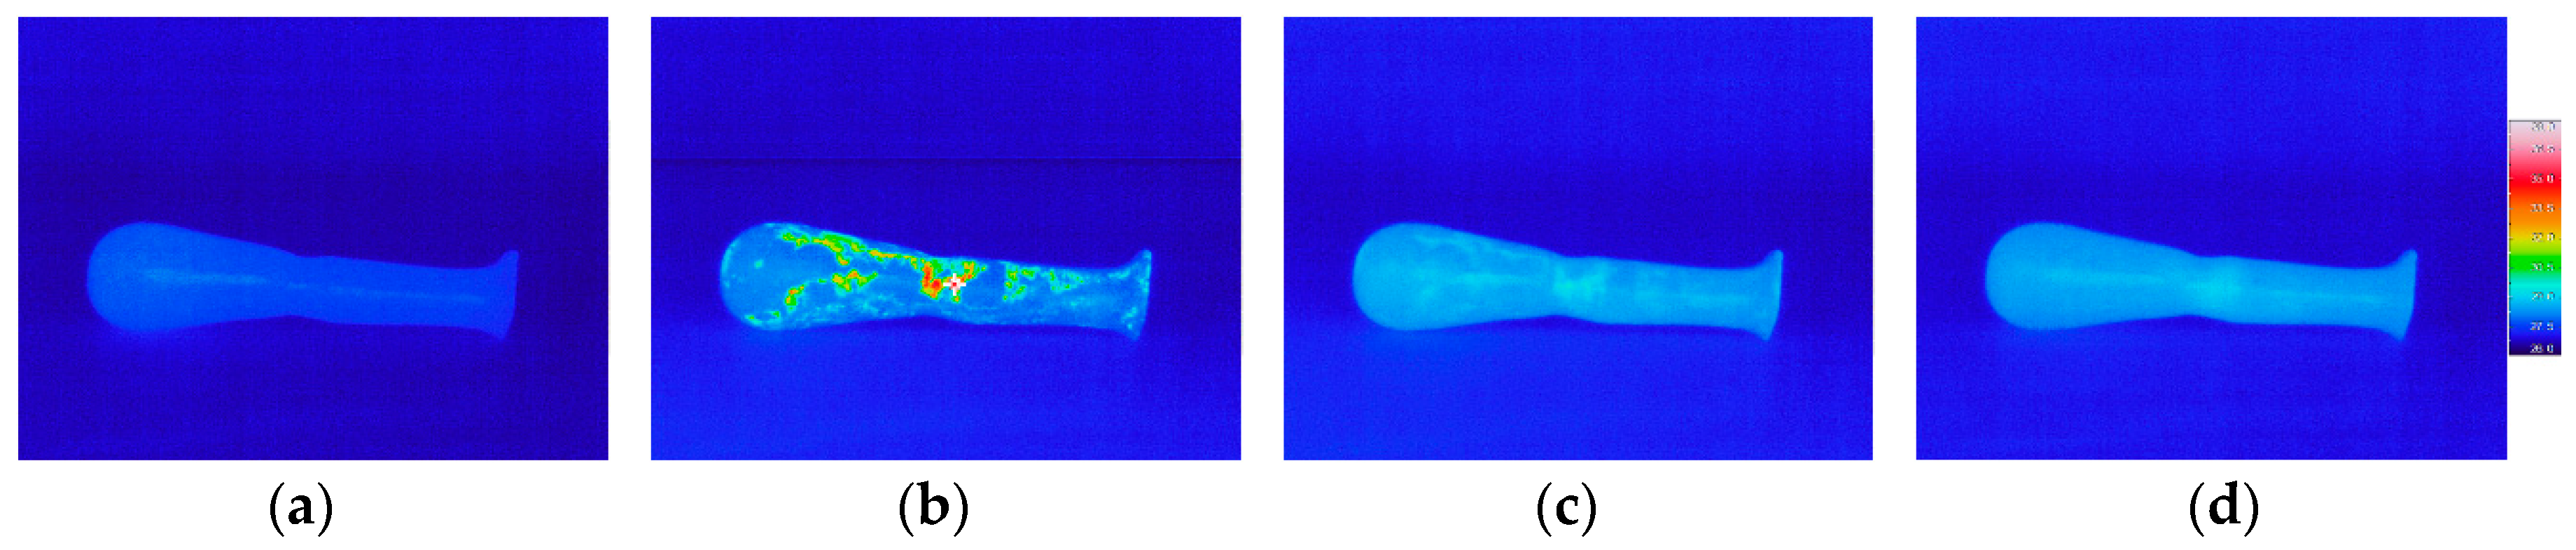
Figure 4.
Kurtograms of the sample 1462 with different excitation pulse: (a) flash lamps with white diffuser, (b) flash lamps with blue filter, (c) flash lamps with red filter and (d) square pulse with halogen lamps.
Figure 4.
Kurtograms of the sample 1462 with different excitation pulse: (a) flash lamps with white diffuser, (b) flash lamps with blue filter, (c) flash lamps with red filter and (d) square pulse with halogen lamps.

Publisher’s Note: MDPI stays neutral with regard to jurisdictional claims in published maps and institutional affiliations. |
© 2019 by the authors. Licensee MDPI, Basel, Switzerland. This article is an open access article distributed under the terms and conditions of the Creative Commons Attribution (CC BY) license (https://creativecommons.org/licenses/by/4.0/).
Share and Cite
MDPI and ACS Style
Melada, J.; Ludwig, N.; Micheletti, F.; Orsilli, J.; Gargano, M.; Bonizzoni, L. Flash Thermography Mapping of Degradation Patterns in Archaeological Glass. Proceedings 2019, 27, 5. https://doi.org/10.3390/proceedings2019027005
AMA Style
Melada J, Ludwig N, Micheletti F, Orsilli J, Gargano M, Bonizzoni L. Flash Thermography Mapping of Degradation Patterns in Archaeological Glass. Proceedings. 2019; 27(1):5. https://doi.org/10.3390/proceedings2019027005
Chicago/Turabian StyleMelada, Jacopo, Nicola Ludwig, Francesca Micheletti, Jacopo Orsilli, Marco Gargano, and Letizia Bonizzoni. 2019. "Flash Thermography Mapping of Degradation Patterns in Archaeological Glass" Proceedings 27, no. 1: 5. https://doi.org/10.3390/proceedings2019027005