Proceeding Paper

Infrared Thermography for DIEP Flap Breast Reconstruction Part II: Analysis of the Results †

1
Op3Mech Research Group, University of Antwerp, Groenenborgerlaan 171, B-2020 Antwerp, Belgium
2
Gynecological Oncology Unit, Department of Obstetrics and Gynecology, Multidisciplinary Breast Clinic, Antwerp University Hospital, University of Antwerp, B-2650 Antwerp, Belgium
*
Author to whom correspondence should be addressed.
Presented at the 15th International Workshop on Advanced Infrared Technology and Applications (AITA 2019), Florence, Italy, 17–19 September 2019.
These authors contributed equally to this work.
Proceedings 2019, 27(1), 49; https://doi.org/10.3390/proceedings2019027049
Published: 3 December 2019

Abstract

:
Dynamic infrared thermography (DIRT) has been used to locate perforating vessels and to assist in reconstructive breast surgery. Qualitative information on the perforating vessels is obtained by analysing the rate and pattern of rewarming of hot spots which are easily registered with an infrared camera. Thermal measurements are made before and during surgery and are compared with the CT-images available before operation. The thermal images can provide the individual influence of each perforator on the flap, as well as the dimensions of the perfused area. We will investigate if the influence of the different dominant perforators can be assessed by dynamic infrared thermography as a useful tool for recostructive DIEP-flap surgery.

1. Introduction

This manuscript will analyse the results from the thermal data gathered during a breast reconstruction. The mentioned measurements took place between September 2018 and May 2019. The measurements are divided into 2 sections: pre- and per-operative measurements.
  • Preoperative: Trying to pinpoint the exact location of the dominant perforators.
  • Intraoperative: Mapping the specific influence of each perforator on the abdominal flap regarding blood supply. As well as defining the perfused area of the flap after transplantation.
It is important to know what criteria are involved when determining the most suitable perforators. First of all, it is important that the perforator has a well-developed branching pattern right after passing through the abdominal muscles and the fascia [1]. This usually ensures that the perforator perfuses enough tissue of the abdominal flap to reconstruct into a breast. Secondly, the diameter of the main stem of the perforator must be wide enough. This ensures a sufficient flow rate of blood to perfuse a large enough area of the abdominal flap. And lastly, the way the perforator passes through the rectus abdominis muscle, as this will determine the dissection time. For example, a perforator which goes through the muscle at a low inclination has a longer path through the muscle. This will increase the dissection time as opposed to a perforator which goes straight up through the rectus abdominis. The surgeons tend to choose perforators which lie near the medial line and close to the umbilicus. Lateral perforators have a higher chance of being dominant in comparison to medial perforators [2]. To conclude, the 3 most important properties used in determining the best-suitable perforators are:
  • The degree of branching by the vascular network.
  • Diameter of the considered perforator.
  • The way the considered perforator passes though the rectus abdominis.

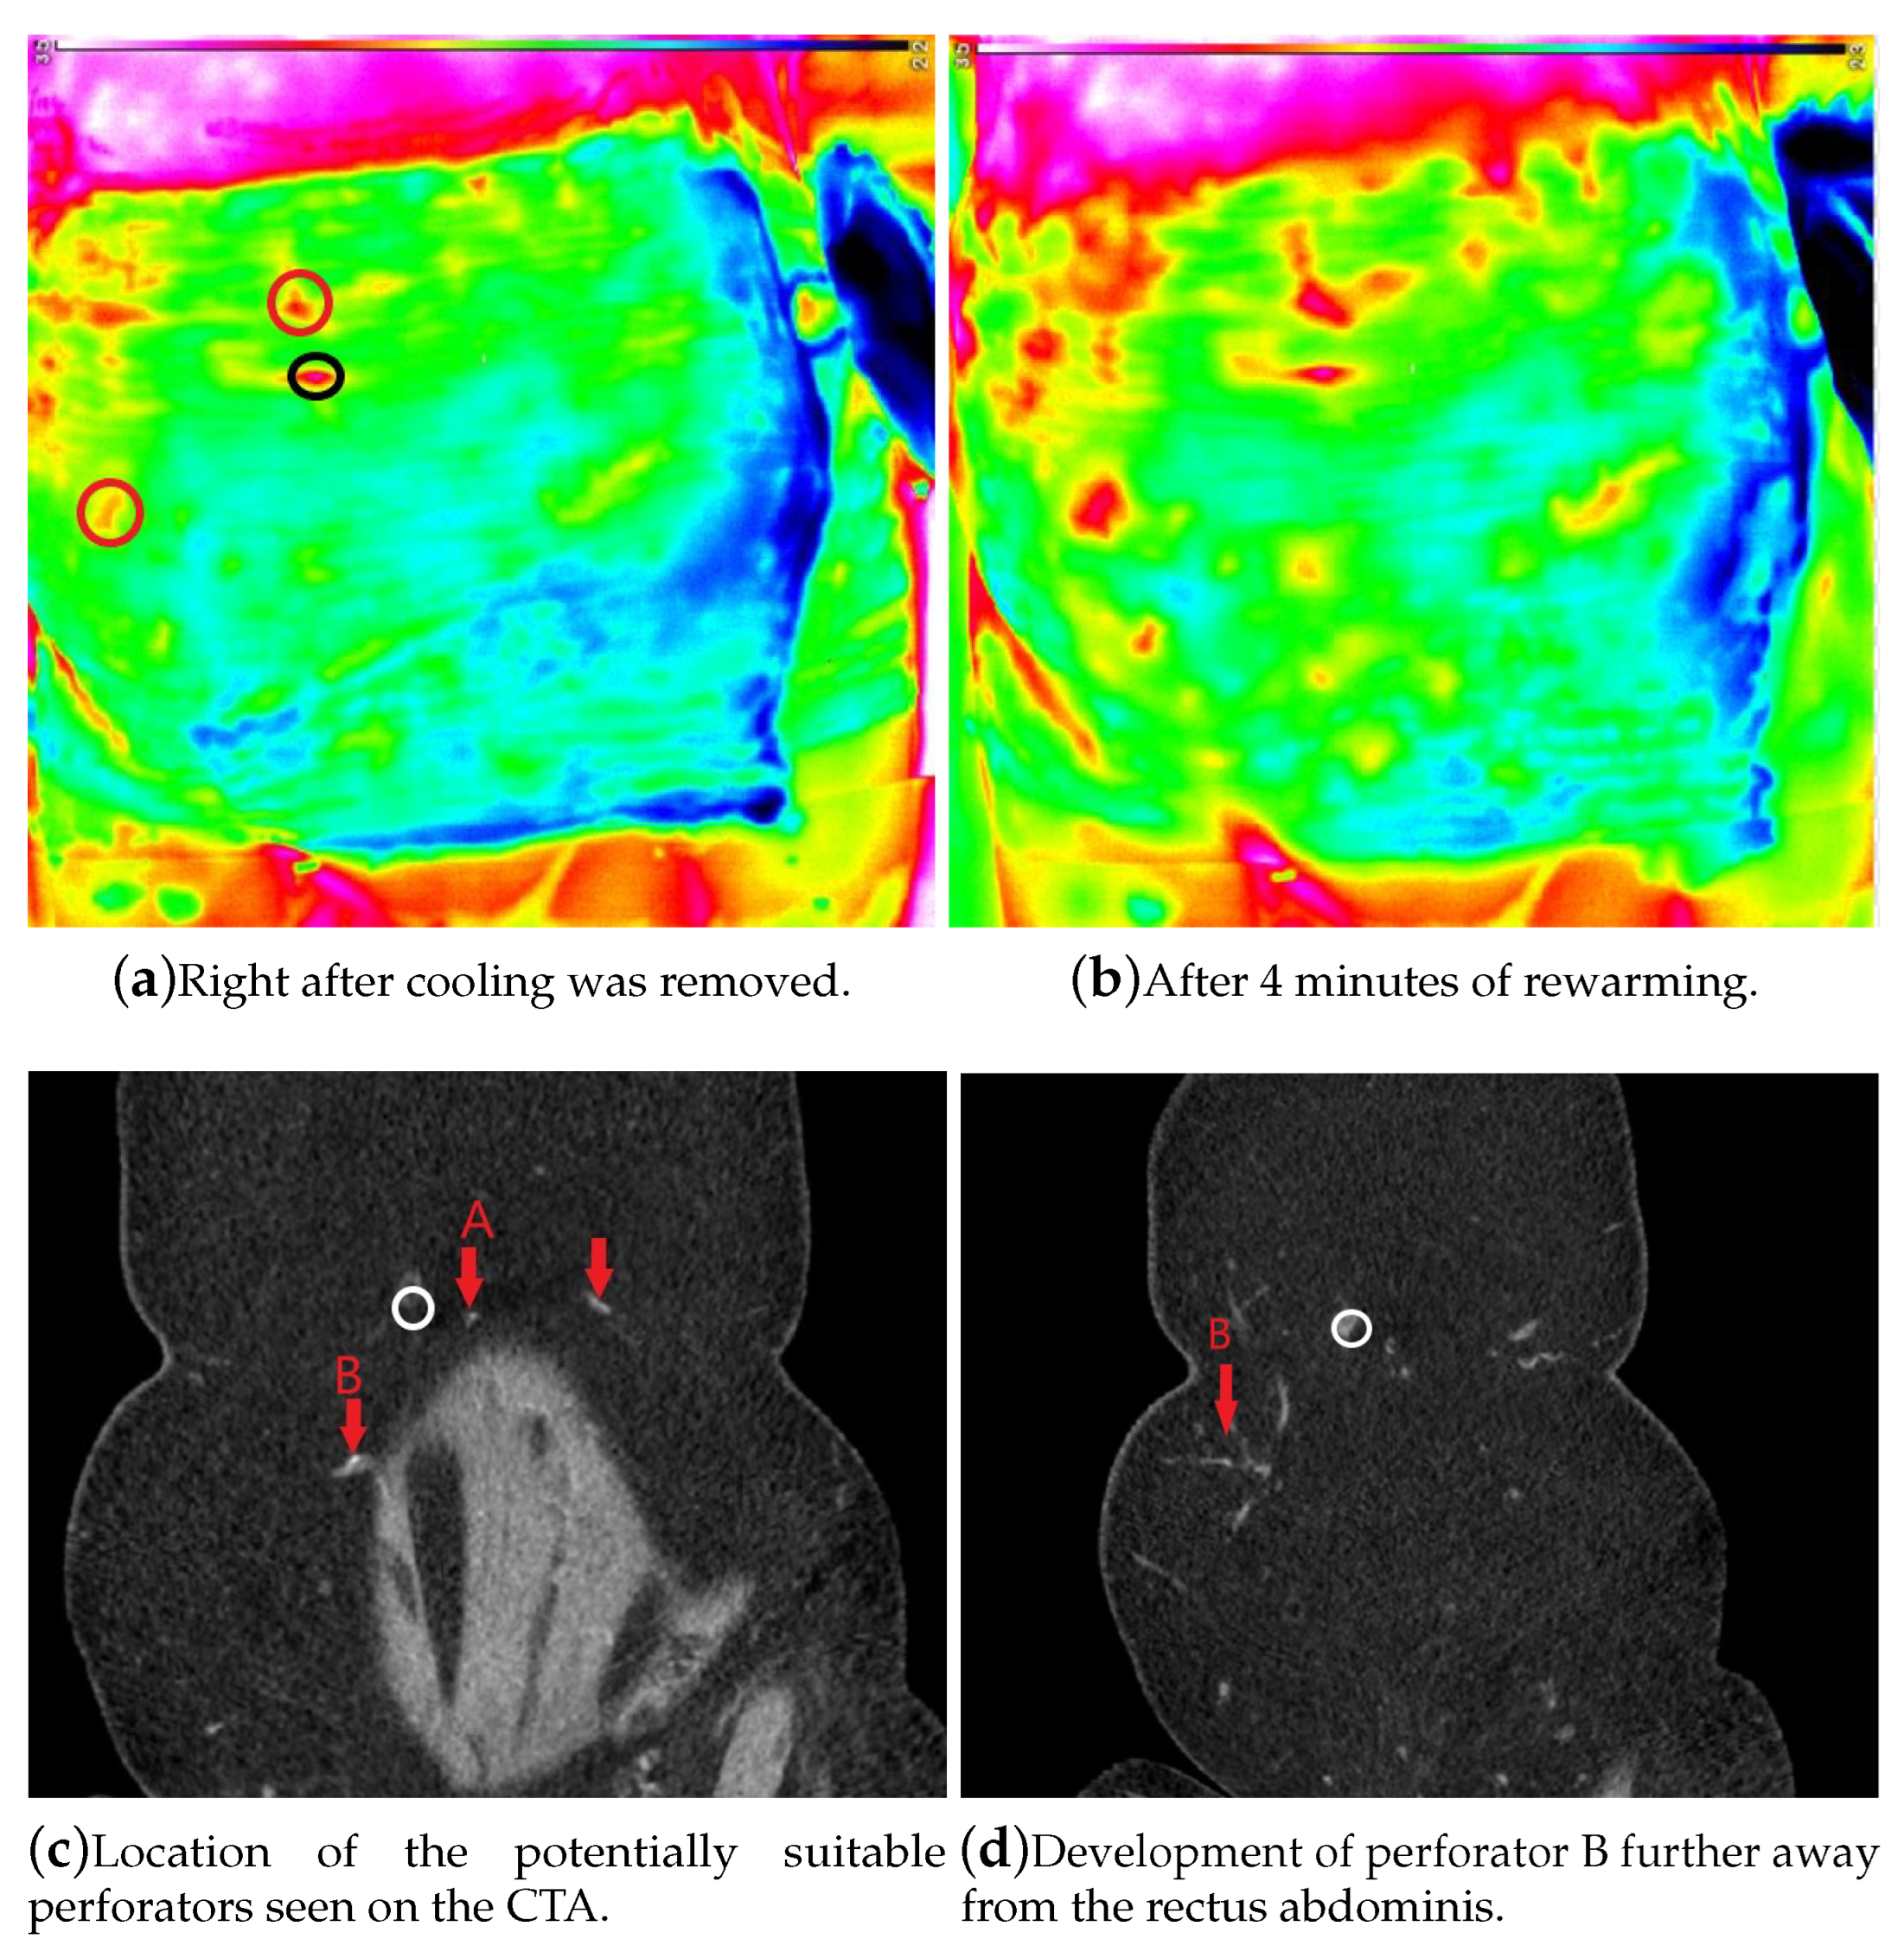
2. Preoperative Measurements

The most explicit hotspots are encircled in red. In the following subfigure (c), the locations where the perforators pass through the fascia according to the CTA-images is represented. The actual CTA images are slices right above and parallel to the fascia. The black circle on the drawings represents the umbilicus. This makes linking the locations on the different images possible. On the actual CTA images the umbilicus is represented by a white circle. During the measurements the abdomen is cooled with a sterile plastic bag filled with ice and water. By comparing the locations of the hotspots right after the cooling was removed with the locations of the perforators as seen on the CTA, we can investigate the viability of the method used. On the following thermal images the umbilicus has been encircled with a black circle (same presentation as on the drawings).

Pinpointing the Perforator Locations

The hotspots on Figure 1a can be correlated to the locations of perforators A and B Figure 1c. The locations of the perforators and the hotspots however do not match exactly. Yet, the hotspots are in the close vicinity of the actual perforator locations. By following the perforators on CTA images as they get further away from the rectus abdominis, the hotspot locations on the thermal images become evident. For example, on Figure 1d it becomes clear that perforator B branches out to the left on its way towards the skin. This explains why there is a hotspot more to the left on Figure 1a To the left of the upper hotspot on Figure 1a is an inconsistently warmed area caused by uneven cooling.

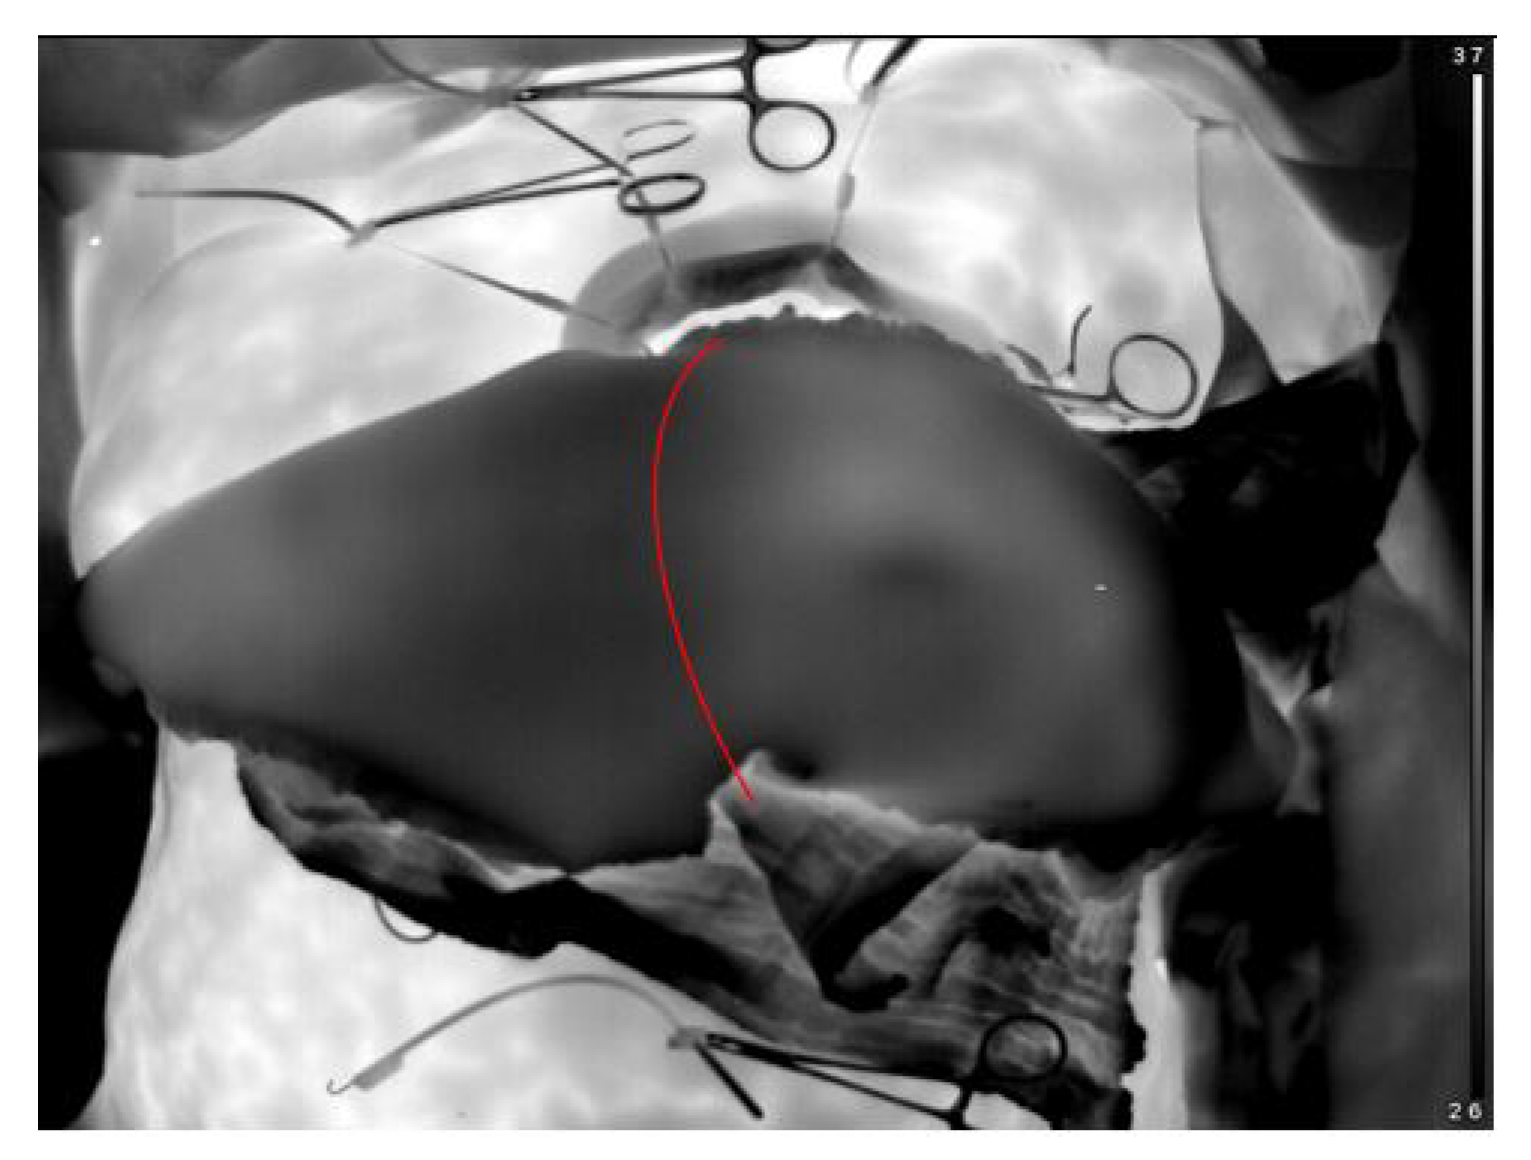
3. Intraoperative Measurements

The intraoperative measurements for mapping the influence of a specific perforator will determine what areas of the abdominal flap are perfused by the perforator (Figure 2). This information could influence the choice of considered perforators. This, of course, in a situation where there are multiple best-suited perforators. Perforators can seem to have similar properties on the CTA, yet their heated areas of the abdominal flap will have a different surface areas. The perforator that perfuses the largest part of the abdominal flap is most likely chosen as pedicle.
Once again, this only applies when the other criteria mentioned above are more or less equal for considered perforators. Currently, the choice of what area of the abdominal flap is used for transplantation is a clinical evaluation based on CTA images and the experience of the operating surgeon. The overall success rate of the DIEP flap breast reconstruction surgery fluctuates around 86 percent [3]. Yet, there is room for optimization in the choice of the specific area out of which a safe reconstruction can be done. The surgeons do not exactly and with certainty know the maximum surface area perfused by the chosen perforators when examining the CTA images.

Determining the Maximal Perfused Area

As illustrated in Figure 3, it becomes possible to distinguish the colder from the warmer areas on the abdominal flap. The warmer areas indicate blood perfusion and thus a lower chance of necrosis after transplantation. It now becomes possible to paste red lines onto the steady state images which will mark the separation line between the warmer and the colder areas caused by the chosen connected perforator. However, defining the well-perfused area has to be done by analysing the reheating process over the ca. 5 min following the clamp removal after the anastomosis has been completed. This will ensure the visualised temperature difference on the thermal images is solely produced by the reintroduction of warm blood. Just a steady state image will have a different surface area because of the conductive heating of the flap by the perfusion. These thermal images could help the surgeon to quickly decide which parts of the abdominal flap to use for the actual reconstruction of the breast.

4. Conclusions

The thermal images provide the individual influence of each perforator on the flap, as well as the dimensions of the perfused area. This additional information is an asset when determining the best-suited perforator(s) for transplantation. The thermal measurements provide the surgeon with a real-time visualization of the considered perforators and their influence on the flap. This additional information can definitely optimize the choice of perforator and the determination of the maximal perfused area of the flap. The visual separation between the warmer, perfused area and the colder area can visualize the sections that will possibly develop necrosis just by analysing a 5 min measurement.

Funding

This research was funded by the University of Antwerp and the Institute for the Promotion of Innovation by Science and Technology in Flanders (VLAIO) via support for the TETRA project, “SINT: Smart Integration of Numerical modeling and Thermal inspection”, project number HBC.2017.0032. The researchers received funding from the Antwerp University IOF-council through project PSID-34924 entitled “Fast Broadband Lock-In Thermography for Fragile Structures Using System Identification”.

Acknowledgments

The authors would like to thank Ralv Lundahl and the UZA medical staff for the support on the preliminary measurements.

Conflicts of Interest

The authors declare no conflict of interest.

References

  1. Sven Weum, J.M.; de Weerd, L. Evaluation of dynamic infrared thermography as an alternative to CT angiography for perforator mapping in breast reconstruction: A clinical study. BMC Med. Imaging 2016, 16, 43. [Google Scholar]
  2. Hamdy, H.H.; El-Mrakby, R.H.M. The vascular anatomy of the lower anterior abdominal wall: A microdissection study on the deep inferior epigastric vessels and the perforator branches. Plast Reconstr. Surg. 2002, 109, 539–543. [Google Scholar] [CrossRef]
  3. Bonomi, S.; Sala, L.; Cortinovis, U. Optimizing Perforator Selection: A Multivariable Analysis of Predictors for Fat Necrosis and Abdominal Morbidity in DIEP Flap Breast Reconstruction. Plast Reconstr. Surg. 2019, 143, 887–888. [Google Scholar] [CrossRef] [PubMed]
Figure 1. Measurement taken on 28-09-2018 during reconstructive breast surgery.
Proceedings 27 00049 g001
Figure 2. Intraoperative measurement 12-10-2018. The influence on the flap of perforator A can be deduced by sutracting the influence of perforator B in subfigure (a). Perforator B was eventually chosen for transplantation because its heated/perfused area is much larger than the heated/perfused area of perforator A.
Proceedings 27 00049 g002
Figure 3. Intraoperative measurement 28-09-2018. Perforator B was anastomosed to the chest artery. This image depicts the flap 5 min after a bloodflow was reintroduced. Therefore, this is a steady state image that indicates the maximal surface area of the flap that could safely be used for reconstruction. The red line represents the separation line between the well-perfused warm area and the colder area.
Proceedings 27 00049 g003

