Simulation of Extrasolar Planet Detection with Rotationally Shearing Interferometer at 10 µm †

Optical Research Center, Apdo. Postal 1-948, 37150 Leon, Gto., Mexico
*
Author to whom correspondence should be addressed.
†
Presented at the 15th International Workshop on Advanced Infrared Technology and Applications
(AITA 2019), Florence, Italy, 17–19 September 2019.
Proceedings 2019, 27(1), 44; https://doi.org/10.3390/proceedings2019027044
Published: 10 October 2019
(This article belongs to the Proceedings of The 15th International Workshop on Advanced Infrared Technology and Applications)
Abstract
:We simulate the interferometric fringe patterns for the case of an extrasolar planet system with two planets. We show that the incidence distributions become more complicated, yet their interpretation is feasible. The generalized fringe distributions rotate when the Dove prism is rotated. Likewise, the number of fringes changes with the angle of rotation of the Dove prism.
1. Introduction
We have been studying the challenging task of detecting a small, dark object in the vicinity of a bright, large one, as exemplified by a dark planet next to a bright star. Figure 1 illustrates the ratio of the number of photons emitted by the bodies in the solar system, normalized to the Sun at 0.55 µm, as detected by a 1-m-square-aperture at the distance of observation of 10 parsecs. Due to the difficulty of recording and detecting in the same photograph or a frame two sources with their intensities having a ratio of 10−6, different research groups have proposed various techniques to address this challenge.
So far, the most successful methods, in terms of planet detection, have been the transit method and the occultation technique. They both detect a change in radiation when a planet is in front of or next to a star.
2. Rotationally Shearing Interferometer
We have demonstrated that the rotationally shearing interferometer (RSI) may be used to detect a planet next to a bright star, because it erases the star-emitted radiative signal upon the wavefront rotation and signal subtraction. In our publications, we refer to the star as Estrella, because all the stars to form potentially a solar system already have a name. Tierra denotes a potential planet.
The RSI based on a Mach-Zehnder layout incorporates a movable, rotary Dove prism in one arm to rotate the beam and a stationary one to compensate the optical path in the reference arm. Furthermore, we introduce a periscopic arrangement in each interferometer arm as a phase retarder to enhance the fringe visibility. The layout incorporating two optical path modulators, one in each arm, is presented in Figure 2.
3. Fringe Visibility
The interferogram that is generated in the detection plane due to optical path difference in the calculation to determine the fringe visibility. The maximum (Vmax) and minimum incidance (Vmin) values are found. Incidance is the incident power per unit area in the detection plane. Finally, the fringe visibility (V) may be found.
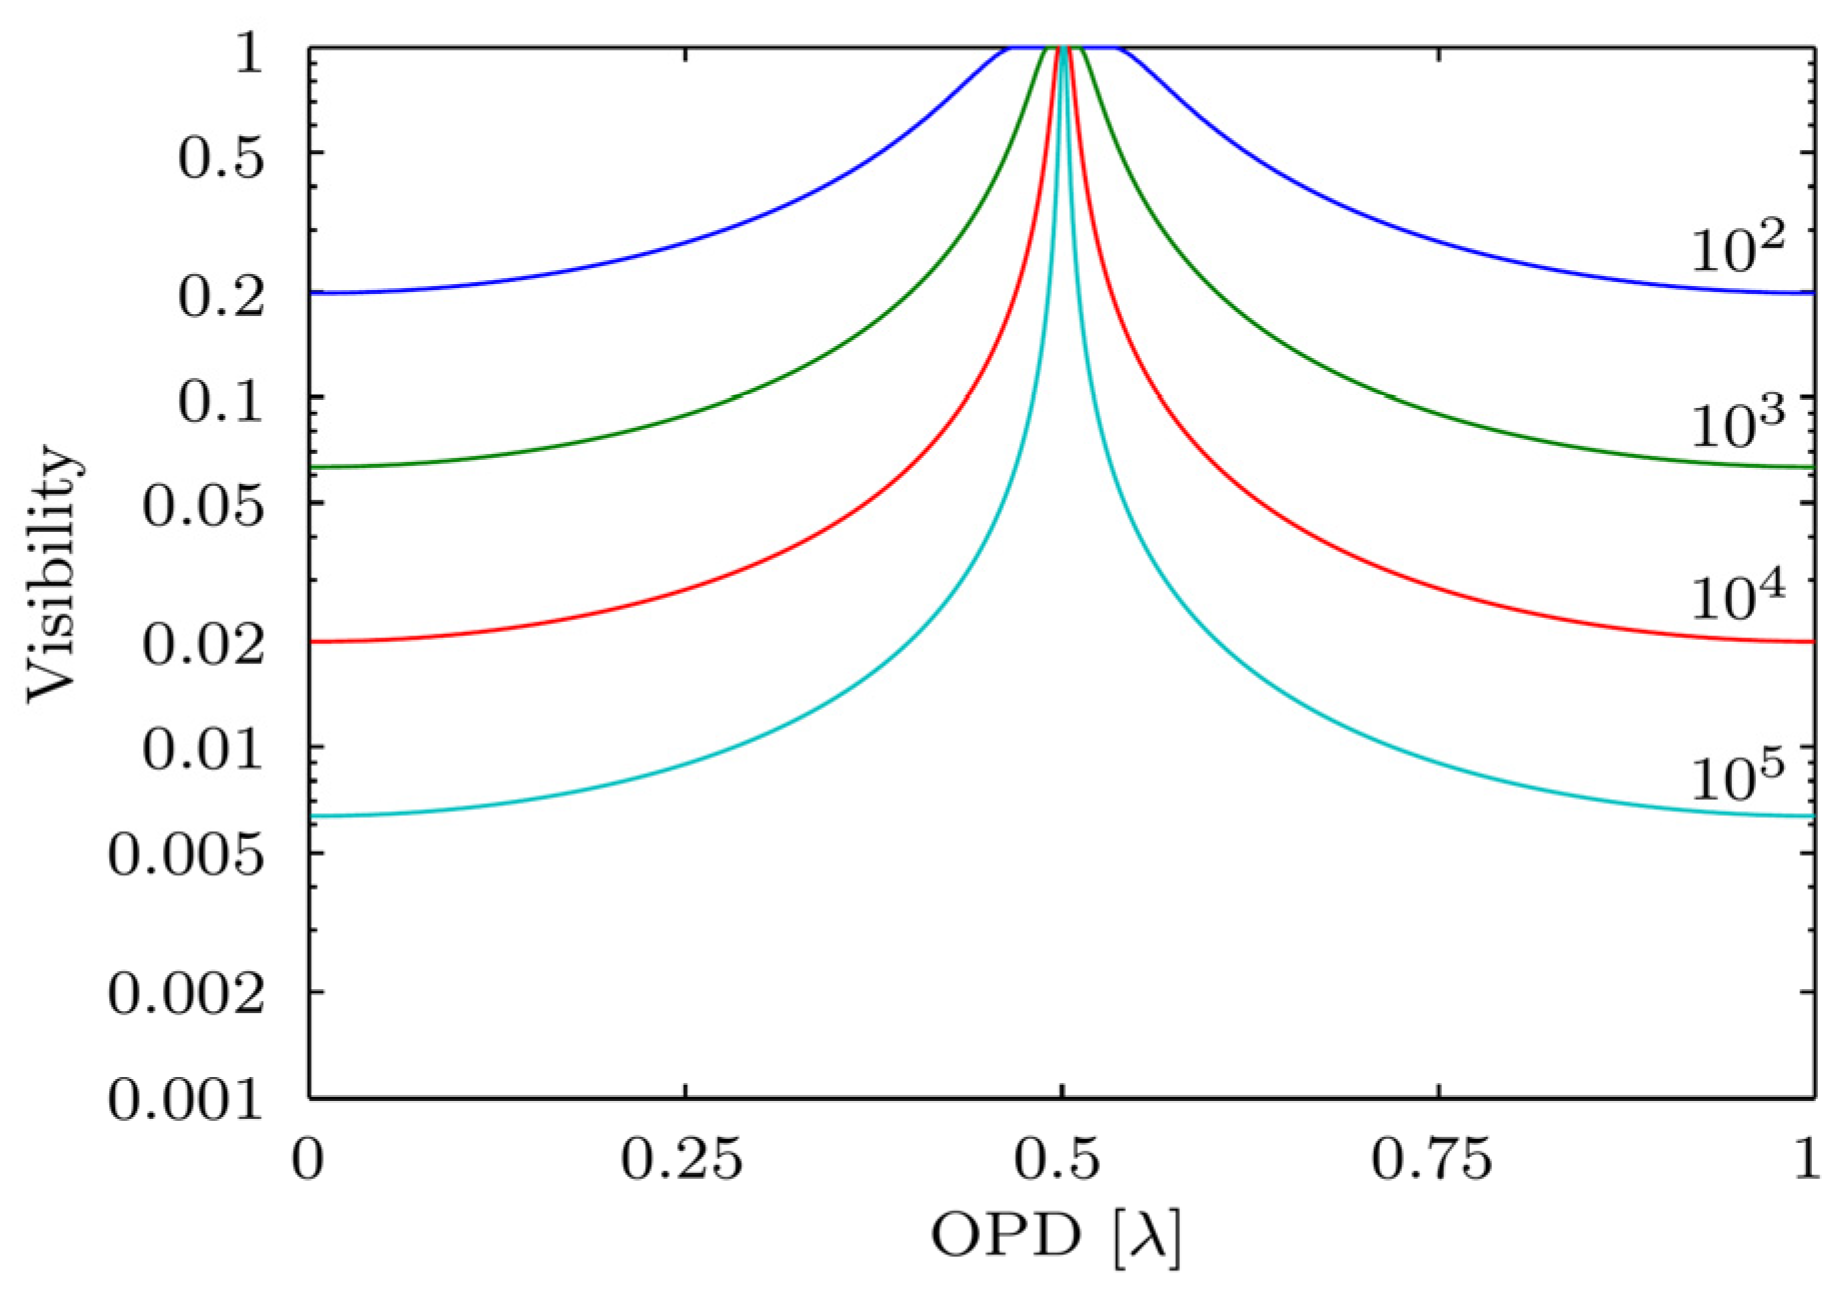
The resulting visibility is 1 when the difference of optical paths in the interferogram arms is equal to half of the wavelength. The visibility drops to 6 × 10⁻³ when the optical path difference within the interferometer is a multiple of the wavelength for a ratio of intensities of 100,000 to 1. This is illustrated in Figure 3 for a number of intensity ratios. Intensity is the power emitted per unit solid angle of a point source. According to Figure 1, this ratio is 10−9 in the visible, 10−5 in the infrared and 3 × 10⁻⁴ in the sub-mm region, around 350 µm.
If the interference takes place between a Jupiter-type planet and a Sun-like star, the number of fringes depends on the distance of the solar system from the detecting system (on or around the Earth) and the wavelength of observation and detection.
Figure 3.
Fringe visibility is displayed vs OPD with the intensity ratio as a parameter. The resulting visibility is 1 when the difference of the optical paths in the interferogram arms is equal to one half of the wavelength. The visibility drops to 6.3 × 10⁻³ when the optical path difference within the interferometer is a multiple of the wavelength, for the intensity ratio of 105.
The distance between the Sun and the Jupiter is approximately 5 AU (Astronomical Units), so at a distance of 1 parsec the fringe angular separation of 5 arc seconds may be achieved. For other distances the angular separation may be determined by dividing 5 arc seconds with the distance to the star in parsecs.
4. Results
Next we consider the interference patterns generated when the wave fronts of the planets in the solar system interfere with the rotated version of themselves.
The number of fringes detected in each interferogram depends on the rotation of one wave front relative to the other. The angle between the wave fronts is 0 (zero) when its angle of rotation of a Dove prism is 0. The angle of rotation between wave fronts is twice the angular separation between the planet and the optical axis when the rotation angle between prisms is less than π.
To determine the angle between both wave fronts for the simulation, the angle between their normal vectors (VN1 and VN2) is determined as the arc-cos of the scalar product between them.
Knowing the angle and wavelength of observation, we to calculate the number of fringes per meter (NF).
Figure 4.
Number of fringes per meter in the observation plane as a function of the angle of rotation of the Dove prism for the Estrella-Tierra angular separation of 0.5 arcsec, at 10-µm wavelength.
Figure 4.
Number of fringes per meter in the observation plane as a function of the angle of rotation of the Dove prism for the Estrella-Tierra angular separation of 0.5 arcsec, at 10-µm wavelength.
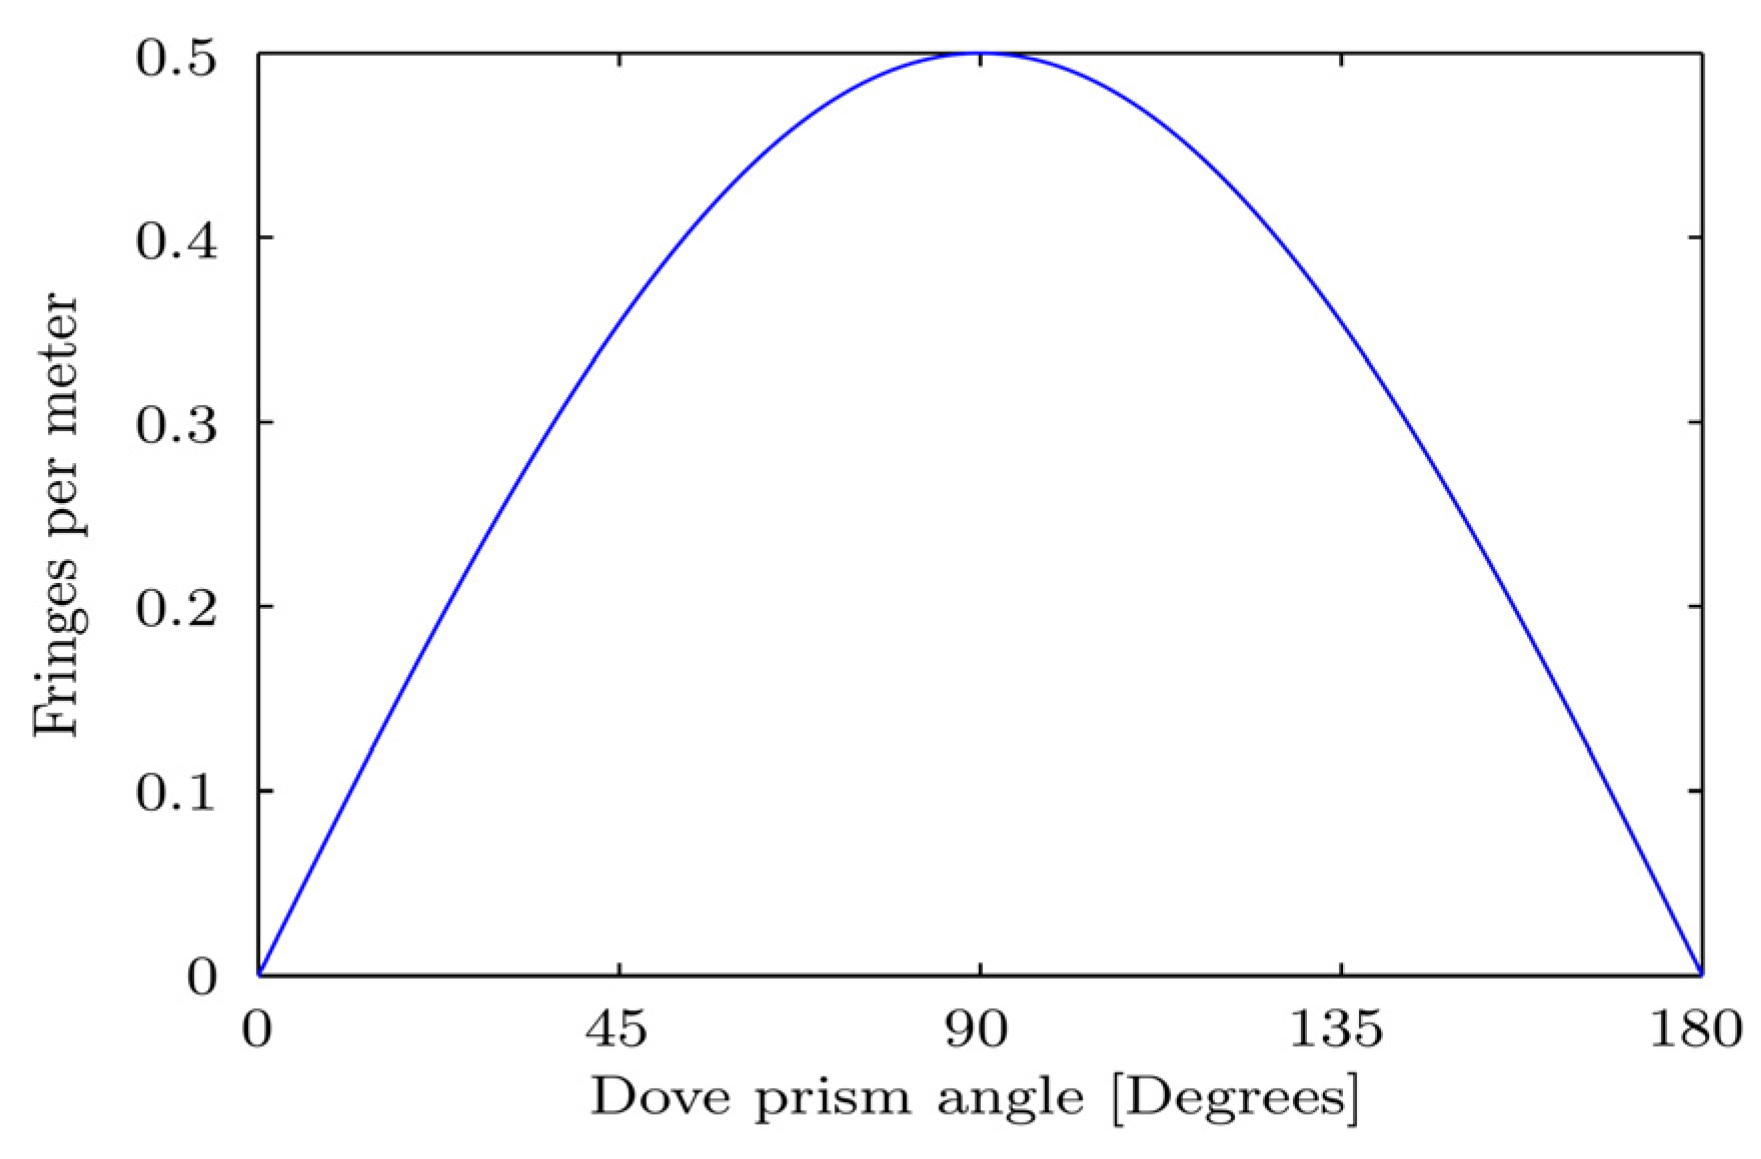
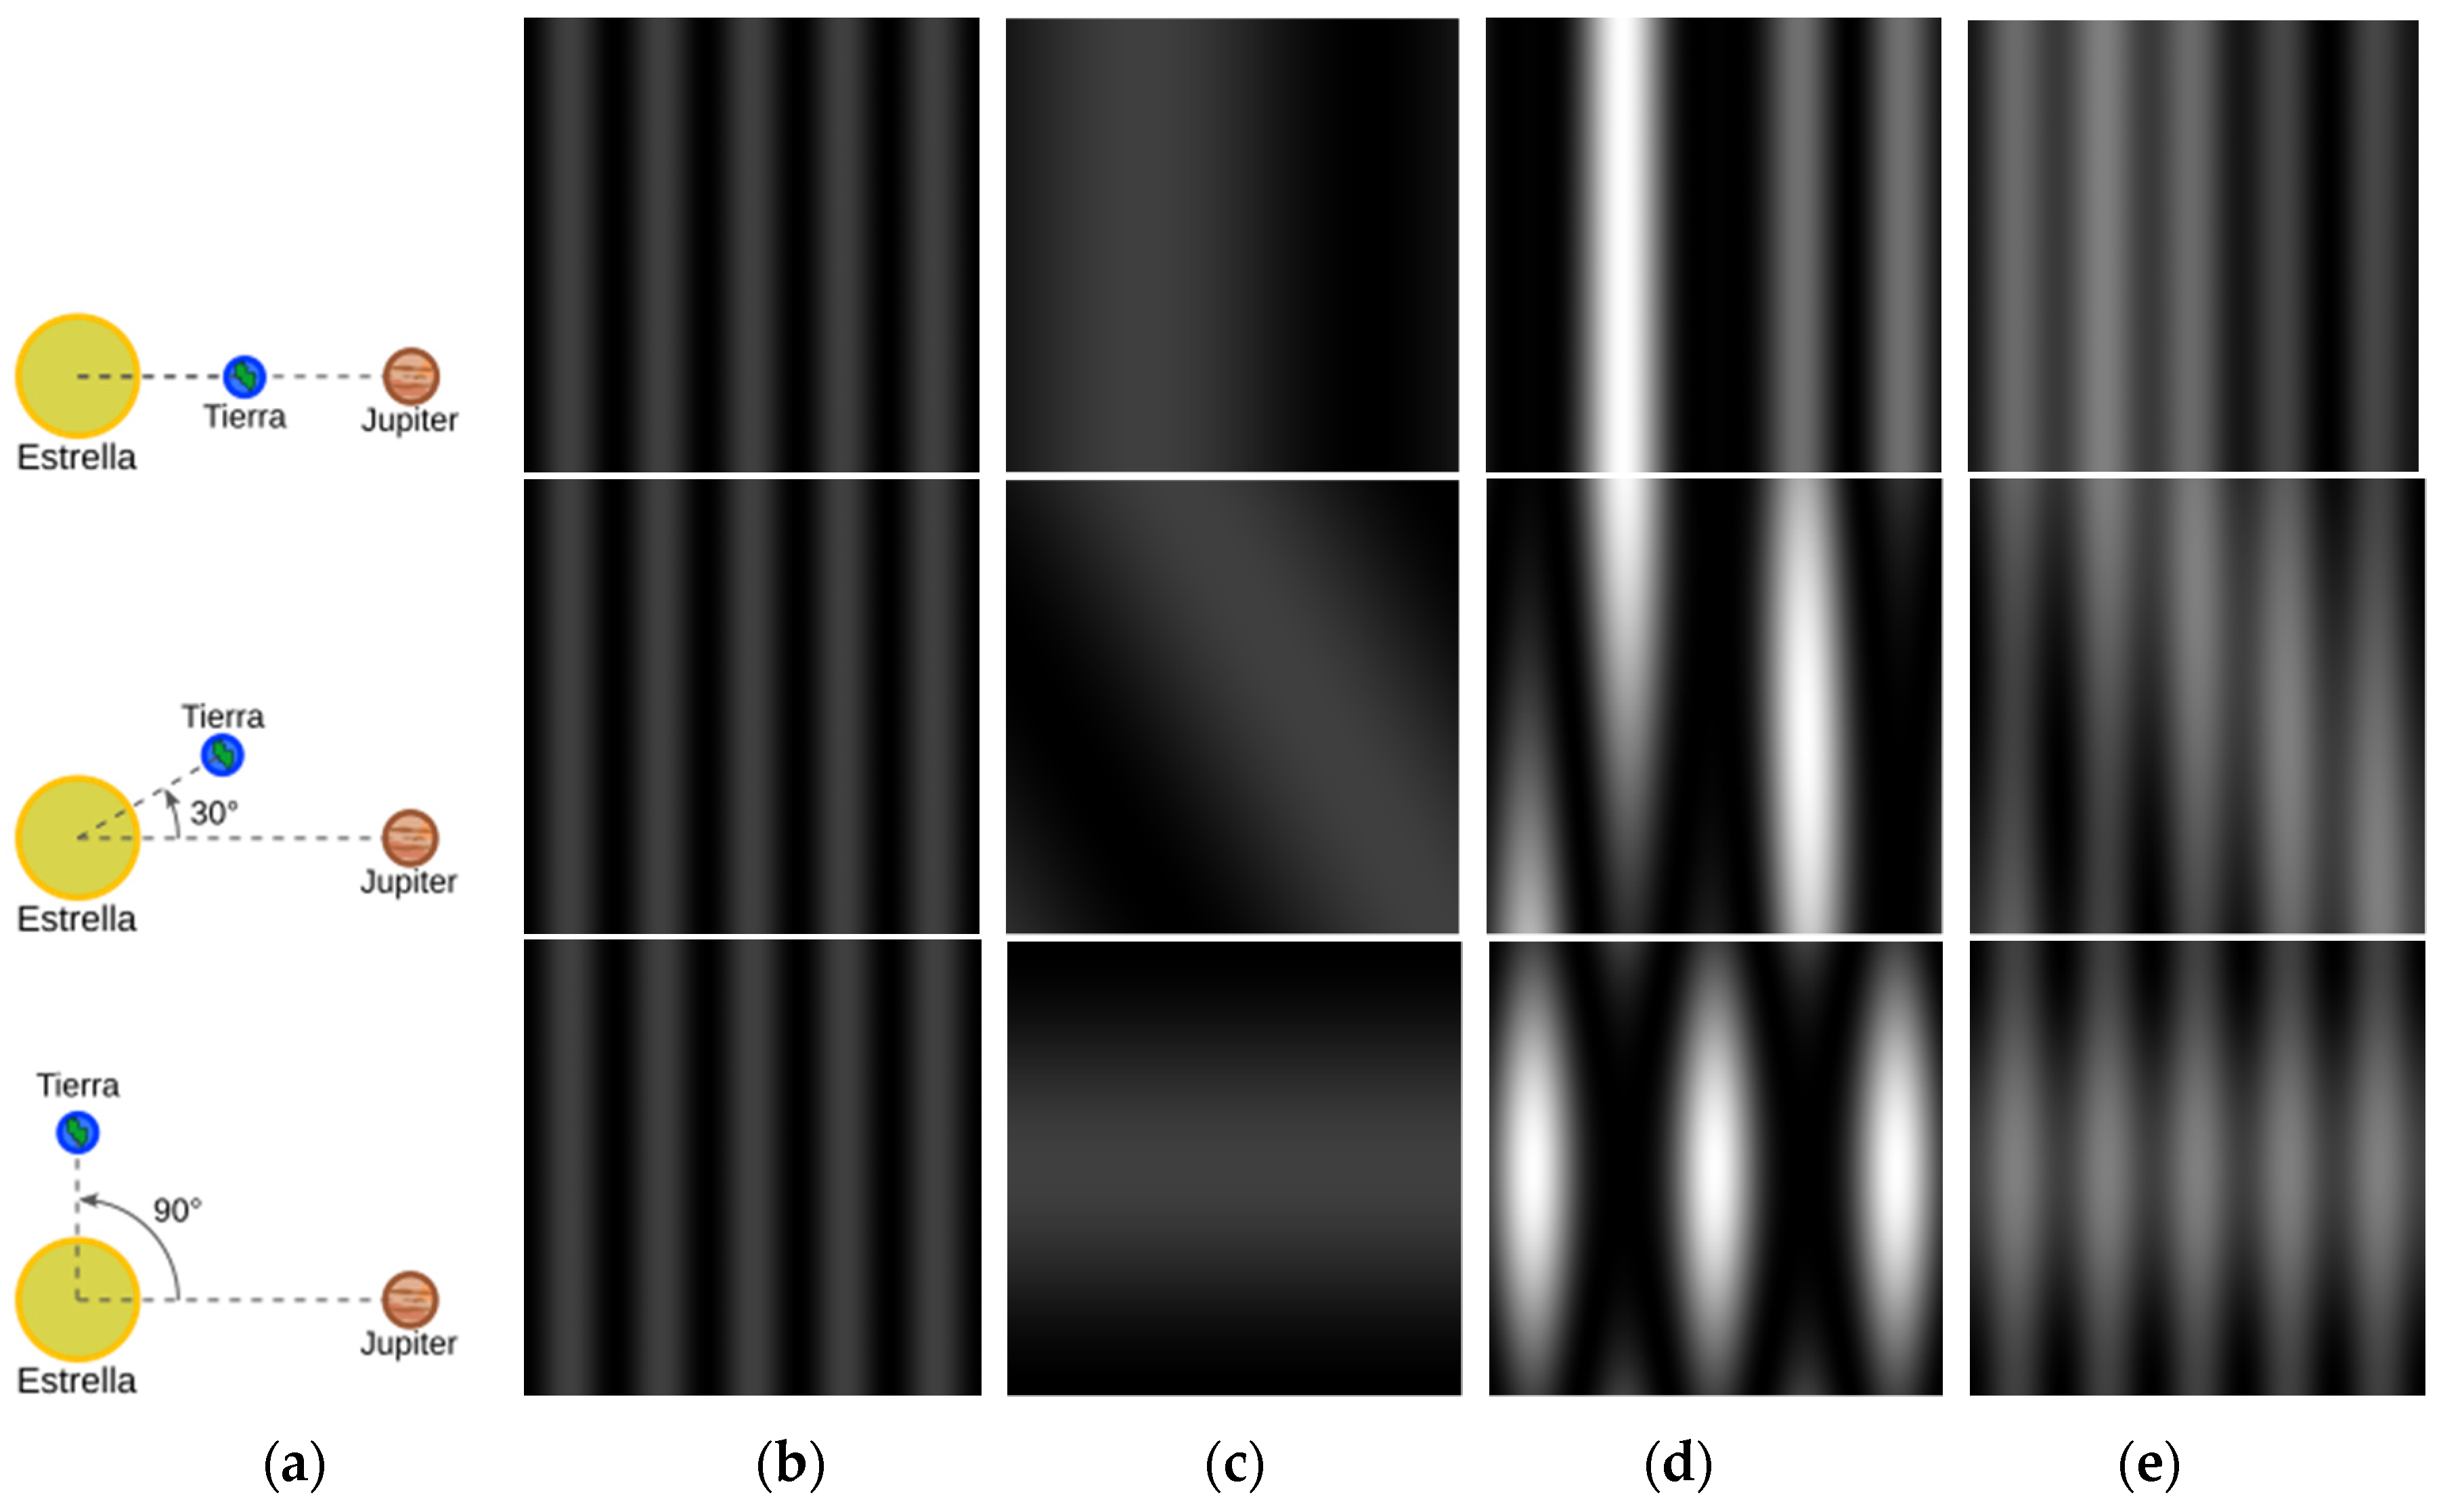
Figure 4 displays the number of fringes as a function of the rotation of the Dove prism for a planet with an angular separation from the star of 0.5 arc seconds (corresponding to a Jupiter-like planet at 10 parsec distance) and an observation wavelength of 10 microns. Figure 5 exhibits the simulated interference patterns produced by two planets with varying azimuthal angles (0°, 30°, 90°) when the optical path difference within the interferometer is equal to half the wavelength.
5. Conclusions
The rotational shearing interferometer allows the observers to distinguish between a dark, off-axis source (a planet) and a bright source on the axis (the star). The light source on the axis may be canceled when the difference of optical paths in the rotationally shearing interferometer is adjusted to half a wavelength, assuming the azimuthally symmetric wavefront from the star. We may also differentiate between the different off-axis sources (different planets, such as an Earth-like and a Jupiter-like planets) because the number of fringes and their inclination changes when the Dove prism is rotated during their rotation around the Star.
Author Contributions
Image processing and editing: B.B.-M.; Conceptualization, analysis and writing: M.S.
Acknowledgments
This material is based upon work supported by the Air Force Office of Scientific Research under award number FA9550-18-1-0454.
Conflicts of Interest
The authors declare no conflict of interest.
Reference
- Scholl, M.S. Signal generated by an extra-solar-system planet detected by a rotating rotationally shearing interferometer. J. Opt. Soc. Am. A. 1996, 13, 1584. [Google Scholar] [CrossRef]
Figure 1.
Normalized number of spectral photons, emitted per unit time and area by Sun and various planets at 10 parsec from our solar system, vs wavelength [1].
Figure 1.
Normalized number of spectral photons, emitted per unit time and area by Sun and various planets at 10 parsec from our solar system, vs wavelength [1].
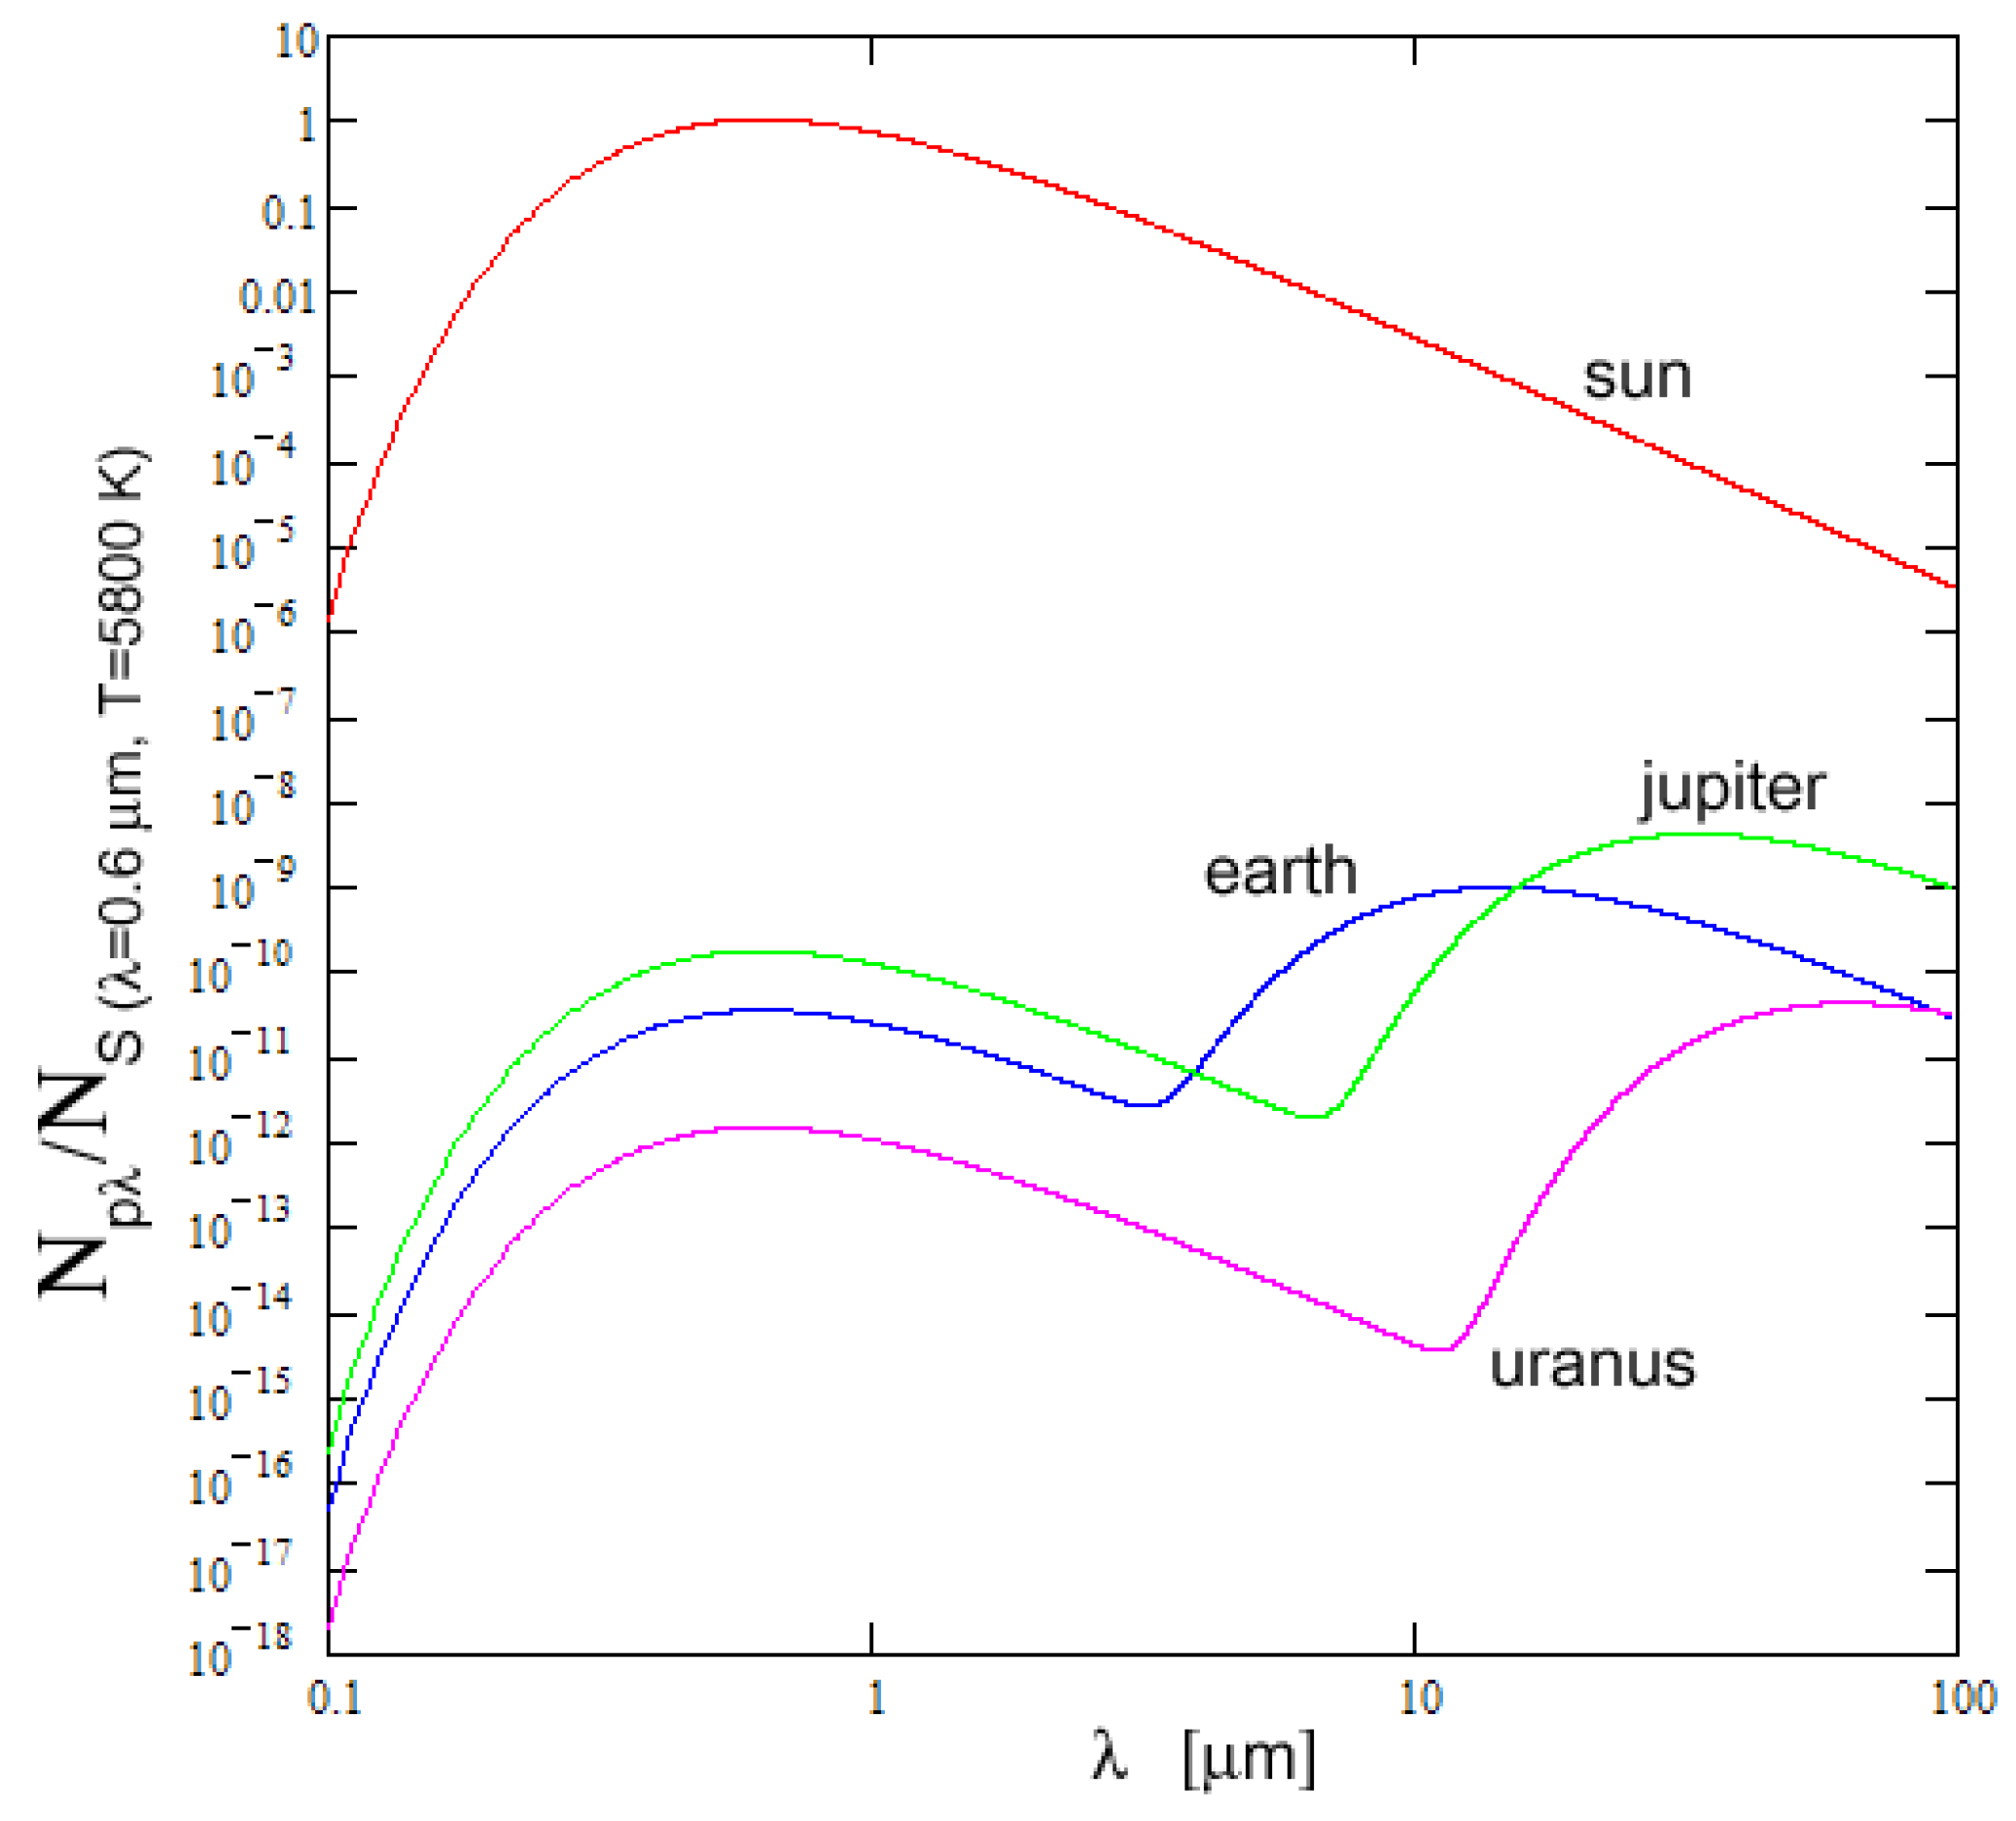
Figure 2.
A rotational shearing interferometer consists of a modified Mach-Zehnder interferometer, with Dove prisms to rotate the wavefront and a periscopic system as an optical path expander, in each arm.
Figure 2.
A rotational shearing interferometer consists of a modified Mach-Zehnder interferometer, with Dove prisms to rotate the wavefront and a periscopic system as an optical path expander, in each arm.
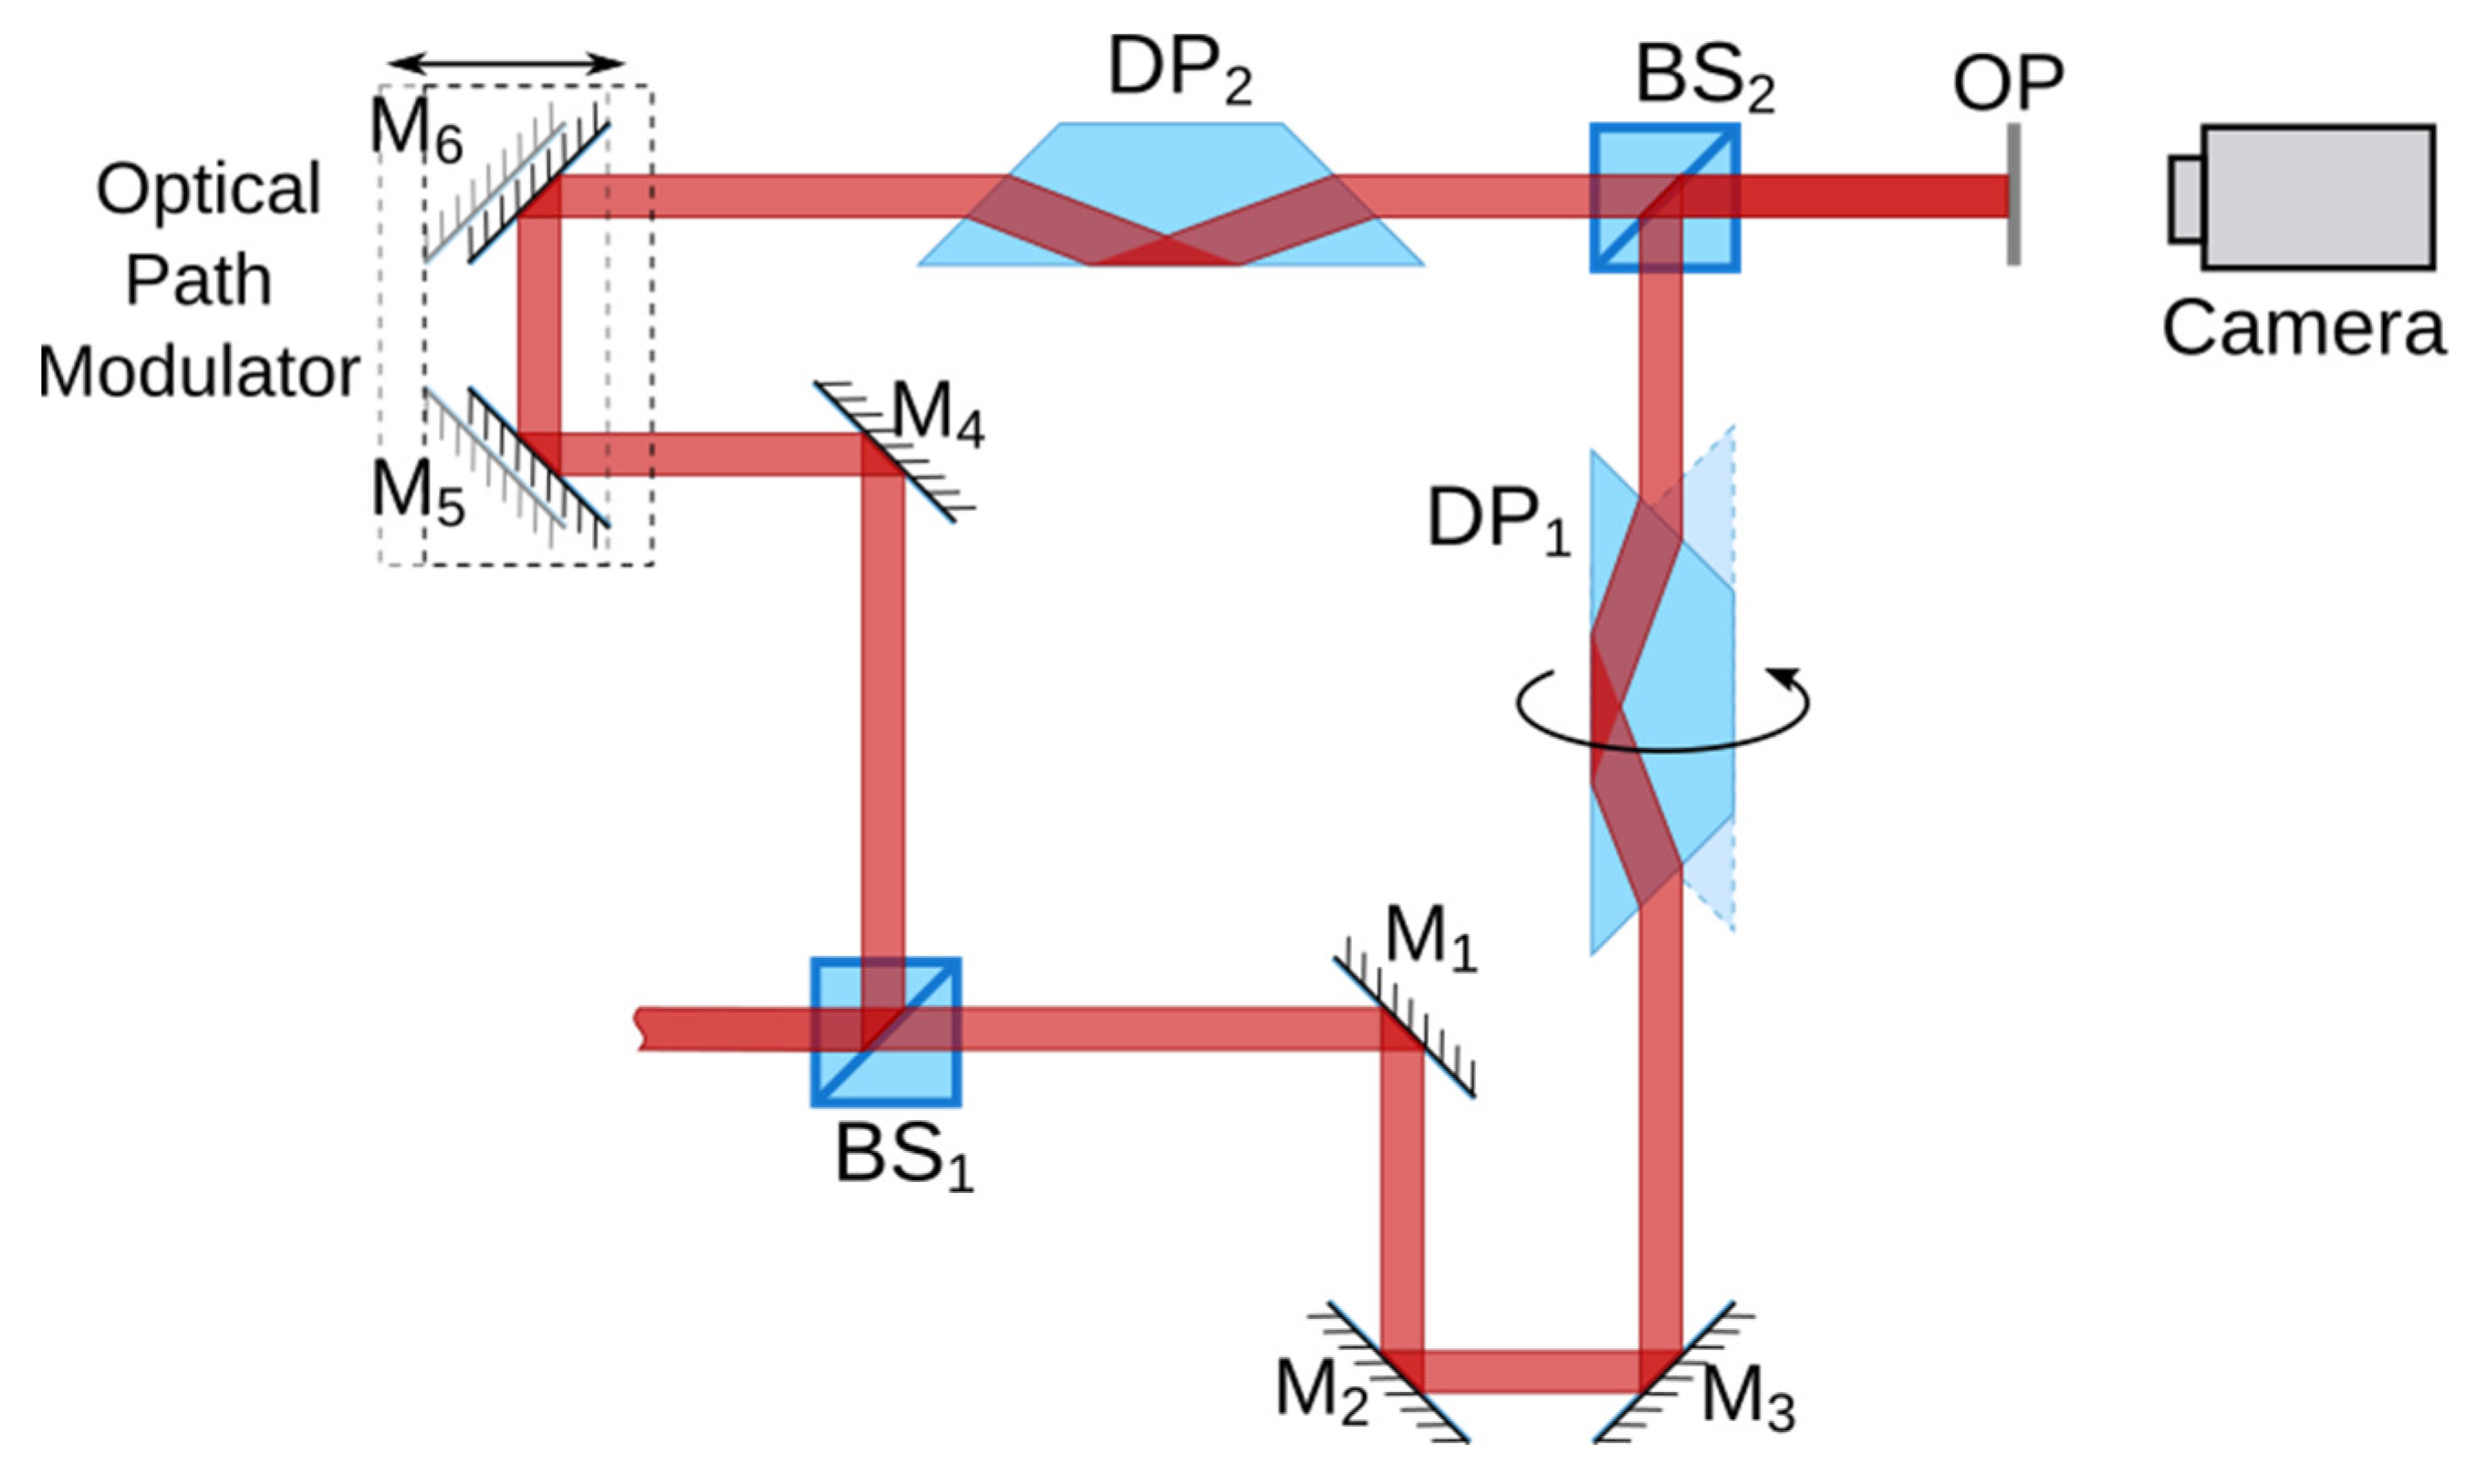
Figure 5.
Interference patterns produced by two planets with varying azimuthal angles (0°, 30°, 90°) between them when the optical path difference within the interferometer is equal to half of a wavelength. The distance of planet Jupiter from the Estrella corresponds to the Jupiter-like planet in our solar system, and that of the Tierra corresponds to the Earth. The incidance (power per unit area) from both planets is the same at the observation plane. Column (a) shows the diagram of the solar system configuration. Columns (b) through (e) illustrate the following special cases: (b) Tierra by itself; (c) Jupiter by itself; (d) Tierra and Jupiter interfere with each other and with themselves; (e) shows the sum of columns (b) and (c), neglecting the mutual interference between Tierra and Jupiter.
© 2019 by the authors. Licensee MDPI, Basel, Switzerland. This article is an open access article distributed under the terms and conditions of the Creative Commons Attribution (CC BY) license (https://creativecommons.org/licenses/by/4.0/).
Share and Cite
MDPI and ACS Style
Strojnik, M.; Bravo-Medina, B. Simulation of Extrasolar Planet Detection with Rotationally Shearing Interferometer at 10 µm. Proceedings 2019, 27, 44. https://doi.org/10.3390/proceedings2019027044
AMA Style
Strojnik M, Bravo-Medina B. Simulation of Extrasolar Planet Detection with Rotationally Shearing Interferometer at 10 µm. Proceedings. 2019; 27(1):44. https://doi.org/10.3390/proceedings2019027044
Chicago/Turabian StyleStrojnik, Marija, and Beethoven Bravo-Medina. 2019. "Simulation of Extrasolar Planet Detection with Rotationally Shearing Interferometer at 10 µm" Proceedings 27, no. 1: 44. https://doi.org/10.3390/proceedings2019027044