Proceeding Paper

The Use of 2D and 3D High-Speed Digital Image Correlation in Full Field Strain Measurements of Composite Materials Subjected to High Strain Rates †

MST-DyMaLab Research Group, Department EEMMeCS, Faculty of Engineering and Architecture, Ghent University, Tech Lane Ghent Science Park, Zwijnaarde 9052, Belgium
*
Author to whom correspondence should be addressed.
Presented at the 18th International Conference on Experimental Mechanics (ICEM18), Brussels, Belgium, 1–5 July 2018.
Proceedings 2018, 2(8), 538; https://doi.org/10.3390/ICEM18-05439
Published: 9 July 2018
(This article belongs to the Proceedings of The 18th International Conference on Experimental Mechanics)

Abstract

:
The aim of this paper is to assess and compare the performance of both high speed 2D and 3D digital image correlation (DIC) configurations in the characterization of unidirectional carbon fiber reinforced epoxy composites in high strain rate tension in the transverse direction. The criteria for assessment were in terms of strain resolution and measuring the strain localization within the gauge section. Results showed the high-speed 3D DIC technique has lower strain resolution compared to the high-speed 2D DIC technique. In addition, the analysis of the full strain fields indicated that the 3D DIC technique could accurately locate and measure the concentrations of strains within the gauge section of the tested samples.

1. Introduction

Composite materials are increasingly being used in impact critical aeronautical and automotive applications. It is, therefore, important to study the behavior of these materials at high strain rates for design and material modelling purposes alike. The split Hopkinson bar technique has been most suited for characterization of such materials at high strain rates, where strain rates can reach up to 8000 s−1 [1]. Typical engineering stress strain curves can be determined from split Hopkinson bar tests by application of the one-dimensional wave propagation theory [2]. However, due to the very low levels of strains for certain composite materials, accurate measurement of the specimen’s strain from the 1 dimensional elastic wave equations is usually difficult to achieve. In addition, it is known that the classical Hopkinson equations usually overestimate the strains of the samples in high strain rate tensile tests [3,4]. As a result, local strain measurement on the sample is necessary during split Hopkinson tensile experiments. Very often, strain gauges are used for local strain measurement on the surface of the sample [5]. However, strain gauges provide only average strain data, and do not provide full field strain information of the samples which might reveal strain heterogeneities including strain localizations. To overcome these limitations, high speed non-contact measurement techniques have been developed, such as digital image correlation (DIC) techniques [6]. Two-dimensional high-speed digital image correlation (2D DIC) has been used by several researchers to characterize composite materials by using split Hopkinson bar facilities [7,8,9]. However, studies have indicated the 2D DIC technique can cause measurement errors if the camera is not perfectly perpendicular to the sample [10], or if small out-of-plane displacements are occurring [11]. Three-dimensional high speed digital image correlation (3D DIC) can be used to overcome the limitations of 2D DIC. Few studies, however, are available regarding the use of high speed 3D DIC in high strain rate Hopkinson experiments in the form of two synchronized cameras, probably due to the high cost of the system and the required critical, time-consuming calibration procedure. The aim of this paper is to assess and compare the application of high speed 2D and 3D DIC techniques in the characterization of composite materials at high strain rates using the split Hopkinson tensile bar technique. The paper focuses on determining the strain resolution and the ability of both techniques to measure the strain localizations within the gauge section during testing. Experiments are carried out using the split Hopkinson tensile bar facility available at Ghent University. Strains on the sample surface are measured using one high-speed camera for the 2D DIC configuration, and two synchronized high speed cameras for the 3D DIC configuration.

2. Materials and Methods
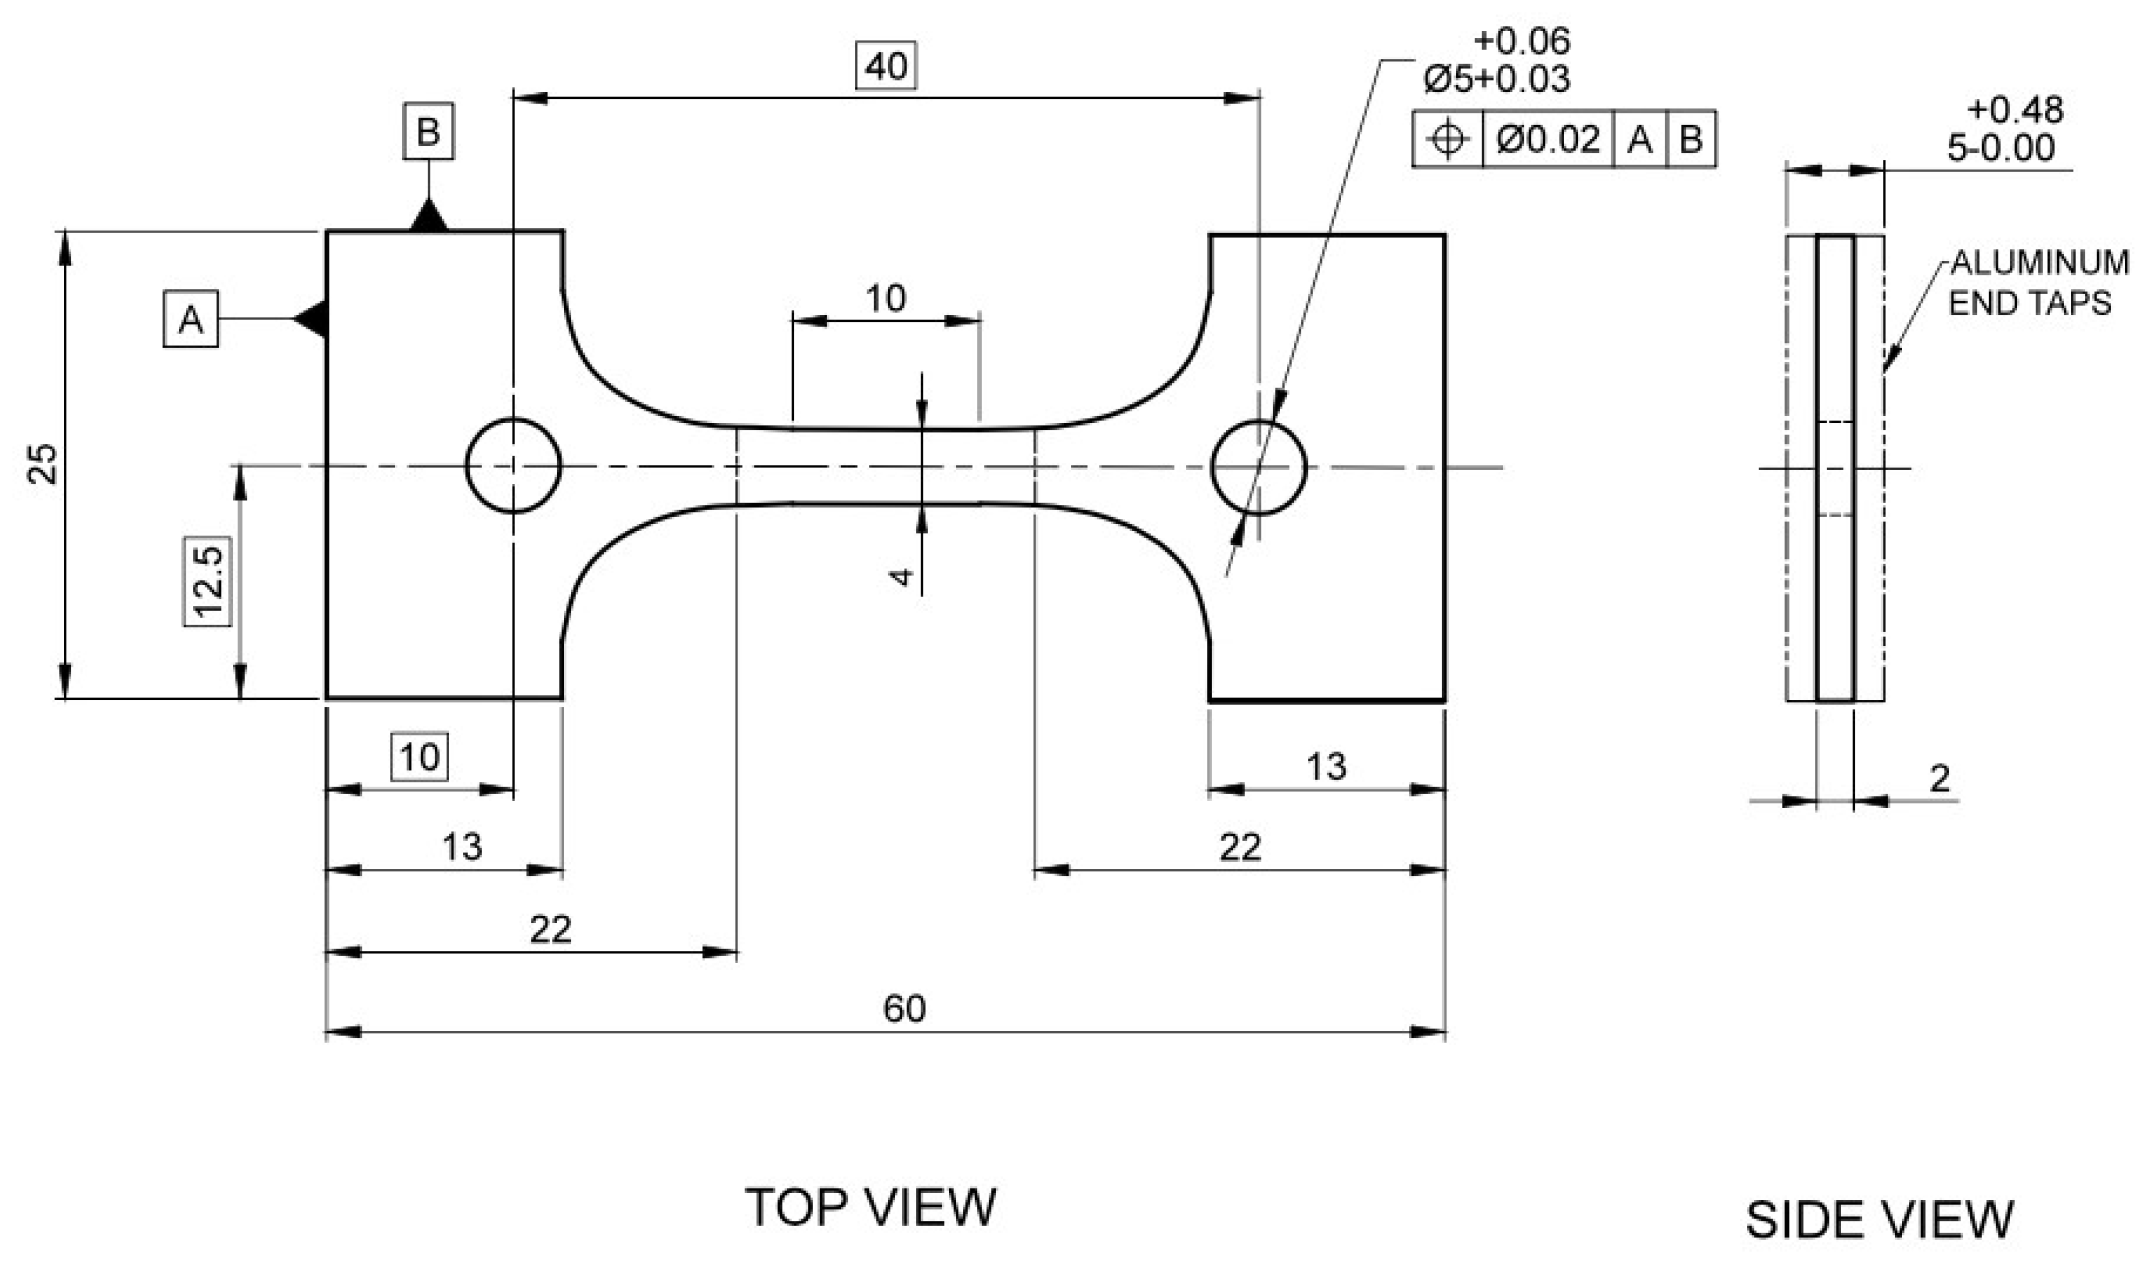
2.1. Materials

The material used in this study was unidirectional carbon fiber reinforced epoxy composite in the transverse direction (90° fiber orientation). Materials were supplied in the form of sheet of size 400 × 400 mm and thickness of 2 mm. Tensile samples were extracted in the transverse direction, so that the loading direction is perpendicular to the fiber direction. This material orientation was chosen particularly because the transverse direction is rich in resin content compared to the fiber direction, therefore, it would be more sensitive to strain rate changes. Dog-bone samples were cut into the dimensions shown in Figure 1 using waterjet cutting. Aluminum tabs were glued to the shoulders and grip section of the sample to stiffen the load transfer region and prevent premature failure in either the shoulders or grip region. The gauge length of all samples was chosen to be 10 mm. To avoid any discrepancies due to sample geometry, the same sample geometry was used for both 2D and 3D DIC configurations. To prepare the samples for DIC analysis, a black-on-white speckle pattern was applied on the gauge section prior to testing. The average size of each speckle was approximately 0.231 mm.

2.2. Dynamic Testing Setup

High strain rate tensile experiments were carried out using the split Hopkinson tensile bar facility available at MST-DyMaLab of Ghent University. The input and output bars are made of high strength aluminum and have a diameter of 25 mm. The total length of the setup is 11 m, guaranteeing loading times up to 1.2 ms. Samples were placed between two slotted aluminum end tabs, and were fixed using a 5-mm dowel pin. A special alignment device was used to ensure good alignment of the specimen with the bars. The dynamic tensile wave is generated by accelerating an impactor towards a flange at the end of the input bar at a velocity of 8 m/s. The incident, reflected, and transmitted waves were measured using strain gauges attached to the input and the output bars connected to a high speed data acquisition system. Upon achievement of dynamic stress equilibrium, the strain rate, average strain, and average stress in the sample can be calculated based on the 1D wave propagation theory [2].

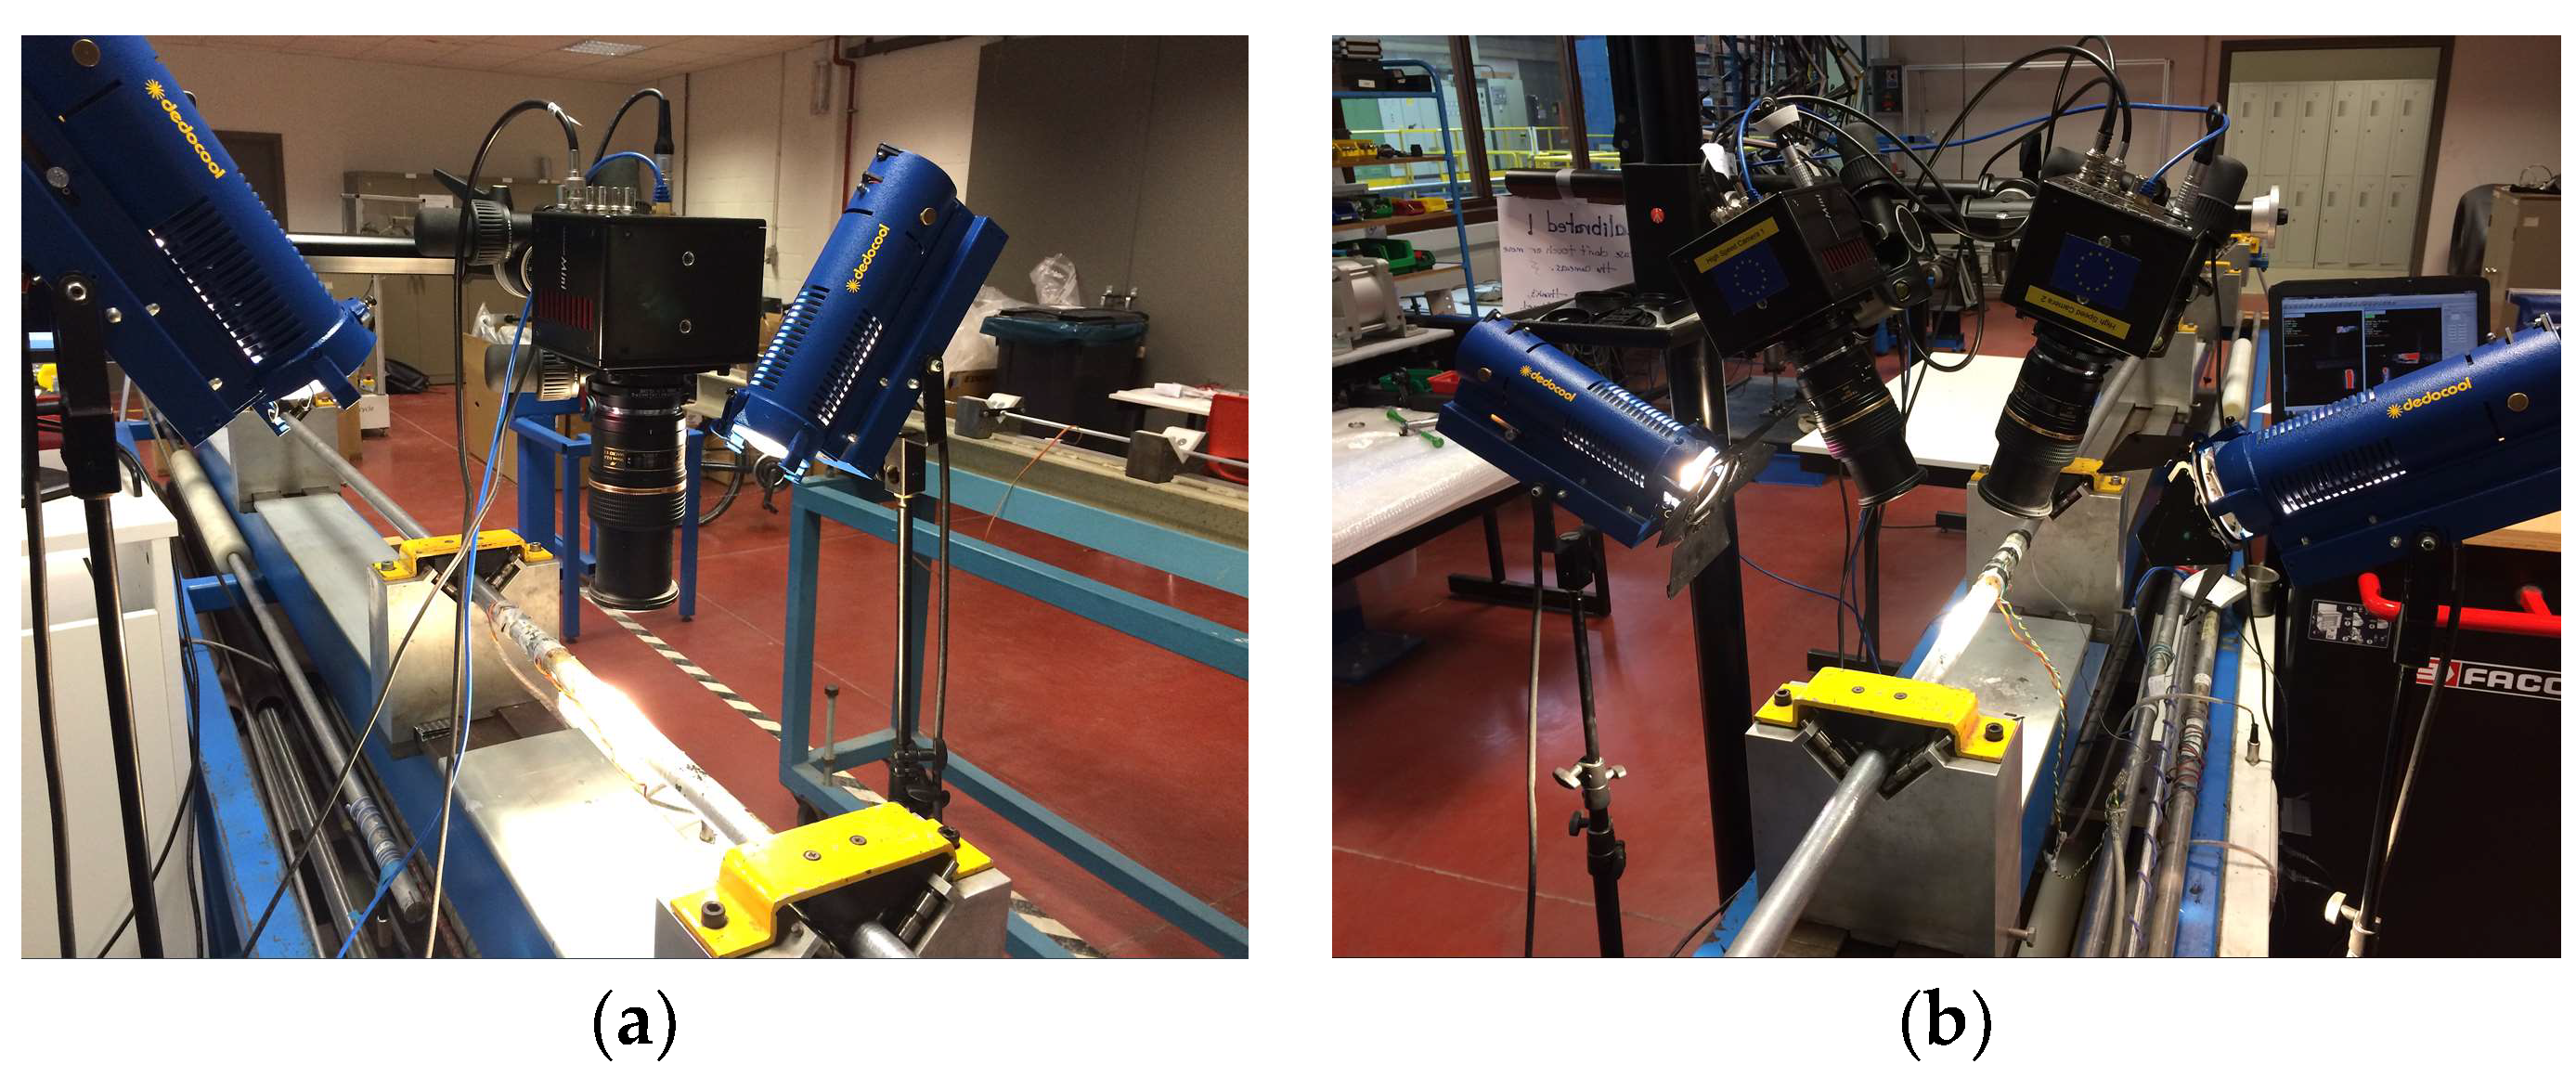
2.3. High Speed 2D and 3D DIC Systems

The high speed 2D DIC system consisted of one Photron Mini AX200 camera, which is capable of recording images at frame rates up to 900,000 frames per second. The lens used was a Tamron Macro lens, which has a fixed focal length of 90 mm. The camera was positioned on top of the sample, and on a rigid frame. Two Dedocool lamps were used to illuminate the sample. Images were captured at a rate of 120,000 frames per second, at an image resolution of 384 × 96 pixels corresponding to a field of view of approx. 12 × 5 mm. On average, five pixels per speckle were obtained.
The high speed 3D DIC system consisted of 2 Photron Mini AX200 cameras, connected in a master/slave configuration. The same lenses and lighting system were used for the 3D setup. In addition, the same frame rate, image resolution, and field of view which were used for the 2D setup were also used for the 3D setup. Figure 2 shows both 2D and 3D setups. Stereo calibration for the high speed 3D DIC system was carried out using a small etched glass calibration grid, having a 9 × 9 dots and a pitch of 1.780 mm between the centers of the dots. Table 1 shows the calibration parameters for the 3D DIC setup. The different numbers for each parameter indicates the values in x, y, and z directions of the image plane. Table 2 indicates the DIC processing parameters used for both 2D and 3D setups. All parameters were kept the same for both setups. The calibration and correlation processing was carried out using MatchID commercial software.

3. Results and Discussion

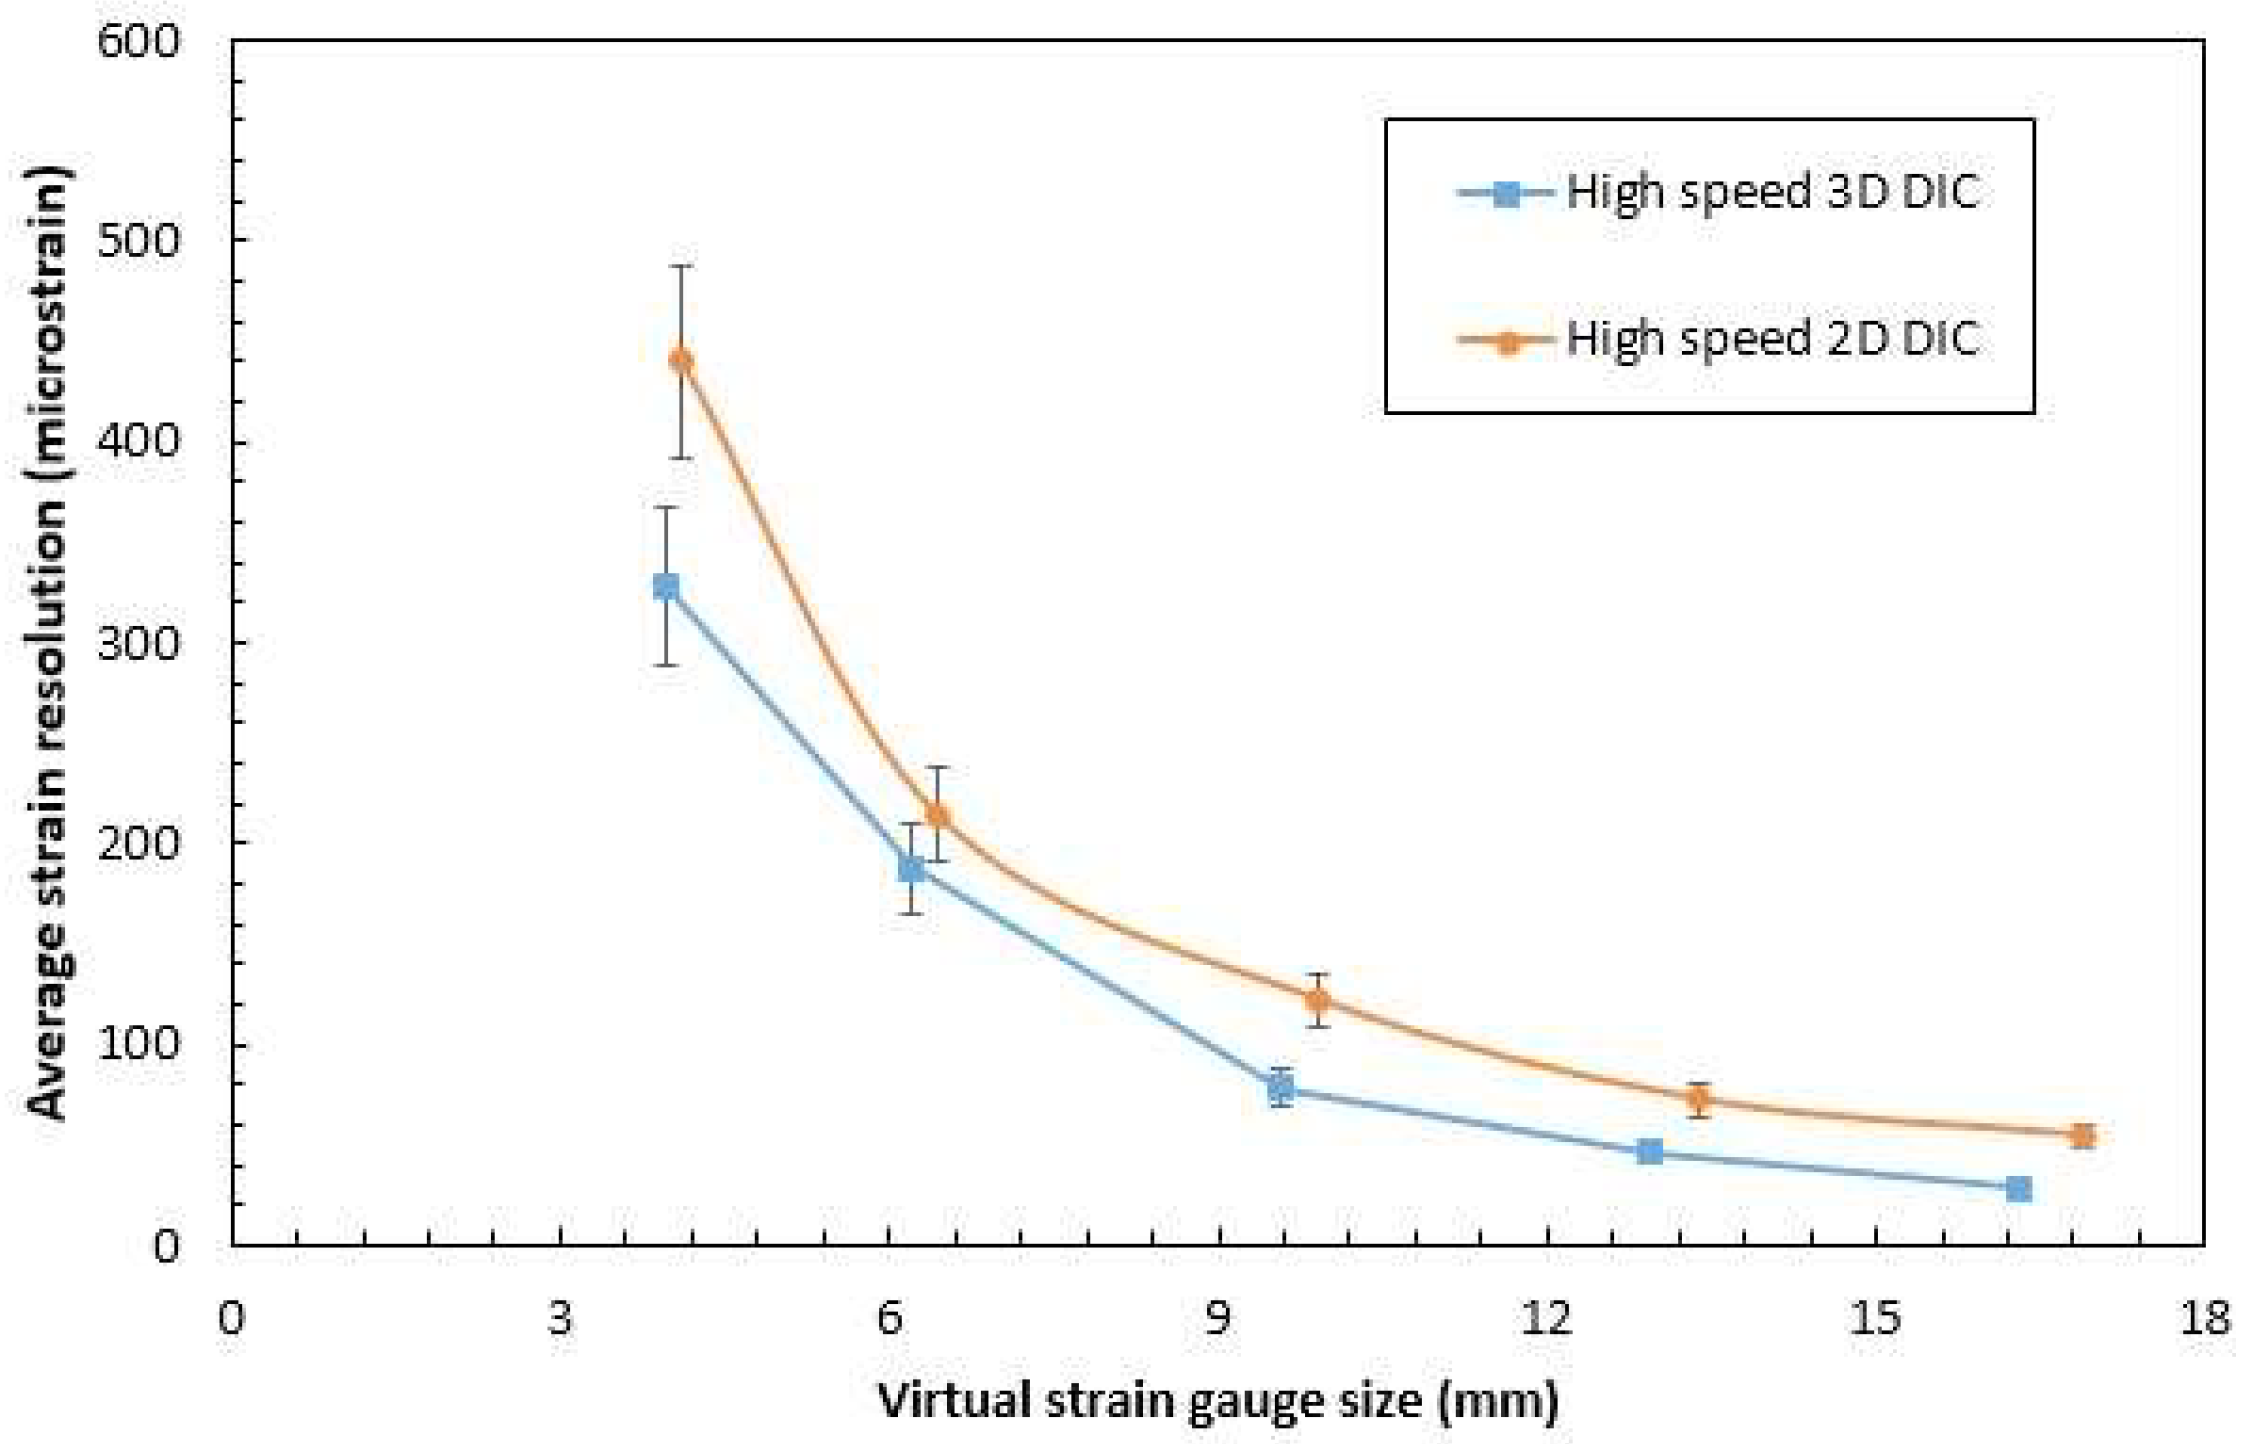
3.1. Strain Sensitivity

A strain sensitivity study was carried out in order to determine the average strain resolution for both setups at different virtual strain gauges prior to actual testing. Several combinations of subset size, step size, and strain window were employed to generate different virtual strain gauge sizes ranging from 3.2 mm up to 16.8 mm. Twenty-five images were recorded using both setups at zero load (completely static conditions) and then processed using the parameters mentioned in Table 1. The average strain resolution is calculated as two times the standard deviation of the generated strain fields, considering a 95% confidence interval. Figure 3 shows the average strain resolution obtained at different virtual strain gauge sizes for both 2D and 3D DIC setups.
It can be clearly seen that the 3D setup results in lower strain resolution at all virtual strain gauge sizes compared to the 2D setup, with a factor of approximately 1.2. With the increase of the virtual strain gauge size, the average strain resolution further decreases for both setups but at the expense of the spatial resolution. For the calculation of strain fields in the actual loading conditions, the virtual strain gauge size was chosen to be approximately 6 mm, which represents a good compromise between average strain resolution and spatial resolution. At a virtual strain gauge size of 6 mm, the strain resolution was approximately 188 microstrains for the 3D setup, and 214 microstrains for the 2D setup.

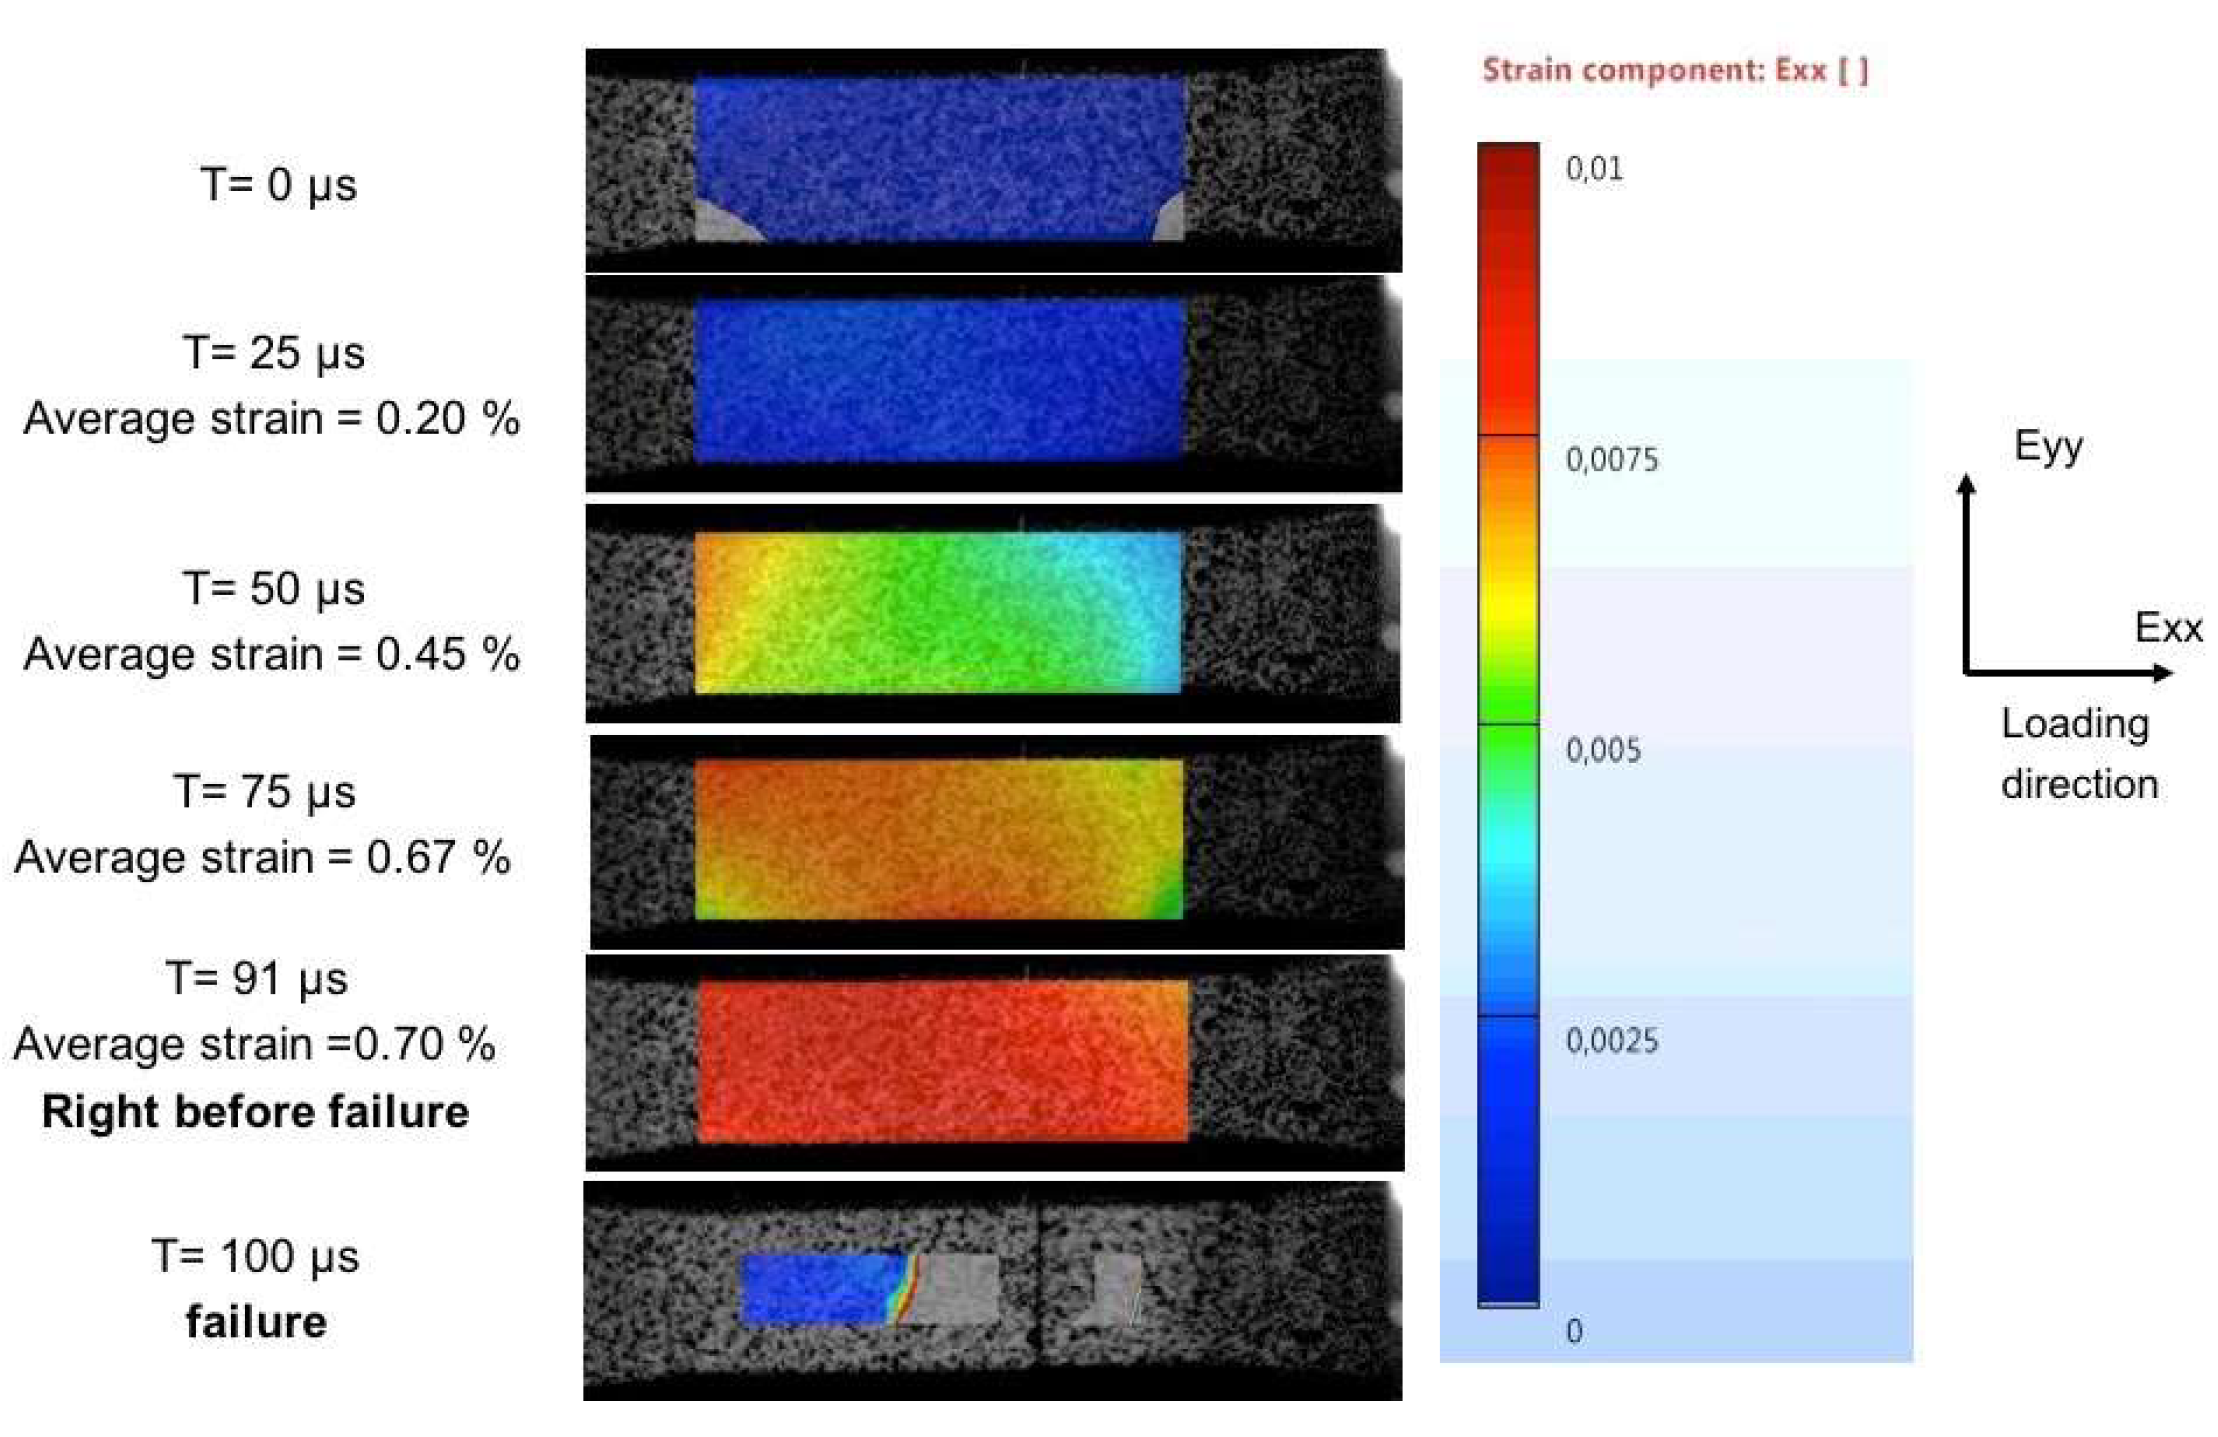
3.2. Full Field Analysis

Figure 4 represents the full strain fields using the 2D DIC setup during the progression of the high strain rate tensile test. The axial strains shown represent the strains in the loading direction along the horizontal axis. Homogeneous strain fields were developed within a gauge section of 5 mm. However, some strain concentrations were present at the end of the aluminum tabs. Failure took place within the gauge section after 100 μs. At 91 μs, the average strain across the gauge length was 0.7%, however, the strain field before failure shows no concentrations of strain at the eventual failure region.
Figure 5 shows the full strain fields using the 3D DIC setup during the progression of the high strain rate tensile test. Similar to Figure 4, the axial strains shown represents the strains in the loading direction along the horizontal axis. Full fields also show homogeneous strain fields developing within a gauge length of 5 mm. Localization of strains can be seen at time 119 μs, where the average strain was 0.65% and the maximum strain at the localization region was 0.12%. Failure took place in the gauge section at the region where the strains were localized.

4. Conclusions

The application of high speed 2D and 3D DIC techniques was assessed and compared, in terms of strain resolution and measurement of strain localization within the gauge section during tensile loading of a composite sample. Considering the current experimental conditions and setups used, the following can be concluded:
  • The high speed 3D DIC technique had lower strain resolution compared to the 2D DIC technique used in this study. This enabled the 3D setup to measure even lower strains compared to the 2D setup.
  • The high speed 3D DIC technique used was able to measure the strain localizations in the gauge section around the failure region, while the 2D DIC technique failed to measure these strain concentrations.

Author Contributions

A.E. and P.V. conceived and designed the experiments; A.E. performed the experiments and analyzed the data; P.V. contributed to the analysis tools; A.E. wrote the paper.

Acknowledgments

The project “EXTREME” leading to this paper has received funding from the European Union’s Horizon 2020 research and innovation program under agreement No. 636549.

Conflicts of Interest

The authors declare no conflict of interest.

References

  1. Sharpe, W. Springer Handbook of Experimental Solid Mechanics, 1st ed.; Springer: New York, NY, USA, 2008; p. 931. [Google Scholar]
  2. Rio, T.G.; Barbero, E.; Zaera, R.; Navarro, C. Dynamic tensile behaviour at low temperature of CFRP using a split Hopkinson pressure bar. Compos. Sci. Technol. 2005, 65, 61–71. [Google Scholar] [CrossRef]
  3. Verleysen, P.; Degrieck, J. Experimental investigation of the deformation of Hopkinson bar specimens. Int. J. Impact Eng. 2004, 30, 239–253. [Google Scholar] [CrossRef]
  4. Eskandari, H.; Nemes, J. Dynamic testing of composite laminates with a tensile split Hopkinson bar. J. Compos. Mater. 2000, 34, 260–273. [Google Scholar] [CrossRef]
  5. Taniguchi, N.; Nishiwaki, T.; Kawada, H. Tensile strength of unidirectional CFRP laminate under high strain rate. Adv. Compos. Mater. 2007, 16, 167–180. [Google Scholar] [CrossRef]
  6. Kuhn, P.; Ploeckl, M.; Koerber, H. Experimental investigation of the failure envelope of unidirectional carbon-epoxy composite under high strain rate transverse and off-axis tensile loading. EPJ Web Conf. 2015, 94, 01040. [Google Scholar] [CrossRef]
  7. Koerber, H.; Xavier, J.; Camanho, P.; Essa, Y.; Martín de la Escalera, F. High strain rate behaviour of 5-harness-satin weave fabric carbon–epoxy composite under compression and combined compression–shear loading. Int. J. Solids Struct. 2015, 54, 172–182. [Google Scholar] [CrossRef]
  8. Gilat, A.; Seidt, J.; Yang, P. Incorporating DIC in high strain rate testing of fibrous composite with the split Hopkinson bar technique. In Proceedings of the 21st International Conference on Composite Materials, Xi’an, China, 20–25 August 2017. [Google Scholar]
  9. Pankow, M.; Salvi, A.; Waas, A.; Yen, C.; Ghiorse, S. Split Hopkinson pressure bar testing of 3D woven composites. Compos. Sci. Technol. 2011, 71, 1196–1208. [Google Scholar] [CrossRef]
  10. Lava, P.; Coppieters, S.; Wang, Y.; Van Houtte, P.; Debruyne, D. Error estimation in measuring strain fields with DIC on planar sheet metal specimens with a non-perpendicular camera alignment. Opt. Lasers Eng. 2011, 49, 57–65. [Google Scholar] [CrossRef]
  11. Sutton, M.; Yan, J.; Tiwari, V.; Schreier, H.; Orteu, J. The effect of out-of-plane motion on 2D and 3D digital image correlation measurements. Opt. Lasers Eng. 2008, 46, 746–757. [Google Scholar] [CrossRef]
Figure 1. Tensile sample geometry.
Proceedings 02 00538 g001
Figure 2. High speed DIC setups (a) 2D (b) 3D.
Proceedings 02 00538 g002
Figure 3. Average strain resolution for 2D and 3D DIC setups at different virtual strain gauge sizes.
Proceedings 02 00538 g003
Figure 4. Full strain fields using 2D DIC.
Proceedings 02 00538 g004
Figure 5. Full strain fields using 3D DIC.
Proceedings 02 00538 g005
Table 1. High speed 3D DIC calibration parameters.
ParameterCamera 1Camera 2Stereo Setup
Focal lengths (pixel)6471, 64326773, 6772-
Distortion coefficient (K1)1.1630.2321-
Optical centers (pixel)311.1, 74.88304.8, 232-
Stereo angles (degree)--2.863, 25.58, 0.704
Translation (mm)--143.4, 7.096, 43.27
Table 2. DIC correlation and processing parameters for 2D and 3D setups.
ParameterCamera 1
Correlation criterionZero normalized sum of square differences (ZNSSD)
Subset size (pixels)31 × 31
Step size (pixels)10
Shape functionAffine
PrefilteringGaussian, kernel size 5
InterpolationBicubic spline
Strain tensorHencky
Strain interpolationQuadratic Quadrilateral
Publisher’s Note: MDPI stays neutral with regard to jurisdictional claims in published maps and institutional affiliations.

