Evaluation of Fracture Process in Concrete by Means of Acoustic Approaches †


Dept. Civil & Earth Resources Engineering, Graduate School of Engineering, Kyoto University, Kyoto 615-8540, Japan
*
Author to whom correspondence should be addressed.
†
Presented at the 18th International Conference on Experimental Mechanics (ICEM18), Brussels, Belgium, 1–5 July 2018.
Proceedings 2018, 2(8), 485; https://doi.org/10.3390/ICEM18-05388
Published: 26 June 2018
(This article belongs to the Proceedings of The 18th International Conference on Experimental Mechanics)
Abstract
:Through the life cycle of civil infrastructures, quality assessments should be implemented at the time of construction, during service, before/after repair, and so forth; however, there are no decisive techniques to evaluate the interior of structures non-destructively. The authors of this paper have developed an advanced measurement method using tomographic approaches. With these advanced technologies, internal damage or defects can be visualized as a distribution of elastic wave parameters, such as velocities, making possible damage identification including location and damage degree. In this paper, fracture processes of concrete decks are visualized using acoustic approaches. Specifically, RC (Reinforced Concrete) slabs with/without water supply subject to wheel loads were cyclically damaged while being monitoring using acoustic approaches. As a result, depending on the water condition, different patterns of fracture progress could be confirmed.
1. Introduction
As road infrastructures have been constructed extensively since the 1960s, many of these are reaching the end of their life-span (about 50 years) in Japan. Accordingly, percentage of infrastructures more than 50 years old is expected to shift to 43% in the coming 10 years, up from 18% of 2013 [1]. The replacement of those ageing infrastructures with new ones would be the most ideal measure; however, due to lower taxation leading to decreases in the construction budget, life-prolonging tactics appear to be the best solution for existing ageing infrastructures. Meanwhile, for new structures, proactive maintenance from the early damage phase is widely recognized as the most cost-effective life cycle scenario. However, as not only the detective techniques for early damage but also the corresponding repair methods have yet to be developed, substantial proactive maintenance treatment has not yet been applied to new infrastructures. Among the infrastructures, concrete bridge decks present many difficult problems, and are very expensive to maintain. Specifically, three major expressway companies have planned for more than 90% of the renewal budget for 15 years to be used for bridge decks. RC (Reinforced Concrete) bridge decks are principal members of road infrastructures; as such, many organizations have intensively studied their deterioration mechanisms, countermeasures against deterioration, and so forth. In order to simulate the peculiar failure process of the bridge decks experimentally, test slabs have been subjected to wheel loading tests with NDT (Non Destructive Testing) approaches [2,3]. A three-dimensional approach using AE (Acoustic Emission) tomography [4,5] was applied recently, and fatigue failure mechanisms could be explained by the velocity distribution of elastic waves [6]. In addition, data assimilation using the resultant wave velocities was conducted, and the remaining life-time could be successfully estimated by the Path-Integral-Mechanistic Model [7]. In this paper, a comparison is made between fatigue failure mechanisms with and without water supply using acoustic approaches. The final form of deterioration specified in RC decks—namely, ‘aggregation’—is discussed according to the findings. Note that ‘aggregation’ is the final form of deterioration of RC decks, at which only aggregate from the concrete remains, while cement hydrated matrix is washed out by excessive water pressure filling the cracks due to mobile loads.
2. Measurement and Acoustic Monitoring Approaches
In order to simulate the cracks observed in the slabs due to fatigue, repeated loading with a steel wheel was conducted. As shown in Figure 1, a foundation put on the slab was cyclically moved in a lateral direction, which is different from the wheel-loading apparatus installed in a movable loading-wheel [3]. In the apparatus, a steel wheel with a diameter of 300 mm and a width of 400 mm can be loaded up to 250 kN in the case of repeated lateral loading and 534 kN in the case of static vertical loading. The foundation can move horizontally from ±500 mm to ±1000 mm. In the experiment, the motion of ±500 mm and the repeat rate of 8.97 rpm were applied. Here, step-wise cyclic loadings were employed, as shown in Figure 1. In the first steps, the load of 98 kN was repeatedly applied up to 100,000 times. In the second step, the load of 127.4 kN was applied up to 200,000 times. Then, the third step loading was conducted up to 250,000 times with 156.8 kN load, where the fatigue limit of the specimen was estimated to be 235,000 loading times.
The slab specimen was made of reinforced concrete with rebar arrangement (details can be found in Reference [6]). The specimen was a plate with dimensions of 3000 × 2000 × 210 mm. The mixture proportions of the concrete are indicated in Table 1. The strength was 20.7 N/mm2. In terms of water supply, a central area of the top surface (see the bold blue rectangle in Figure 2) was kept saturated by a continuous water supply to a certain height. Thirty-one strain gauges for the vertical direction were embedded in the specimen.
Elastic wave tomography [8] and AE tomography [4,5] are methods for addressing deterioration, in which elastic wave parameters such as velocity are obtained based on the following wave sources. In elastic wave tomography, the source location and excitation time are both known, whereas both are unknown in AE tomography. Specifically, the tomography evaluates concrete characteristics using some peculiar elastic wave features in each set element over the structure based on variations of elastic waves parameters through the propagation of, e.g., velocity, frequency, amplitude, and so forth. Among the parameters, the elastic wave velocity can be linked to the modulus of elasticity, which itself varies depending on the presence of internal damages such as cracks or voids. In detail, with the existence of such defects as voids or cracks, the elastic waves exhibit particular behaviors, such as scattering, reflection and diffraction, leading to the decrease of the elastic wave velocity. Thus, it can reasonably be assumed that a small elastic wave velocity means a higher level of deterioration. Accordingly, the wave velocity can be a good indicator of the internal condition of concrete structures and has thus been well used to evaluate deterioration.
3. Results and Discussions
3.1. Dry Condition
The analysis of three-dimensional (3D) tomography was conducted in the region of 3000 × 1000 × 210 mm of the slab, which consisted of 25 nodes in the axial direction, 13 nodes in the lateral direction, and five nodes in the thickness direction. Overall, the velocities of 1152 elements were obtained by means of elastic wave tomography.
Contour maps of the distributions of the velocities are shown in Figure 3. Prior to the experiment, the velocity zones of approximately 3500 m/s were widely observed and a relatively-low velocity zone (about 3000 to 3500 m/s) was identified in a lattice pattern. This lattice pattern might be attributed to the sensor cable arrangements in the concrete slab [6]. After two loading cycles, the relatively-low velocity area toward the center of slab, which might represent the punching-shear damage of the concrete slab due to wheel loading, as shown in Figure 4, appeared due to the lattice pattern. The situations were similar after 3000 and 100,000 cycles. However, after 200,000 cycles, the zone of the velocities lower than 2700 m/s was identified at a distance of 2.3 m in the axial direction. After 250,000 cycles, which included cycles beyond the fatigue limit, the zones of the velocities lower than 2500 m/s were widely spread over the concrete slab. From Figure 3, the trend of decreasing velocities was observed to be dominant after 250,000 cycles. It was found that the velocity distributions showed minor variations up to 100,000 cycles, while the generation of low-velocity zones was initiated after 200,000 cycles, leading to the fatigue limit before 250,000 cycles.
3.2. Water Charged Condition
Velocity distributions based on three-dimensional elastic wave tomography were obtained before loading, after 100,000 and 200,000 load repetitions, and after failure. The area of analysis was divided into 6 × 22 × 3 cells, with a focus on the central area of 0.7 × 2.5 × 0.16 m, as shown in Figure 5. Reliable elastic wave signals, which have DD (The degree of the certainty)-value [9] of more than 0.05 [10], were involved in the tomography analysis. Tomograms of each load steps are shown in Figure 5. In the case before loading (see 0 cycles), areas of a slightly small velocity of 3300 m/s were obtained, whereas the overall velocity was 4400m/s, and therefore the specimen appeared to be intact at this moment. After 100,000 cycles, the areas of small velocities less than 3000 m/s became more distinct and continuously emerged in the transversal direction, resulting in an average velocity of 4000 m/s. After 200,000 cycles, areas of small velocities less than 3000 m/s were widely spread over the area of interest, and damaged areas, as indicated by velocities less than 2700 m/s, according to our past paper [6], were observed both in the middle and the bottom layers. As areas demonstrating large velocities of more than 4000 m/s still remained in places at this step, this appeared to be the stage at which damaged and intact areas are mixed. At this stage the average velocity was 3800 m/s. After the fatigue limit, further damaged areas were spread widely over the area of interest. The damage was more obvious for the middle and the bottom layers than the top layer; however, the average velocity was 3700 m/s, showing a very small difference from the average velocity of 3800 m/s in the previous step. In consideration of the velocity decrease with steps as well as specific distributions of small velocity, it is implied that the damage is only generated at the specific areas.
In Figure 6, crack traces overlaid with tomograms are exhibited for each case. Transversal cracks were developed first, namely at 100,000 cycles, then evolved in the same direction, finally forming a cell-like pattern. As for the tomograms, they were enlarged horizontally/longitudinally from each veridical/transversal smaller velocity area, which were initially developed in 100,000 cycles. Note that the number of cycles (equivalent cycles of 98 kN loading) showing the final fatigue limit was 17,025,097 in the dry condition and 8,654,440 in the water-filled condition; under the water-filled condition, the fatigue strength becomes half that of the dry condition. This suggests that water infiltrating into the initially developed cracks evidently enhances or accelerates the fatigue damage evolution. The transversal cracks and their lateral expansion as well as the same trend of tomograms agree well with this conclusion.
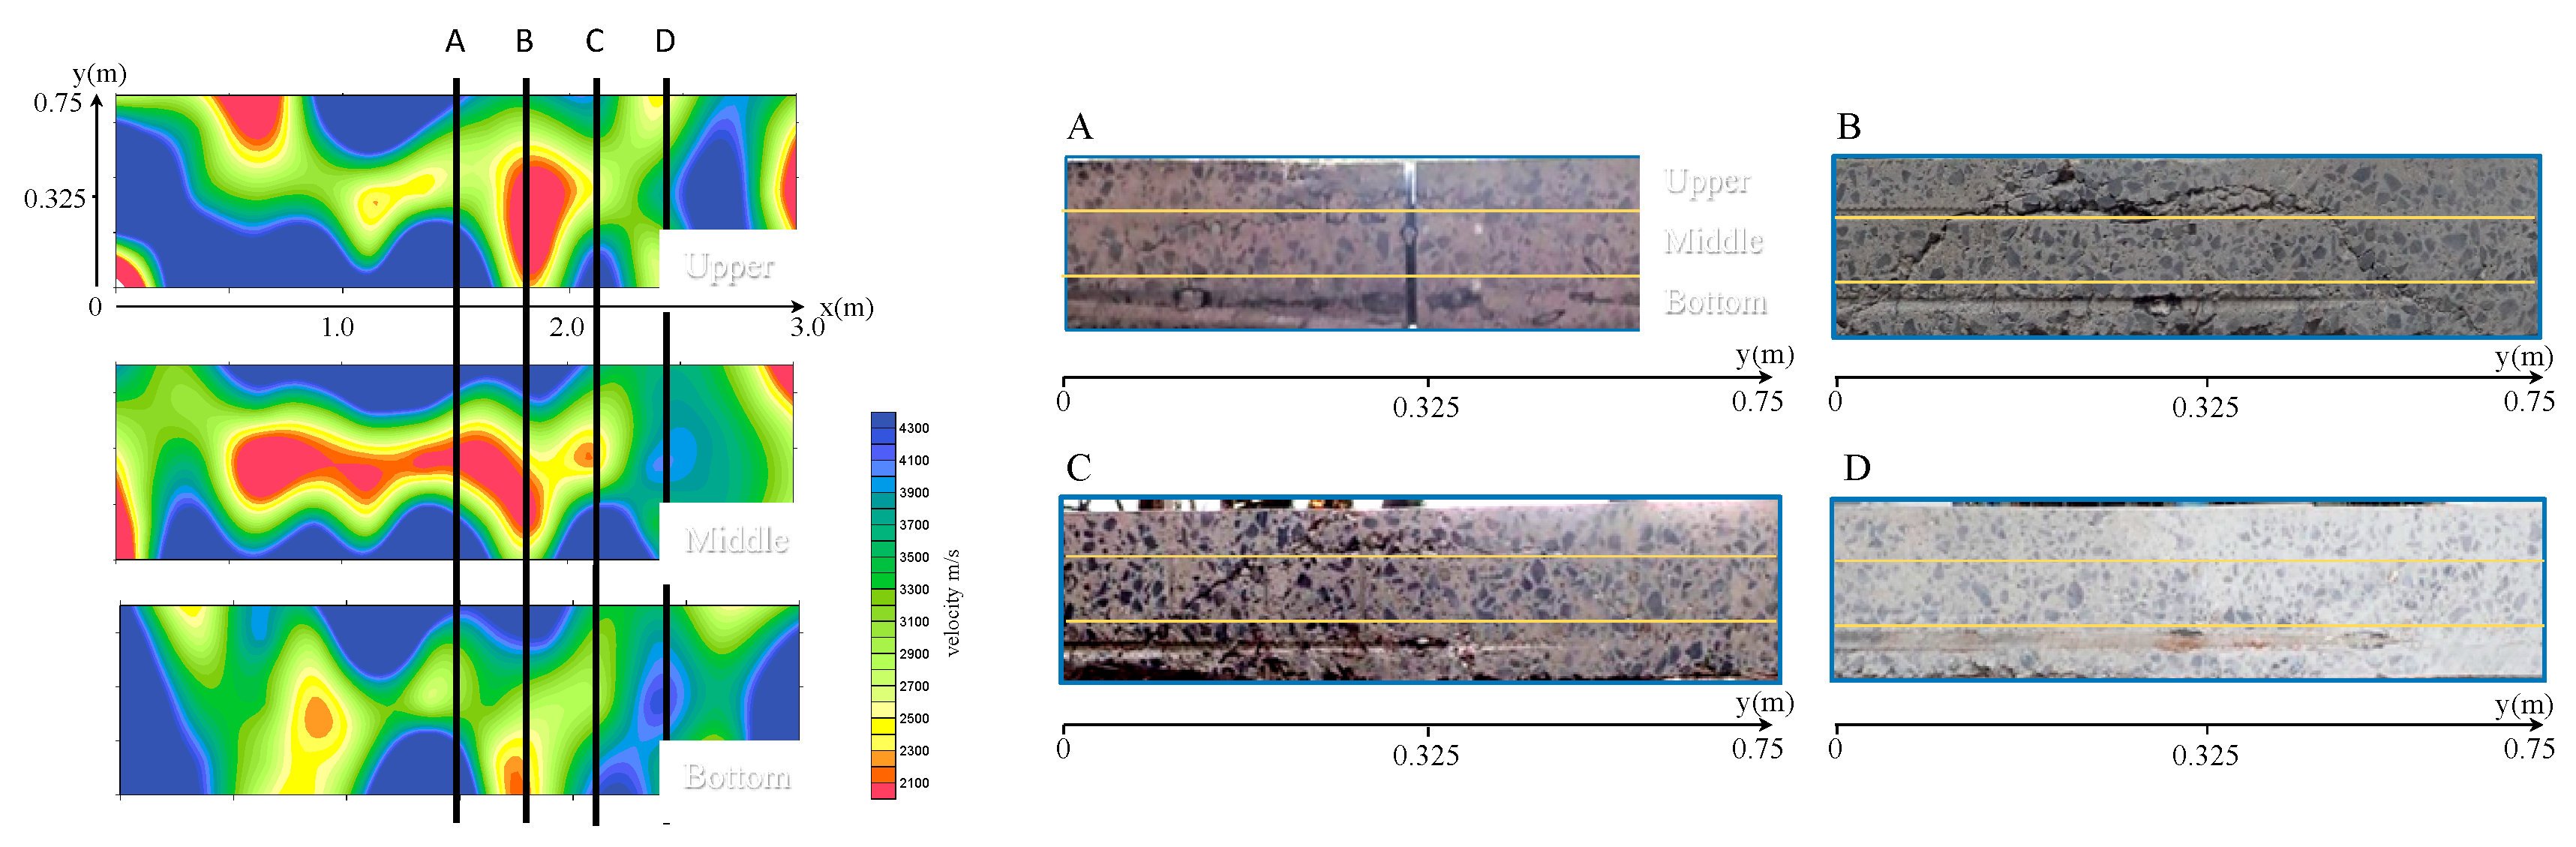
As shown in Figure 5, the fatigue damage process can be reasonably evaluated by the tomograms, specifically for the middle and bottom layers; however, an expected aggregation area, which developed in the upper region at the fatigue limit cycles, was not well assessed because the area beneath the load area had an insufficient density of wave paths, and therefore the AE sources obtained during the static load application were utilized in addition to the data derived from elastic wave tomography. As in Figure 7, different tomograms of upper and middle layers were obtained from sources only evaluated by elastic wave tomography (see Figure 5), suggesting the realistic result of tomograms in these areas. Although direct comparison with Figure 5 cannot be carried out because of the difference of analytical resolution, the trend of a small velocity in the bottom and a developing transversal direction of damage is almost identical to that of Figure 5. Hereafter, transversal sections denoted as A to D in Figure 13 are elucidated by corresponding images, as shown in Figure 7 right. From Figure 7, near agreement was found between the low velocity area and the corresponding area of damage indicated in the photos, e.g., in section B of Figure 7 right, extraordinary aggregation can be observed in the boundary between the upper and middle layer, and moreover diagonally developed cracks heading to the bottom are distinctly observed. In addition, the cracks lay more in the left side—namely, the area of 0–0.325 m in section B. Surprisingly, these crack conditions correspond relatively well to the concentrated damage areas evaluated by the tomogram in section B of Figure 7 left (see 0–0.325 m in section Y). Through the comparison between sectional observations and corresponding tomograms, it can be concluded that the location of aggregation can be reasonably estimated by velocities smaller than 2300 m/s, which are obtained using tomography with a sufficient density of wave/ray paths. For in situ bridge deck evaluation, when sufficient AE sources are obtained, spreading over the entire area of measurement and resulting in a reliable ray path density, the identification of aggregation can be achieved using AE tomography.
4. Conclusions
In this paper, fracture processes of concrete decks were visualized using acoustic approaches. Specifically, RC slabs with/without water supply subject to wheel loads were cyclically damaged while being monitored using acoustic approaches. As a result, depending on the water condition, different patterns of fracture progress could be confirmed from crack traces and tomograms. Specifically, the overall spreading of cracks can be found in the dry condition, whereas evolutional crack behavior from initial formed cracks can be assumed in the water condition. In consideration of the fatigue limit for both cases as well as tomograms, the acceleration of fatigue failure is obvious in the case of water supply, possibly attributed to the existence of water causing tensional pressure in the formed cracks.
References
- The Ministry of Land, Infrastructure, Transport and Tourism: Annual report 2015 on Maintenance of Roads, Japan, 2015. Available online: http://www.mlit.go.jp/hakusyo/mlit/h26/hakusho/h27/index.html (accessed on 20 June 2018). (In Japanese).
- Shiotani, T.; Yoshimi, S.; Kamada, T.; Ohnishi, H.; Momoki, S.; Chai, H.K. Visualization of fatigue damage for concrete bridge deck with stress wave techniques. In Structural Faults and Repair 2010; CD-ROM: Edinburgh, UK, 2010. [Google Scholar]
- Shiotani, T.; Ohtsu, H.; Momoki, S.; Chai, H.K.; Onishi, H.; Kamada, T. Damage evaluation for concrete bridge deck by means of stress wave techniques. J. Bridge Eng. 2012, 17, 847–856. [Google Scholar] [CrossRef]
- Shiotani, T.; Okude, N.; Momoki, S.; Kobayashi, Y. Proposal of assessment method for infrastructures by AE tomography. In Proceedings of the 2011 National Conference on Acoustic Emission; 2011; pp. 39–42. (In Japanese). [Google Scholar]
- Kobayashi, Y.; Shiotani, T. Seismic tomography with estimation of source location for concrete structure. In Structural Faults and Repair 2012; CD-ROM: Edinburgh, UK, 2012. [Google Scholar]
- Shiotani, T.; Asaue, H.; Nishida, T.; Maeshima, T.; Tanaka, Y. Evolution of fatigue damage in wheel-loading tests evaluated by 3D elastic-wave tomography. J. Disaster Res. 2017, 12, 487–495. [Google Scholar]
- Tanaka, Y.; Maekawa, K.; Maeshima, T.; Iwaki, I.; Nishida, T.; Shiotani, T. Data assimilation for fatigue life assessment of RC bridge decks coupled with path-integral-mechanistic model and non-destructive inspection. J. Disaster Res. 2017, 12, 422–431. [Google Scholar] [CrossRef]
- Kobayashi, Y.; Shiotani, T.; Shiojiri, H. Damage identification using seismic travel time tomography on the basis of evolutional wave velocity distribution model. In Structural Faults and Repair 2006; CD-ROM: Edinburgh, UK, 2006. [Google Scholar]
- Xu, J. An effective way to validate signal arrival time in AE structural monitoring. Adv. Mater. Res. 2010, 163–167, 2471–2476. [Google Scholar] [CrossRef]
- Asaue, H.; Shiotani, T.; Hashimoto, K.; Kayano, S. Development of AE monitoring system with accelerometers for in-situ RC slab. In Proceedings of the 2017 National Conference on Acoustic Emission, Nov. 2017, Tokushima, Japan; pp. 25–28. (In Japanese).
Figure 1.
Wheel loading apparatus (left) and load application program (right).

Figure 2.
Locations of AE (Acoustic Emission) sensors and excitation points denoted by red squares and blue circles, respectively.
Figure 2.
Locations of AE (Acoustic Emission) sensors and excitation points denoted by red squares and blue circles, respectively.

Figure 3.
Three-dimensional (3D) velocity distributions of the slab in each cycle under the dry condition.
Figure 3.
Three-dimensional (3D) velocity distributions of the slab in each cycle under the dry condition.
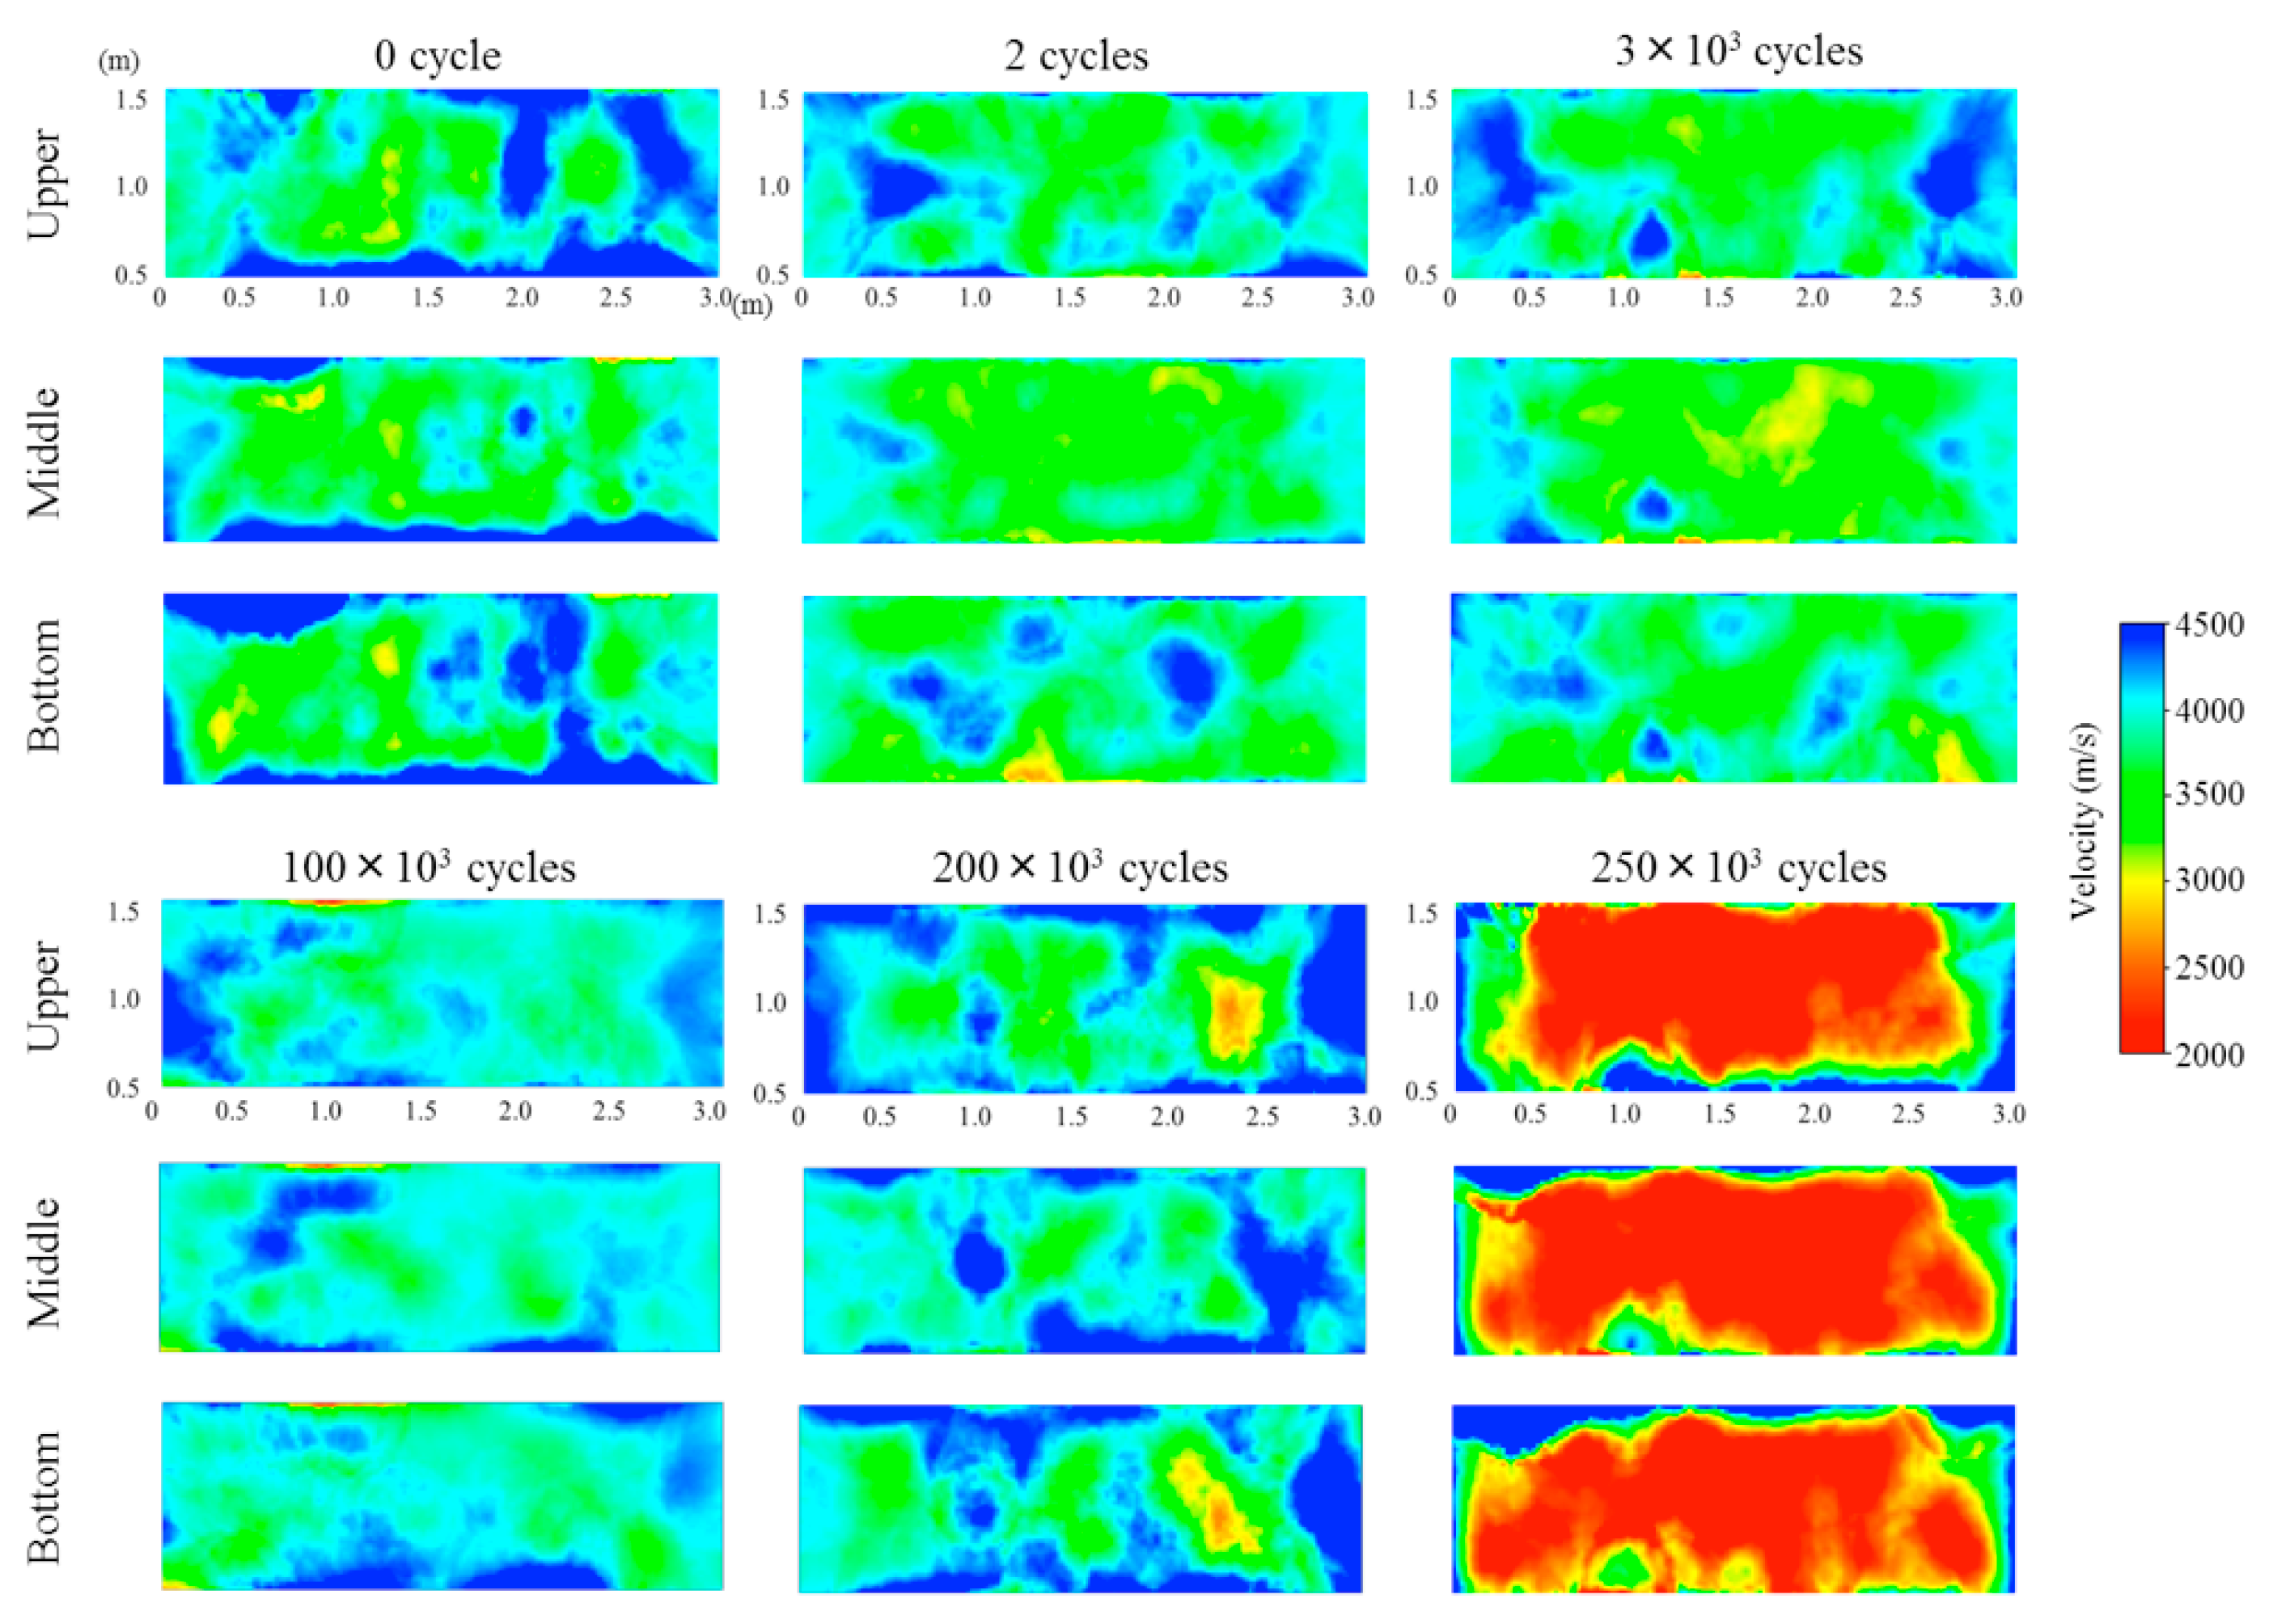
Figure 4.
Crack evolution on the bottom.

Figure 5.
3D velocity distributions of the slab in the case allowing water infiltration.

Figure 6.
Crack traces on the bottom surface overlaid with tomograms.

Figure 7.
Tomograms combined with AE activity and sectional photos (A–D) after failure.

Table 1.
Mixture proportion of the concrete slab.
| Max. Gravel Size (mm) | Slump (cm) | W/C (water-cement ratio) (%) | Volume Ratio of Sand s/a (%) | Air (%) | Unit Weight per 1 m3 Concrete (kg/m3) | ||||
|---|---|---|---|---|---|---|---|---|---|
| Water: W | Cement: C | Sand: S | Gravel: G | Admixture | |||||
| 20 | 12 | 64.3 | 46.6 | 4.5 | 178 | 277 | 839 | 1055 | 2.27 |
The arrangement of AE sensors and excitation locations is depicted in Figure 2. Thirty-six AE sensors of 60 kHz resonance were arranged on the specimen, namely 10 for the top, 18 for the bottom, and eight for the sides. For elastic wave tomography, excitations were made by a 35-mm diameter steel ball for 18 points on the top, so as to avoid the loading area depicted by the green broken rectangle, and 28 points on the bottom. The measurement of elastic wave excitations was conducted six times: before loading, after 2, after 3000, after 100,000, and after 200,000 load applications, as well as after failure. Detected signals by the sensors were amplified by 40 dB by a preamplifier and acquired by a 48-channel Express-8 monitoring system (Physical Acoustics Corp) with a 1-MHz sampling rate. Seventeen displacement-meters were set on the bottom. Seven electric strain gauges for detecting the vertical deformation were embedded inside the concrete.
Publisher’s Note: MDPI stays neutral with regard to jurisdictional claims in published maps and institutional affiliations. |
© 2018 by the authors. Licensee MDPI, Basel, Switzerland. This article is an open access article distributed under the terms and conditions of the Creative Commons Attribution (CC BY) license (https://creativecommons.org/licenses/by/4.0/).
Share and Cite
MDPI and ACS Style
Shiotani, T.; Asaue, H.; Hashimoto, K.; Nisahida, T. Evaluation of Fracture Process in Concrete by Means of Acoustic Approaches. Proceedings 2018, 2, 485. https://doi.org/10.3390/ICEM18-05388
AMA Style
Shiotani T, Asaue H, Hashimoto K, Nisahida T. Evaluation of Fracture Process in Concrete by Means of Acoustic Approaches. Proceedings. 2018; 2(8):485. https://doi.org/10.3390/ICEM18-05388
Chicago/Turabian StyleShiotani, Tomoki, Hisafumi Asaue, Katsufumi Hashimoto, and Takahiro Nisahida. 2018. "Evaluation of Fracture Process in Concrete by Means of Acoustic Approaches" Proceedings 2, no. 8: 485. https://doi.org/10.3390/ICEM18-05388