Pin-on-Plate Abrasive Wear Test for Several Composite Materials †


1
Department of Mechanical Engineering, Szent István University, 2100 Gödöllő, Hungary
2
Department of Textile Technology, University of Borås, 50332 Borås, Sweden
*
Author to whom correspondence should be addressed.
†
Presented at the 18th International Conference on Experimental Mechanics (ICEM18), Brussels, Belgium, 1–5 July 2018.
Proceedings 2018, 2(8), 469; https://doi.org/10.3390/ICEM18-05333
Published: 12 June 2018
(This article belongs to the Proceedings of The 18th International Conference on Experimental Mechanics)
Abstract
:Friction which happens between plants and soil particles with the agricultural machine parts leads to substantial losses due to wear these parts. Nowadays, polymer matrix composites are playing a great role as a replacement of some critical fast-wearing steel due to their high properties, and this replacement leads to increase the machine reliability besides better corrosion resistance and lighter construction. Five types of composite materials were suggested to replace these steel parts. We chose ESD PA6 G, HD1000, PA6E, PA6G and PA66GF30 as test materials. And two kinds of testing methods were done to test these materials. First one is a pin-on-plate test with sliding abrasive clothes, the second one is a sand slurry test which uses standard abrasive particles. In the pin-on-plate abrasive wear system, we found that PA6G was the best choice of the used polymers because it had the lowest wear rate.
1. Introduction
Every year there are substantial losses due to friction and wear of agricultural machine parts. Just within the high-capacity harvesters, the abrasive and erosive effects of the contaminated crops, plants, and soil particles can cause unexpected breakdown and extended service time.
The replacement of some critical fast-wearing steel parts with polymers can increase the machine reliability besides better corrosion resistance and lighter construction.
Nowadays, abrasive wear of engineering and agricultural machine components caused by the abrasive particles is a major industrial problem. Therefore, a full understanding of the effects of all system variables on the abrasive wear rates is necessary to undertake appropriate steps in the design of the machinery and the choice of materials to reduce/control wear [1].
Due to substantial losses because of friction and wear of agricultural machine parts, so polymer matrix composites are a perfect application due to their high durability, fracture toughness, and abrasion resistance properties.
The environmental impact can be reduced in a significant way if we are using fully biodegradable composites were matrix and reinforcement are made up of biodegradable materials [2].
The environmental problems of composites are related to the use of polymer from petroleum origin [3].
The recycling of composite is a complicated process and very limited, for example, when we have two different component in the composite, it will be hard to separate and recycle them, and often they use the incineration which considered as an unsatisfactory way [2].
Thermoplastic bio-composites experience a continuing demand for various industrial applications [3,4]. This is due to the combination of several specific advantageous characteristics in these materials. Thermoplastics, reduced processing times, highly increased storage times, and favorable recycling capabilities [5], by using thermoplastics we can separate the components after using them. And the process will be easier, cleaner and faster [6]. Environmentally friendly, degradable biomaterials, used to create true bio-composites, possess the ability to significantly improve the environmental impact of commonly used composite materials [2]. This includes both natural fibers, used for the reinforcement component of a composite, as well as matrix materials from renewable resources. The using of thermoplastic matrices is better than using thermosets because thermoplastics has facilitated recycling by being able to be molten and reshaped for numerous times [7]. And thermoplastic materials like PP (polypropylene), PE (polyethylene) and PVC (polyvinyl chloride) dominate as matrices for natural fibers [8].
The essential biodegradable polymers are (bio-based) aliphatic polyesters. Some bio-based polyesters that have gained commercial use or that currently investigated for industrial applications are polylactic acid (PLA), polyglycolic acid (PGA), poly-ε-caprolactone (PCL), polyhydroxy butyrate (PHB), and poly(3-hydroxy valerate).
Among these, PHB and PLA are the most extensively studied biodegradable thermoplastic polyesters. Both have excellent biodegradability and biocompatibility and exhibit relatively high melting point (160 to 180 °C). However, the brittleness of these materials always gives a limit to their practical applications.
2. Materials and Methods
At that point, as per the above brief survey for some written literature, Five types of composite materials which are (ESD PA6 G, HD1000, PA6E, PA6G and PA66GF30) and one kind of bio-composite materials which is (PLA fortified with hemp) were recommended to supplant these steel parts.
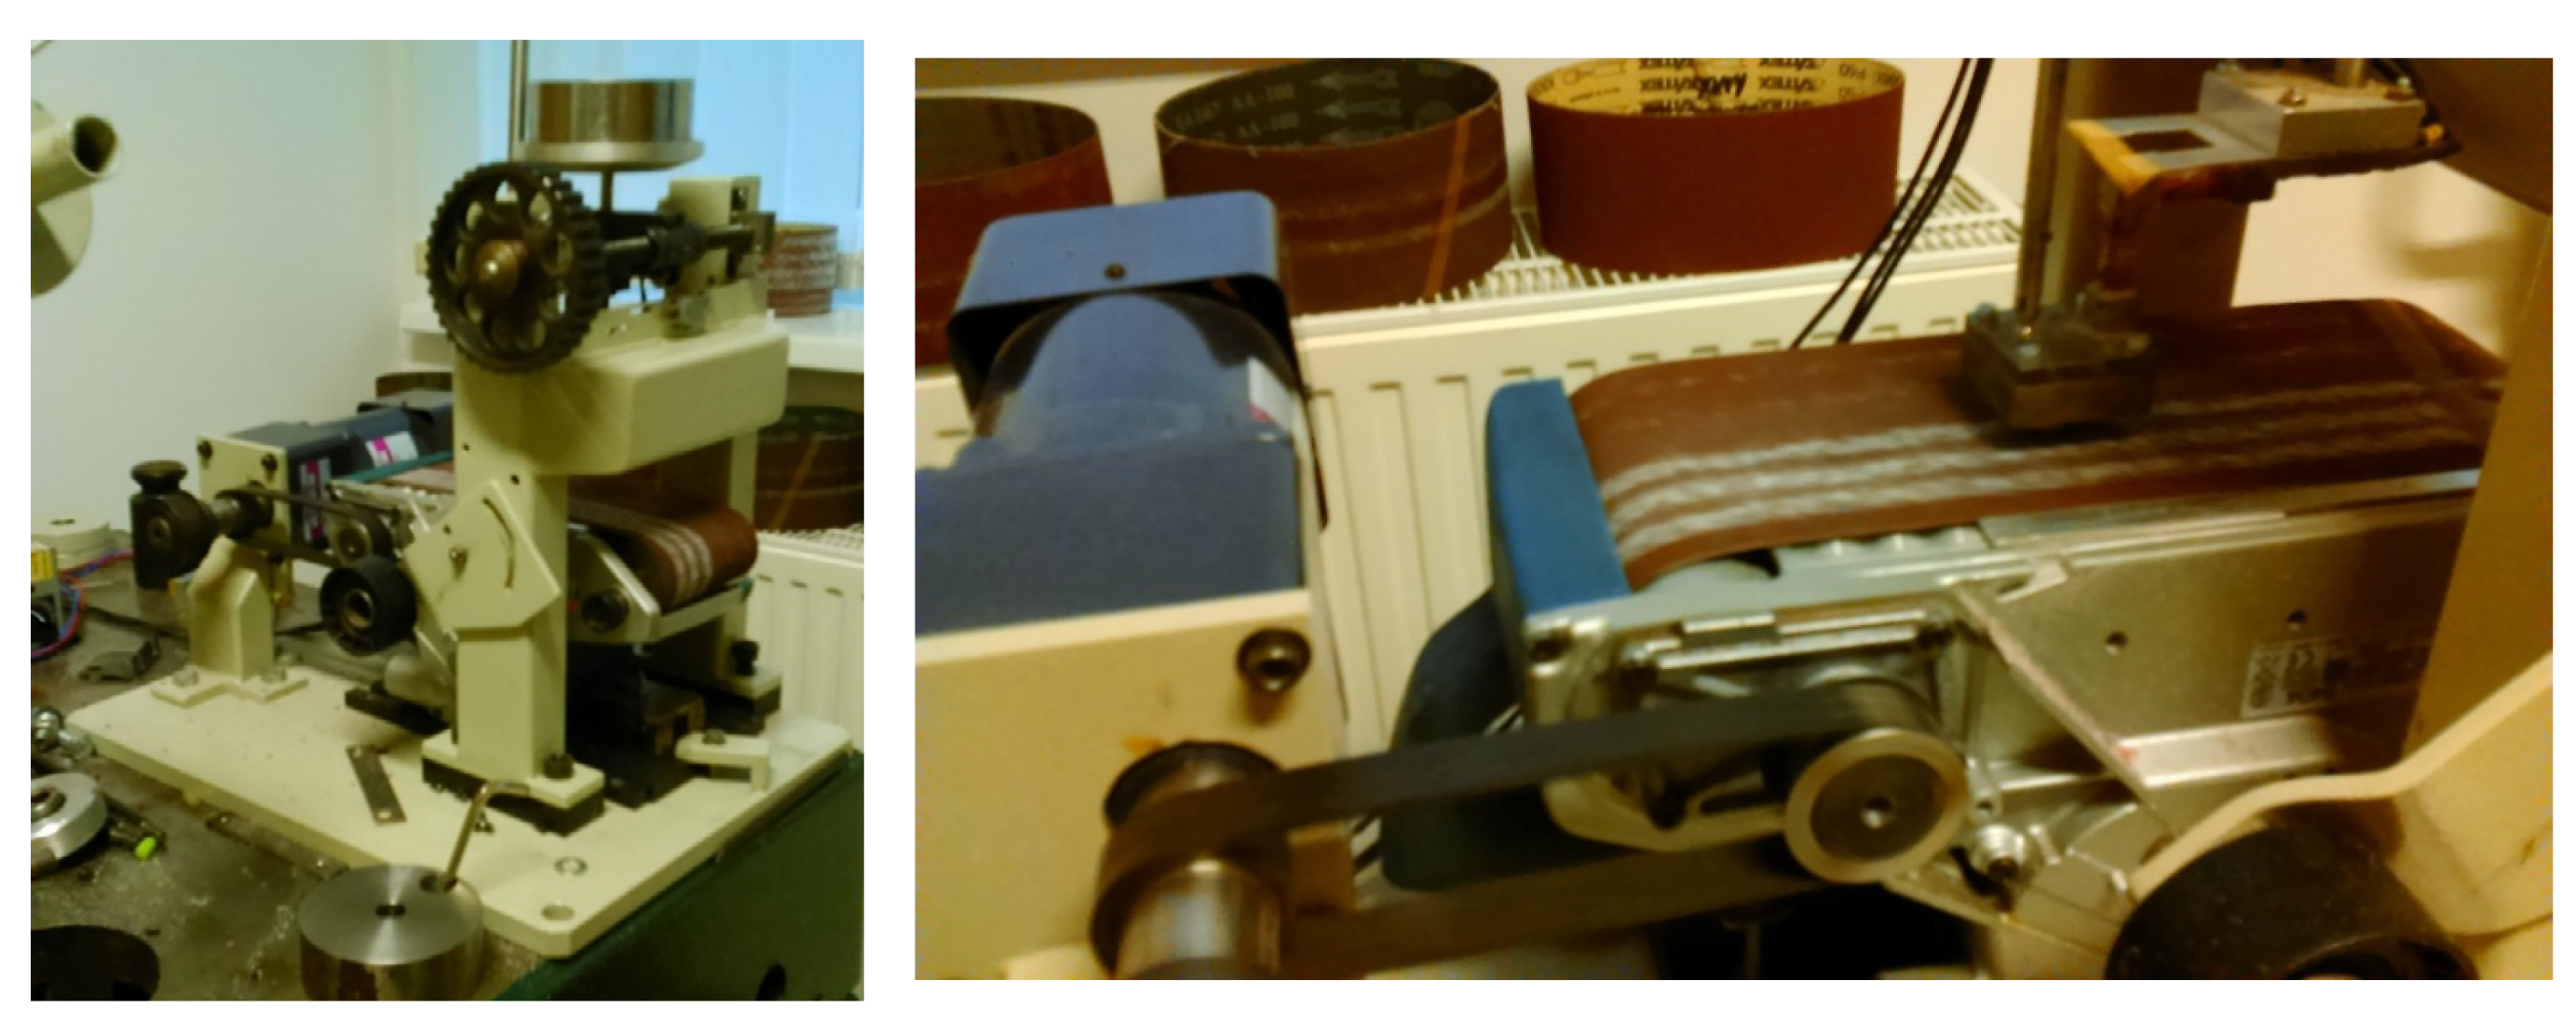
To test these materials, a pin-on-plate test with a sliding abrasive cloth. Pin-on-plate test made by using the following device (shown in Figure 1):
This device can give us a nonstop wear interface and furthermore a possibility to control several parameters:
- Opportunity to control the speed of the interface wear.
- Possibility to use several wear interfaces
- Opportunity to add a load over the specimens.
- Two types of wear interfaces were used (P60 and P150).
- Two speeds are used which are (20% = 0.0315476 m/s and 40% = 0.055789 m/s)
- And we used Three loads (9.81 N, 29.43 N and 49.05 N)
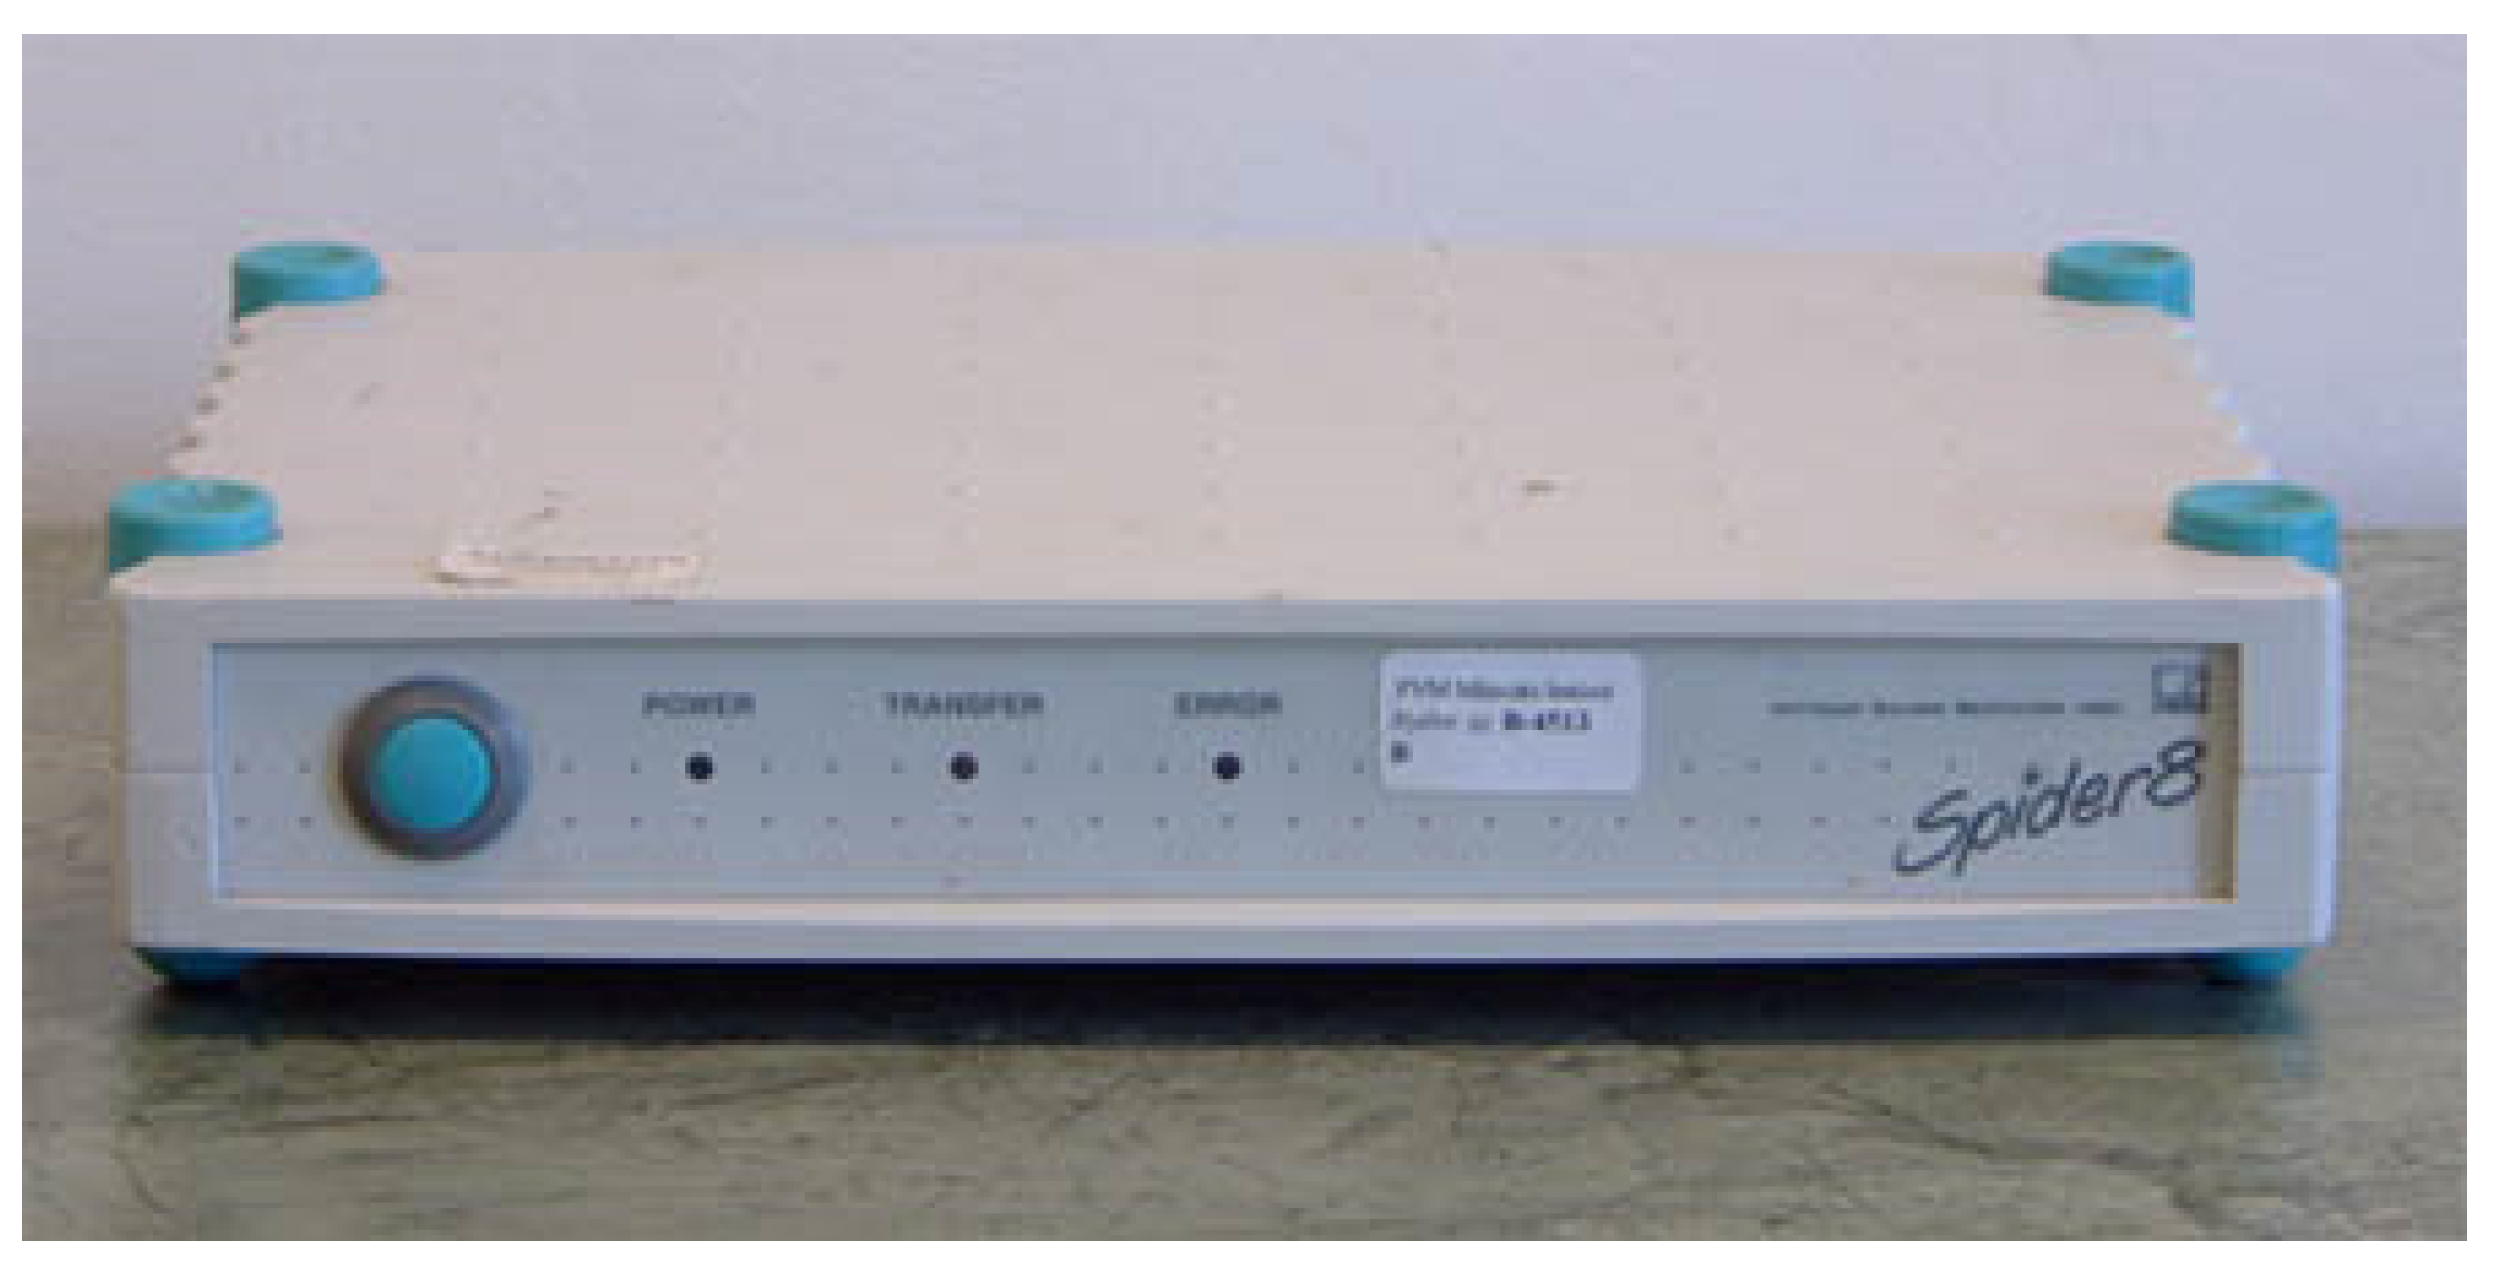
Several strain gages are connected to a PC by an estimation device (Spider 8) to take these parameters as results (shown in Figure 2).
The used specimens have an exact dimension with 8mm diameter and 20 mm length.
We tested each sample for 10 min; some samples didn’t bear this time due to its specifications, enormous load, and substantial sliding speed. These cases we can see it amid the results.
3. Results
According to the experimental for this system, many sets of results will obtain from this system to achieve the objectives.
3.1. The Relation between the Wear and Sliding Distance for a Single Sample
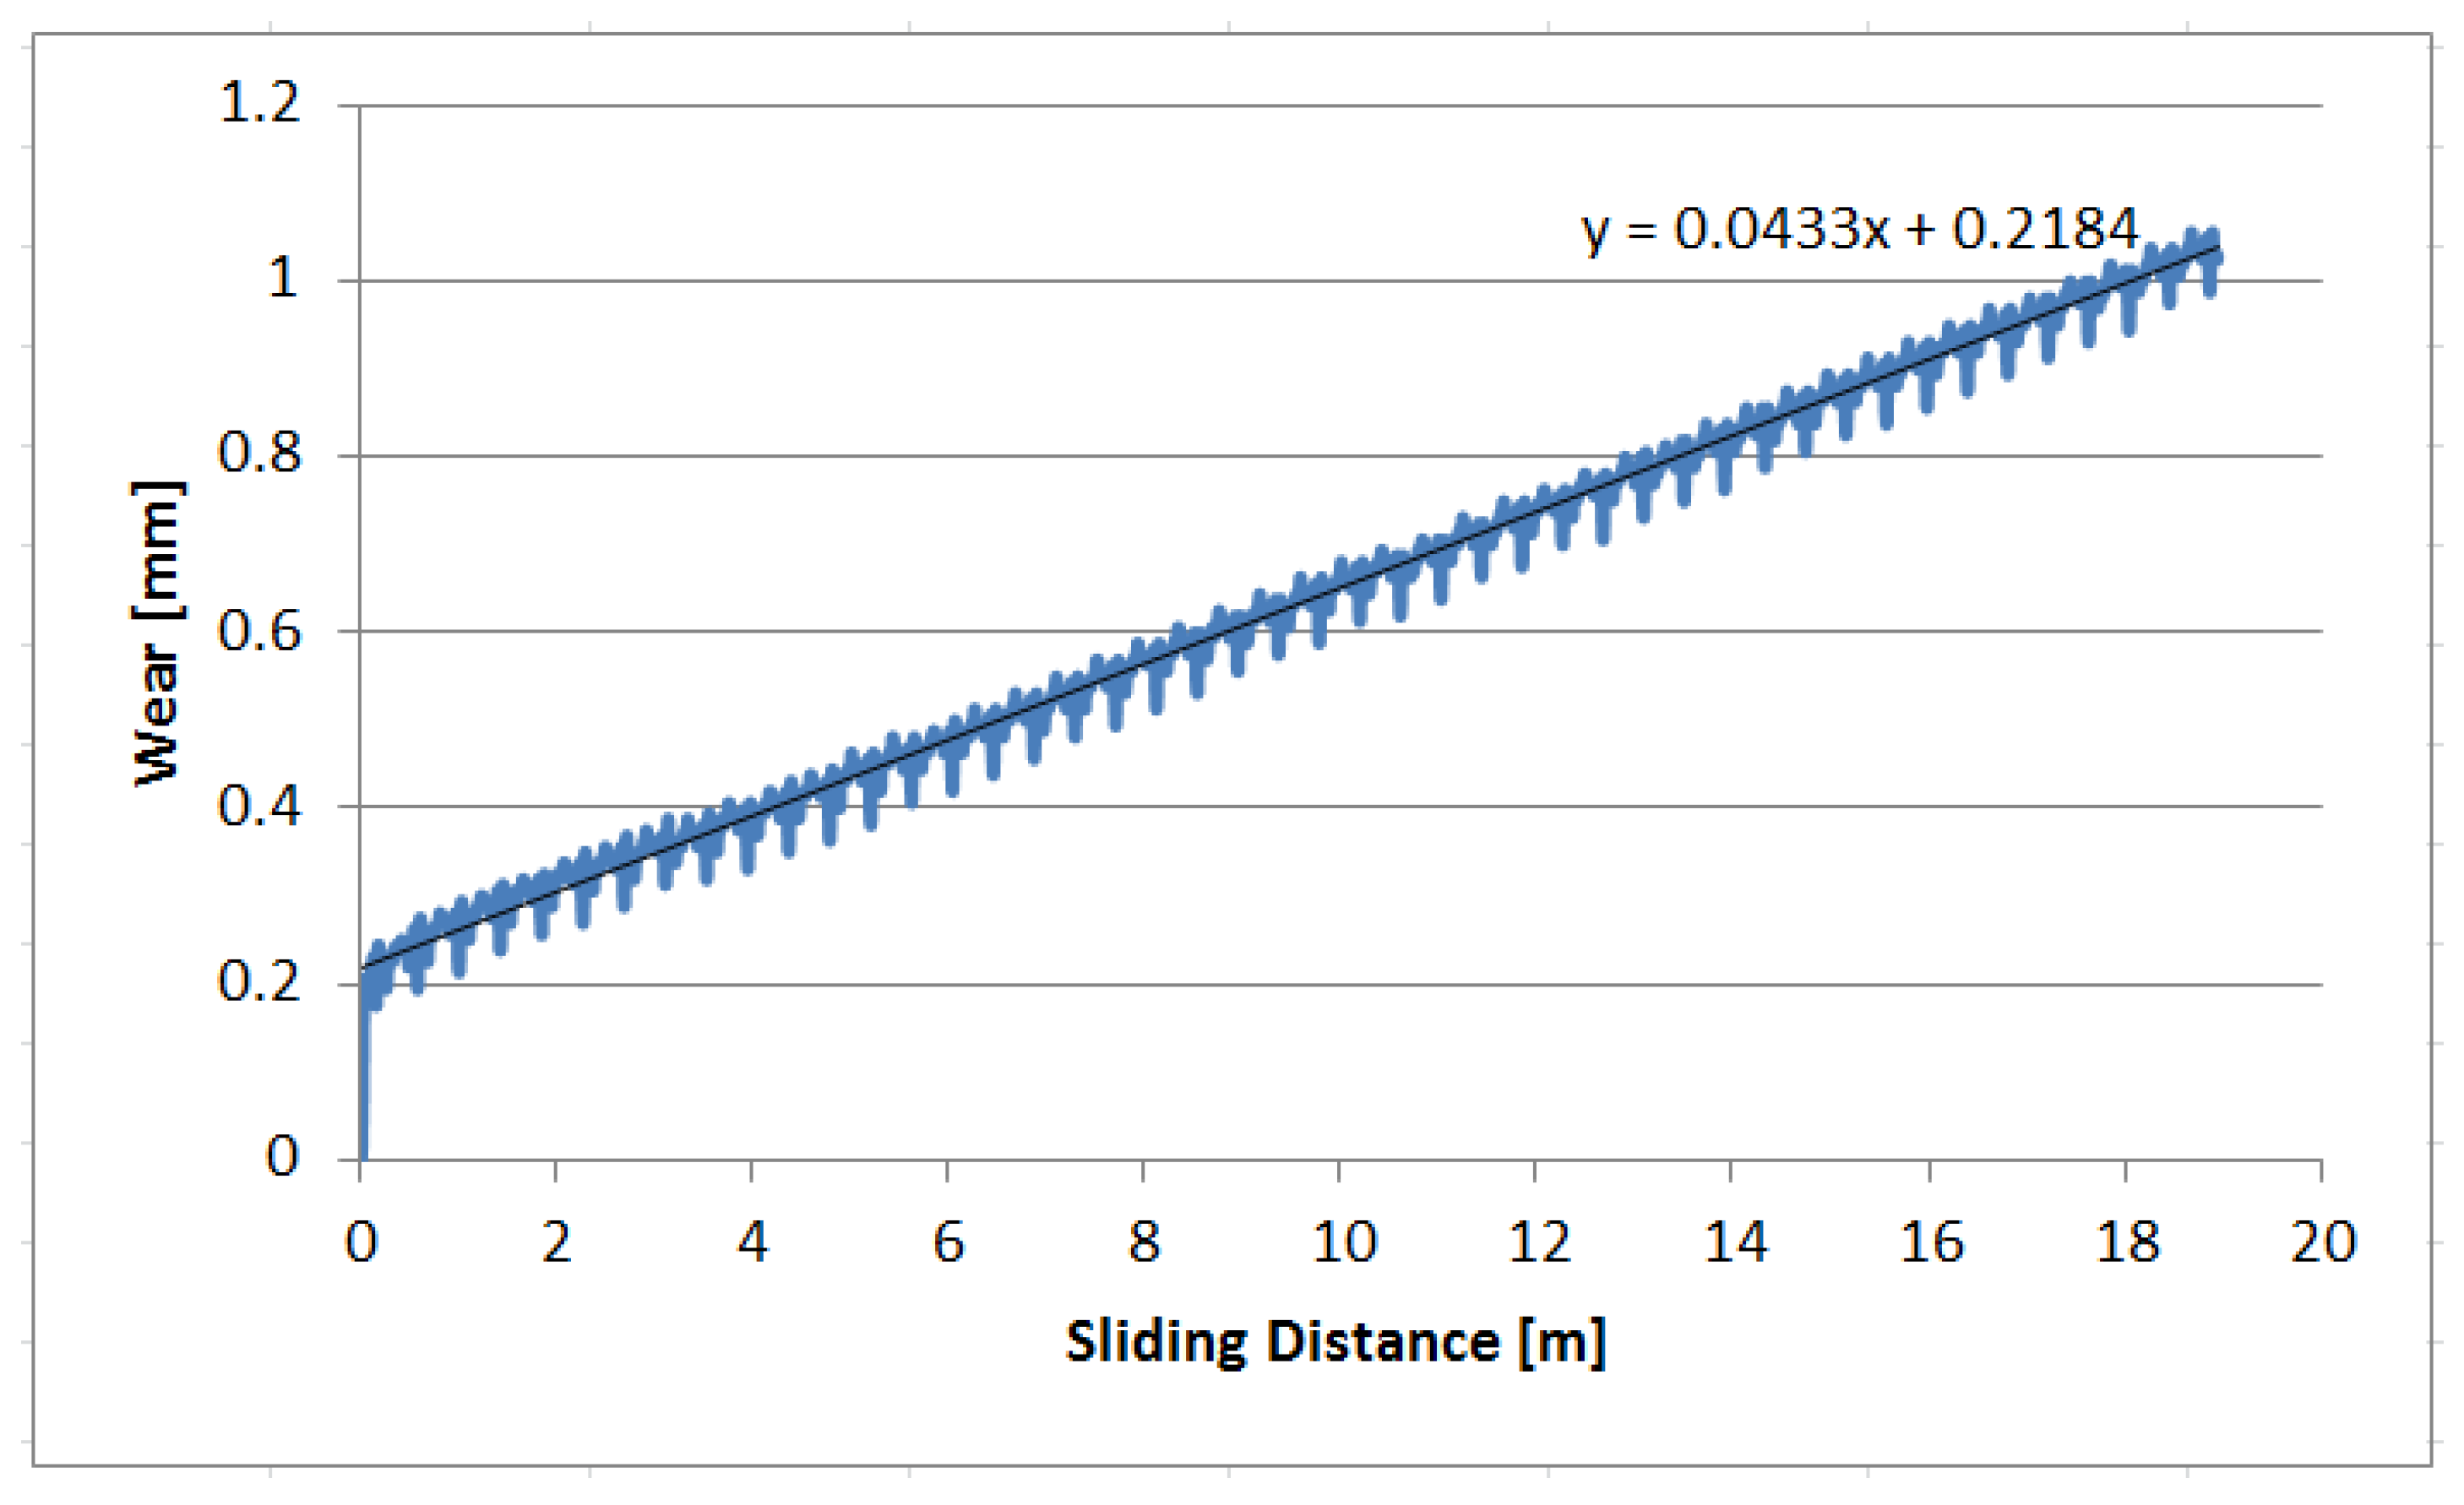
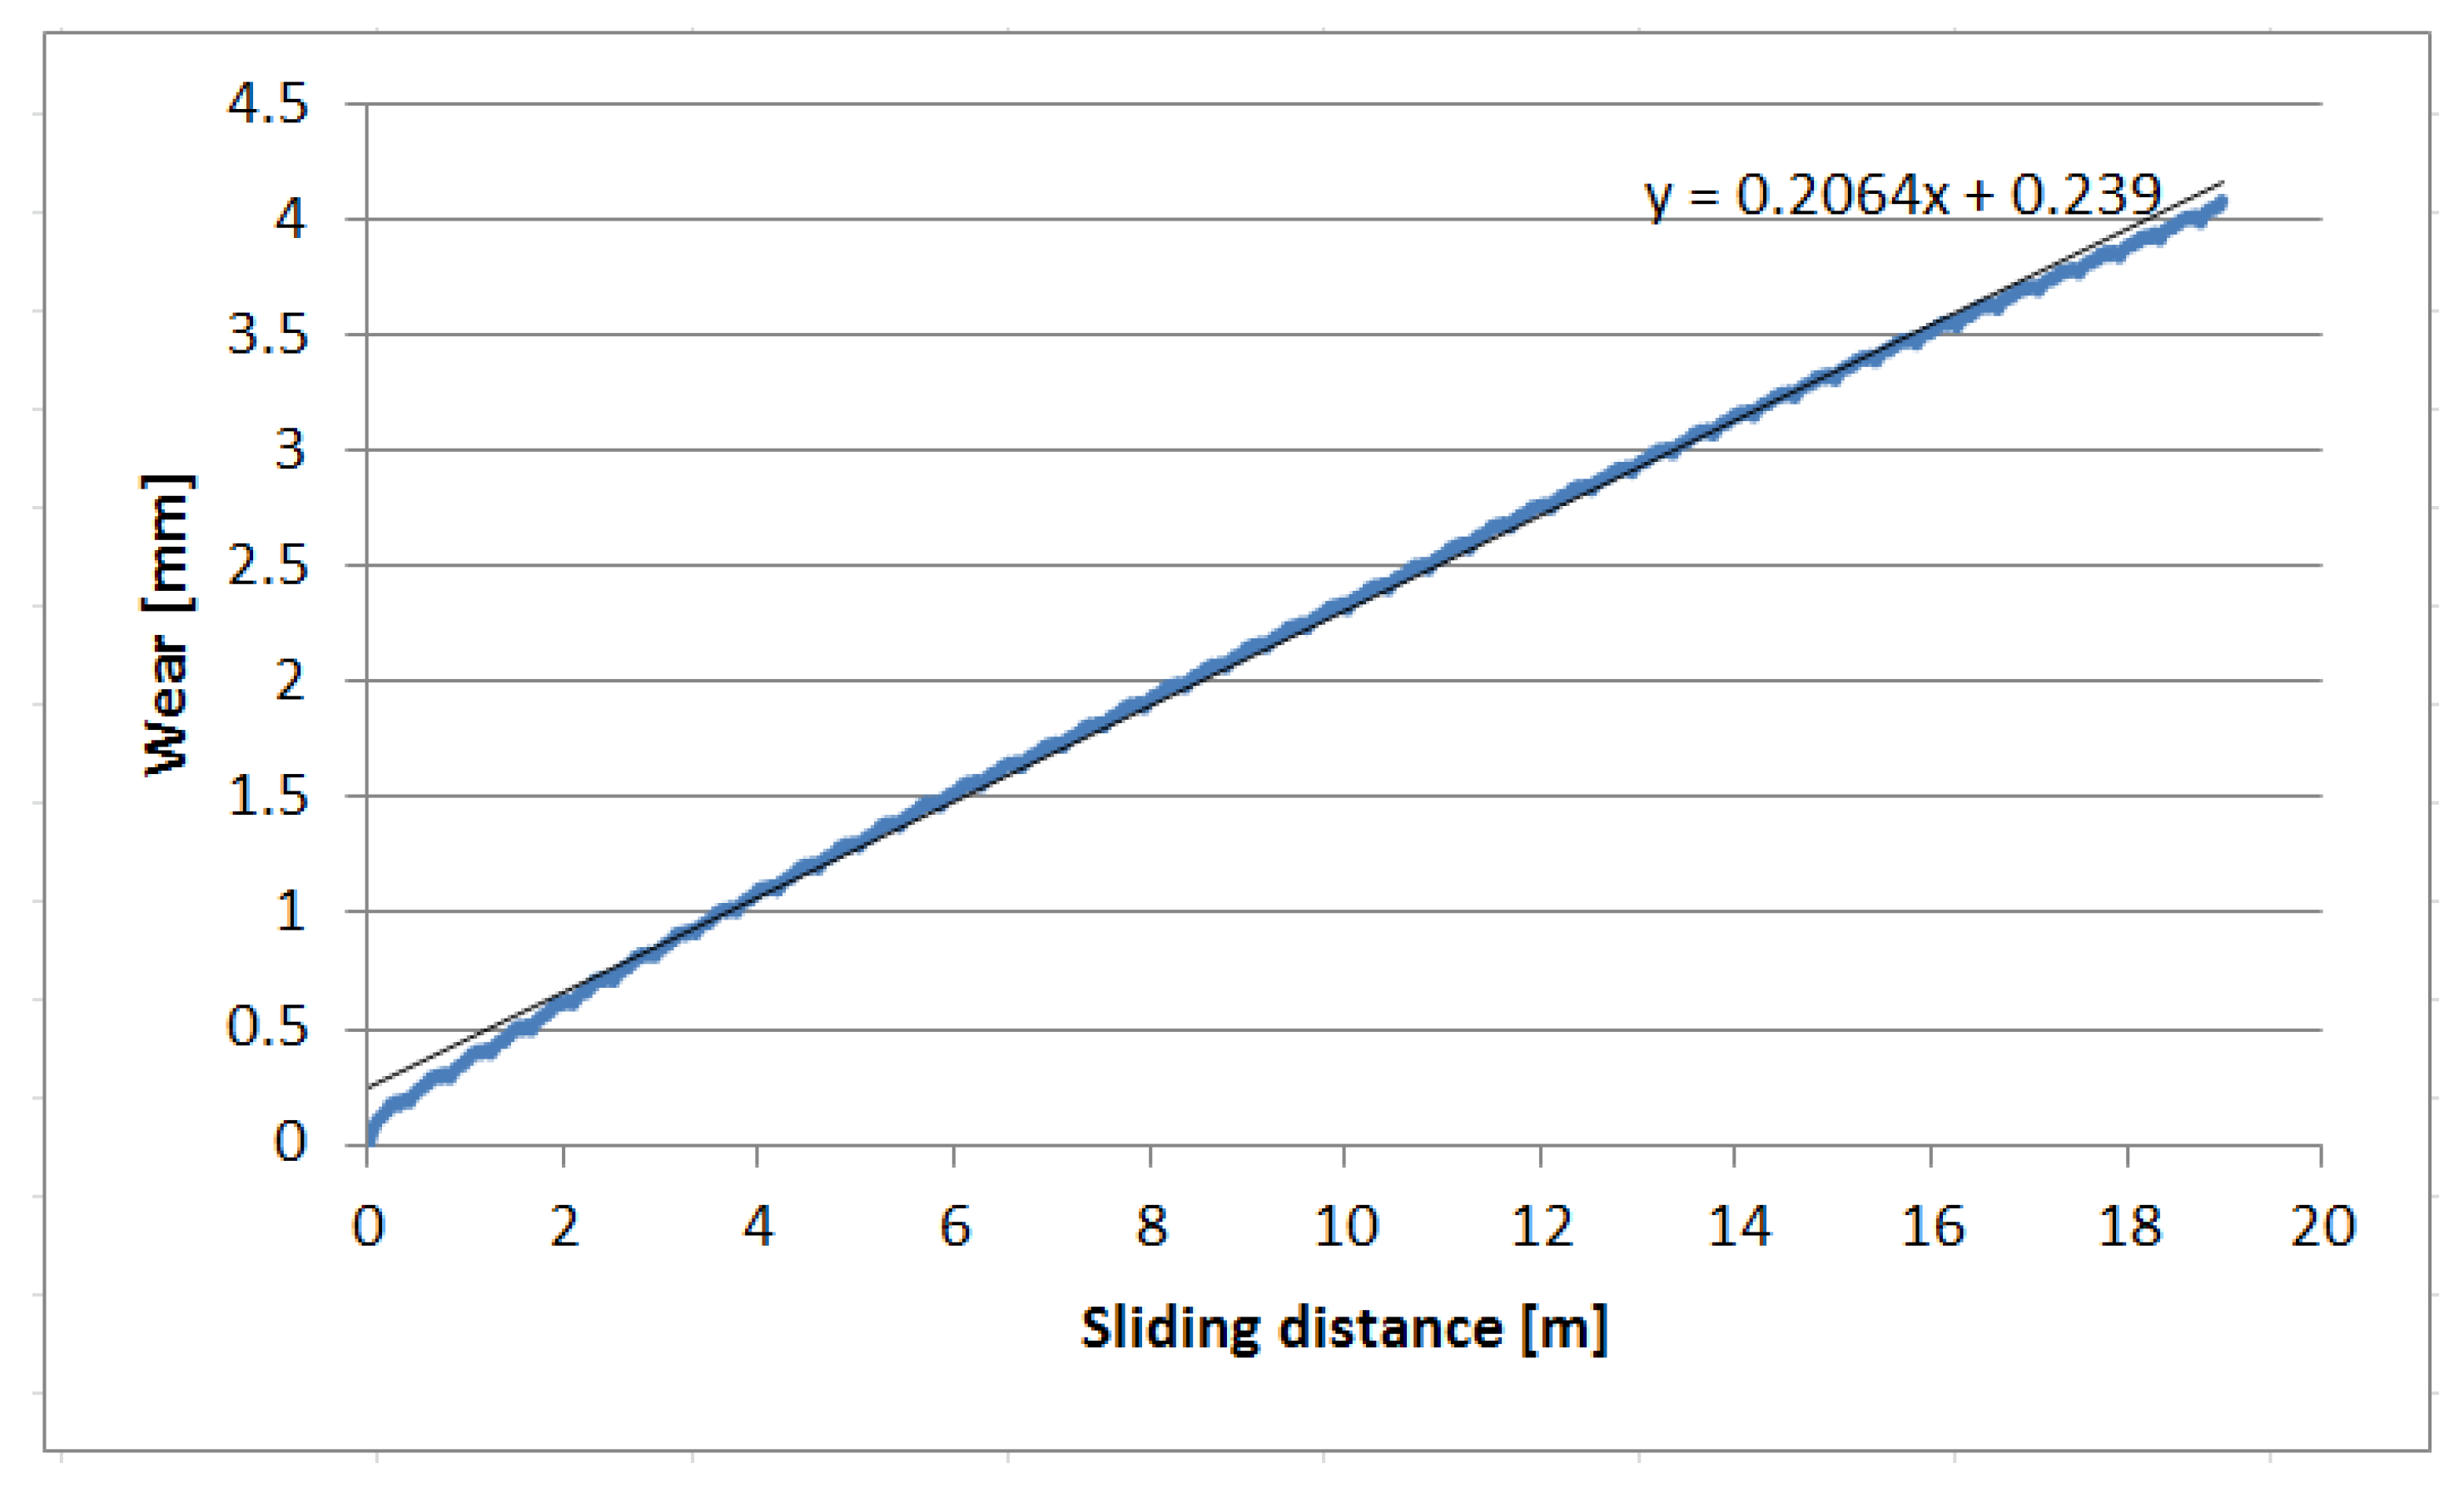
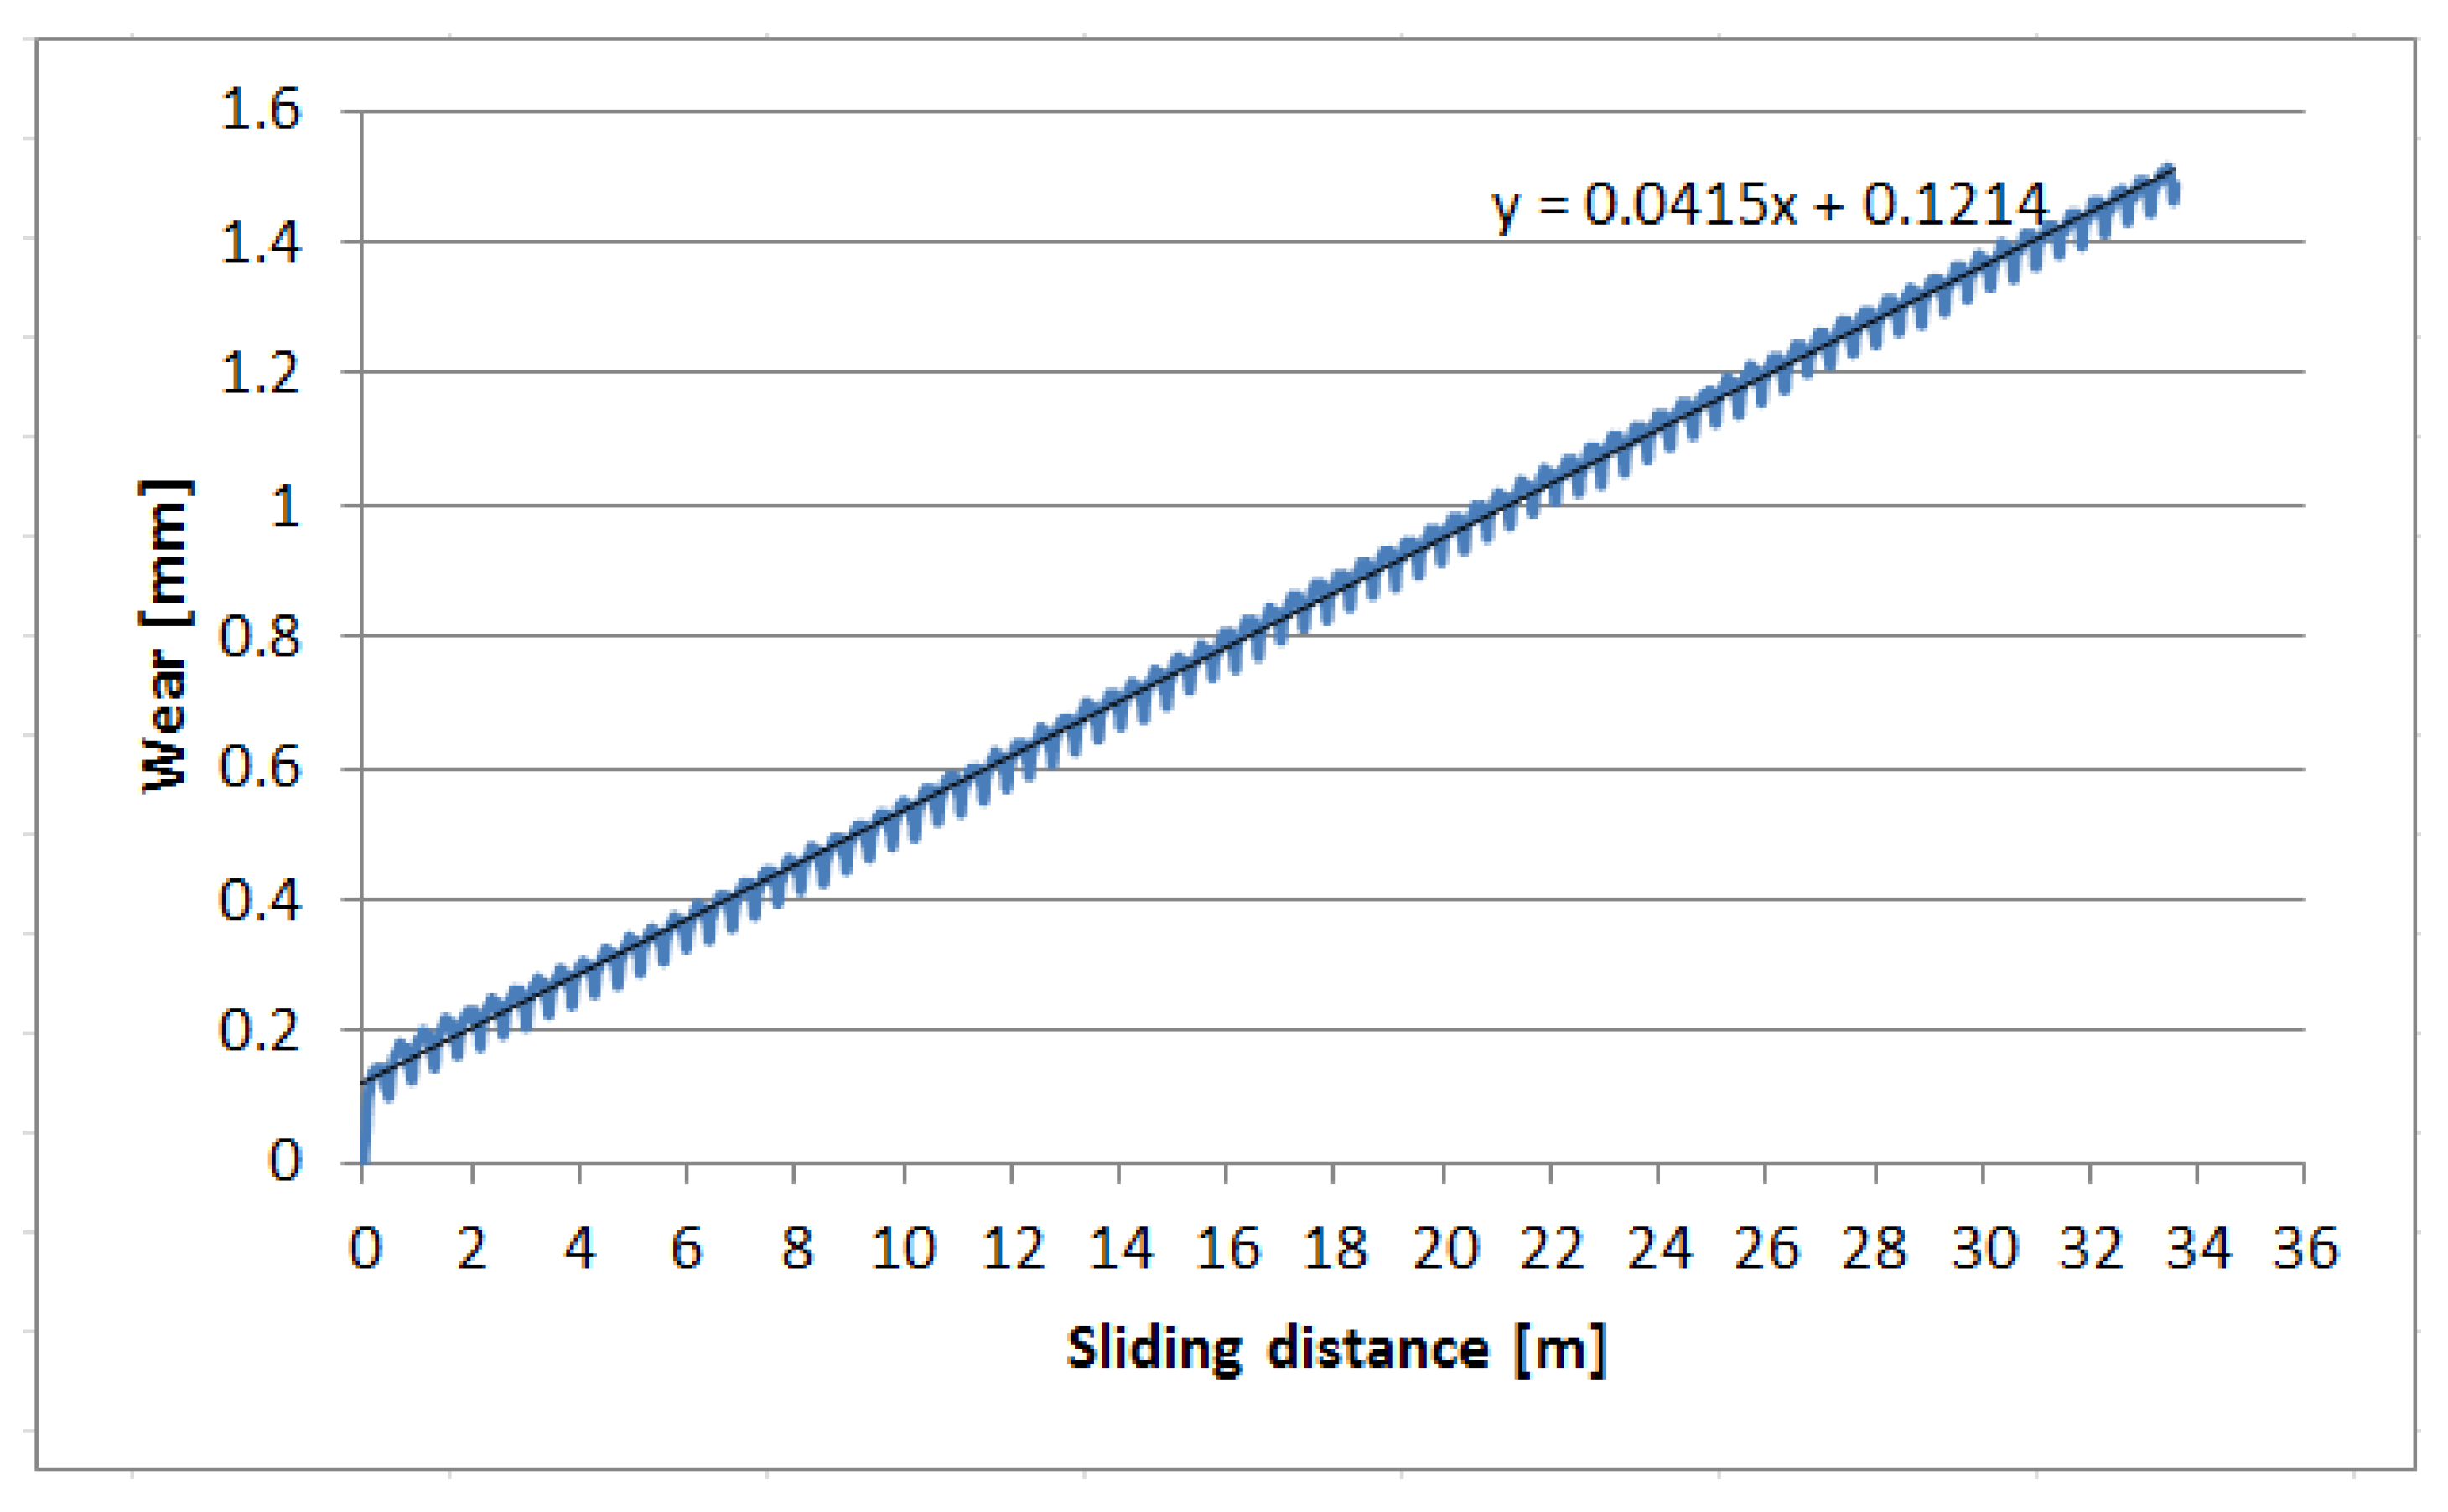
The following two figures show the relationship between the wear and sliding distance for a single specimen, these two experiments were done for an accurate load and sliding speed, wear is in [mm], while the sliding distance is in [m].
Figure 3 show relation between the wear and sliding distance for ESD PA6G specimen, during this test the load was 9.81 N and sliding speed was 0.0315476 m/s, and wear interface is P60.
Figure 4 show relation between the wear and sliding distance for ESD PA6G specimen, during this test the load was 49.05 N and sliding speed was 0.0315476 m/s, and wear interface is also P60.
3.2. The Relation between the Wear and Sliding Distance for a Several Specimens
Figure 5 show relation between the wear and sliding distance for ESD PA6G specimen, during this test the load was 9.81 N and sliding speed was 0.055789 m/s, and wear interface is P60.
3.3. Comparing between Several Polymers Type
Figure 6 demonstrates a comparison between the wear and sliding distance for several polymers types; the load is 9.81 N, the sliding speed is 0.0315476 m/s, and the wear interface is P60.
We can compare the different types of polymers by using the slope value of the wear lines.
From Figure 6 and Table 1, we can see that PA66GF30 was subjected to the highest wear rate and had the maximum slope value, while PA6G had the lowest wear rate and had the minimum slope value. HD1000, PA6E and ESDPA6G were nearly in same wear degree with relatively same slope value. And in other words, we can state that the high slope value implies high wear occurred in the specimen.
4. Discussion and Conclusions
A comprehensive literature review on what the agricultural machinery are facing wear and friction problems which leads to losses in parts and maintaining time, polymers have been appeared to introduce an excellent solution to replace these fast-wearing steel parts to increase the machine reliability besides better corrosion resistance and lighter construction.
A different polymers type were used and showed and the effects of various parameters on working performance.
In this work, many factors have been studied to test to show their effects on the general performance, like polymers types, the speed of friction, the applied loads.
At the end of this research give some suggestion that PA6G was the best choice of these use polymers because it had the lowest wear rate and how the mentioned parameters could affect the wear process during the day working.
References
- Mishra, V. Physical, mechanical and abrasive wear behaviour of jute fiber reinforced polymer composites. Doctoral dissertation, National Institute of Technology, India, 2014. [Google Scholar]
- La Mantia, F.P.; Morreale, M. Green composites: A brief review. Compos. Part A 2011, 42, 579–588. [Google Scholar] [CrossRef]
- Sawpan, M.A.; Pickering, K.L.; Fernyhough, A. Improvement of mechanical performance of industrial hemp fibre reinforced polylactide biocomposites. Compos. Part A Appl. Sci. Manuf. 2011, 42, 310–319. [Google Scholar] [CrossRef]
- Thakur, V.K.; Manju, K.T.; Raju, K.G. Review-Raw Natural Fiber–Based Polymer Composites. Int. J. Polym. Anal. Charact. 2014, 19, 256–271. [Google Scholar] [CrossRef]
- Kim, S.H.; Park, C.H. Direct impregnation of thermoplastic melt into flax textile reinforcement for semi-structural composite parts. Ind. Crop. Prod. 2017, 95, 651–663. [Google Scholar] [CrossRef]
- Svensson, N.; Shishoo, R.; Gilchrist, M. Manufacturing of Thermoplastic Composites from Commingled Yarns—A Review. J. Thermoplast. Compos. Mater. 1998, 11, 22–56. [Google Scholar] [CrossRef]
- Biron, M. Outline of the Actual Situation of Plastics Compared to Conventional Materials. In Thermoplastics and Thermoplastic Composites, 2nd ed.; William Andrew Publishing: Oxford, UK, 2013; pp. 1–29. [Google Scholar]
- Khondker, O.A.; Ishiaku, U.S.; Nakai, A.; Hamada, H. A novel processing technique for thermoplastic manufacturing of unidirectional composites reinforced with jute yarns. Compos. Part A Appl. Sci. Manuf. 2006, 37, 2274–2284. [Google Scholar] [CrossRef]
Figure 1.
Pin-on-plate wear device.

Figure 2.
Spider 8, a strain gage measurement device.

Figure 3.
The relation between the wear and sliding distance for a single specimen.

Figure 4.
The relation between the wear and sliding distance for a single specimen.

Figure 5.
The relationship between the wear and sliding distance for a single sample.

Figure 6.
The relation between the wear and sliding distance for a several polymers types.


Table 1.
Wear line equation and the slope value of the different polymers types.
| Type | Wear Line Equation | Slope Value |
|---|---|---|
| PA66GF30 | y = 0.1198x + 0.2253 | 0.1198 |
| HD1000 | y = 0.0508x + 0.1724 | 0.0508 |
| PA6E | y = 0.0457x + 0.2175 | 0.0457 |
| ESD PA6G | y = 0.0433x + 0.2184 | 0.0433 |
| PA6G | y = 0.0258x + 0.1917 | 0.0258 |
Publisher’s Note: MDPI stays neutral with regard to jurisdictional claims in published maps and institutional affiliations. |
© 2018 by the authors. Licensee MDPI, Basel, Switzerland. This article is an open access article distributed under the terms and conditions of the Creative Commons Attribution (CC BY) license (https://creativecommons.org/licenses/by/4.0/).
Share and Cite
MDPI and ACS Style
Muhandes, H.; Kalácska, G.; Kadi, N.; Skrifvars, M. Pin-on-Plate Abrasive Wear Test for Several Composite Materials. Proceedings 2018, 2, 469. https://doi.org/10.3390/ICEM18-05333
AMA Style
Muhandes H, Kalácska G, Kadi N, Skrifvars M. Pin-on-Plate Abrasive Wear Test for Several Composite Materials. Proceedings. 2018; 2(8):469. https://doi.org/10.3390/ICEM18-05333
Chicago/Turabian StyleMuhandes, Hasan, Gábor Kalácska, Nawar Kadi, and Mikael Skrifvars. 2018. "Pin-on-Plate Abrasive Wear Test for Several Composite Materials" Proceedings 2, no. 8: 469. https://doi.org/10.3390/ICEM18-05333