1. Introduction
As contemporary industries need to innovate on a regular basis, there has been an increasing interest in the development and characterization of new types of materials. Composite materials in particular are very interesting due to their high stiffness-to-weight ratio along specific directions. Unfortunately, the addition of fibers to the material matrix leads to a higher level of anisotropy, which makes the full characterization of the stiffness tensor a very challenging task. In order to accurately determine the stiffness parameters of the material under study, advanced approaches are needed. While the state-of-the art offers several possibilities (e.g., C-scan [
1], bulk and Lamb wave based approaches [
2]), none of the current methods can fully determine the stiffness tensor as they are limited by several constraints, such as an accurate knowledge of the orientation of the symmetry axes which is often not available.
The Ultrasonic Polar Scan [
3,
4] (UPS) is a relatively recent technique which can bypass the former problem.
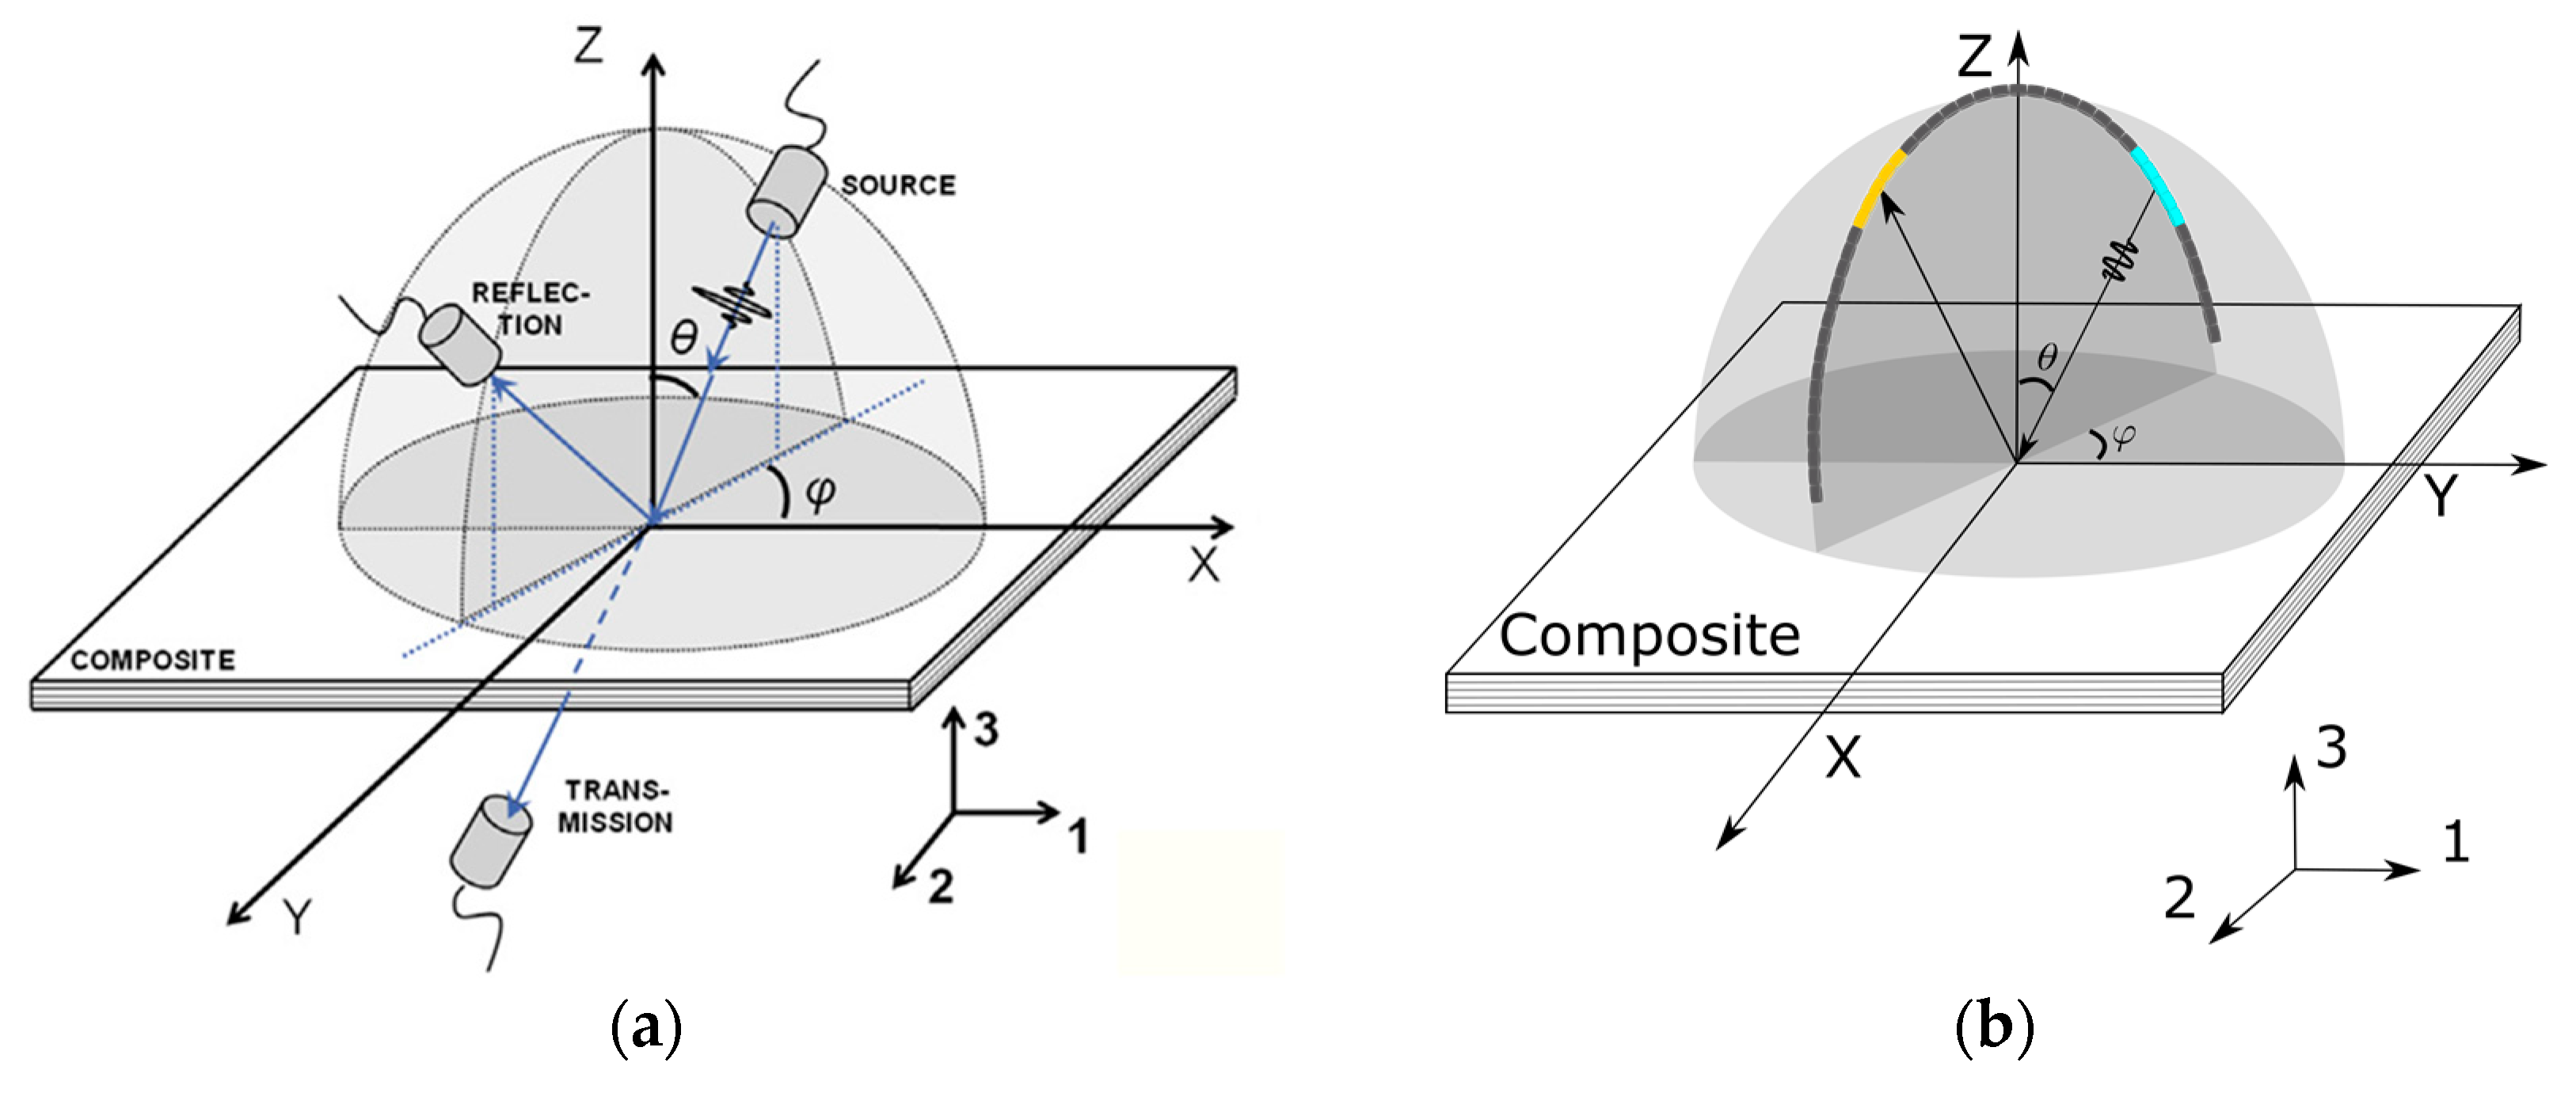
Figure 1a illustrates the basic working principle of the UPS setup. A first transducer sends out an ultrasonic broadband pulse, with a center frequency
fc between 1 and 5 MHz, towards a specific material spot from several incidence angles
Ψ(
θ,
ϕ). This signal interacts with the plate after which its reflection or transmission signal is measured by a second transducer. Polar plots of the amplitude or the Time-of-Flight (TOF) of these signals then show characteristic contours which offer a local fingerprint of the stiffness parameters of the material, which can be extracted by means of an inversion algorithm [
5,
6,
7]. For harmonic excitation signals, the extrema in the polar plots correspond to the conditions for efficient Lamb wave stimulation, which offer a similar relation to the stiffness parameters. Applying this harmonic UPS procedure for different frequencies (individually or at once using a spectroscopic analysis of a pulse) offers more information to be used in the inversion algorithm, leading to potentially better parameter estimations.
Unfortunately, the full potential of the UPS technique is currently limited due to some practical issues with the experimental setup. The positioning of the transducers is mechanically controlled, leading to relative long measurement times (~15 min) and a bulky, non-portable scanning system. Additionally, the finite aperture transducers produce bounded beams such that no pure Lamb modes [
8] are induced. Finally, non-specular phenomena are not recorded although they contain supplementary information on the response of the insonified plate [
9].
Therefore, we propose to replace the current mechanical scanner by a phased array consisting of small piezoelectric elements. As such, a portable and much faster device can be created which does not rely on any mechanical movements.
Figure 1b present such a device based on a circular array in which the incident angle
θ is defined by activating a specific subset of elements. By applying appropriate element-specific time delays and apodization weights, the beam can be tuned such that a quasi-plane wave can be created [
10] and specific Lamb modes can be activated. The synthetic plane wave technique can be used to eliminate compulsory bounded beam effects such that the dispersion curves can be found in an accurate manner.
This present contribution deals with the simulation of such an (idealized) circular array and the illustration of its use to determine the dispersion behaviour of aluminum and carbon epoxy plates.
2. Simulation Model
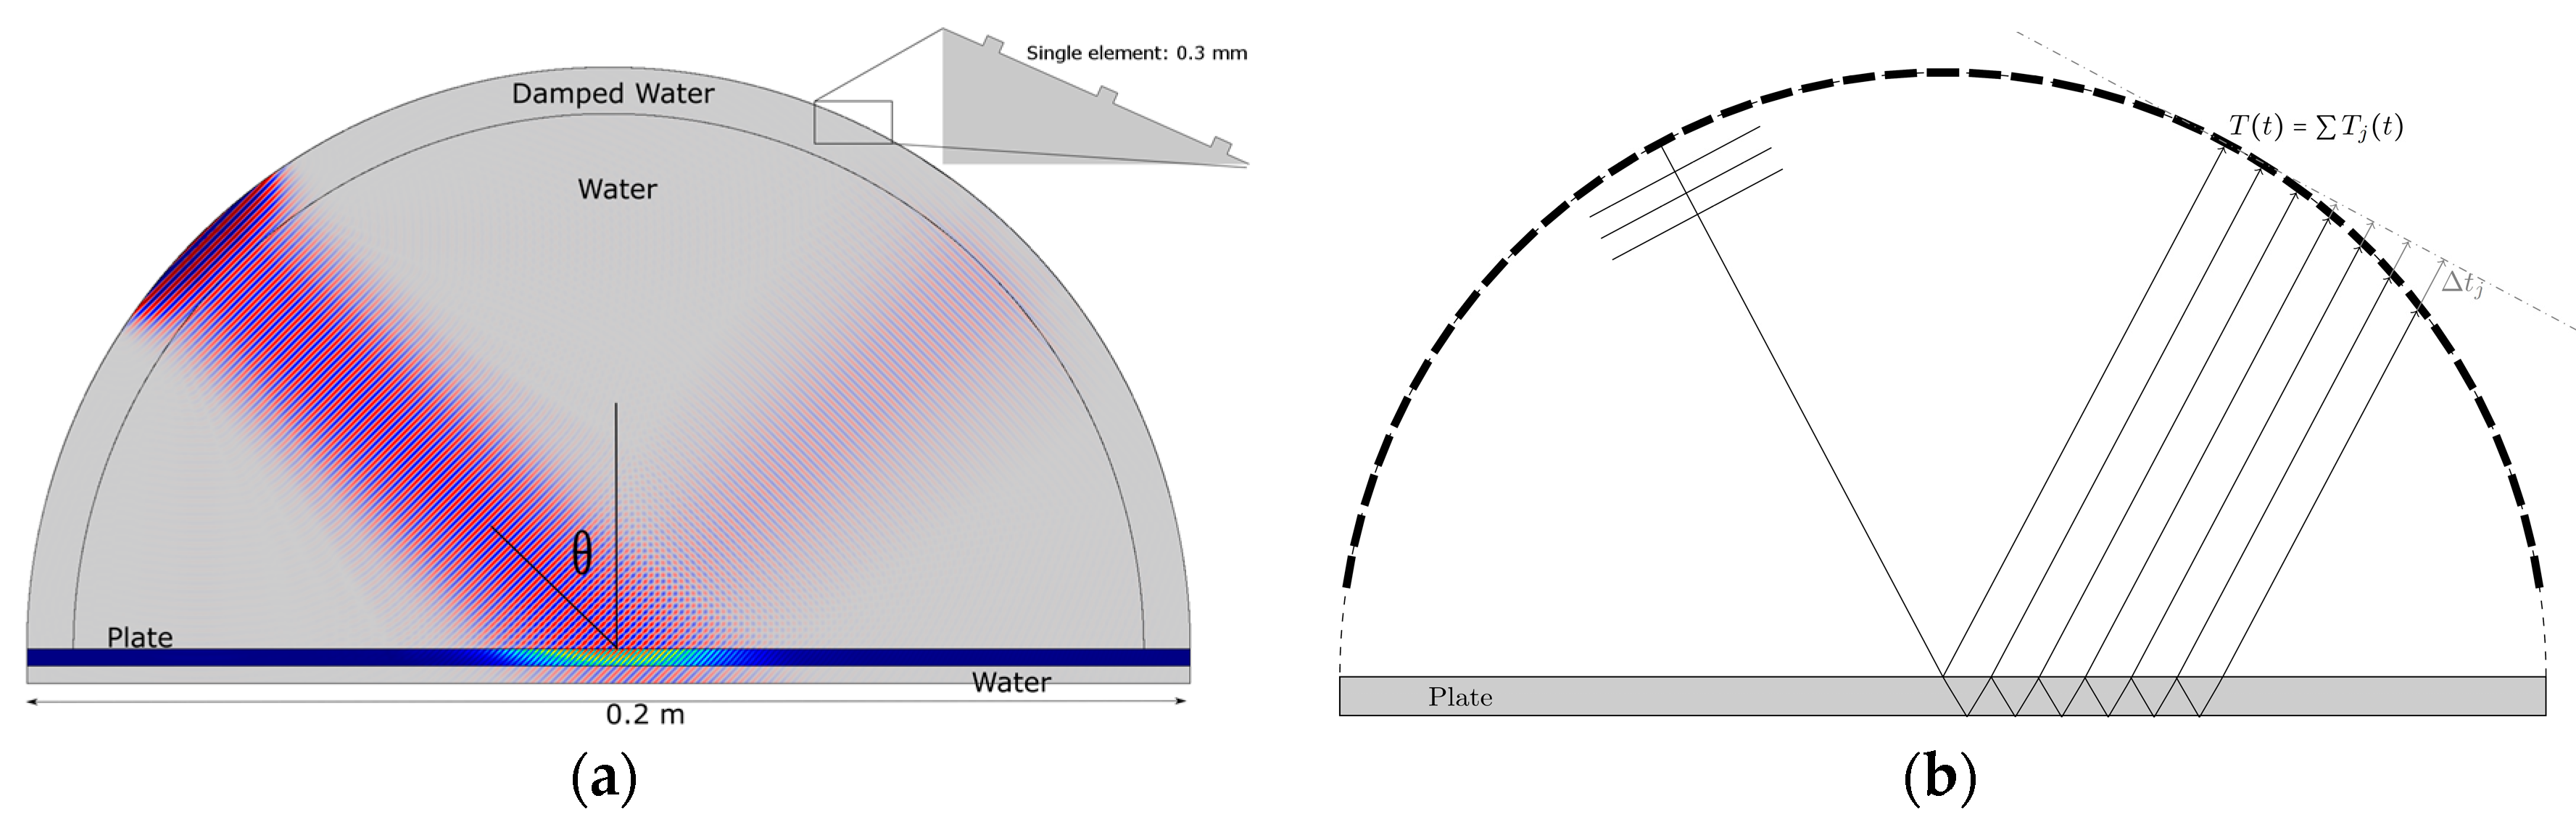
In order to explore the capabilities of the phased array, a Finite Element simulation model (2D) was created within COMSOL Multiphysics. A representation of this model can be seen in
Figure 2 (left). The model consists (from top to bottom) of a damped water domain, a regular water domain, the plate under investigation, and a bottom layer of water to fully capture the water loading conditions of the plate. The outer circular boundary actually consists of small (width = 0.3 mm, see inset), discrete pressure boundaries which represent the array elements. By activating a subset of these elements, an ultrasound beam can be created at a specific incident angle
. Taking into account the curvature of the array, phase shifts and apodization factors can be imposed to create a bounded beam with a central plane phase [
10].
Figure 2a shows an example of such a beam profile. Absorbing boundary conditions are used at the bottom boundary to avoid the transmitted beam to be reflected back towards the plate. A damping layer is used to eliminate additional reflections from the upper boundaries (pressure boundaries).
To simulate the incident pulses, it was chosen to work in the frequency domain instead of working in the time domain, and to reconstruct the time signal afterwards. This is done by multiplying the frequency domain results by the spectral content of the incident pulse used in the study, and by subsequently applying an Inverse Fourier Transform. For each separate incident angle, 370 different frequencies between 0 and 2 MHz have been simulated. This procedure has the added flexibility that multiple studies with different pulses, and hence different spectral contents (limited to the simulated frequencies), can be performed with a single dataset. The complex pressure values which are to be used in the Inverse Fourier Transform are collected on points near the array elements. Note that at small angles, the complex pressure values will contain the information of both the incident and reflected pulse. In order to find accurate results in the subsequent steps, the incident pulse must be filtered out of the time signals.
As mentioned before, pure Lamb modes can only be excited under the input of an infinite plane wave. Although the operation parameters of the array can be tuned to create a bounded beam with plane wave characteristics, the beam is still composed of a range of incident
angles which individually might lead to the excitation of Lamb modes. Therefore, it is essential to eliminate these unwanted bounded beam effects. This can be done by applying the synthetic plane wave technique, first introduced in transmission experiments [
11] and later adapted for the reflection regime by Jocker and Smeulders [
12]. In the present paper, their procedure has been adapted for a curved phased array and is illustrated in
Figure 2b. Using all phased array elements on the circle, the complete reflection field can be captured. This field is composed of a specular contribution which is due to a direct reflection from the plate, and a non-specular contribution which is attributed to the leakage of the energy of the Lamb wave travelling through the plate into the surrounding medium. Each element measures an individual time trace, but the complete trace
can be found by adding these traces together. Following the notation of Jocker and Smeulders
is given by:
where
represents the time trace measured by array element
sent out by the finite aperture source
(comprised of a subset of emitting array elements). The second equality is due to the principle of reciprocity of sound waves which essentially means that the source and receiver can be swapped in positions.
Equation (1) thus shows that the total time signal can be reconstructed by creating the appropriate conditions in which each of the receiving array elements emits the incident signal instead, and vice versa. Due to the large receiving surface and the principle of reciprocity, a large emitting surface can effectively be approximated. However, as this surface of the phased array is curved, there will be no plane wave created. This issue can be solved by applying time shifts (see
Figure 2b) to align the time traces as if they would be collected by a planar array. These time delays can easily be calculated based on the geometry of the array, and the knowledge of the speed of sound in the propagating medium. Eventually, this procedure allows to approximate plane wave results based on an incident bounded beam. The time traces found via this approach can then be further processed by using a Fourier Transform. After division by the reflection values of the reference measurement, this immediately results in the reflection coefficients of interest which can then be plotted as separate slices of the frequency and thickness product
, or combined in order to retrieve the full dispersion behaviour.
3. Results and Discussion
The simulation model described in the previous section has been used for the case of aluminum (C11 = C22 = C33 = 110.5-2.2i GPa, C12 = C13 = C23 = 58.5-1.17i GPa, C44 = C55 = C66 = 26.5-0.52i GPa, d = 3 mm). The calculated reflection coefficients in
space can be seen in
Figure 3a. The minima in this plot correspond to the conditions for efficient Lamb wave excitation in the material, and as such represent the dispersive behaviour of the material. The black stars correspond to the theoretically calculated dispersion curves in which the water loading of the plate was taken into account. It is clear that an excellent match is found between theory and simulation. While the dispersion curves are nicely recovered, there are still some minor inconsistencies in the simulation model. First, oscillatory variations of the reflection coefficient as function of the frequency are apparent for the lowest frequencies. These are due to the damping layer in the model which introduces some additional spurious reflections and to the limited size of the calculation model. Indeed, as the two water media in the simulations are not identical, part of the incident wave will naturally be reflected. Furthermore, irregularities occurring at
-values between 0.5 and 2 MHz.mm and
angles between 10 and 25° produce oscillations around the
S0 mode as a function of the incident angle. In this case, the wavelength of the wave traveling through the plate is so large that the non-specular field extents outside the computational domain. This results in a loss of information for the reconstruction of the plane wave leading to oscillations around the fundamental mode.
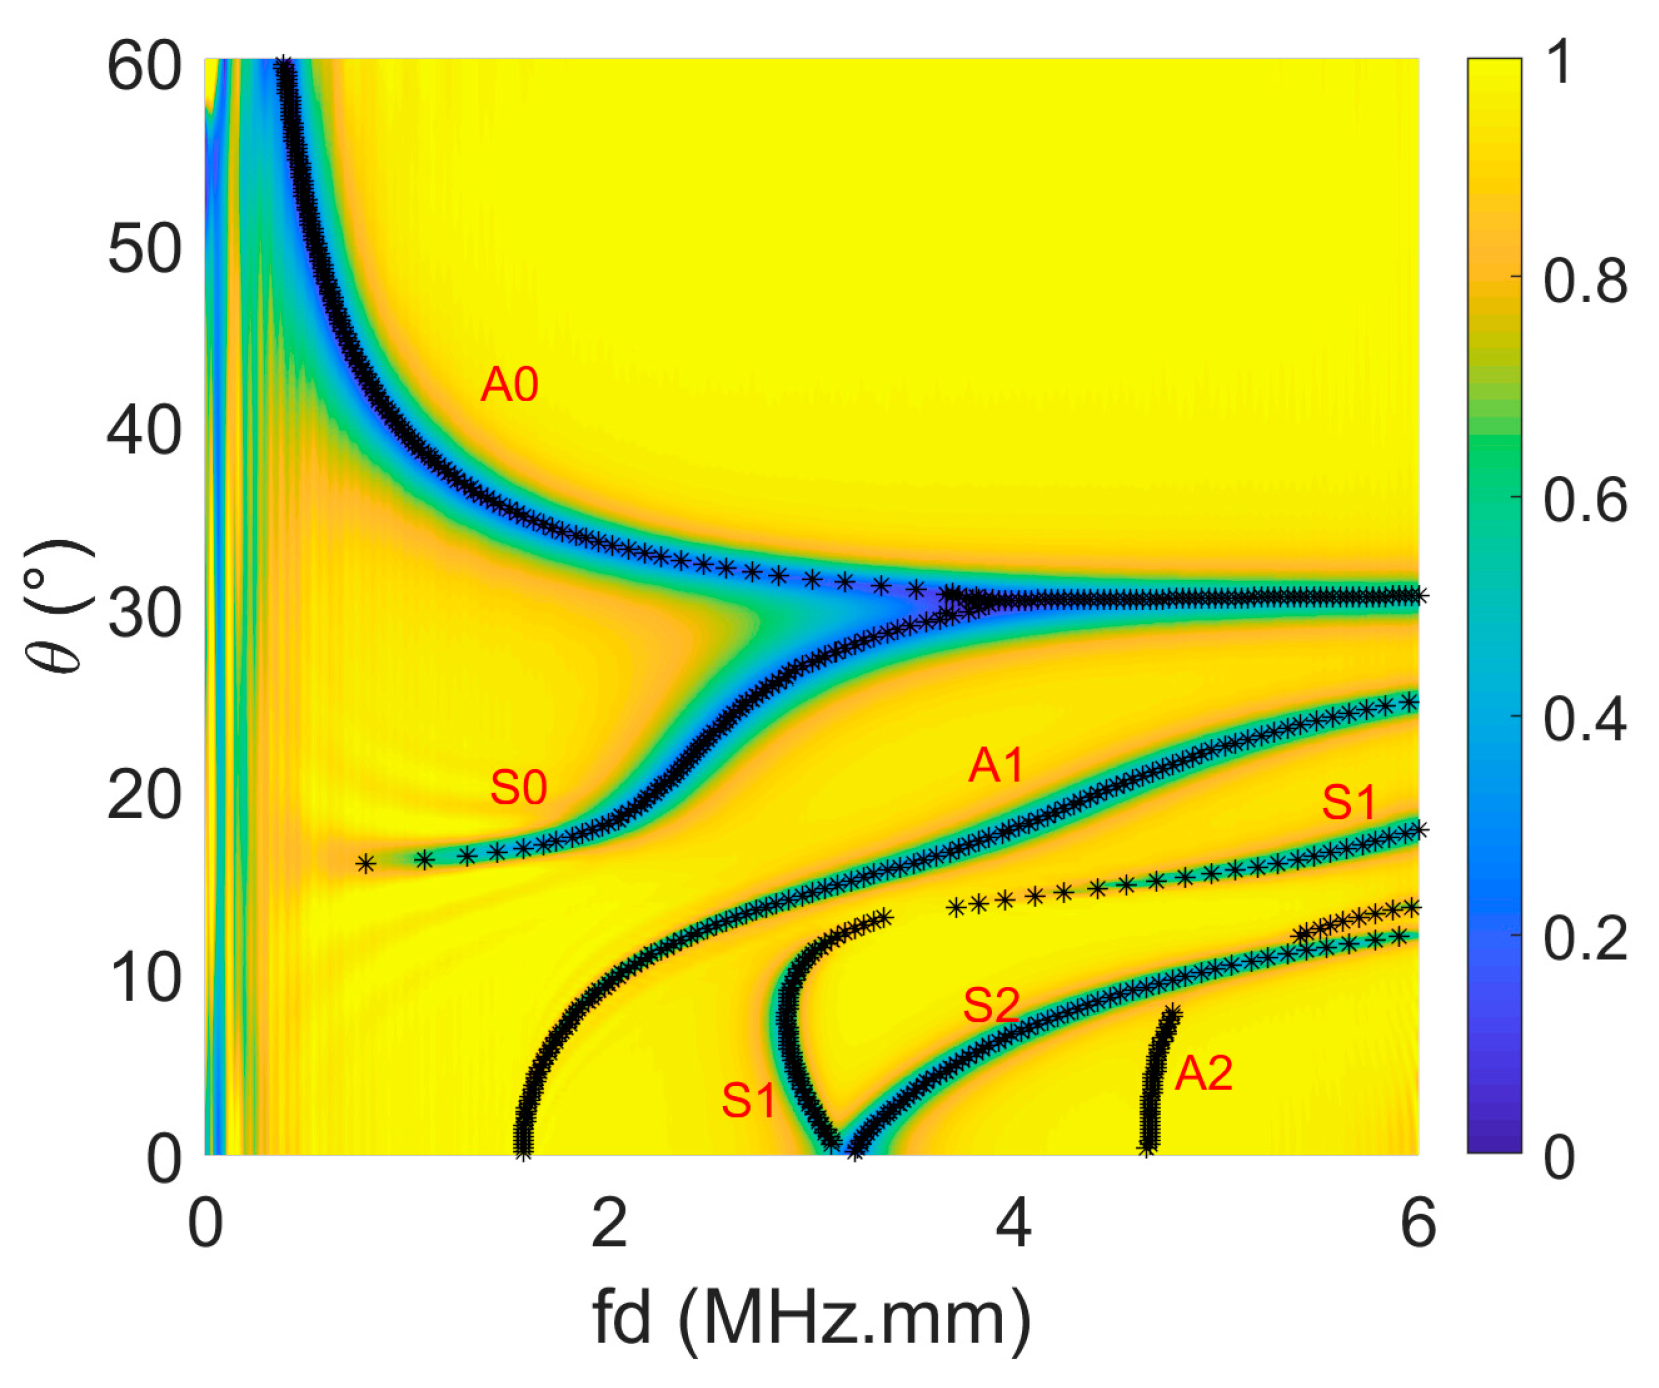
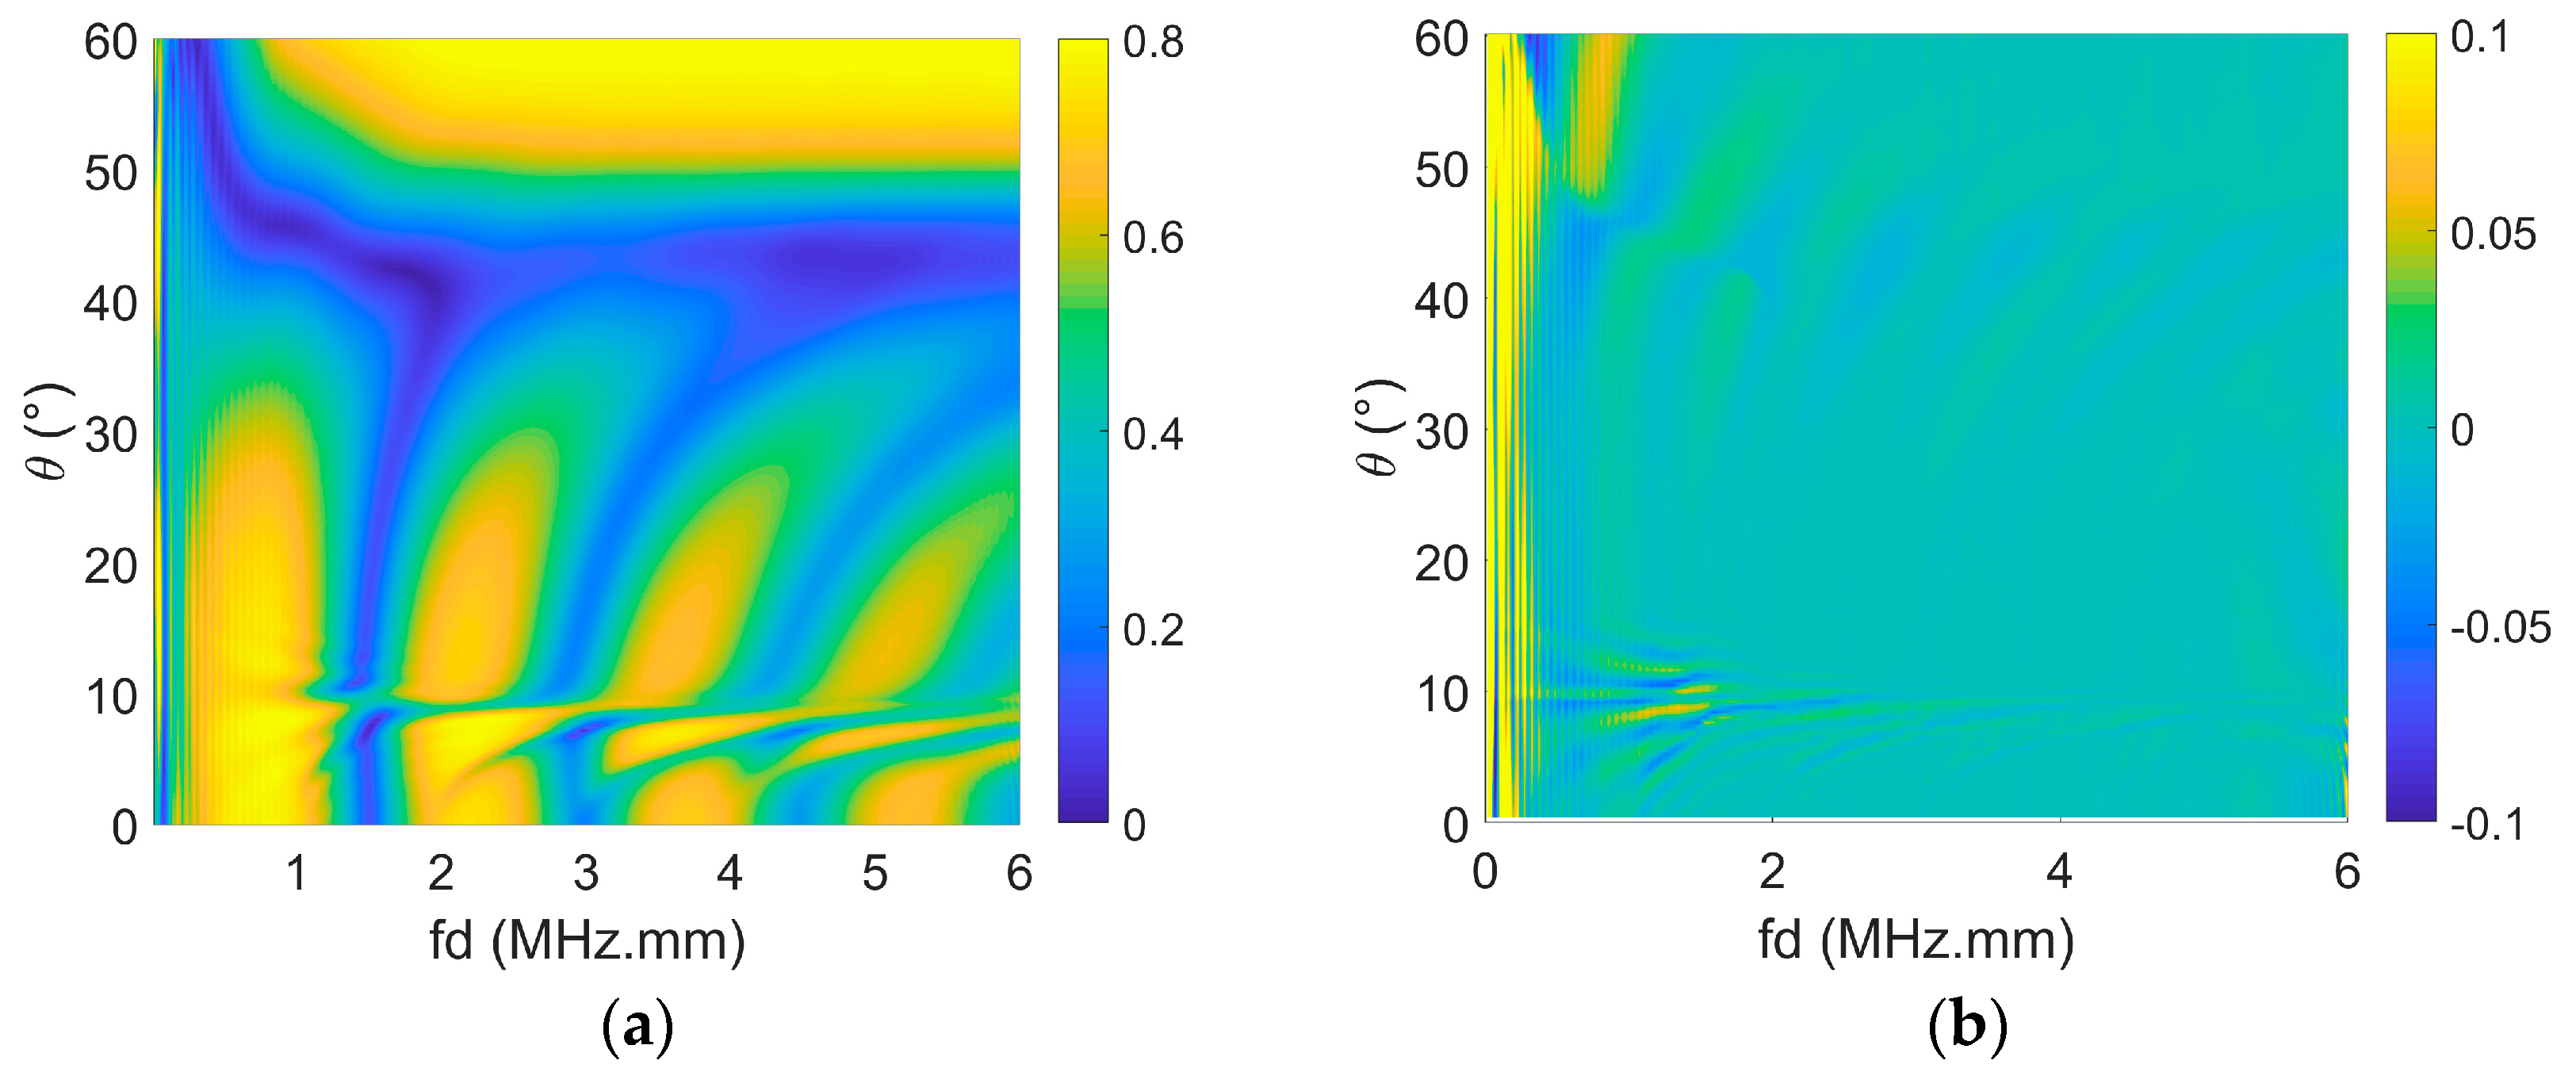
A second case study involves a 3 mm thick unidirectional Carbon Epoxy plate of which the viscoelastic parameters are listed in
Table 1. Orthotropic materials have a much more elaborate dispersive behaviour as their response depends on the in-plane polar angle
. Moreover, when this in-plane angle does not coincide with one of the symmetry axes of the material, the wave energy in the plate will skew. As the non-specular reflection field is composed of the energy which is leaked by the wave modes in the plate, this field will experience the same skewing [
8]. For obvious reasons, the 2D model under consideration cannot capture this effect, and we restrict ourselves in
Figure 4a to only showing the solution for
= 0. The dispersion curves are again coupled to the minima in the reflection landscape. Even the sharp variations around
= 8° are nicely resolved. The quality of the obtained dispersion curves is also apparent in the difference plot shown in
Figure 4b. Overall the difference between the simulation and theory remains small (note the color bar), and one can only see a clear disagreement for the lower frequencies. Additionally, between 1 and 2 MHz and for incident angles of approximately 8°, some oscillatory behaviour can be seen. Both discrepancies are believed to have the similar origin as discussed in the aluminum case. Nevertheless, the presented results show that the determination of the dispersion curves with the new UPS device should be possible with a high accuracy.

 ,
, 


