1. Introduction
Steel fibre pull-out tests are already performed frequently, particularly in the development of new types of fibres. However, the traditional pull-out test setups, measuring load and displacement, rapidly become restricted for investigating damage initiation and propagation within the concrete specimen. Especially for more complicated fibre shapes, such as hooked-end fibres, the interaction of end hook and matrix becomes an important aspect of the pull-out force and behavior. Furthermore, cyclic loading is a frequent loading case for structural elements. However, the fatigue behavior of steel fibre reinforced concrete and the cyclic pull-out behavior are less investigated to date. Therefore, two advanced non-destructive testing (NDT) methods are applied in combination with pull-out tests, to gain more insight in the monotonic and cyclic behavior of steel fibres in a concrete matrix.
X-ray microfocus Computed Tomography (micro-CT scans) characterizes the microstructure of a non-transparent element in three dimensions at a specific time. The technique is based on the differences in absorption and attenuation of electromagnetic waves through the material. The main advantages of micro-CT scans are the non-destructive microscopical visualization of objects in natural condition without preparation (e.g., such as thin sections) and the resulting three-dimensional information. A long recording and calculation time and the discrete moments of scanning are the main disadvantages [
1,
2,
3].
The Acoustic Emission (AE) monitoring technique detects the early stages of micro-cracking and locates the damage initiation. A localized source where stress redistributions or microstructural changes occur, for example cracking of the material, releases strain energy. The generated elastic waves propagate to the surface and are recorded by piezoelectric transducers. Continuous, non-destructive monitoring of an element and damage localization are the main advantages of the AE technique. On the other hand, the interpretation of the measurements must be done carefully and profoundly to relate them to possible sources and to draw correct conclusions [
4,
5,
6].
This research aims to investigate the use of two NDT methods (i.e., AE monitoring and micro-CT scans) additional to the traditional pull-out tests. Both monotonic and cyclic behavior are taken into account and two types of steel fibres are used, namely 3D and 5D hooked-end fibres. The paper shortly elaborates the experimental program and thereafter, the measurements of micro-CT scans, AE monitoring and combination of both are presented and discussed.
2. Experimental Program
2.1. Specimen Geometry
40 hooked-end steel fibres (15 of type Dramix 3D-80/60-BG and 25 of type Dramix 5D-65/60-BG) are individually embedded in the center of a concrete cylinder. The former type has a diameter of 0.75 mm and a tensile strength of 1125 MPa, the latter type has a diameter of 0.92 mm and a tensile strength of 2300 MPa. The embedded length varies between 10, 20 and 30 mm and the inclination with respect to the loading direction is equal to 0 or 30°. The concrete cylinder, with 30 mm diameter and 50 mm height, has a mean cube compressive strength of 59 MPa, measured according to EN 12390-3 [
7]. The composition exists of 350 kg/m
3 CEM I 52.5 R HES, 835 kg/m
3 sand 0/4, 1099 kg/m
3 gravel 4/14, 175 kg/m
3 water and 1 kg/m
3 (0.3%) superplastizer Glenium 51.
Table 1 presents an overview of the eight different groups of tested specimens with their characteristics.
2.2. Test Setup with Micro-CT Scans and Acoustic Emission Monitoring
Monotonic and cyclic pull-out tests of the steel fibres are performed with a universal testing machine (Shimadzu AG-XMST-X/X-Type, 100 kN maximum capacity),
Figure 1a. The specimen’s bottom side is glued on a steel rod that is clamped in the machine’s grip system. The end-hook of the fibre’s protruding end is removed and the straight fibre is securely clamped in the top grip system. The testing machine records the pull-out load and displacement. Different loading patterns are applied, namely (1) monotonic pull-out at 0.6 mm/min; (2) loading cycles before reaching the maximum pull-out force; and (3) loading cycles after the maximum force. Both cyclic patterns are continued by a monotonic pull-out. The tests are performed up to complete fibre pull-out or specimen failure. The loading ratio, frequency and number of cycles are varying parameters among the cyclic tests. The developed experimental procedure makes use of micro-CT scans and AE monitoring for damage progress analysis.
Firstly, a Phoenix Nanotom scanning machine makes micro-CT scans before testing, after applying cyclic loading and after fibre pull-out. The X-ray tube has a voltage of 130 kV and a current of 200 µA, leading to a resolution of 14.9 µm. A diamond-tungsten target is used due to the material’s high density and a 0.1 mm Cu filter avoids streak artefacts due to the large density difference between steel and concrete. The shift-option during scanning avoids ring artefacts and software correction reduces the effects of beam hardening. One scan of 90 min contains 2400 images taken over a rotation of 360°. The 2D projection images are reconstructed into a 3D array of density values with the Phoenix datos|x2rec software. Next, the programs CTan, CTvox and DataViewer (Bruker Corporation) are used to analyze 2D slices or 3D views of the reconstructed specimen. A higher material density (e.g., steel) results in a higher grey-scale and a brighter color on the images, a lower density (e.g., air) results in a lower grey-scale and a darker color.
Secondly, four piezoelectric broadband sensors, with frequency range 50–2000 kHz (DigitalWave B1025), continuously measure AE waves reaching the specimen’s surface. A self-designed 3D-printed cover (
Figure 1b) fixes their position and the connection with the surface is made by vacuum gel. The four sensors form a vertical plane with a height of 27 mm and a width of 30 mm through the specimen’s center. A preamplifier of 34 dB gain makes the connection between a sensor and the Vallen AMSY-5 acquisition system. In this system, a frequency filter of 230–850 kHz and an amplitude threshold of 36.2 dB are applied to avoid low-amplitude background noise. The sampling rate equals 10 MHz. The Vallen VisualAE software is used to process and display the test data in real time.
3. Results and Discussion
The focus of the paper is put on the implementation of the AE technique and micro-CT scans in the developed pull-out setup. Therefore, the individual results of the 40 pull-out tests will not be presented in detail, more information can be found in [
8]. The developed setup with advanced NDT methods allows to improve and to better control the experiments. The following sections discuss the results of micro-CT scanning, acoustic emission measurements and combination of both.
3.1. Micro-CT Scans
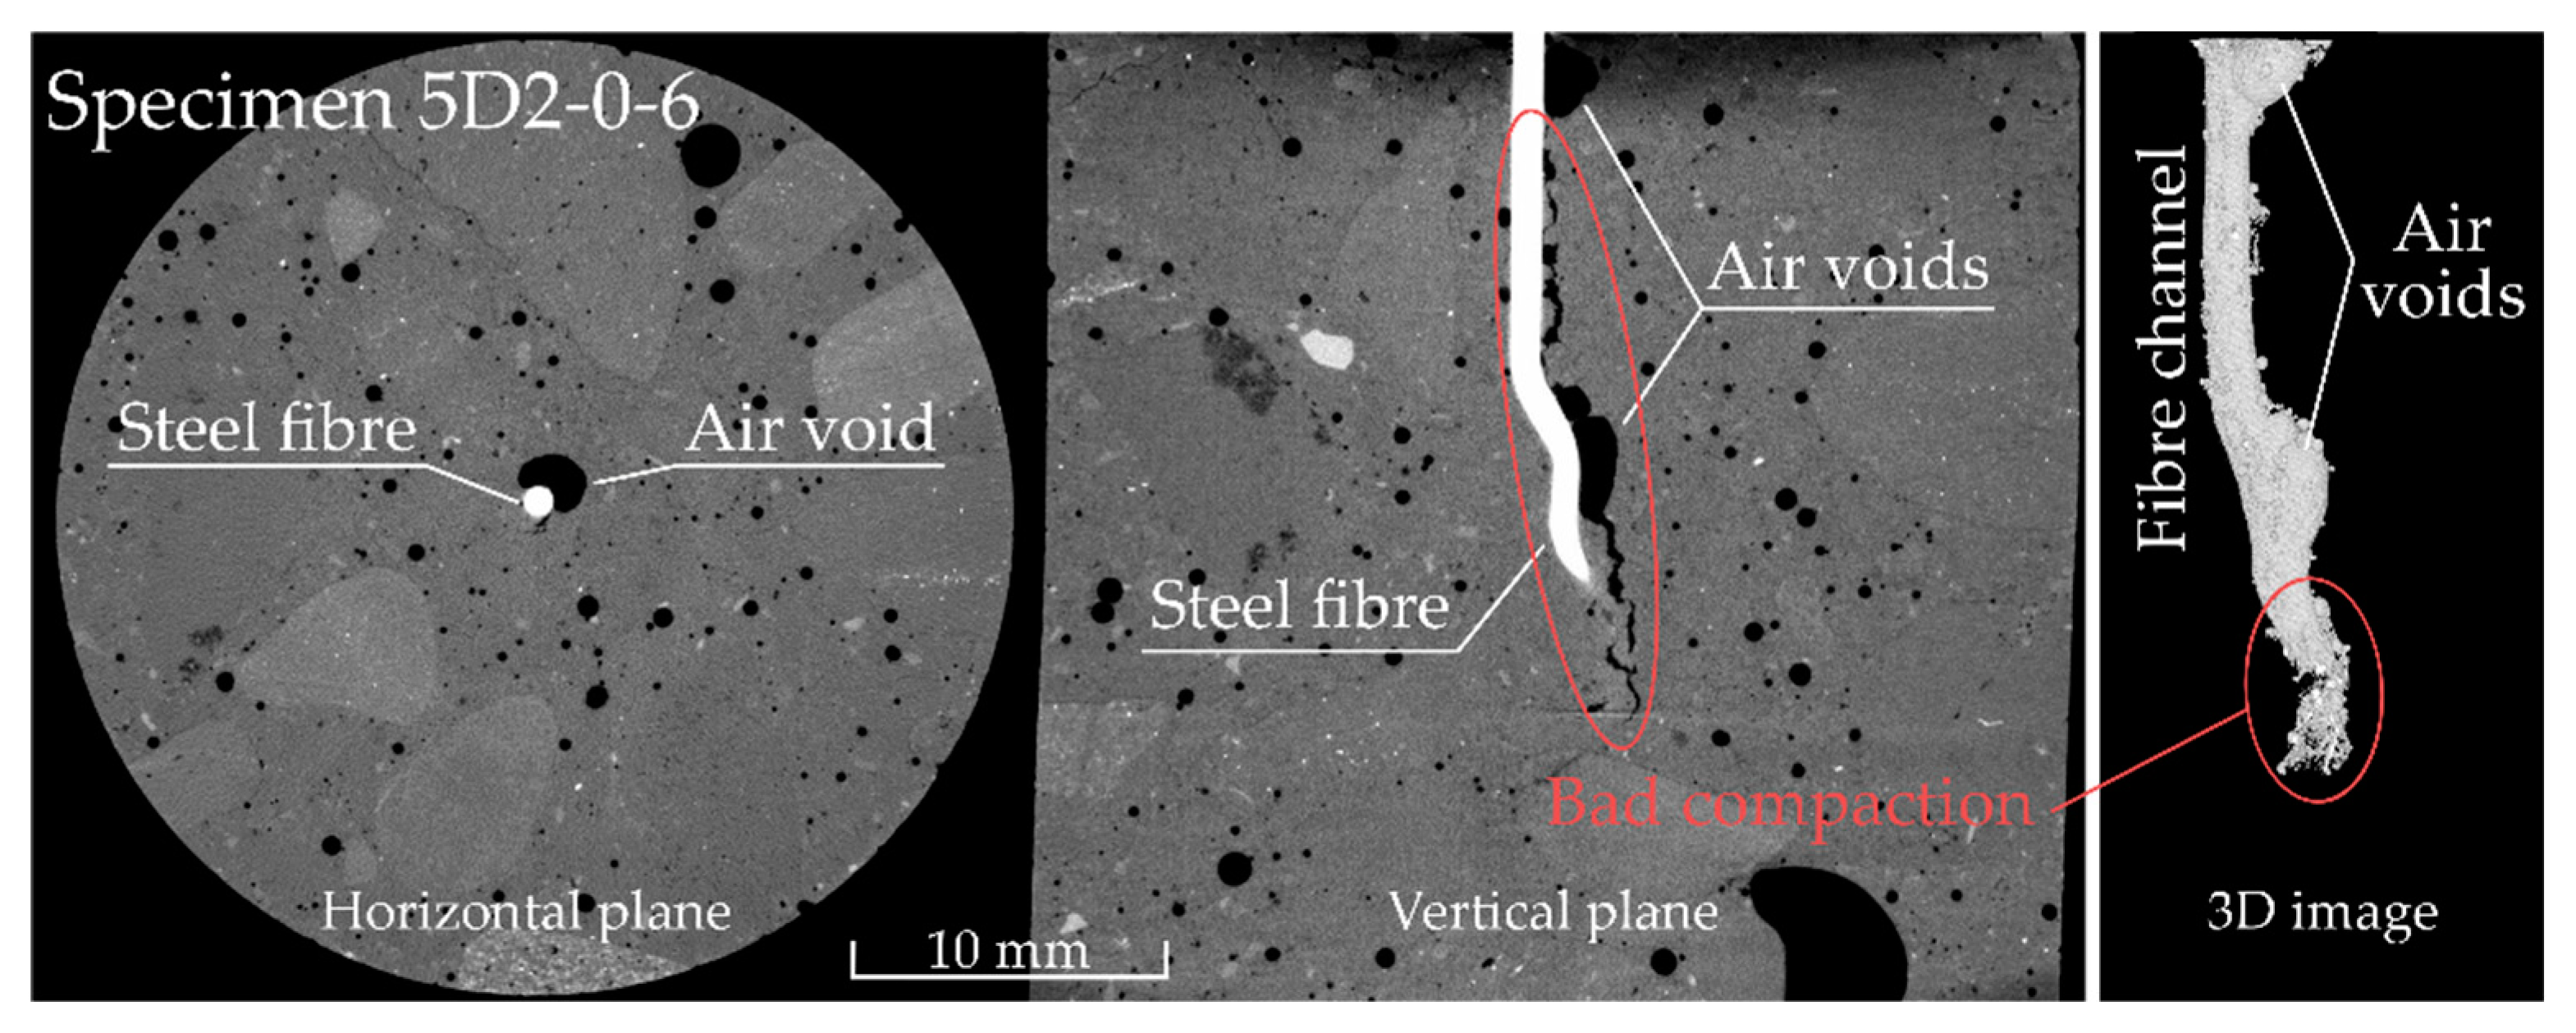
Micro-CT scans visualize the specimen’s microstructure in 3D, leading to valuable information on the specimen and the bond between steel fibre and concrete matrix. After scanning the six specimens of group 5D2-0, specimen 5D2-0-6 appeared to have three defects: (1) a bad compaction along the fibre; (2) an air void at the fibre’s end-hook; and (3) an air void at the fibre’s top, as indicated in
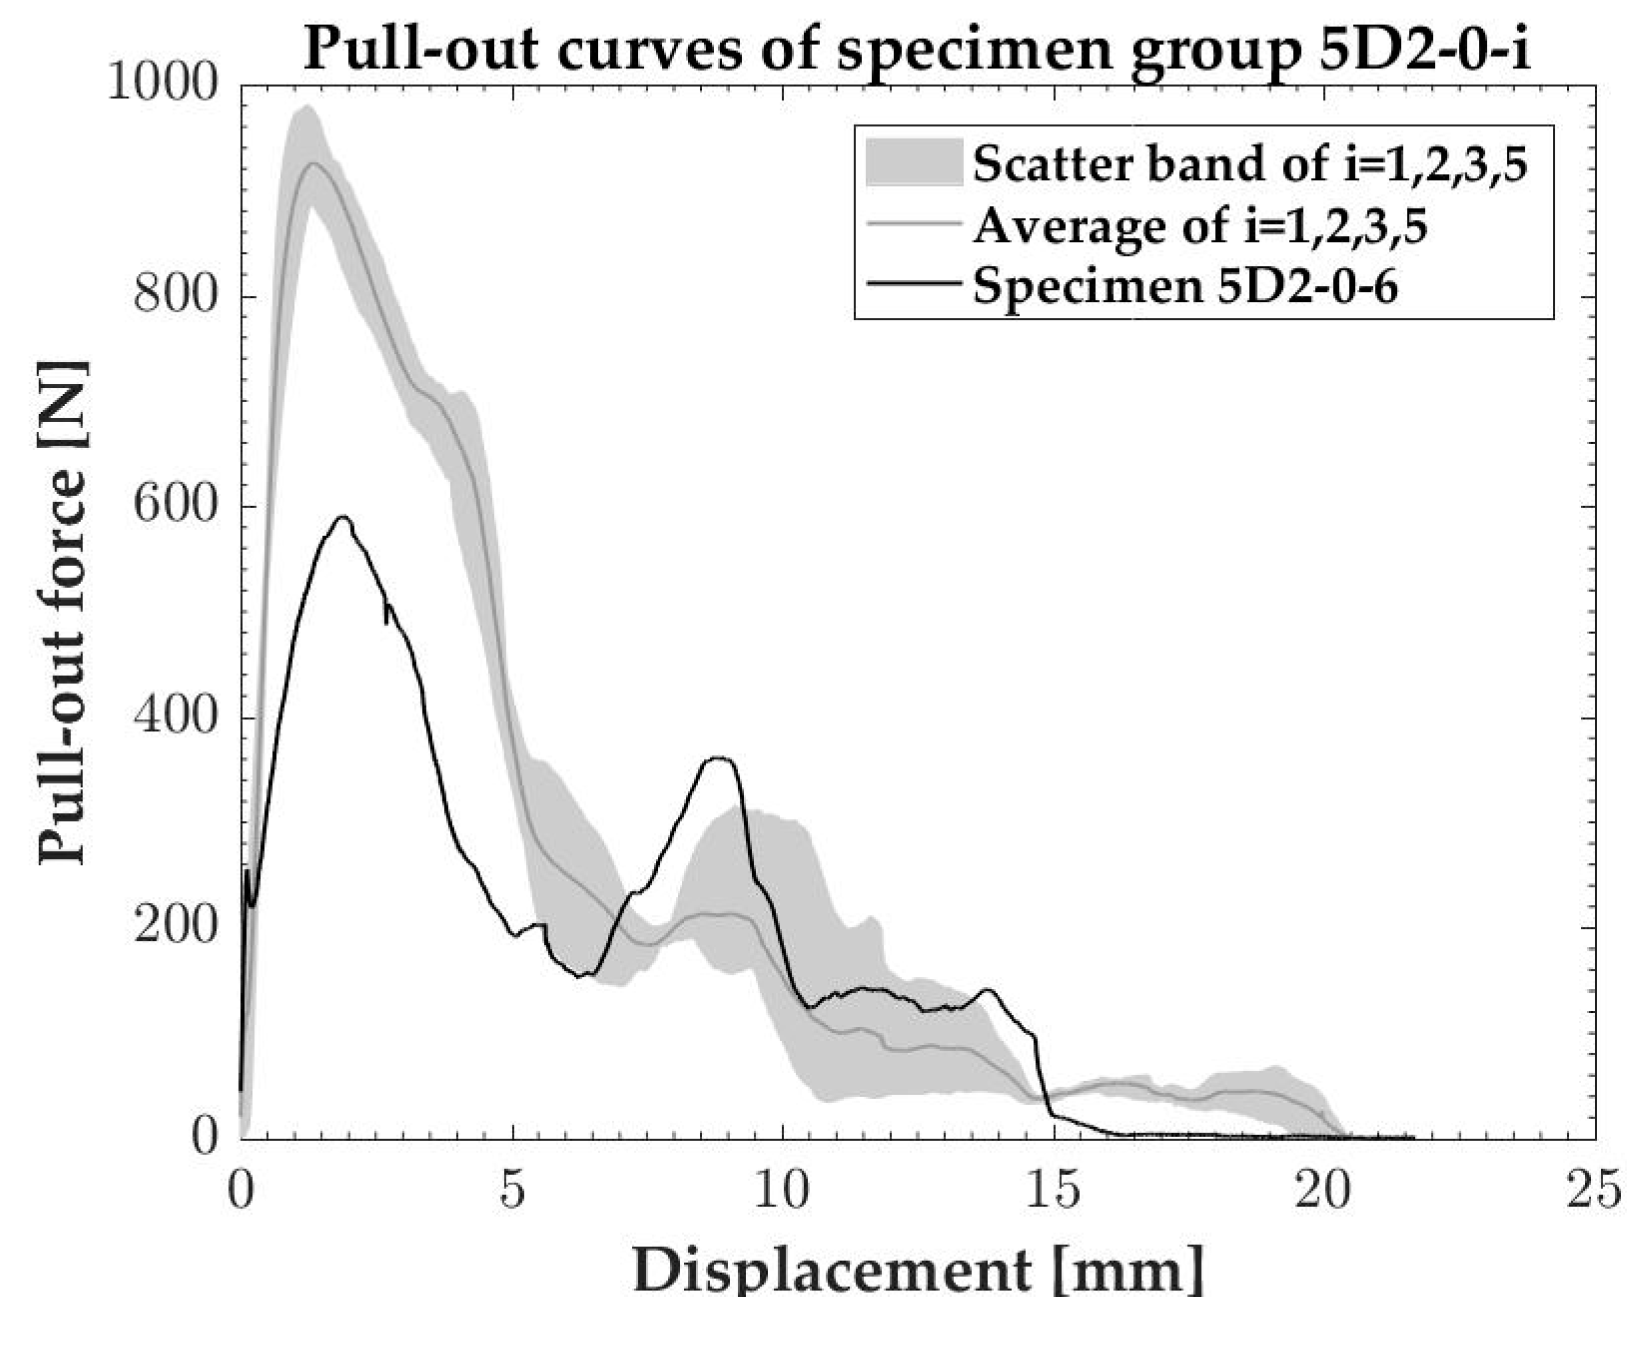
Figure 2. As a result, 5D2-0-6 has a deviating pull-out behavior compared to the group with similar properties, refer to
Figure 3. The partial disconnection between fibre and matrix (defect 1, 2 and 3) leads to a decreased anchorage surface, resulting in a lower maximal pull-out force (590 N compared to the average of 926 N). Due to the absence of confining concrete in defect 2, the end-hook of the fibre is not straightened completely. Continuing the fibre pull-out, the frictional resistance is increased due to the hook’s residual deformations (a second peak value of 362 N compared to the average of 214 N). Lastly, the lost anchorage surface at the fibre’s top in defect 3 leads to the early drop of the pull-out force to 0 N at 16 mm, which is about 4 mm before the average curve.
All 40 specimens are scanned before testing and some of them appear to have one or more defects. These specimens can be selected and omitted from testing or their deviating behavior can be correctly interpreted. As such, micro-CT scanning provides a deeper insight additional to the traditional pull-out setup. A following research step is to quantify the relation between the magnitude of the debonded area due to defects and the decrease of pull-out force.
3.2. Acoustic Emission Measurements
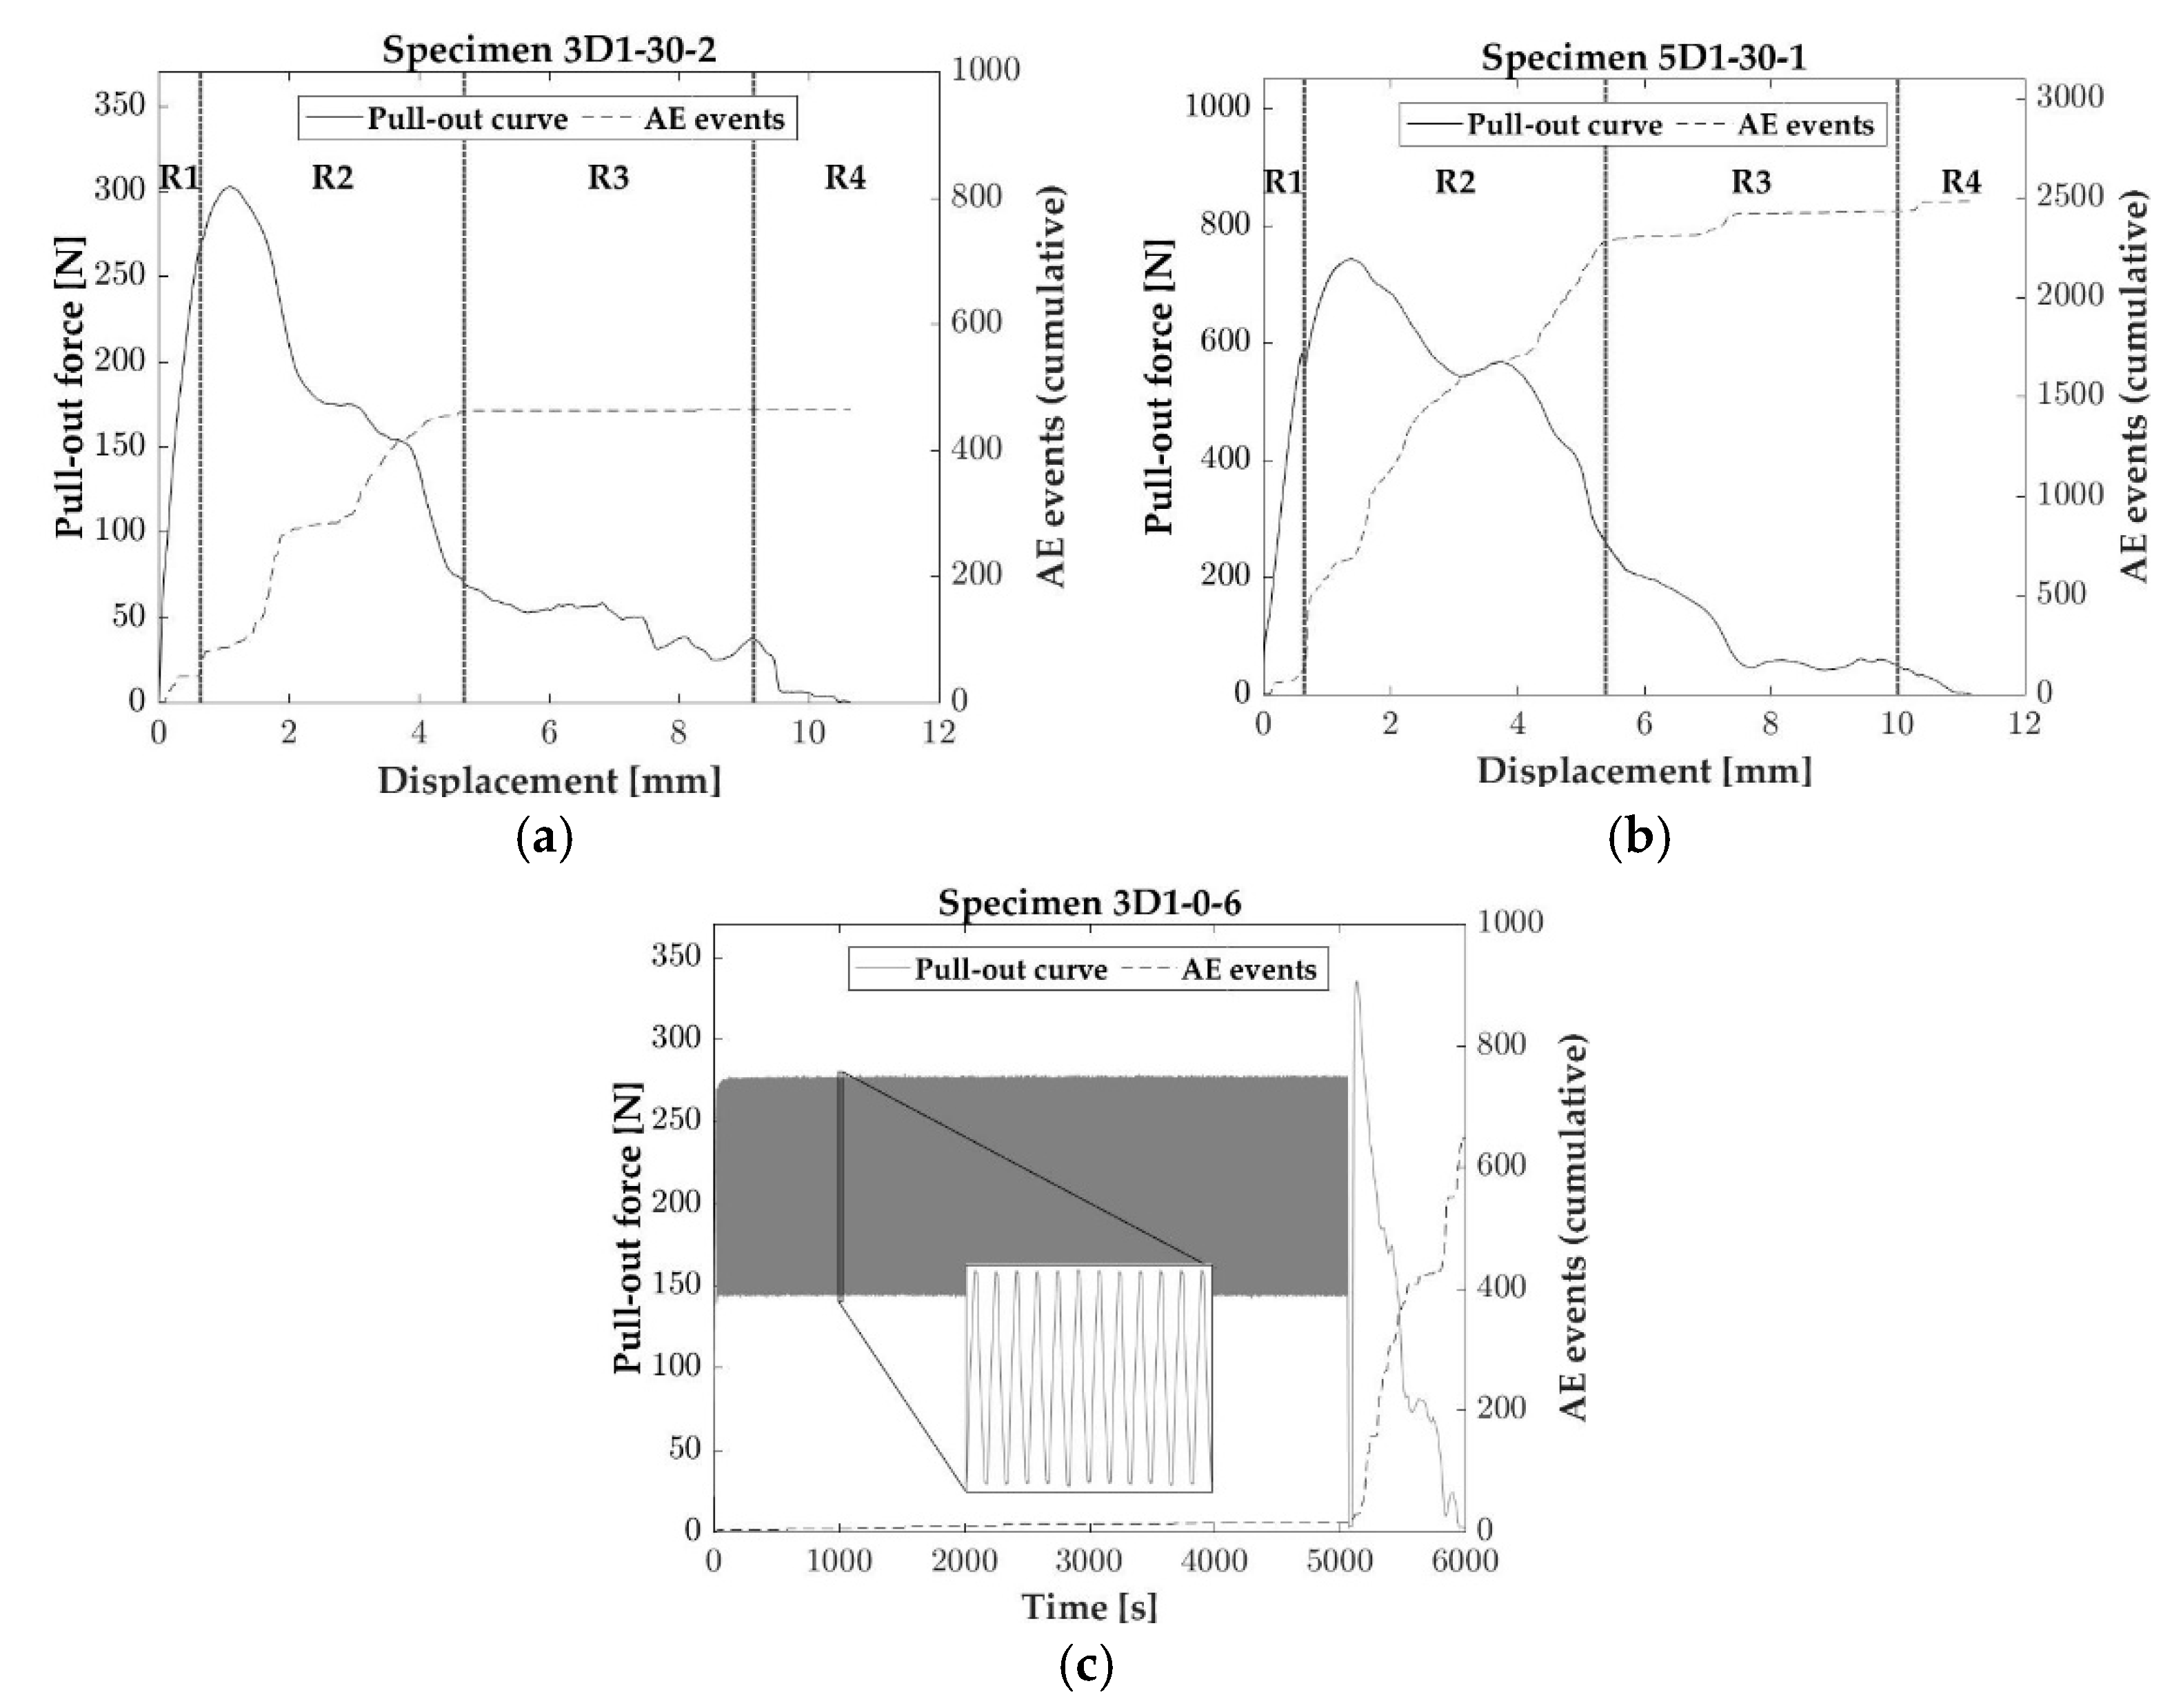
The AE measurements detect and locate damage initiation and propagation within the concrete specimen. During a pull-out test, four regions (R1 to R4) with corresponding energy dissipations mechanisms are distinguished [
9]. The obtained AE response supports the distinction of these regions, as shown in
Figure 4a,b. During R1, elastic behavior and debonding along the interface, no or only a few acoustic events are detected. Thereafter, in R2, the plastic deformation and straightening of the end-hook causes local concrete crushing with an increase of AE events. Subsequently, the frictional sliding movement of the straightened fibre through the matrix channel in R3 induces insignificant AE activity, although residual fibre deformations can still produce a few events. Lastly, in R4, the frictional resistance reduces due to the fibre’s exit, whereby concrete spalling at the specimen’s surface could occur, leading to an additional amount of AE events. Furthermore, the AE activity is higher for a 5D hooked-end fibre compared to a 3D fibre, due to four bends to straighten in R2 instead of two.
Besides monotonic pull-out, also loading cycles are applied in several tests.
Figure 4c presents 2000 cycles between 43% and 83% of the maximal pull-out force at a frequency of 0.4 Hz. During the cyclic loading, almost no detectable damage, e.g., micro-cracking, has yet occurred. A very low amount of AE activity is measured, namely 19 events on the total amount of 650 events. Only at continuing the fibre pull-out process, AE events and the related damage are detected. Therefore, the applied loading pattern does not lead to a distinct fatigue behavior. It is expected that much more cycles or higher load limits are required to obtain significant fatigue damage.
3.3. Combination of Micro-CT Scans and AE Measurements
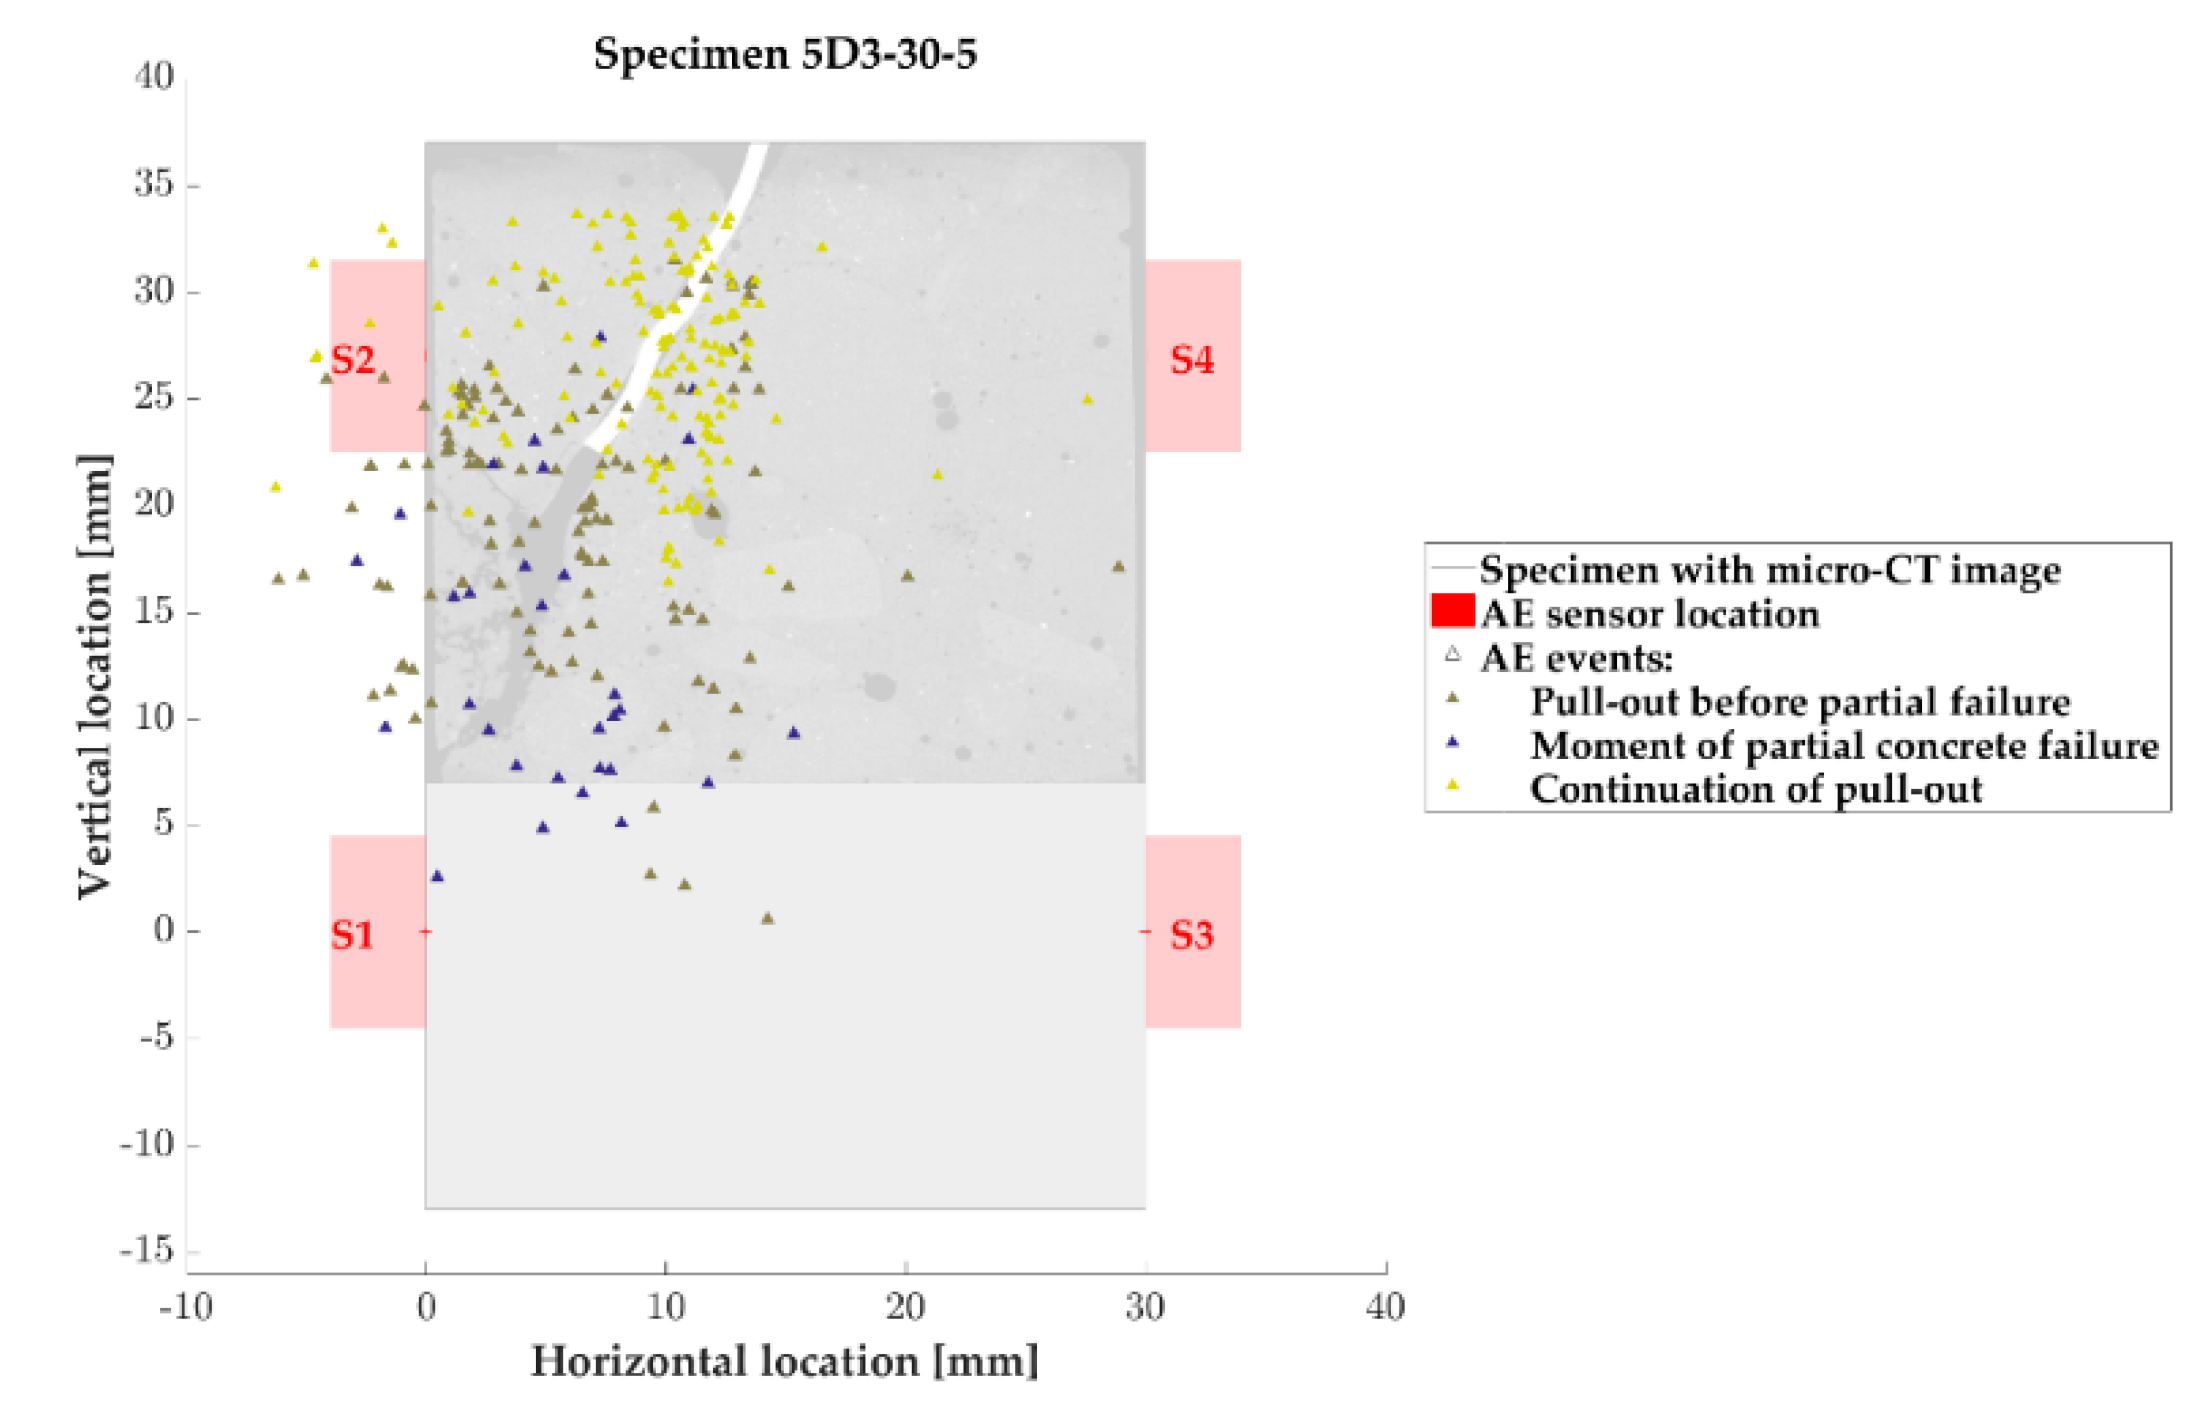
The combination of micro-CT scans and AE measurements leads to the localization of damage together with the visualization of the fibre, aggregates and pores position. During the pull-out test of specimen 5D3-30-5, a part of the concrete was pushed off during straightening of the fibre. The large inclination, the large anchorage length and the stronger 5D fibre cause this concrete failure. After the partial failure and corresponding decrease of pull-out force from 1020 N to 503 N, the pull-out process continued until half of the embedded length is pulled-out.
Figure 5 presents a micro-CT scan at the end of the test, together with the localization of AE events, indicated by colored triangles. These triangles are grouped according to the phases: pull-out before partial failure, moment of partial concrete failure, and continuation of pull-out. AE sources located outside the specimen are due to reflections around the sensors and the fracture plane. The AE localized events support the failure mode and correspond to the occurring damage pattern. The first pull-out phase and the partial failure are located at the fibre’s end-hook; the AE sources after partial failure follow the pull-out process.
4. Conclusions
This paper investigated the use of two advanced non-destructive testing methods additional to the traditional pull-out test setup of steel fibres in a concrete matrix, namely microfocus computed tomography and acoustic emission monitoring. By performing monotonic and cyclic pull-out tests on 40 specimens, the combination of NDT methods leads to a deeper understanding of the fibre pull-out behavior and the obtained experimental results. Micro-CT scans and AE measurement are able to inspect deviating results, to detect pull-out stages, and to localize and visualize internal damage in the microstructure.
Author Contributions
M.D.S., K.D.W., E.V. and L.V. conceived and designed the experiments. M.D.S. performed the experiments, analyzed the data and wrote the manuscript, under the guidance of K.D.W., E.V. and L.V.
Acknowledgments
The authors gratefully acknowledge the financial support of Research Foundation Flanders (FWO, grant no. 1S32717N), and the supply of steel fibres of Bekaert nv.
Conflicts of Interest
The authors declare no conflict of interest. The funding sponsors had no role in the design of the study; in the collection, analyses, or interpretation of data; in the writing of the manuscript, and in the decision to publish the results.
References
- Landis, E.; Keane, D. X-ray microtomography. Mater. Charact. 2010, 61, 1305–1316. [Google Scholar] [CrossRef]
- Wevers, M. X-ray computed tomography for non-destructive testing. In Proceedings of the International Conference on Industrial Computed Tomography (iCT 2012), Wels, Austria, 19–21 September 2012. [Google Scholar]
- Verstrynge, E.; Van Steen, C.; Andries, J.; Van Balen, K.; Vandewalle, L.; Wevers, M. Experimental study of failure mechanisms in brittle construction materials by means of x-ray microfocus computed tomography. In Proceedings of the 9th International Conference on Fracture Mechanics of Concrete and Concrete Structures (FraMCoS 9), Berkeley, CA, USA, 22–25 May 2016. [Google Scholar]
- Grosse, C.; Ohtsu, M. Acoustic Emission Testing; Springer: Berlin/Heidelberg, Germany, 2008. [Google Scholar]
- Wevers, M. Listening to the sound of materials: Acoustic emission for the analysis of material behaviour. NDT E Int. 1997, 30, 99–106. [Google Scholar] [CrossRef]
- Noorsuhada, M. An overview on fatigue damage assessment of reinforced concrete structures with aid of acoustic emission technique. Constr. Build. Mater. 2016, 112, 424–439. [Google Scholar] [CrossRef]
- European Committee for Standardization CEN. NBN EN 12390-3: Testing Hardened Concrete—Part 3: Compressive Strength of Test Specimens; CEN: Brussels, Belgium, 2009. [Google Scholar]
- De Smedt, M.; De Wilder, K.; Verstrynge, E.; Vandewalle, L. Monotonic and cyclic pull-out behaviour of 3D and 5D hooked-end steel fibres from a concrete matrix. In Proceedings of the 12th FIB International PhD Symposium in Civil Engineering, Prague, Czech Republic, 29–31 August 2018. [Google Scholar]
- Pompo, A.; Stupak, P.R.; Nicolais, L.; Marchese, B. Analysis of steel fibre pull-out from a cement matrix using video photography. Cem. Concr. Compos. 1996, 18, 3–8. [Google Scholar] [CrossRef]
| Publisher’s Note: MDPI stays neutral with regard to jurisdictional claims in published maps and institutional affiliations. |
© 2018 by the authors. Licensee MDPI, Basel, Switzerland. This article is an open access article distributed under the terms and conditions of the Creative Commons Attribution (CC BY) license (https://creativecommons.org/licenses/by/4.0/).


