Performance Analysis of Detector Algorithms Using Drone-Based Radar Systems for Oil Spill Detection †

1
Doctoral School of Sciences and Technologies, Lebanese University (LU), 1003 Beirut, Lebanon
2
Grenoble Electrical Engineering Laboratory, Grenoble Alpes University (UGA), 38031 Grenoble, France
3
National Council of Scientific Research (CNRS-L), Remote Sensing Research Center, 22411 Mansouriyeh, Lebanon
*
Author to whom correspondence should be addressed.
†
Presented at the 2nd International Electronic Conference on Remote Sensing, 22 March–5 April 2018; Available online: https://sciforum.net/conference/ecrs-2.
Proceedings 2018, 2(7), 370; https://doi.org/10.3390/ecrs-2-05184
Published: 23 March 2018
(This article belongs to the Proceedings of The 2nd International Electronic Conference on Remote Sensing)
Abstract
:In this paper, we develop algorithms for oil spill detection using radar remote sensing. The algorithms take into account both the mathematical and the physical modeling of the sea surface covered by oil slicks. We use the statistical characterization of the power reflectivity and its distribution under various oil thicknesses and electromagnetic wave frequencies. We first introduce a single frequency (SF) oil spill detector that uses single or multiple observations (SO or MO) of power reflection coefficients over several scanning iterations for the sea area. Then, using Monte Carlo simulations we address the correctness of this detector by choosing different frequencies. Results show the inability of this detector to effectively distinguish between oil slicks and oil-free slicks for the total range of possible thicknesses. Nevertheless, increasing the number of observations leads to an increase in the effectiveness of the detector. An upgrade of this detector is the dual-frequency (DF) detector using single and multiple observations where two electromagnetic frequencies are used at the same time. Performance analysis of this detector proves its ability to overcome the drawbacks of the first detector by providing accurate detection especially for multiple observations.
1. Introduction
Large tankers’ collisions with rocky shoals, platform accidents, pipelines ruptures and operative discharges are main contributors to oil pollution in the world’s oceans [1]. Consequently, the release of the petroleum pollutants into coastal waters harms severely the environmental ecosystem. Therefore, having oil pollution monitoring system is something crucial for the preservation of the coastal ecosystem. Remote sensing techniques using satellites provide synoptic scale data, and they can act as preliminary spill detection tool, the limitations present from overpass frequency, timing and low spatial resolution notwithstanding [2]. Airborne systems can be used as much as required, providing higher spatial resolution and allowing real time dataset processing [3]. Taking into account that only of the pollution cases are detected by satellites systems, the European Maritime Safety Agency (EMSA) launched in 2016 the need to use a complementary system, using drones, to the present satellite maritime surveillance system [4]. We are working on a project that targets eventually to incorporate MIMO radar on drone for oil spill detection. The project will provide a quick assessment tool for oil spill accidents similar to what happened in the summer of 2006 in Lebanon, where 15,000 tons of heavy fuel oil spilled in the Mediterranean Sea. In addition, the drones with MIMO radar will be prominent by its providence to high spectral resolution, its allowance to parallel scanning, and its relative low cost compared to the cost of aircrafts that are usually dedicated for such missions.
2. Methods
2.1. Reflectivity Theoretical Calculation
From a physical point of view, the problem is considered to be a multi-layers wave surface scattering model where we study the reflection of the EM waves from the sea layer covered by oil layer. The electrical properties and the physical characteristics are defined for the layers at the boundaries where interaction with EM waves occurs. In our model, we assume that there is an oil slick, with d thickness (in mm), on the top of the sea water surface. All interfaces are considered to be planar. The relative dielectric constants of the air, oil, sea water are respectively , and . The different medium are assumed to be non-magnetic. The refractive indices n for the different materials are . The electromagnetic signal is assumed to be normally incident on the oil surface interface. We assume that the sea water is deep enough so that we can neglect any the reflection from this medium. The field reflection coefficients for the first interface (between air and oil) and the second interface (between oil and water) are respectively
Across the boundaries, E is conserved. Using continuity property at these interfaces, the reflectivity (power reflection coefficient) for the three-layers structure is derived using the Transfer Matrix Approach [5] as
is the phase shift that is dependent on the oil-refractive index , the frequency of the electromagnetic wave (reflected in its wavelength defined as where c is the speed of light) and the thickness of the oil layer d. It is given by
The reflectivity R is a trigonometric function with period that is dependent on the oil-refractive index and the frequency of the electromagnetic wave. The period is expressed as
2.2. Detection Algorithms
The detector algorithms use the statistical characterization of the reflectivity values and its distribution under different oil thicknesses in order to obtain a final decision whether oil exists or not. Let “” be the event representing the calculation of the observation “m” of the reflectivity R in Equation (3) at the frequency . These reflectivity values are assumed to be independent events. Let “, ” be respectively the events of thick oil existence (no matter what its thickness is) and oil absence on the top surface of the sea water. Any previous knowledge about the existence or absence of oil in the surface scanned should be taken into consideration to weight the probability of the decision in the detector block. Nevertheless, without any previous knowledge about the spill situation, i.e., with , the detector decision will be totally based on the statistics of the calculated power reflection ratio. This assumption will be taken in the derivation of the detector algorithms.
2.2.1. Single Frequency Detector
Single frequency (SF) detector uses reflectivity values at single frequency obtained from scanning the area of interest. With “·” being the numerical multiplication. Then, the probability of oil presence and absence given a reflectivity value are respectively
(SF) detector algorithm using single observation (SO) is then given by
Using multiples observations (MO), the algorithm turns to be
2.2.2. Dual Frequency Detector
Without repeating the previous derivation or going with detailed mathematical steps, the same procedure is followed to derive the algorithms that use two frequencies instead of one. The final formula for the dual frequencies (DF) single observation algorithm is
For multiple observations, the algorithm evaluation will be based on
In all mentioned algorithms, if the detector evaluation turned to be greater than one, the decision will indicate the oil existence.
3. Results
3.1. Simulation Setup
Calculations are performed using Monte Carlo Simulations in Matlab. We build the model composed of three consecutive layers (air-oil-water). The dielectric constant of the air is . The dielectric constant of the thick oil is assumed to be real (the imaginary part of order can be neglected without affecting the results). Sea water dielectric constant, , is function of the water temperature , water salinity and the frequency of the electromagnetic signal used. For its calculation, we use the model mentioned in [6] with = 20 °C and ppt. The oil is assumed to be thick and its thickness value is varied between 0 and 10 millimeters. The electromagnetic waves are normally incident into the multilayer structure. We choose two frequencies for the electromagnetic waves used in detectors: 4 GHz and 12 GHz. The noise variance in the system is considered to be white gaussian in linear scale, with variance of .
3.2. Results Analysis
Figure 1 shows a comparison between the probability of detection obtained using at 4 GHz, at 12 GHz, and at both frequencies, assuming same noise variance in all the scenarios. According to Equations (3) and (5), the reflectivity is a trigonometric function and its period is and mm at 4 GHz and 12 GHz respectively. At multiple values of these periods, the reflectivity values repeat its initial value ( dB) for mm (when no oil exists), which means that these thicknesses are considered to be ambiguities points where the reflectivity values of oil presence are exactly the same as the reflectivity values of oil absence. Between 1 mm and 10 mm, the reflectivity values at 4 GHz decrease monotonically from dB to dB. Hence, the difference between these values and the initial value increases with the thickness. This behavior is totally reflected in the detection plot shown in Figure 1. As we go higher in thickness, the probability of detection at 4 GHz increases from to . The increase rate of this detection probability is different on the thickness range, and this is due to the nonlinear behavior of the reflectivity function with respect to the thickness. At 12 GHz, the reflectivity period is mm, therefore we notice the fail of the detection at this value recording a probability of . For the other thickness values, the detection at 12 GHz increases and decreases alternatively and records a maximum value of at mm. The probability of detection is improved strongly when using the dual-frequency detector. This detector takes the relative advantages of each single frequency detector in the corresponding range of thickness. For thickness range higher than 2 mm, the probability of detection records a minimum of at 2 mm and mm, and a maximum of at 10 mm. Results from this figure show that the dual-frequency detector performs better than the single frequency detector.
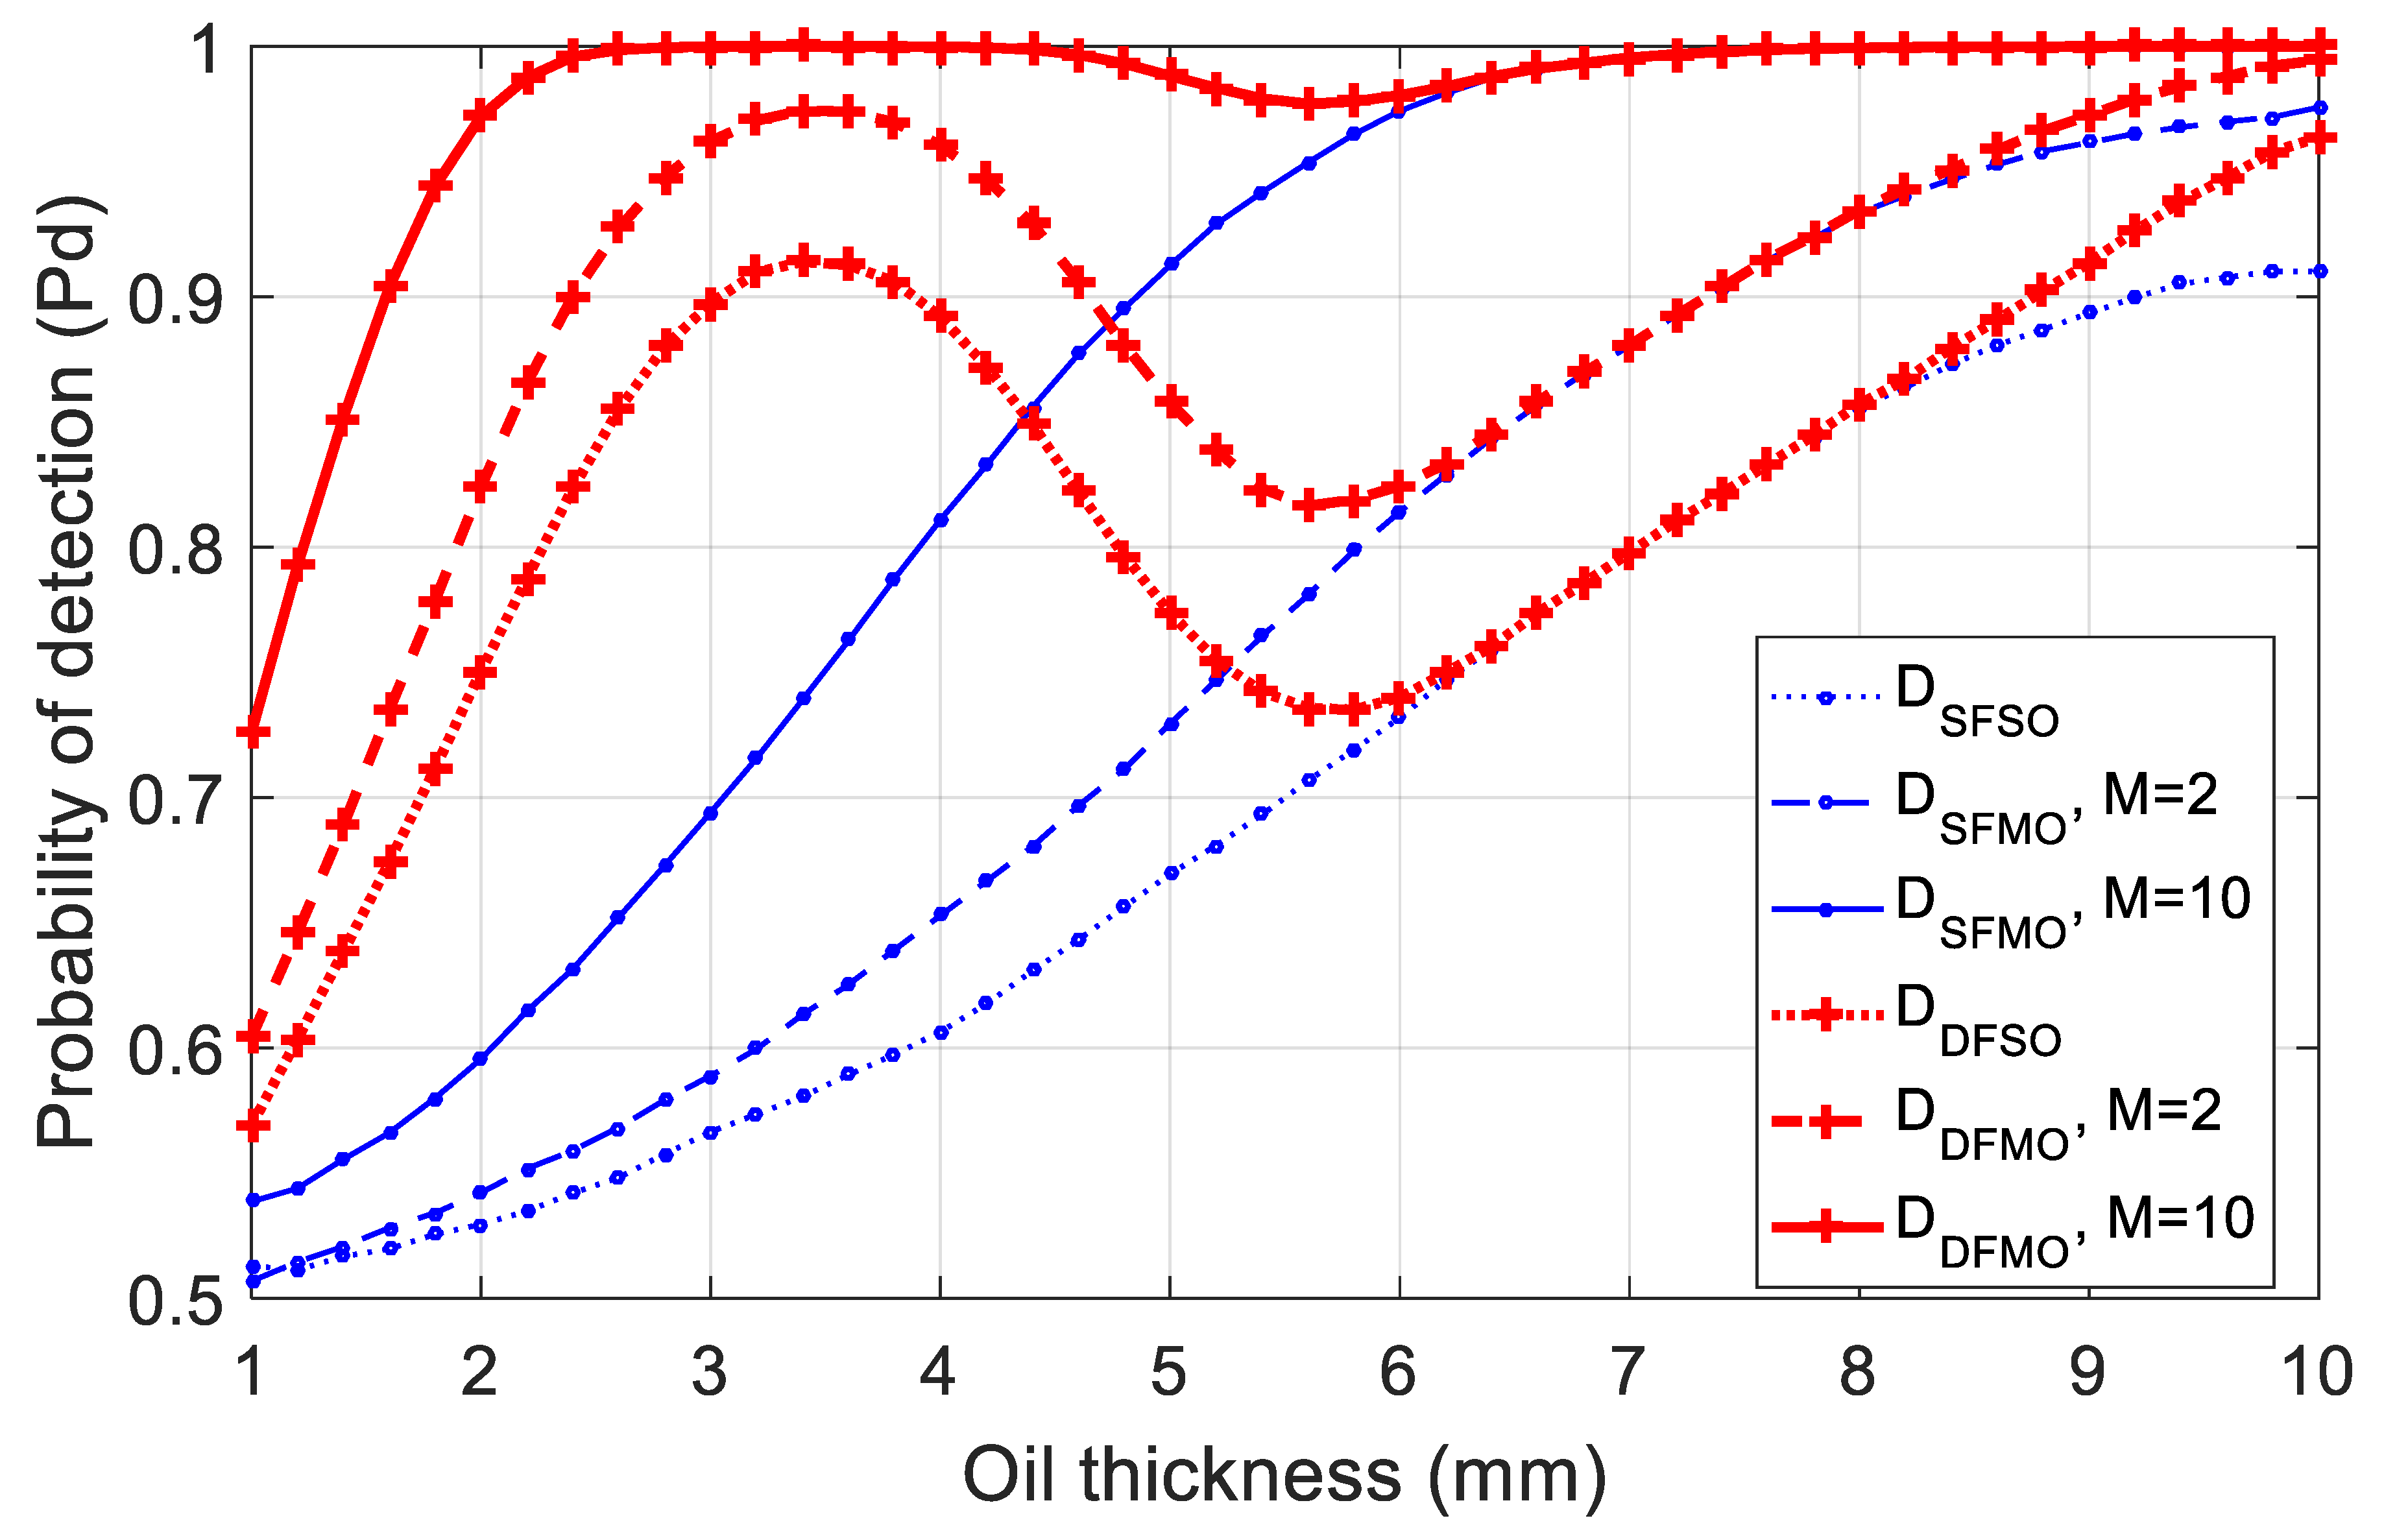
Figure 2 shows the performance of the two detectors, the single frequency (4 GHz) and the dual-frequency (4 GHz and 12 GHz) for different number of observations ( and 10). Increasing the number of observations from 1 to 2 increases the probability of detection for both detectors. This increase allows to exceed of correct detections for thickness higher than 6 mm. Using 10 observations, we can achieve of correct decisions using only 4 GHz for thickness range beyond mm. We get full detection using dual-frequency detector for thickness value higher than 2 mm. Results from this figure show that the multiple observations detector performs better than the single observation detector because it decreases the effect of noise on the detection by providing more information about the same situation.
4. Conclusions
In this paper, we first propose a single frequency oil spill detector using single observation (SFSO) of power reflection coefficients to detect the oil presence. Results show that the performance of this type of detectors is tied to oil thickness values, where it works for some range but fails for another. An upgrade of this detector is the dual-frequency single observation (DFSO) detector where two electromagnetic wave frequencies are used. Performance analysis of the second detector proves its ability to overcome the drawbacks of the first detector by providing accurate detection. An improvement of both detectors is to use multiple observations. Tests performed on both detectors (SFMO) and (DFMO) show that increasing the number of observations leads to an increase in the correctness of the detector.
Acknowledgments
This work is supported by the National Council of Scientific Research at Lebanon (CNRS-L) and the Lebanese University (LU).
References
- Alpers, W. Remote sensing of oil spills. In Maritime Disaster Management Symposium; King Fahd University of Petroleum and Minerals, Dhahran, Saudi Arabia, 2002; pp. 19–23.
- Leifer, I.; Lehr, W.J.; Simecek-Beatty, D.; Bradley, E.; Clark, R.; Dennison, P.; Hu, Y.; Matheson, S.; Jones, C.E.; Holt, B.; et al. State of the art satellite and airborne marine oil spill remote sensing: Application to the BP Deepwater Horizon oil spill. Remote Sens. Environ. 2012, 124, 185–209. [Google Scholar] [CrossRef]
- Jha, M.N.; Levy, J.; Gao, Y. Advances in remote sensing for oil spill disaster management: State-of-the-art sensors technology for oil spill surveillance. Sensors 2008, 8, 236–255. [Google Scholar] [CrossRef] [PubMed]
- Lecomte, E. En fevrier 2017, des drones vont traquer la pollution maritime. Sciences et Avenir, 17 January 2017. [Google Scholar]
- Yadav, M.; Sharma, D.; Sharma, O. Propagation of Electromagnetic Waves in Multilayer Structure. IJRREST Int. J. Res. Rev. Eng. Sci. Technol. 2013, 2, 81. [Google Scholar]
- Ulaby, F.T.; Long, D.G.; Blackwell, W.J.; Elachi, C.; Fung, A.K.; Ruf, C.; Sarabandi, K.; Zebker, H.A.; Van Zyl, J. Microwave Radar and Radiometric Remote Sensing, 4th ed.; University of Michigan Press: Ann Arbor, MI, USA, 2014; Number 5. [Google Scholar]
Figure 1.
Comparison between the probability of detection obtained using at 4 GHz, 12 GHz and at both frequencies. All detectors are used under the same noise variance scenario.
Figure 1.
Comparison between the probability of detection obtained using at 4 GHz, 12 GHz and at both frequencies. All detectors are used under the same noise variance scenario.
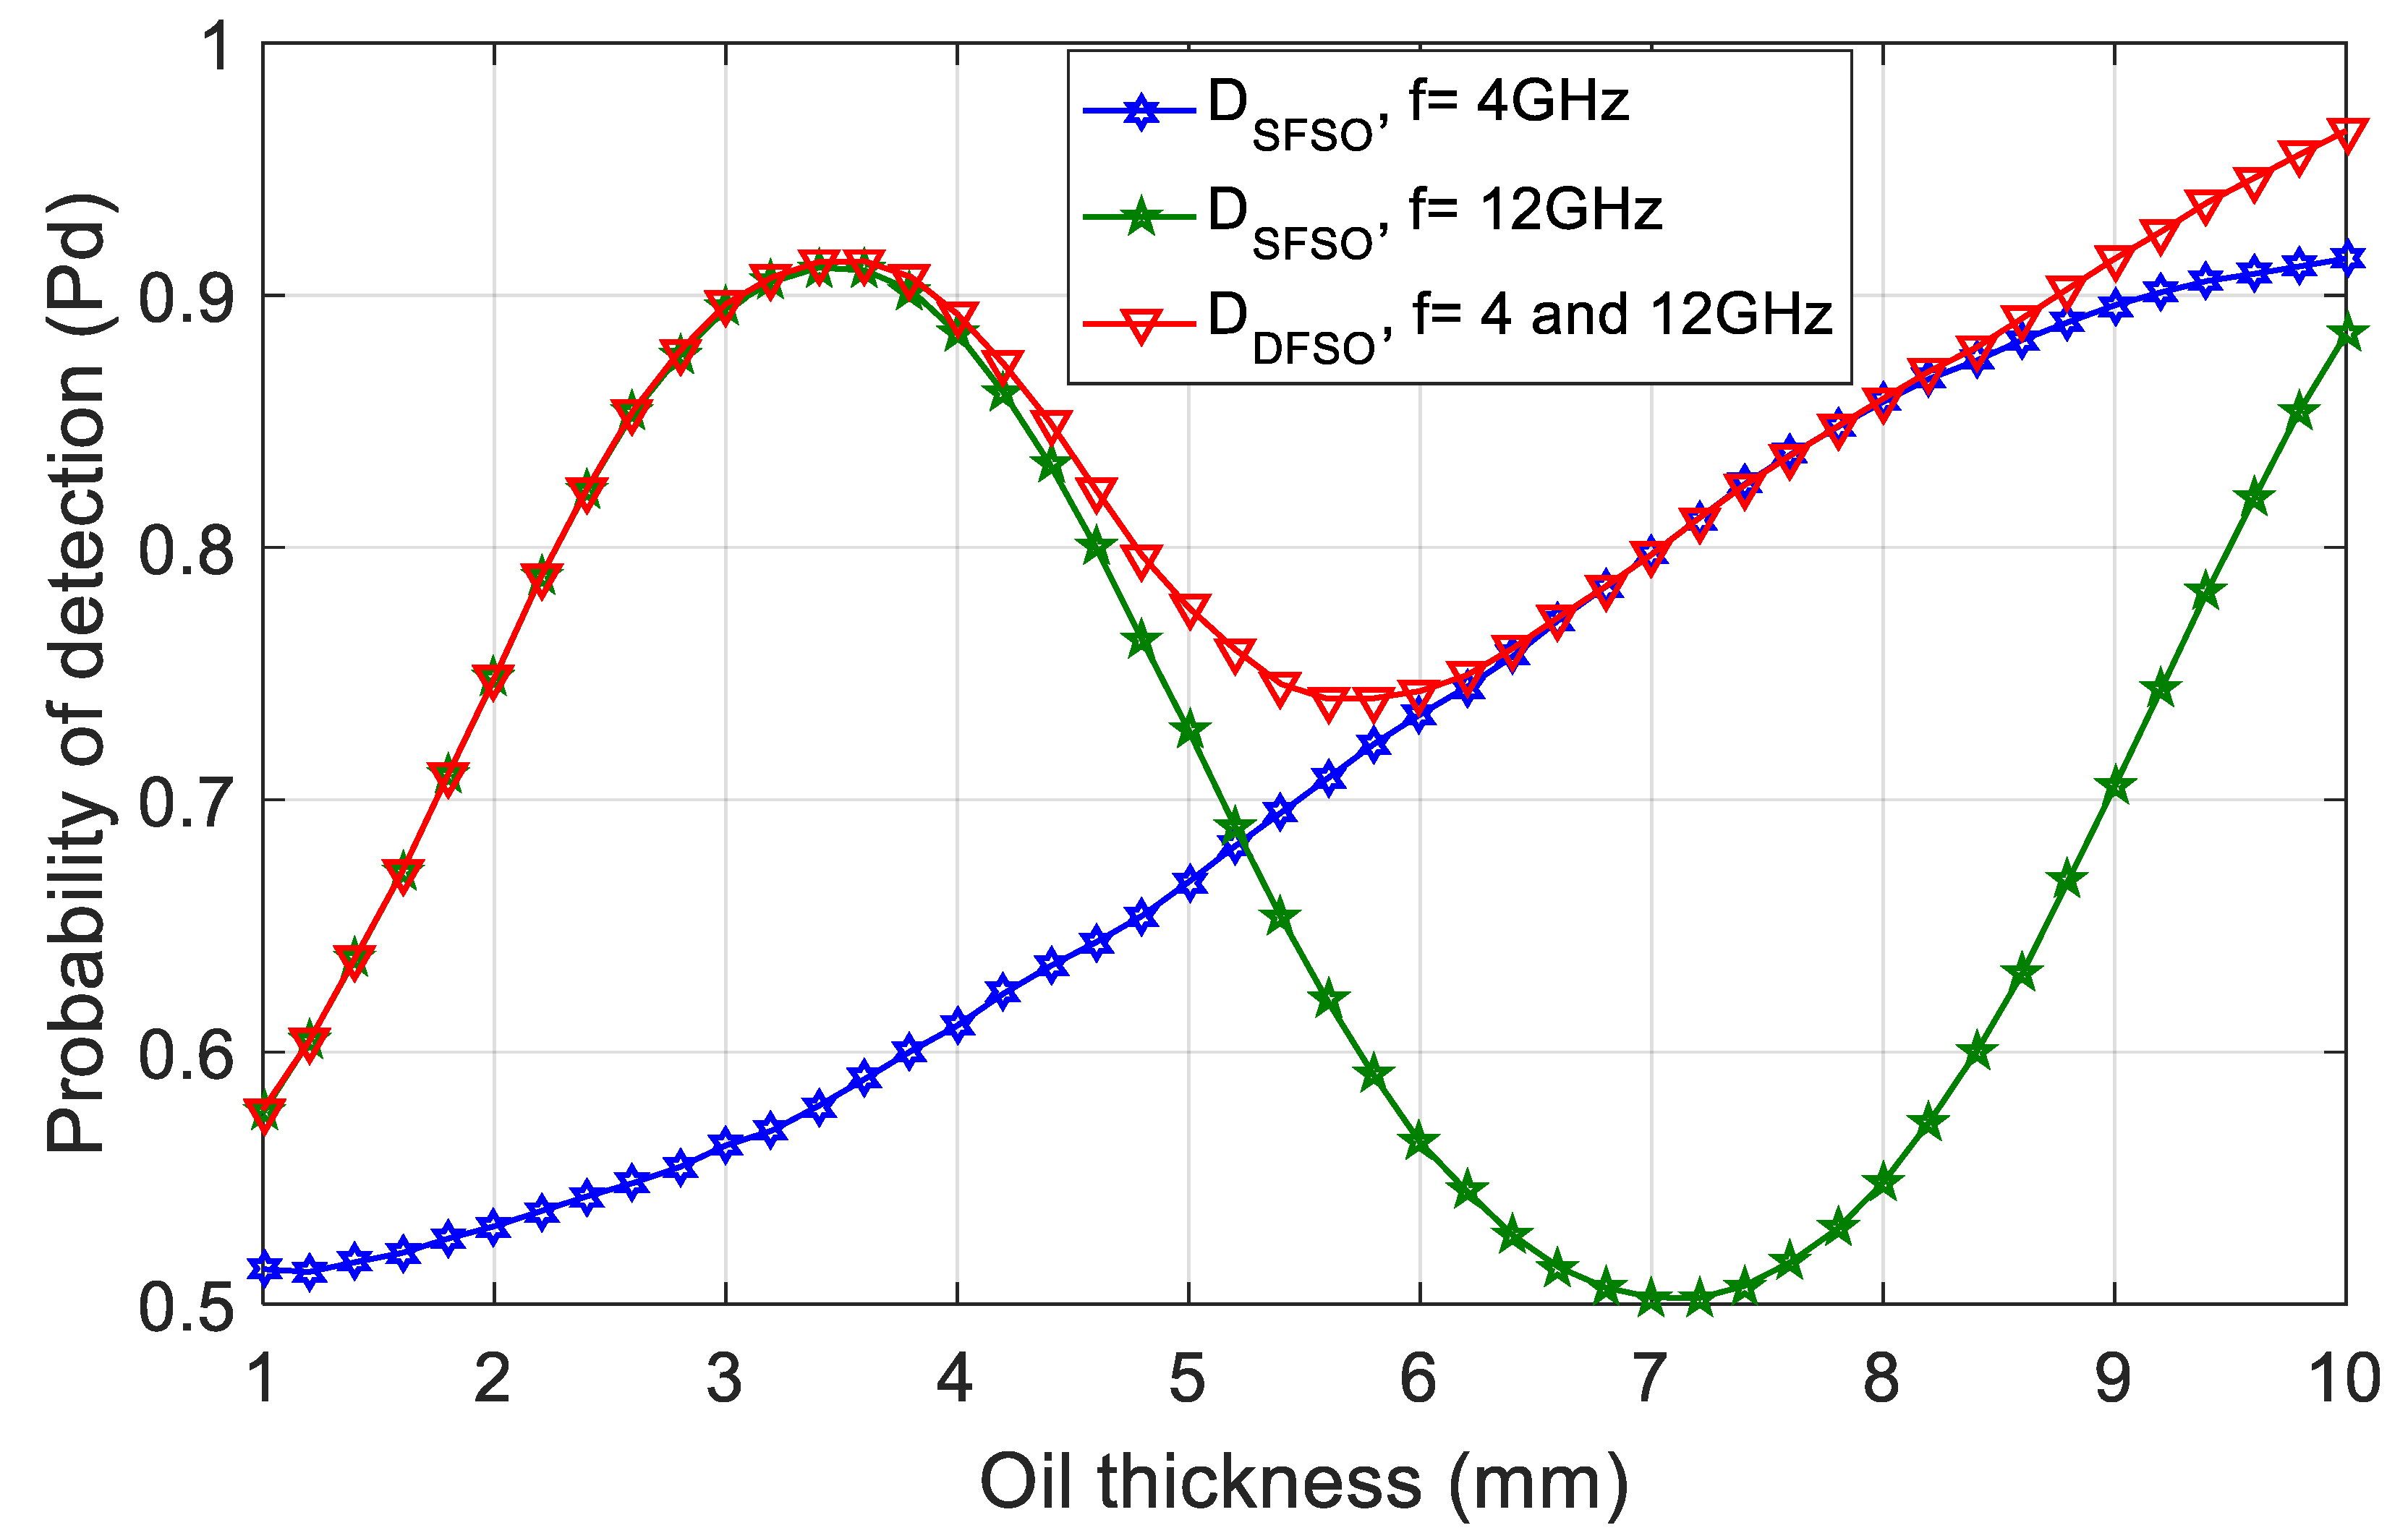
Figure 2.
Comparison between the probability of detection obtained using at 4 GHz and at the same frequency with and . This behavior is also compared to the behavior of and using frequencies 4 GHz and 12 GHz at the same time. All detectors are used under the same noise variance scenario.
Figure 2.
Comparison between the probability of detection obtained using at 4 GHz and at the same frequency with and . This behavior is also compared to the behavior of and using frequencies 4 GHz and 12 GHz at the same time. All detectors are used under the same noise variance scenario.
Publisher’s Note: MDPI stays neutral with regard to jurisdictional claims in published maps and institutional affiliations. |
© 2018 by the authors. Licensee MDPI, Basel, Switzerland. This article is an open access article distributed under the terms and conditions of the Creative Commons Attribution (CC BY) license (https://creativecommons.org/licenses/by/4.0/).
Share and Cite
MDPI and ACS Style
Hammoud, B.; Faour, G.; Ayad, H.; Ndagijimana, F.; Jomaah, J. Performance Analysis of Detector Algorithms Using Drone-Based Radar Systems for Oil Spill Detection. Proceedings 2018, 2, 370. https://doi.org/10.3390/ecrs-2-05184
AMA Style
Hammoud B, Faour G, Ayad H, Ndagijimana F, Jomaah J. Performance Analysis of Detector Algorithms Using Drone-Based Radar Systems for Oil Spill Detection. Proceedings. 2018; 2(7):370. https://doi.org/10.3390/ecrs-2-05184
Chicago/Turabian StyleHammoud, Bilal, Ghaleb Faour, Hussam Ayad, Fabien Ndagijimana, and Jalal Jomaah. 2018. "Performance Analysis of Detector Algorithms Using Drone-Based Radar Systems for Oil Spill Detection" Proceedings 2, no. 7: 370. https://doi.org/10.3390/ecrs-2-05184