Detection of Urban Buildings by Using Multispectral Gokturk-2 and Sentinel 1A Synthetic Aperture Radar Images †


Abstract
:1. Introduction
2. Experiments
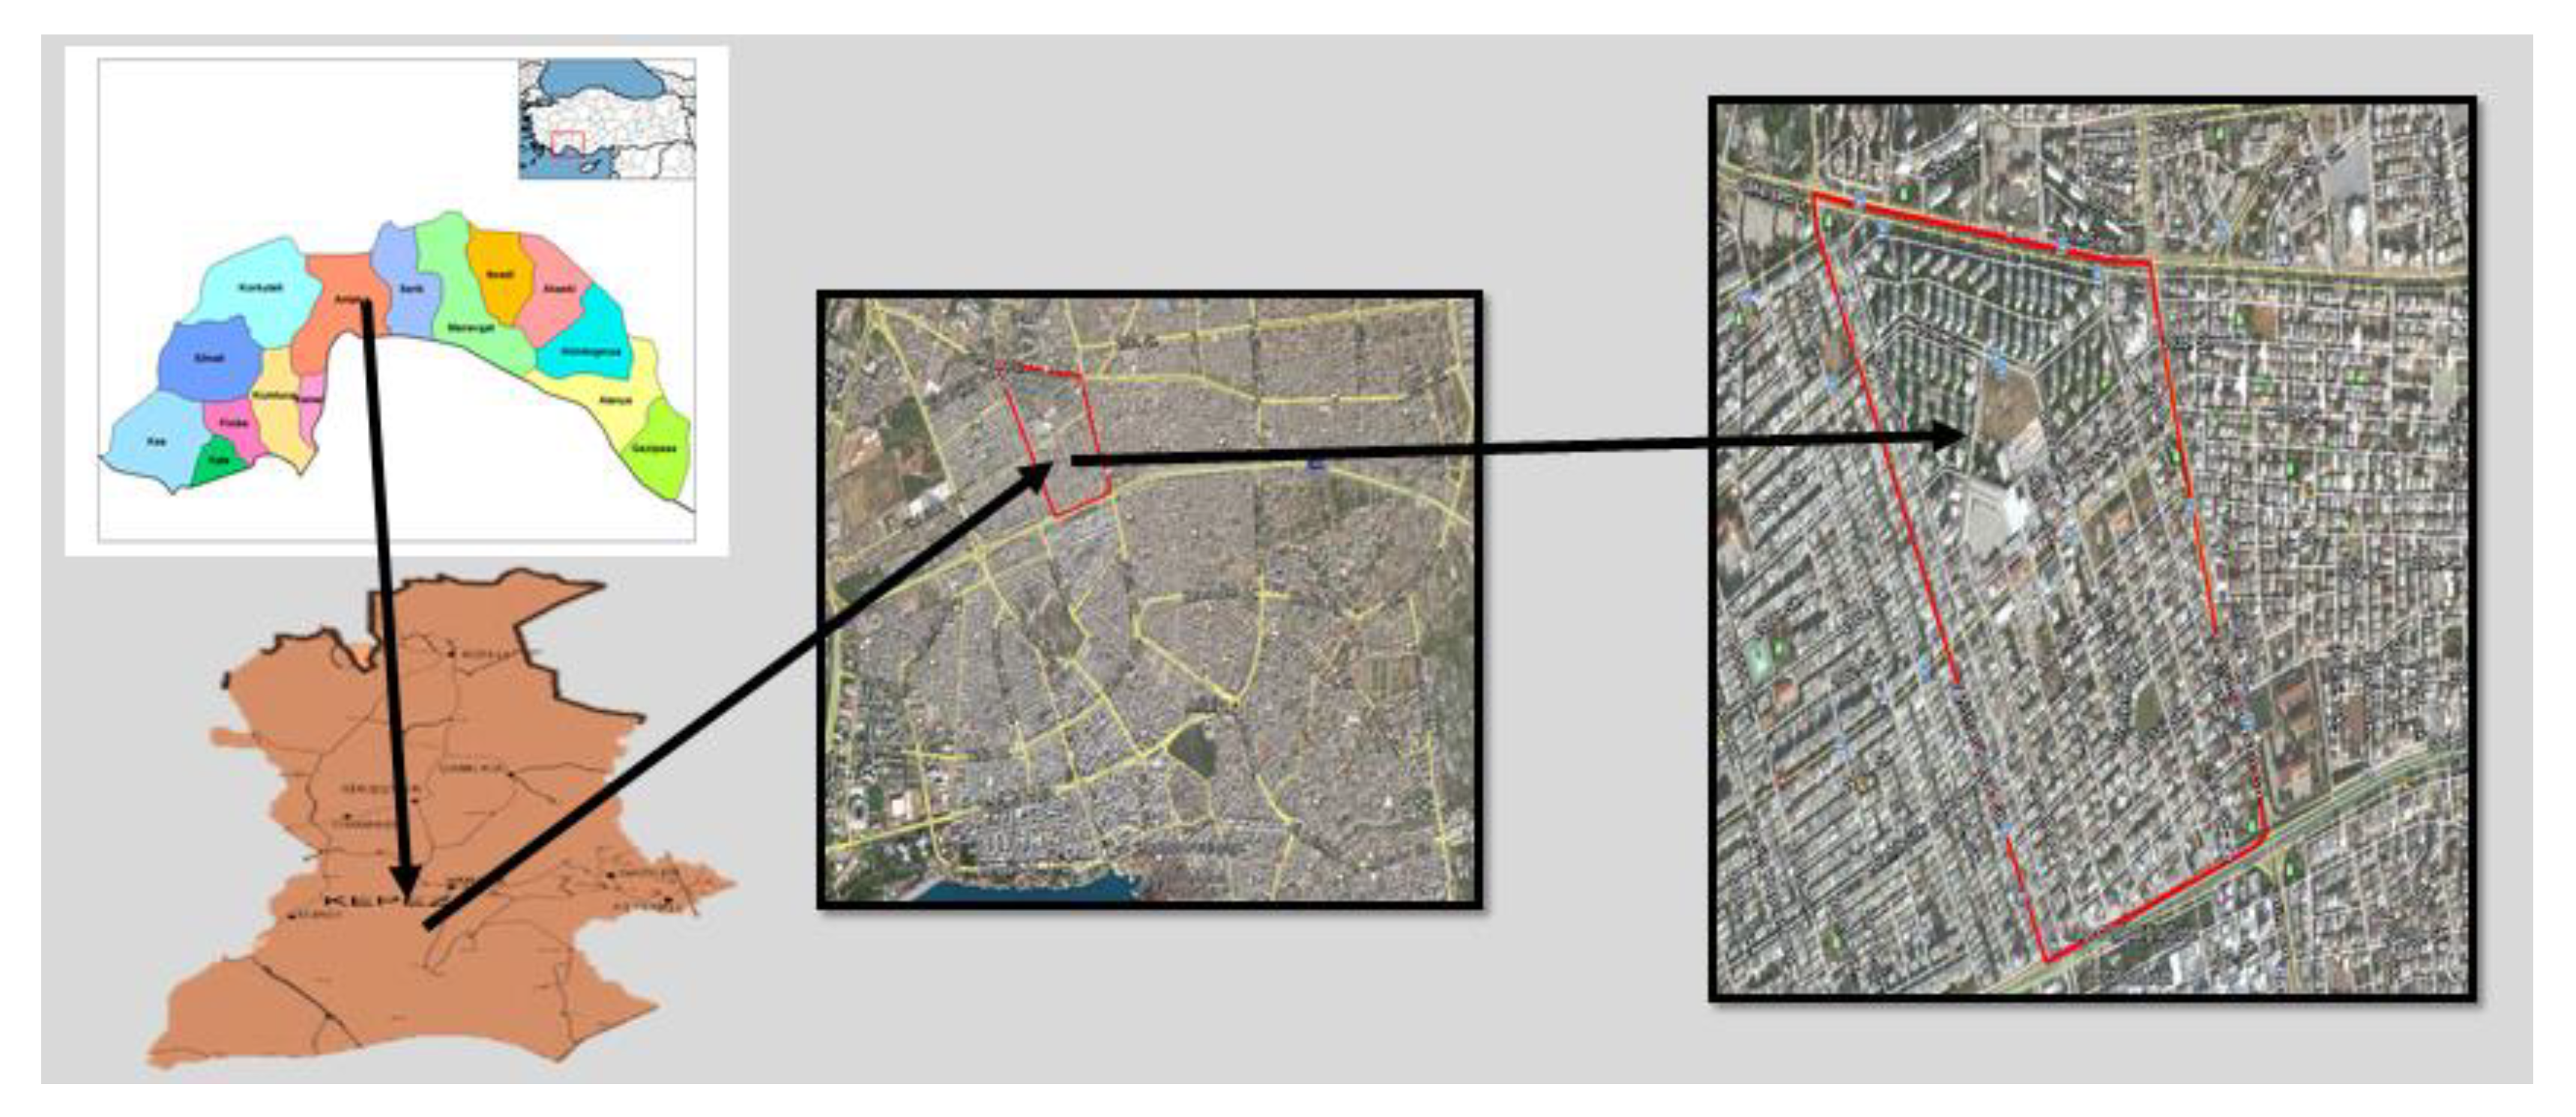
2.1. Test Site
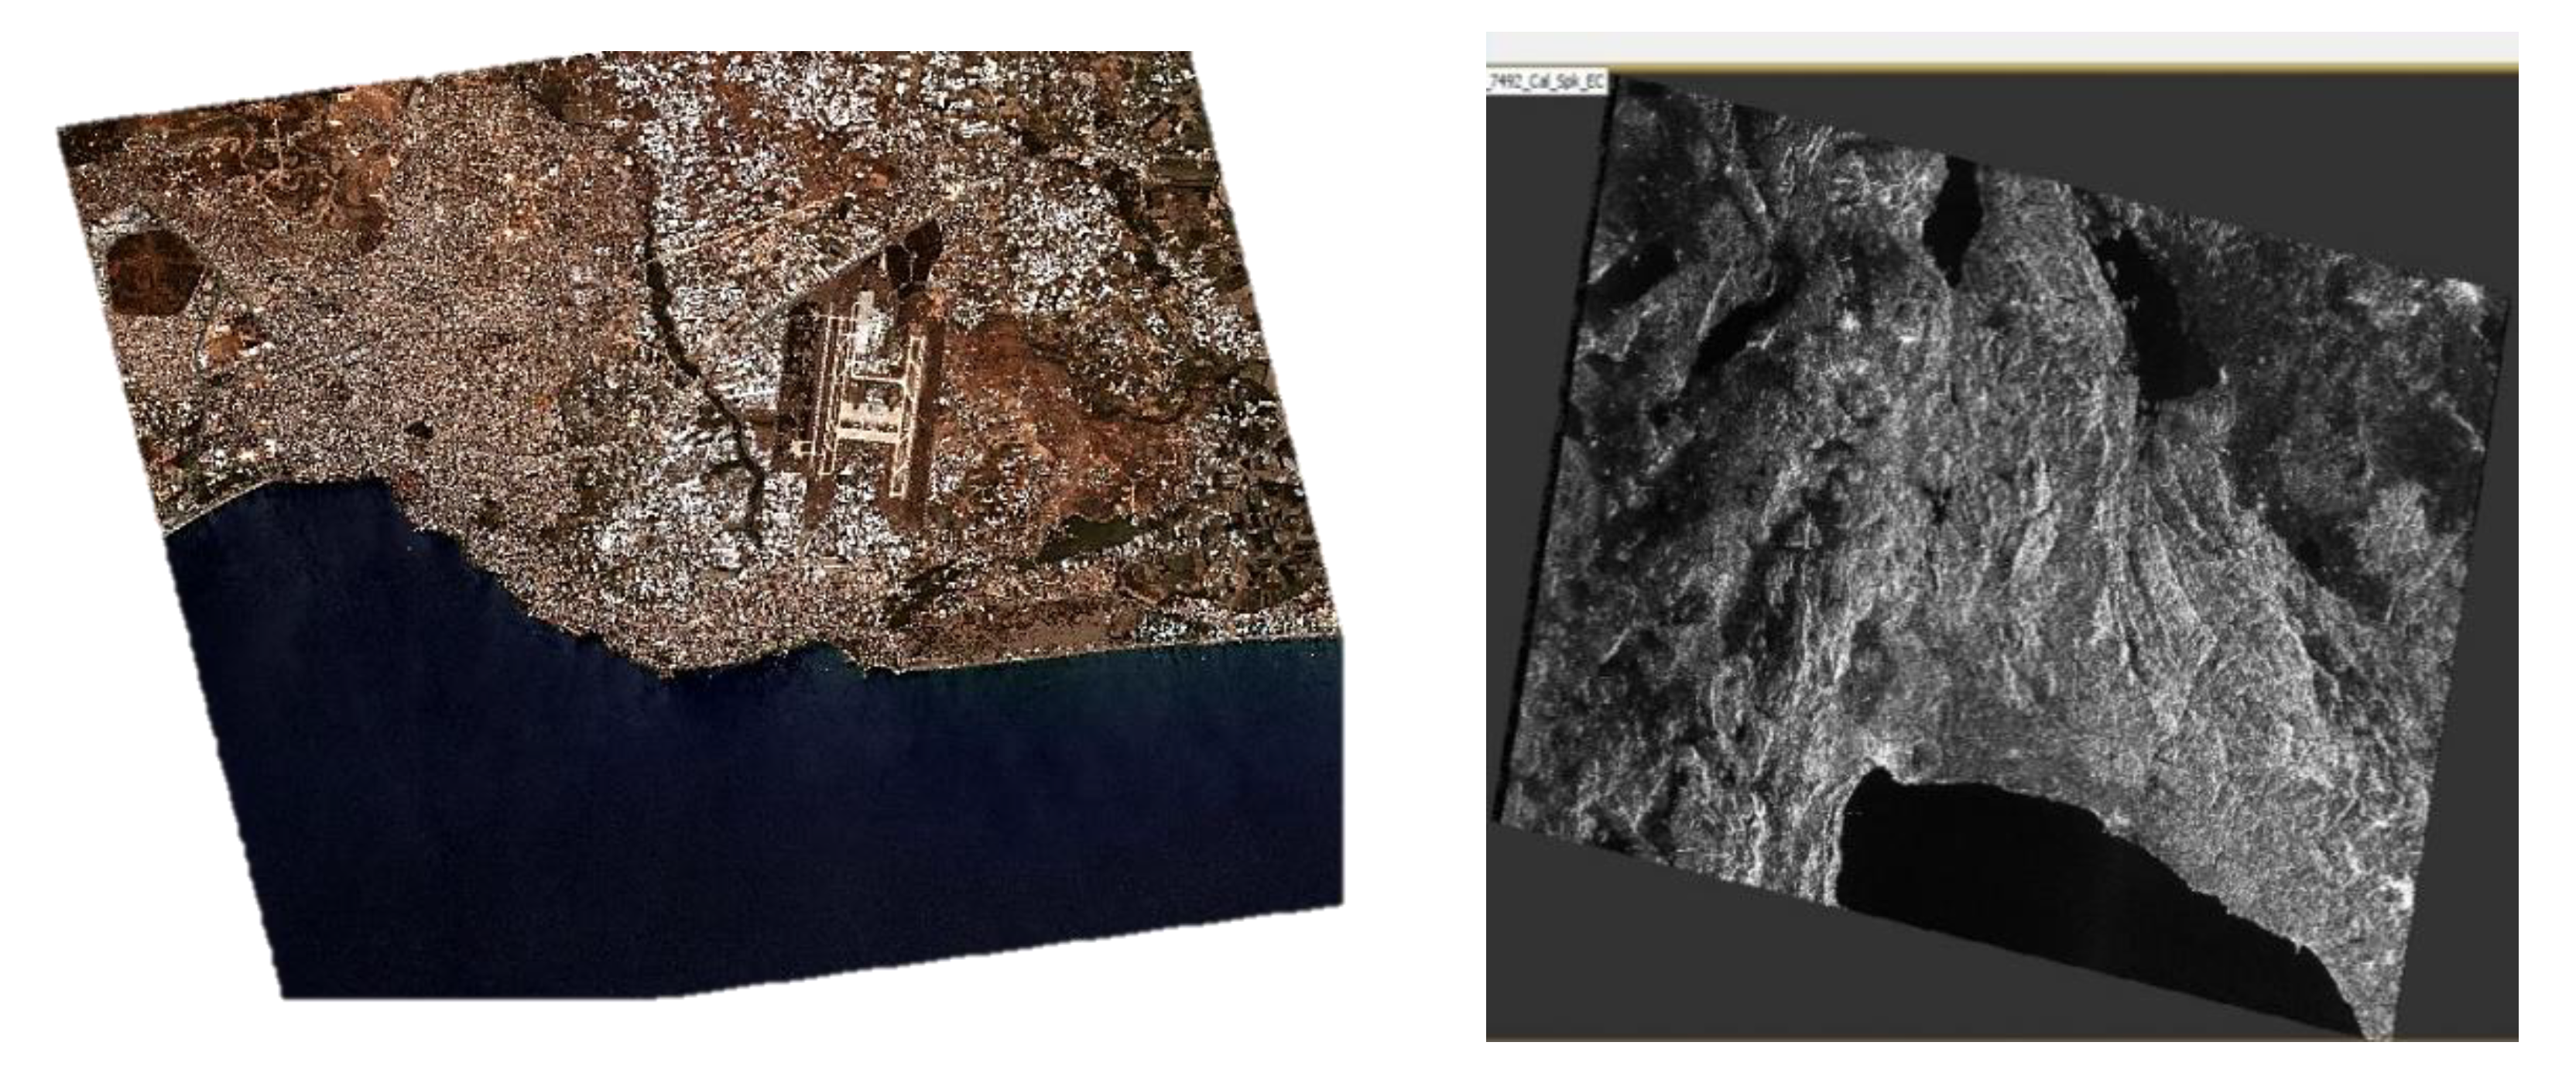
2.2. Used Data
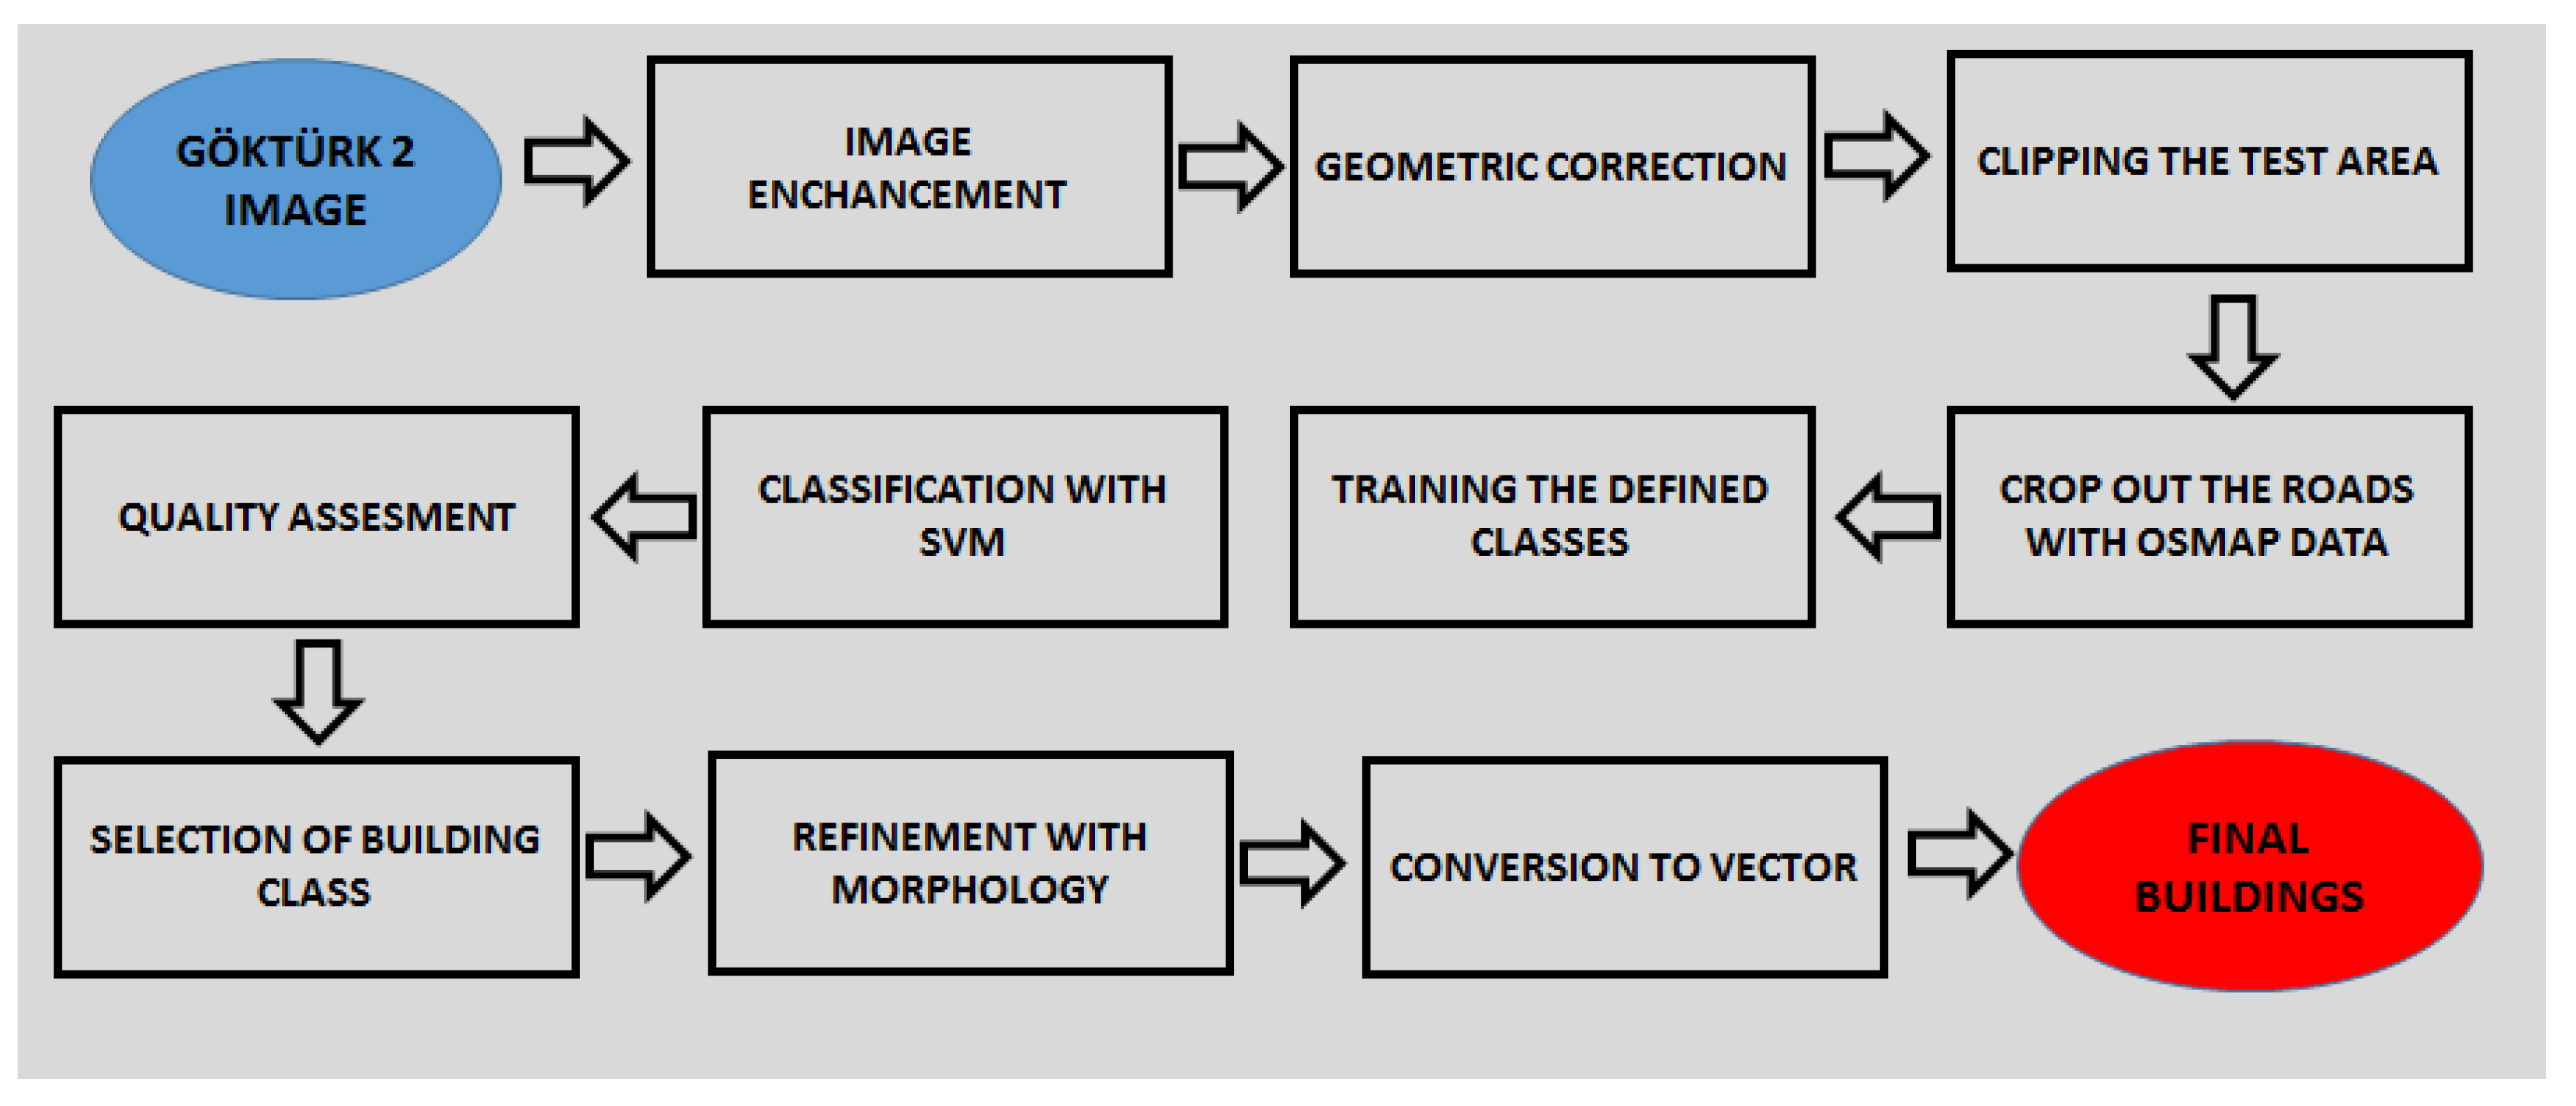
2.3. Method
2.3.1. Building Detection from the Gokturk Image
2.3.2. Building Detection from Sentinel Image
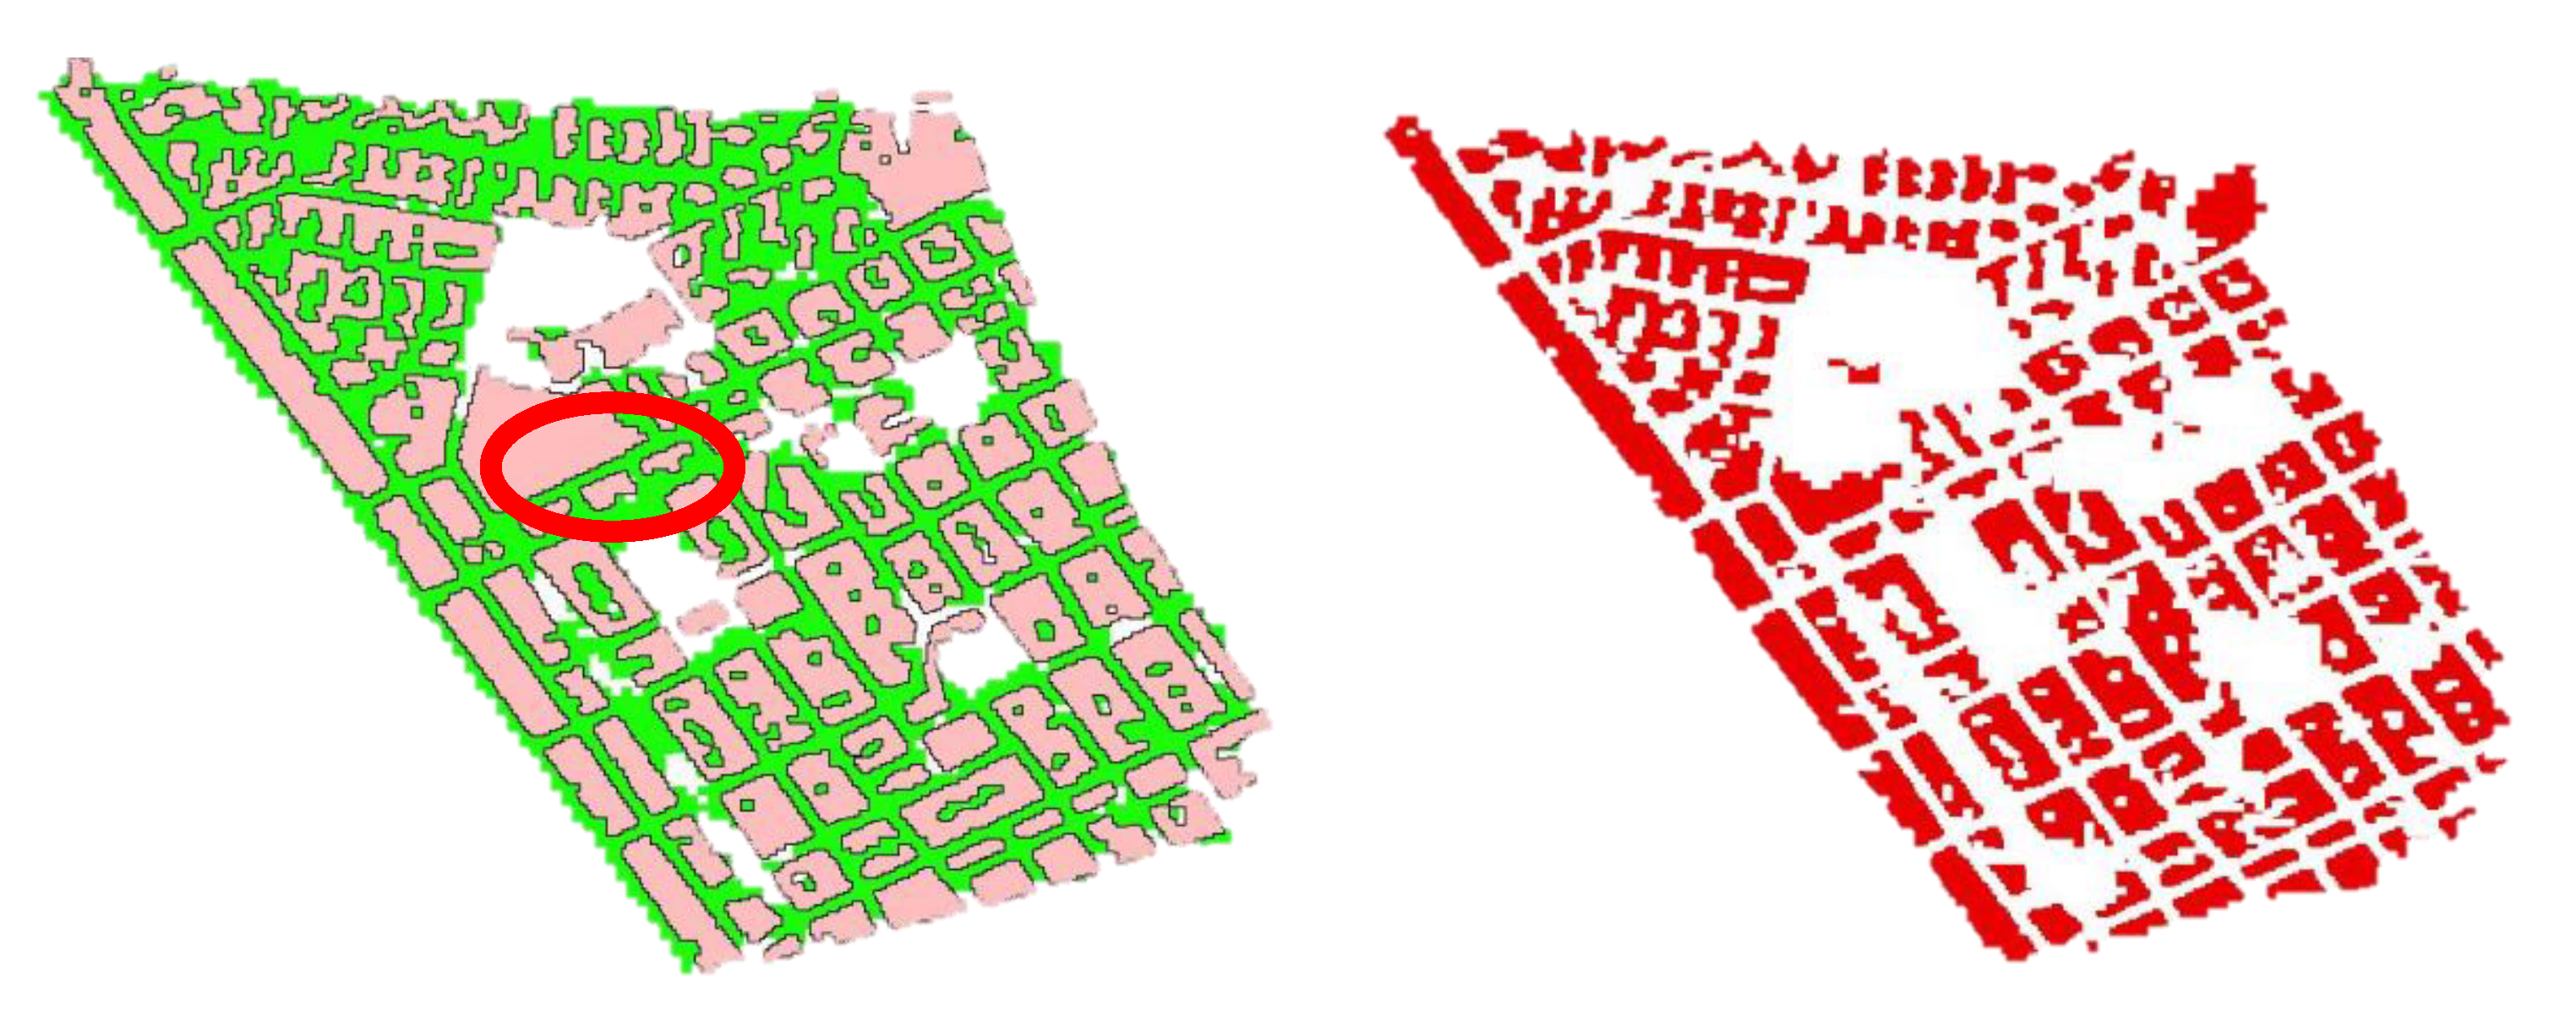
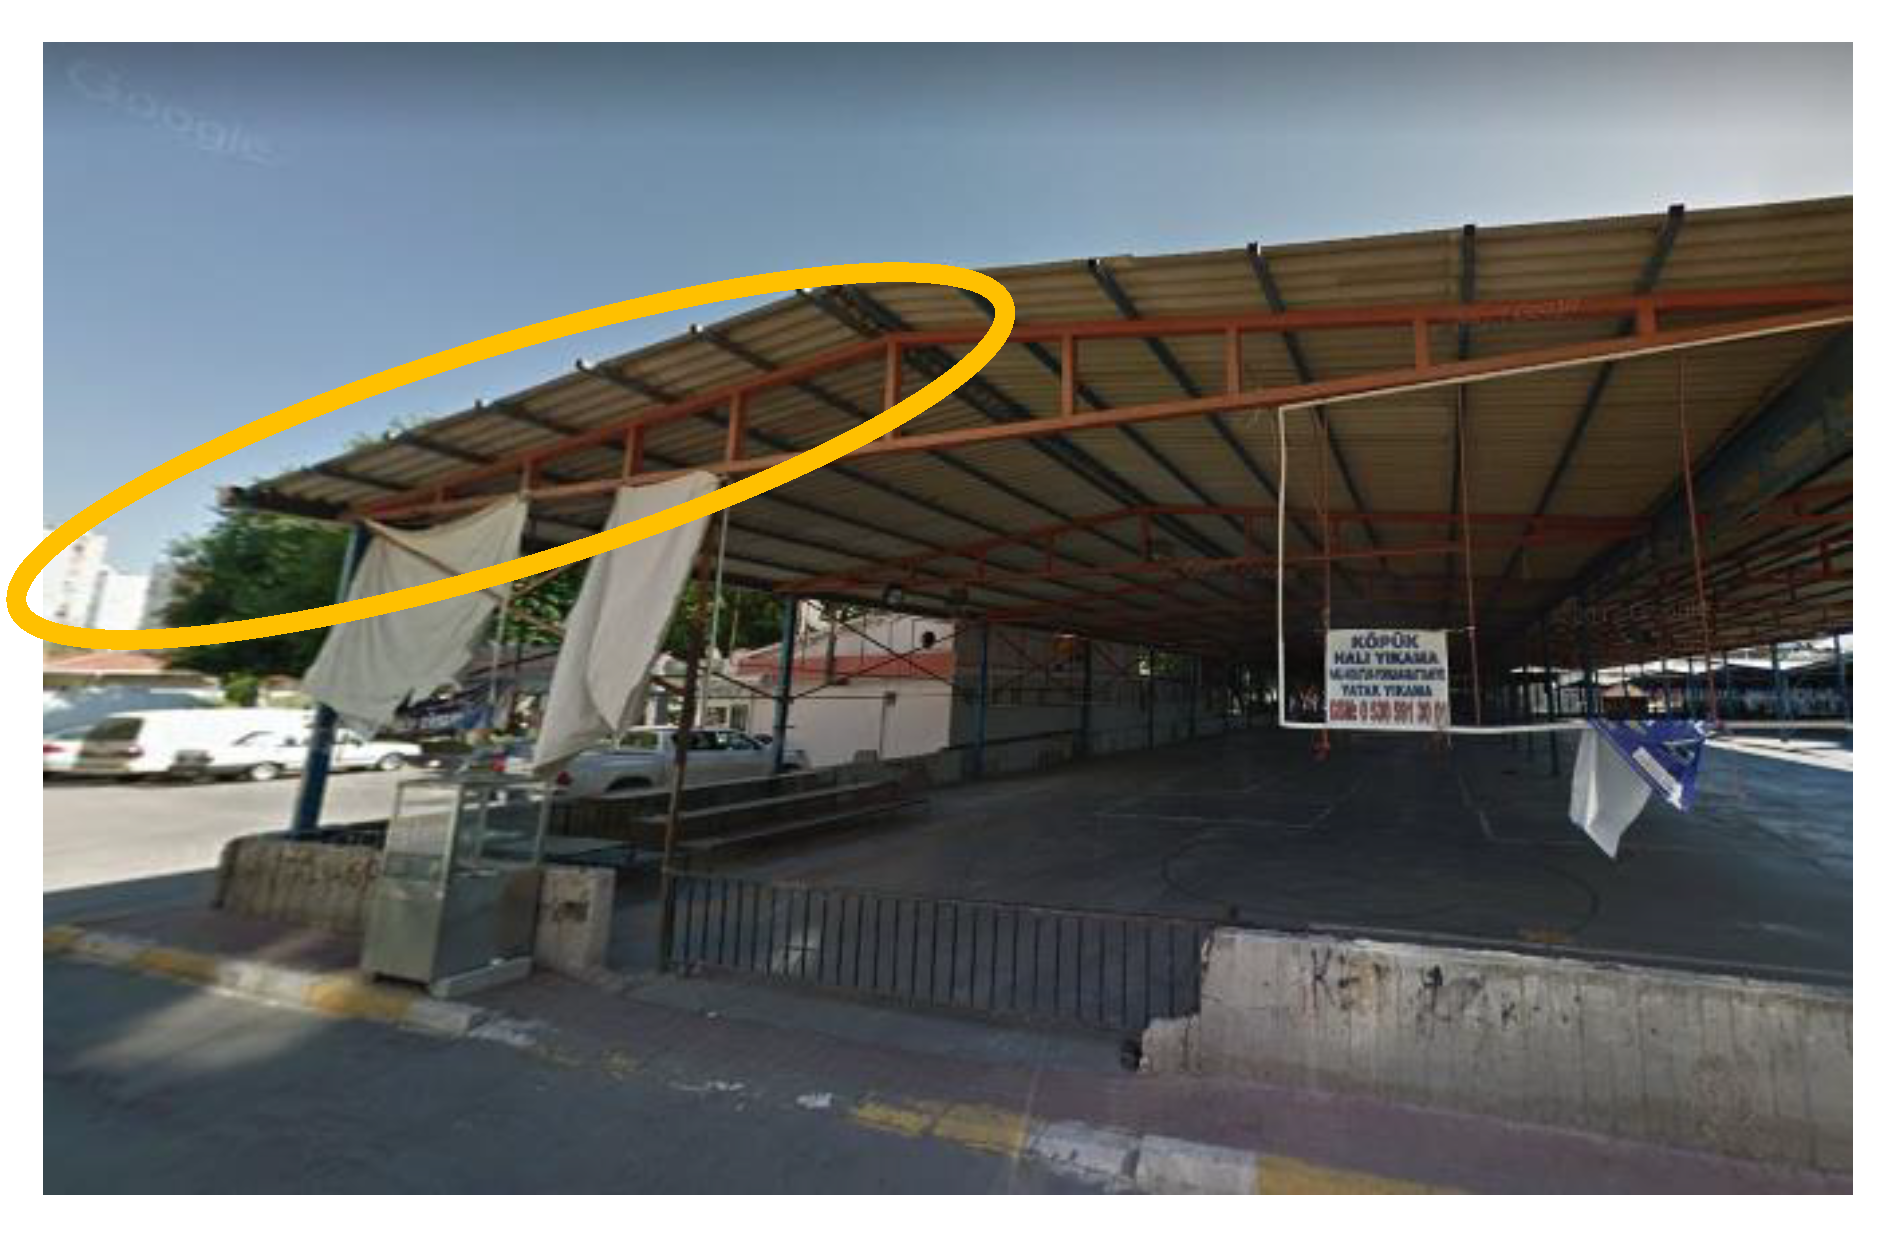
3. Results and Discussion
4. Conclusions
Author Contributions
Conflicts of Interest
References
- Turlapaty, A.; Gokaraju, B.; Du, Q.; Younan, N.H.; Aanstoos, J.V. A Hybrid Approach for Building Extraction From Spaceborne Multi-Angular Optical Imagery. IEEE J. Sel. Top. Appl. Earth Obs. Remote Sens. 2012, 5, 89–100. [Google Scholar] [CrossRef]
- Vakalopoulou, M.; Karantzalos, K.; Komodakis, N.; Paragios, N. Building detection in very high resolution multispectral data with deep learning features. In Proceedings of the 2015 IEEE International Geoscience and Remote Sensing Symposium (IGARSS), Milan, Italy, 26–31 July 2015; pp. 1873–1876. [Google Scholar]
- Zhang, Y. Optimisation of building detection in satellite images by combining multispectral classification and texture filtering. ISPRS J. Photogramm. Remote Sens. 1999, 54, 50–60. [Google Scholar] [CrossRef]
- Jin, X.; Davis, C.H. Automated Building Extraction from High-Resolution Satellite Imagery in Urban Areas Using Structural, Contextual, and Spectral Information. EURASIP J. Adv. Signal Process. 2005, 2005, 745309. [Google Scholar] [CrossRef]
- Liu, W.; Yamazaki, F. Object-Based Shadow Extraction and Correction of High-Resolution Optical Satellite Images. IEEE J. Sel. Top. Appl. Earth Obs. Remote Sens. 2012, 5, 1296–1302. [Google Scholar] [CrossRef]
- Jendryke, M.; McClure, S.C.; Balz, T.; Liao, M. Monitoring the built-up environment of Shanghai on the street-block level using SAR and volunteered geographic information. Int. J. Digit. Earth 2017, 10, 675–686. [Google Scholar] [CrossRef]
- Chen, J.; Wang, C.; Zhang, H.; Wu, F.; Zhang, B.; Lei, W. Automatic Detection of Low-Rise Gable-Roof Building from Single Submeter SAR Images Based on Local Multilevel Segmentation. Remote Sens. 2017, 9. [Google Scholar] [CrossRef]
- Solari, L.; Ciampalini, A.; Raspini, F.; Bianchini, S.; Zinno, I.; Bonano, M.; Manunta, M.; Moretti, S.; Casagli, N. Combined Use of C- and X-Band SAR Data for Subsidence Monitoring in an Urban Area. Geosciences 2017, 7. [Google Scholar] [CrossRef]
- Vijayalakshmi, G.; Sathyasri, B.; Mahalakshmi, V.; Bennet, M.A. Detection and Reconstruction of Radar Foot Prints for Map Updating. IIOAB J. 2017, 8, 111–123. [Google Scholar]
- Che, M.; Du, P.; Gamba, P. 2- and 3-D Urban Change Detection With Quad-PolSAR Data. IEEE Geosci. Remote Sens. Lett. 2018, 15, 68–72. [Google Scholar] [CrossRef]


| Date: | 04.08.2016 |
|---|---|
| Instrument: | SAR-C |
| Operational mode: | IW swath mode |
| Polarization: | VH, VV |
| Range and Azimuth Spacing: | 10 m |
| Azimuth and Range Looks: | Single |
Publisher’s Note: MDPI stays neutral with regard to jurisdictional claims in published maps and institutional affiliations. |
© 2018 by the authors. Licensee MDPI, Basel, Switzerland. This article is an open access article distributed under the terms and conditions of the Creative Commons Attribution (CC BY) license (https://creativecommons.org/licenses/by/4.0/).
Share and Cite
Kaynarca, M.; Demir, N. Detection of Urban Buildings by Using Multispectral Gokturk-2 and Sentinel 1A Synthetic Aperture Radar Images. Proceedings 2018, 2, 360. https://doi.org/10.3390/ecrs-2-05173
Kaynarca M, Demir N. Detection of Urban Buildings by Using Multispectral Gokturk-2 and Sentinel 1A Synthetic Aperture Radar Images. Proceedings. 2018; 2(7):360. https://doi.org/10.3390/ecrs-2-05173
Chicago/Turabian StyleKaynarca, Mustafa, and Nusret Demir. 2018. "Detection of Urban Buildings by Using Multispectral Gokturk-2 and Sentinel 1A Synthetic Aperture Radar Images" Proceedings 2, no. 7: 360. https://doi.org/10.3390/ecrs-2-05173
APA StyleKaynarca, M., & Demir, N. (2018). Detection of Urban Buildings by Using Multispectral Gokturk-2 and Sentinel 1A Synthetic Aperture Radar Images. Proceedings, 2(7), 360. https://doi.org/10.3390/ecrs-2-05173