Proceeding Paper

Automated Measurement of Plant Height of Wheat Genotypes Using a DSM Derived from UAV Imagery †

1
Department of Space Science and Technologies, Faculty of Science, Akdeniz University, 07070 Antalya, Turkey
2
Department of Field Crops, Faculty of Agriculture, Akdeniz University, 07070 Antalya, Turkey
3
Department of Remote Sensing and GIS, Institute of Science and Technology, Akdeniz University, 07070 Antalya, Turkey
*
Author to whom correspondence should be addressed.
Presented at the 2nd International Electronic Conference on Remote Sensing, 22 March–5 April 2018; Available online: https://sciforum.net/conference/ecrs-2.
Proceedings 2018, 2(7), 350; https://doi.org/10.3390/ecrs-2-05163
Published: 22 March 2018
(This article belongs to the Proceedings of The 2nd International Electronic Conference on Remote Sensing)

Abstract

:
In this study, we have evaluated the use of unmanned air vehicle (UAV) photogrammetry for the monitoring of a wheat experiment under field conditions, filtered a digital surface model (DSM) to derive the wheat plant heights, and compared the results with the field measurements. The images were acquired with the use of a low-cost UAV Walkera QR350 and GoProHero3+ action camera in May 2015. In total, 477 images were acquired for quality assessment of the proposed method, and a reference dataset was collected with terrestrial fieldwork. For a comparison of field measurements with DSM-derived plant heights, the maximum calculated plant height in the plot was selected. The mean, median, and standard deviation were calculated as 4.66, 3.75, and 13.78 cm. Regarding the statistical t-test between the field measurements and plant heights from the DSM, the t-value was calculated as 1.82, and the p-value was 0.071. Because the t-value was larger than 0.50, the values between the traditional method and our approach were highly correlated.

1. Introduction

Turkey is a country with a good climate and ecological properties for agricultural production, and agriculture occupies 24.6% of the workforce of the whole country [1]. Wheat production is important for the Turkish economy, and Turkey produced 17 million tons of wheat in 2016.
Traditionally, monitoring of the wheat height is performed with fieldwork under experiment conditions. Breeders and agronomists measure the plant height of wheat genotypes with random selection in predefined interval distances. However, this is time consuming and inaccurate, as it is not possible to measure all wheat genotypes tested in the field experiments. Thus, automated and accurate methods are needed.
High-resolution imagery allows for producing an accurate 3D model of any object, including agricultural field experiments. Unmanned air vehicle (UAV) technology gives an opportunity to acquire imagery from above, and photogrammetric workflow can then produce a high-resolution orthoimage as well as a 3D model. UAV technology also allows for repeating the process at predefined dates to monitor the growth of the plant height of the wheat genotypes periodically.
For monitoring of the wheat growth, the height of the wheat is one of the important parameters. The monitoring of the height changes at different times allows agronomists and breeders to determine the health and growth of the wheat in the experiments.
In the literature, crop surface models (CSMs) are created and used for the measuring of crop heights [2,3,4]. Bendig et al. [3] created CSMs of barley with centimeter resolution, and they calculated a mean value for each harvest parcel to estimate the crop heights. They applied a photogrammetric method with the use of the Agisoft Photoscan software package. Laser scanning data were also used by Tilly et al. [4], who created crop surface models from laser-derived point clouds. Similarly to Bendig [3], Possoch et al. [5] also generated UAV-based CSMs (crop surface models), and they used mean values of the subtracted surface model from DTM (Digital Terrain Model).
In agriculture, UAVs are also used for LAI (Leaf Area Index) and NDVI (Normalized Difference Vegetation Index) analysis to monitor the health of crops, but without considering the height of the vegetation [6,7,8].
There is some research regarding tree height estimation. Considering the use of UAVs in forest inventory studies, Fritz et al. [9] detected individual trees in an open area. They processed more than 1000 images, which were acquired at a 55 m flying height. The camera used was a Panasonic G3 with 14–42 mm focal heights and 16.6 megapixel resolution. The image acquisition was performed in April before the leaf emergence. They generated orthoimages and point clouds and compared them to those generated with a terrestrial laser scanner. For processing of the imagery, they used CMVS and PMVS-2 software packages. The processing schema consisted of six steps, namely, data cleaning, SIFT feature extraction, image matching, classification, point cloud generation, and choosing camera parameters for 3D modeling of the vegetation surface. They detected 73 trees. Their study compared laser- and image-based point clouds and confirmed that the results from the image data were superior to those from the laser scanner. Feng et al. [10] classified UAV-based images to detect urban vegetation.
In this study, we evaluate the use of UAV photogrammetry for the monitoring of wheat field experiments and compare the results with field measurements.

2. Experiments

The study area is located in Dosemealti agriculture area near Antalya province. This region has many wheat cultivation sites, as well as industrial organizations for the processing of the agricultural products. Figure 1 shows the study area, which contained 192 cultivation parcels in the wheat experiments, of which 52 were investigated.
The process starts with image acquisition using a low-cost UAV. The UAV was very simple, operating in a manual mode in high-wind conditions. Therefore, the flying height varied during the acquisition.
The images were pre-processed because of noise elimination and enhancement. Then, the commercial software package, Agisoft Photoscan, was used to create a high-resolution orthoimage and digital surface model (DSM). For measurement of the wheat plant heights, the DSM was filtered to derive the terrain model. Then, the terrain model was sub-structured from the surface model. Later on, for the determination of the wheat plant heights for each parcel, the maximum elevation was picked as the wheat plant height for evaluation. The results were evaluated with use of the reference dataset, which was created with field measurements.

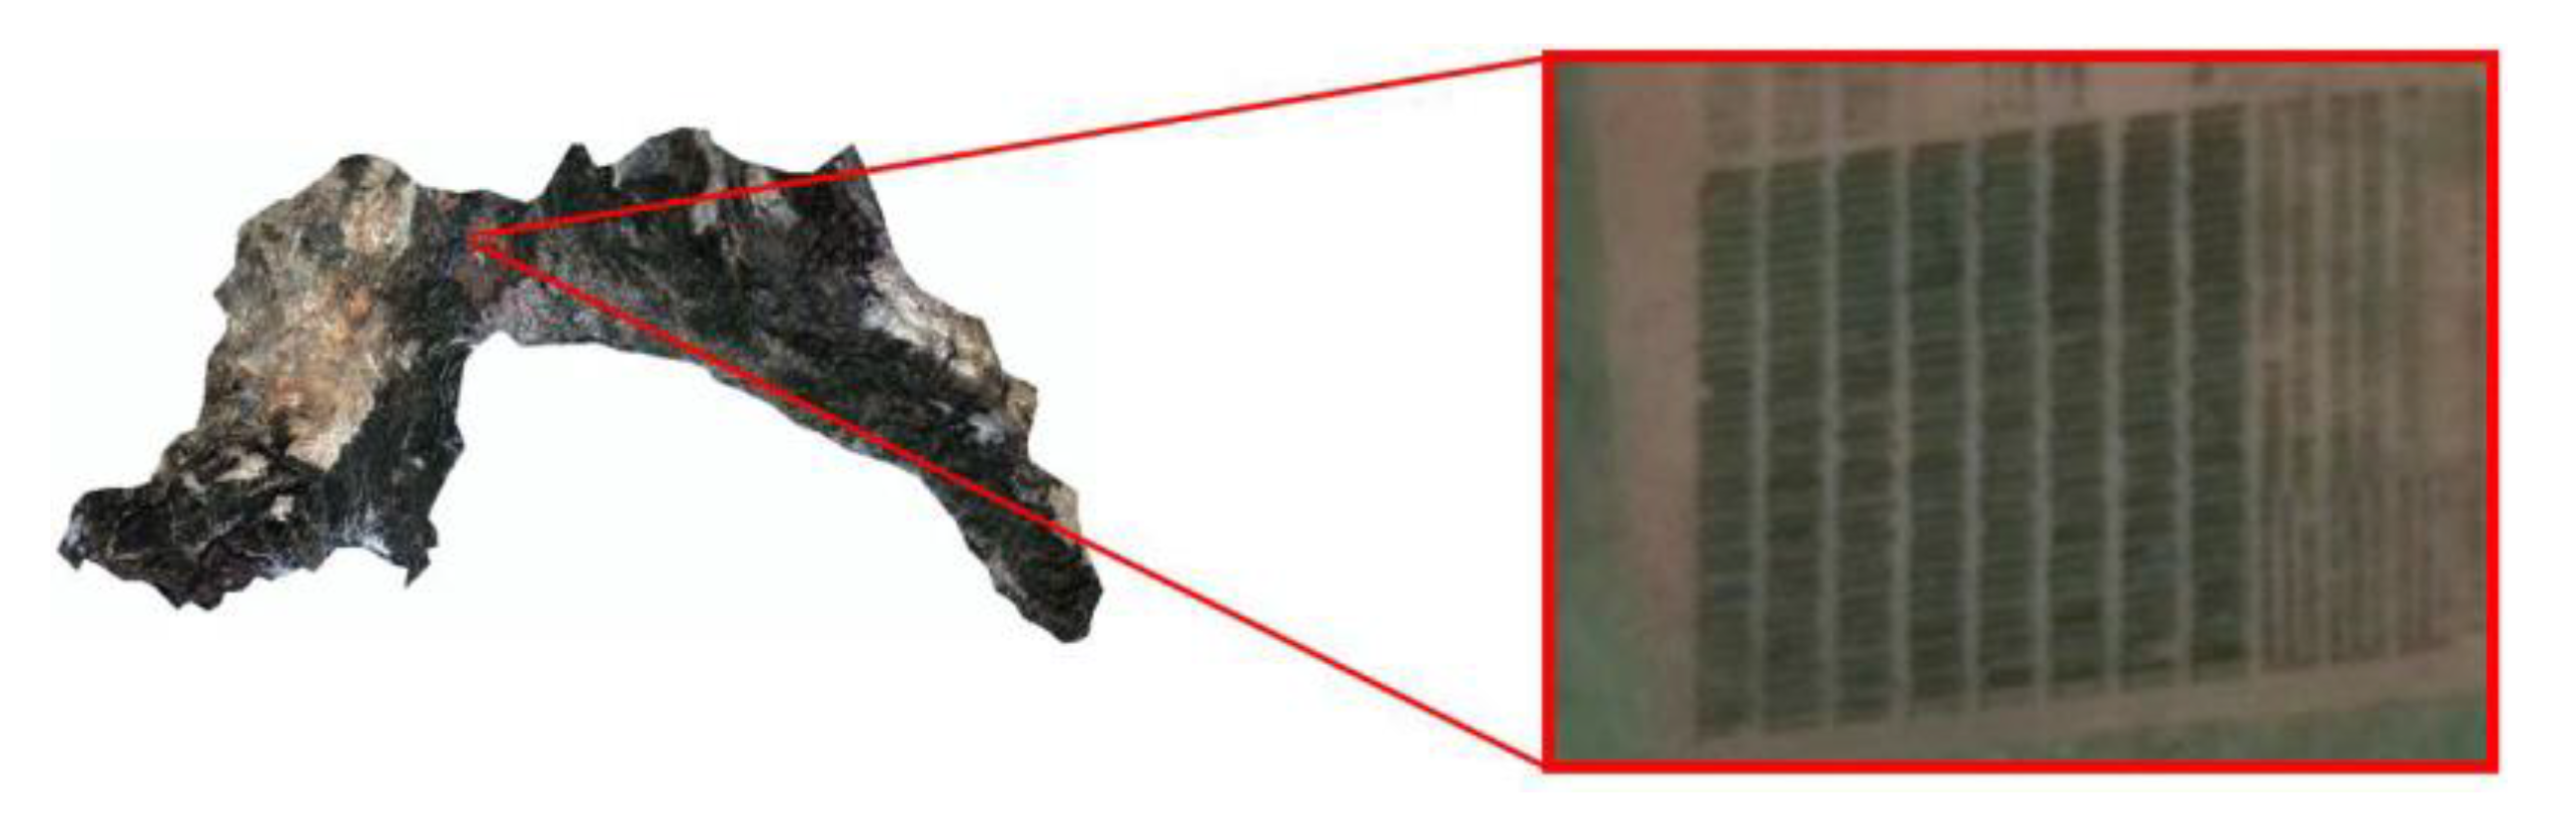
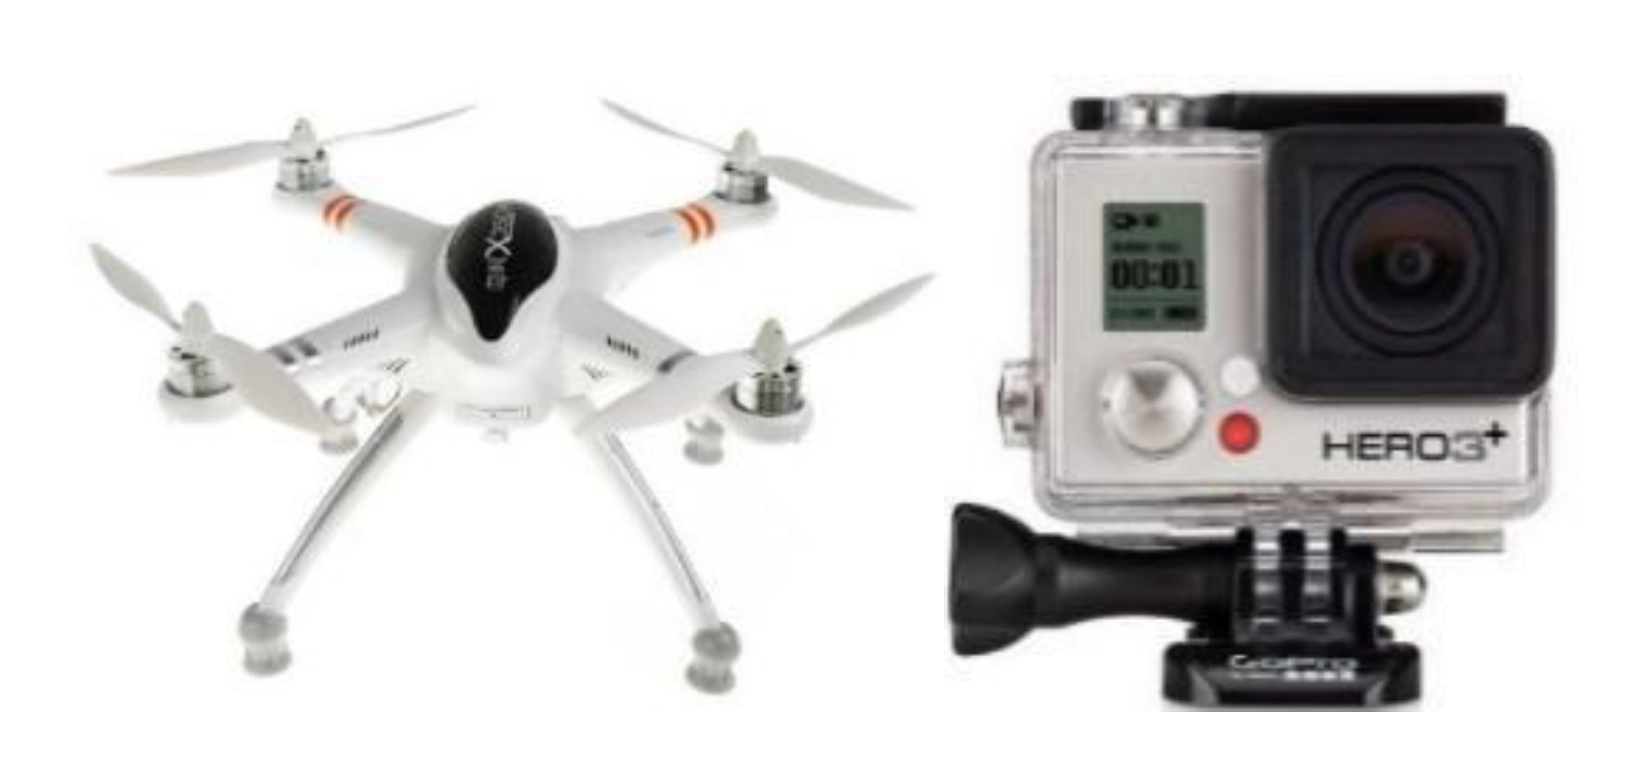
2.1. Image Acquisition

The images were acquired with use of a low-cost UAV Walkere QR350 and GoProHero3+ action camera on December 7, 2015. Figure 2 shows the used UAV and the camera. In total, 477 images were taken, and 55 were selected for processing.
The reference dataset was collected with terrestrial fieldwork. A special circle with a 1.5 m diameter was placed above the harvest parcel, and the average wheat plant height in the experimental area that intersected with the circle was reported as the wheat plant height for the selected parcel.

2.2. Image Pre-Processing

The acquired images were high resolution and were very useful for generating accurate surface models. However, the images contained noise, which needed to be eliminated. The images contained noise for various reasons, for example, atmospheric effects, and the sensor itself.
The pre-processing contained three steps: estimating the noise, noise reduction [11], and Wallis filtering [12], which forces the mean and the standard deviation of an image to fit given values. An adaptive edge-preserving smoothing filter [11] was used for reduction of the noise. This filter preserves edge features such as one-pixel lines, corners, and line points.

2.3. Generation of Surface Model and Orthoimage

Image orientation was necessary to match images and 3D reconstruction from the pre-processed dataset. The exterior orientation was performed with automatic tie-point extraction using bundle adjustment and ground control points (measured on Google Earth imagery). The images were processed and the point cloud and orthoimage were created with the use of the Agisoft Photoscan software. The elevation of the ground control points was interpolated from an ASTER-based 30 m resolution digital elevation model.
For calculation of the wheat plant heights, a terrain model had to be generated. Reduction of the generated DSM enabled the terrain model to be produced. For this purpose, a progressive morphological filter method [13] was applied. The method starts with a morphological opening operation on the surface model to generate a secondary surface. The elevation difference between the cells is compared between those previous and those current cell during the iteration. If the difference reaches a defined threshold, the cell is classified as a non-ground object. The threshold used is calculated with a predefined slope value (s). The window size of the filtering kernel ( d h T , k ) is increased, and the derived surface is used as an input for the next operation. This is defined by Zhang et al. [13]:
d h T , k = { dh max if   d h T , k > dh max s ( w k w k 1 ) c + d h 0 else   if   w k > 3 dh 0 else   if   w k 3 }
where d h T , k   is the height difference threshold; d h 0   is the initial elevation difference threshold, which approximates the error of DSM measurements;   dh max is the maximum elevation difference threshold (m); c is the grid size (m); s is the estimated terrain slope; and w k   is the filtering window size (in number of cells) at the each iteration.

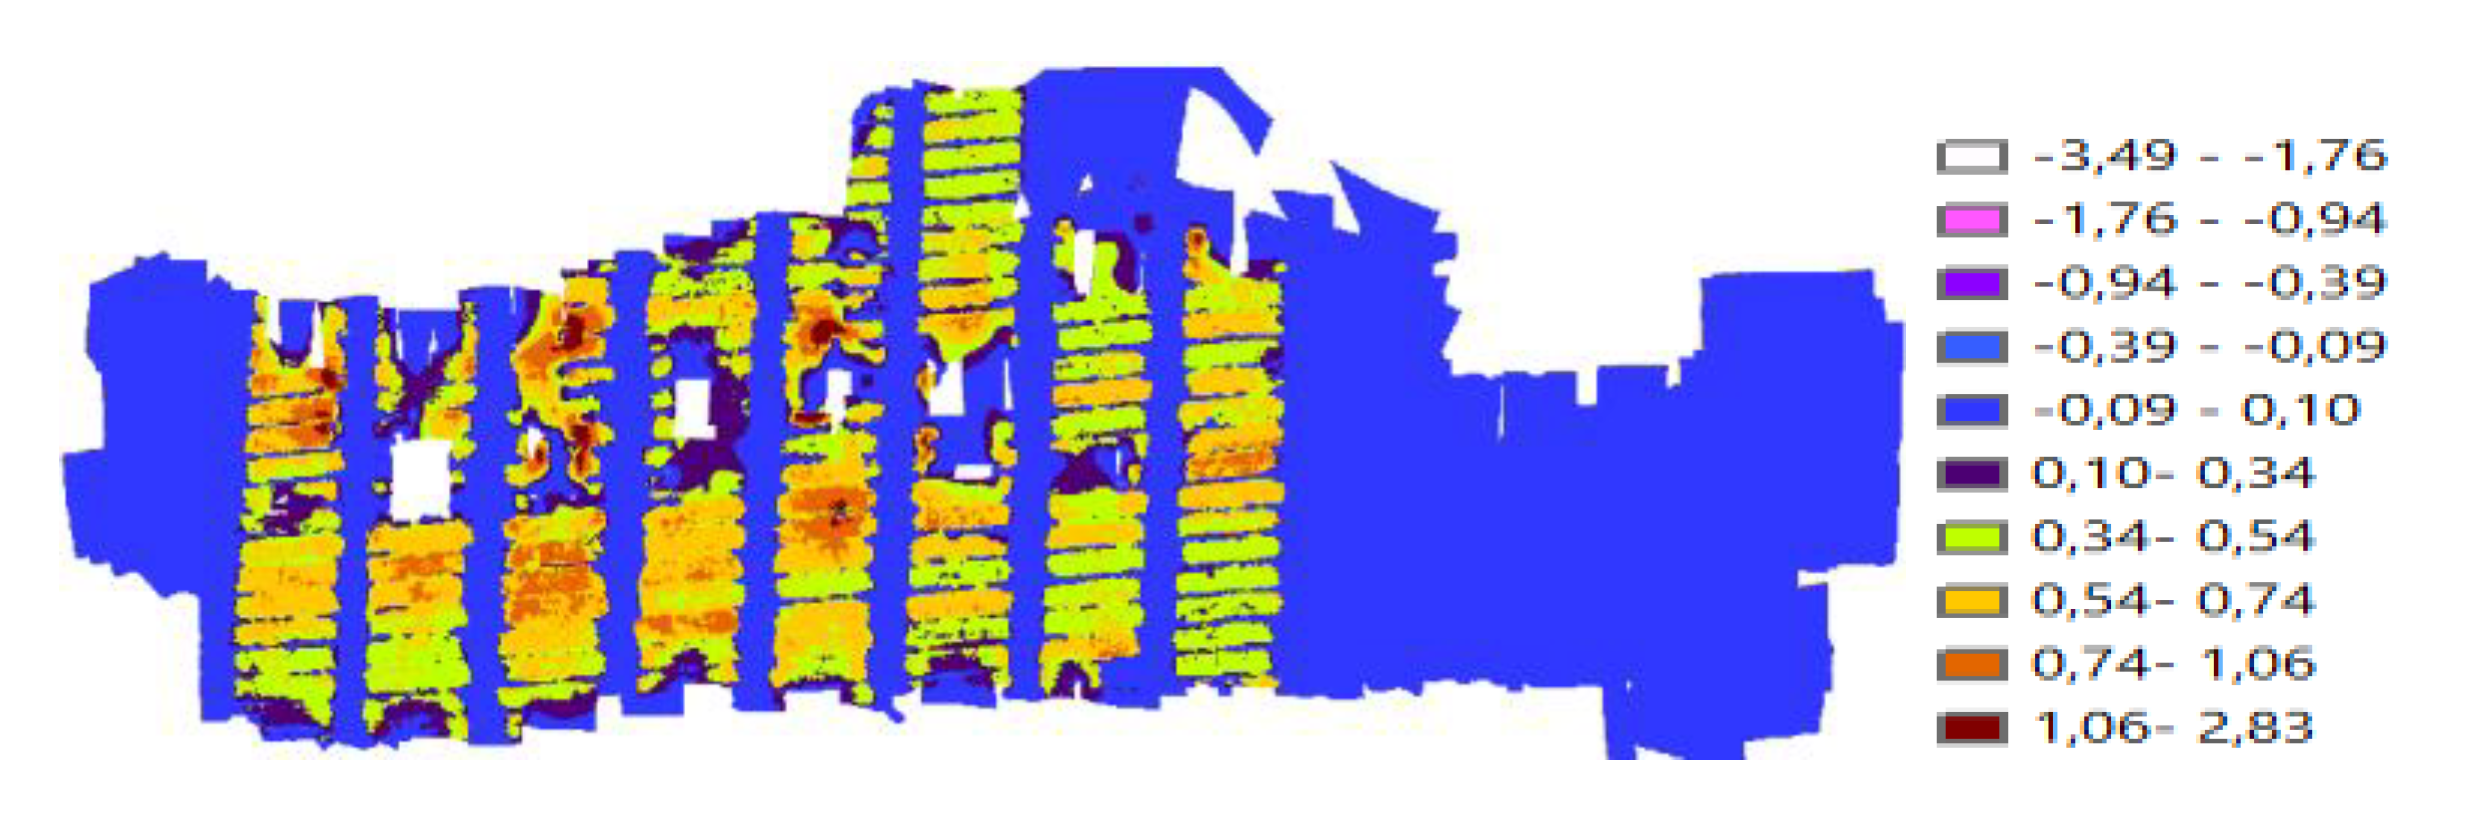
3. Results and Discussion

Subtracting the terrain model from the surface model gave the normalized surface model, which was used for the calculation of the wheat plant heights in the harvest parcels. The height map of the wheat plants in the experiment is shown in Figure 3.
For comparison with the field measurements, 55 parcels were selected.
For each parcel, the maximum, minimum, and average height values were calculated. Because the generated surface model was produced with the photogrammetrical method, gaps between the wheat parcels were also present, and these gaps affected the statistical values negatively. Therefore, only maximum height values were chosen for the calculation of the wheat plant heights.
Wheat heights|Pi = max(nDSM) Pi,i[1, 2, 3 … n]
For n parcels, the wheat height for parcel n was determined as the maximum elevation in the parcel n. There was a high correlation between the height values derived from field measurements and the calculated values from the proposed method. The calculated statistical mean, median, and standard deviation values are listed in Table 1.
The mean, median, and standard deviation were calculated as 4.66, 3.75, and 13.78 cm. Regarding the statistical t-test between the field measurements and plant heights from the DSM, the t-value was calculated as 1.82, and the p-value was 0.071. Because the t-value was larger than 0.50, the values between the traditional method and our approach were highly correlated, the p-value confirming this result. In a previous work [14], barley heights were measured as 72.6 cm with a 15.2 cm standard deviation with the use of traditional methods.

4. Conclusions

In this work, it is concluded that UAV imagery is an effective alternative method for ground measurements to measure the plant height. The filtering method has a direct influence on the final results. Any improvement in the filtering of surface models will allow increased quality of the results. As a future work, laser scanning can be applied to compare its performance to measure the plant height.

Author Contributions

N.D. developed the idea and wrote the paper; S.Ü. ran and compiled the experiments; N.K.S. contributed in the processing of aerial imagery for crop height purposes, as well as developed the statistical methods; and T.A. planned and conducted the fieldwork and contributed in the statistical analysis. All authors have read and agreed to the published version of the manuscript.

Abbreviations

DSMDigital surface model
nDSMNormalized digital surface model
UAVUnmanned air vehicle

References

  1. Maliye Bakanlığı, T.C. Yıllık Ekonomik Rapor 2016; Turkish Parliament: Ankara, Turkey, 2017; p. 99. (In Turkish) [Google Scholar]
  2. Bendig, J.; Bolten, A.; Bareth, G. UAV-based Imaging for Multi-Temporal, very high Resolution Crop Surface Models to monitor Crop Growth VariabilityMonitoring des Pflanzenwachstums mit Hilfe multitemporaler und hoch auflösender Oberflächenmodelle von Getreidebeständen auf Basis von Bildern. Photogramm. Fernerkundung Geoinf. 2013, 2013, 551–562. [Google Scholar] [CrossRef]
  3. Bendig, J.; Yu, K.; Aasen, H.; Bolten, A.; Bennertz, S.; Broscheit, J.; Gnyp, M.L.; Bareth, G. Combining UAV-based plant height from crop surface models, visible, and near infrared vegetation indices for biomass monitoring in barley. Int. J. Appl. Earth Obs. Geoinf. 2015, 39, 79–87. [Google Scholar] [CrossRef]
  4. Tilly, N.; Hoffmeister, D.; Cao, Q.; Huang, S.; Lenz-Wiedemann, V.; Miao, Y.; Bareth, G. Multitemporal crop surface models: Accurate plant height measurement and biomass estimation with terrestrial laser scanning in paddy rice. J. Appl. Remote Sens. 2014, 8, 83623–83671. [Google Scholar] [CrossRef]
  5. Possoch, M.; Bieker, S.; Hoffmeister, D.; Bolten, A.; Schellberg, J.; Bareth, G. Multi-Temporal Crop Surface Models Combined with the RGB Vegetation Index from Uav-Based Images for Forage Monitoring in Grassland. ISPRS Int. Arch. Photogramm. Remote Sens. Spat. Inf. Sci. 2016, XLI, 991–998. [Google Scholar] [CrossRef]
  6. Lelong, C.C.; Burger, P.; Jubelin, G.; Roux, B.; Labbé, S.; Baret, F. Assessment of Unmanned Aerial Vehicles Imagery for Quantitative Monitoring of Wheat Crop in Small Plots. Sensors 2008, 8, 2557–3583. [Google Scholar] [CrossRef] [PubMed]
  7. Sugiura, R.; Tsuda, S.; Tamiya, S.; Itoh, A.; Nishiwaki, K.; Murakami, N.; Shibuya, Y.; Hirafuji, M.; Nuske, S. Field phenotyping system for the assessment of potato late blight resistance using RGB imagery from an unmanned aerial vehicle. Biosyst. Eng. 2016, 148, 1–10. [Google Scholar] [CrossRef]
  8. Herwitz, S.R.; Johnson, L.F.; Dunagan, S.E.; Higgins, R.G.; Sullivan, D.V.; Zheng, J.; Lobitz, B.M.; Leung, J.G.; Gallmeyer, B.A.; Aoyagi, M.; et al. Imaging from an unmanned aerial vehicle: Agricultural surveillance and decision support. Comput. Electron. Agric. 2004, 44, 49–61. [Google Scholar] [CrossRef]
  9. Fritz, A.; Kattenborn, T.; Koch, B. Uav-Based Photogrammetric Point Clouds Tree Stem Mapping In Open Stands In Comparison To Terrestrial Laser Scanner Point Clouds. ISPRS Int. Arch. Photogramm. Remote Sens. Spat. Inf. Sci. W2. [CrossRef]
  10. Feng, Q.; Liu, J.; Gong, J. UAV Remote Sensing for Urban Vegetation Mapping Using Random Forest and Texture Analysis. Remote Sens. 2015, 7, 1074–1094. [Google Scholar] [CrossRef]
  11. Pateraki, M.N. Adaptive Multi-Image Matching for DSM Generation from Airborne Linear Array CCD Data; Gruen, P.D.A., Ed.; ETH Zurich: Zurich, Switzerland, 2005. [Google Scholar]
  12. Wallis, H. An approach for the space variant restoration and enhancement of images. In Proceedings of the Symposium on Current Mathematical Problems in Image Science, Monterey, CA, USA, 10–12 November 1976. [Google Scholar]
  13. Zhang, K.; Chen, S.C.; Whitman, D.; Shyu, M.L.; Yan, J.; Zhang, C. A progressive morphological filter for removing nonground measurements from airborne LIDAR data. IEEE Trans. Geosci. Remote Sens. 2003, 41, 872–882. [Google Scholar] [CrossRef]
  14. Karagöz, A.; Özbek, K.; Akar, T.; Ergün, N.; Aydoğan, S. İsmail; Sayım Agro-Morphological Variation Among an Ancient World Barley Collection. J. Agric. Sci. 2017, 23, 444–452. [Google Scholar]
Figure 1. Experimental area.
Proceedings 02 00350 g001
Figure 2. Unmanned air vehicle (UAV) (left) and GoPro camera (right) used.
Proceedings 02 00350 g002
Figure 3. Crop height model.
Proceedings 02 00350 g003
Table 1. Statistics of the differences between field measurements and the calculated plant heights (cm).
MeanMedianStandard Deviation
4.663.7513.78
Publisher’s Note: MDPI stays neutral with regard to jurisdictional claims in published maps and institutional affiliations.

