Proceeding Paper

Modeling the Expenditure and Recovery of Anaerobic Work Capacity in Cycling †

by
Phoebe Bickford
1,
Vijay Sarthy M. Sreedhara
1,
Gregory M. Mocko
1,*,
Ardalan Vahidi
1 and
Randolph E. Hutchison
2
1
Department of Mechanical Engineering, Clemson University, Clemson, SC 29634, USA
2
Department of Health Sciences, Furman University, Greenville, SC 29613, USA
*
Author to whom correspondence should be addressed.
Presented at the 12th conference of the International Sports Engineering Association, Brisbane, Queensland, Australia, 26–29 March 2018.
Proceedings 2018, 2(6), 219; https://doi.org/10.3390/proceedings2060219
Published: 23 February 2018

Abstract

:
The objective of this research is to model the expenditure and recovery of Anaerobic Work Capacity (AWC) as related to Critical Power (CP) during cycling. CP is a theoretical value at which a human can operate indefinitely and AWC is the energy that can be expended above CP. There are several models to predict AWC-depletion, however, only a few to model AWC recovery. A cycling study was conducted with nine recreationally active subjects. CP and AWC were determined by a 3-min all-out test. The subjects performed interval tests at three recovery intervals (15 s, 30 s, or 60 s) and three recovery powers (0.50CP, 0.75CP, and CP). It was determined that the rate of expenditure exceeds recovery and the amount of AWC recovered is influenced more by recovery power level than recovery duration. Moreover, recovery rate varies by individual and thus, a robust mathematical model for expenditure and recovery of AWC is needed.

1. Introduction

In this research, experiments are developed to model the expenditure and recovery of Anaerobic Work Capacity (AWC) for power levels above and below Critical Power (CP). CP is defined as a power level at which a human can operate indefinitely and AWC is the amount of anaerobic energy that can be expended at power levels above CP [1]. The advent of miniature, real-time sensors has provided opportunities for health monitoring [2] as well as exercise-fatigue modeling. These devices include heartrate monitors, Near-Infrared Spectroscopy (NIRS) devices, GPS-enabled wrist watches, and power meters. The motivation of this research is to allow for prolonged physical exertion and to understand how energy and power are used within human work expenditure. It should be noted that the study performed in this research is focused on cycling. However, the goal is to apply the learnings to other exercise forms like running and sprint-work. Understanding the limitations of the human body can lead to optimized exercise and performance. This can be achieved by optimally reaching fatigue in training and thereby avoiding exhaustion in races.

2. A Review of Anaerobic Work Capacity and Critical Power

Hill [3] first suggested the hyperbolic relationship between average speed and time while studying athletic records in different sports. Monod and Scherrer [1] then quantified AWC and CP, which were determined through multiple cycling tests to exhaustion across several days. Monod and Sherrer [1] defined Critical Power (CP) as the power a muscle can “keep up for a very long time without fatigue”. Anaerobic Work Capacity was defined as Limit Work and was equal to the product of power and time to exhaustion given by,
W L i m = ( P C P ) t L i m
where, P is power in Watts, tLim is time-to-exhaustion in seconds, and WLim is Limit Work in Joules. This WLim has since been referred to as Anaerobic Work Capacity. To determine CP, a subject is required to exercise till exhaustion at a constant power (P) on at least three different lab visits. These tests yield a hyperbolic plot of power versus time with the asymptote being the CP. The hyperbolic relationship has been transformed into a linear relationship (P vs. 1/tLim) by many researchers, [1,4,5,6] to name a few. Where, CP is determined by the y-intercept of the plot and AWC is determined by the slope. Morton in [7] developed a ramp exercise to exhaustion protocol to determine CP and AWC, which has been validated in [8]. To avoid multiple lab visits to determine CP and AWC, Vanhatalo and colleagues [9] proposed a 3 min all-out test (3mAOT) protocol. The test involves a subject pedaling at all-out intensity for 3 min. CP is given by the average power output of the last 30 s of the test and the area under the power output curve above CP gives the subjects’ AWC [9,10]. The test has since been validated in [11,12].
Morton and Billat [13] suggested that recovery of AWC varies linearly with expenditure of AWC. Ferguson and colleagues [14] investigated charge and discharge of AWC in cycling and suggested that the recovery of AWC is non-linear. Skiba and colleagues [15,16] also investigated recovery of AWC and proposed an exponential model for the “reconstitution” (or recovery as it will be here) of AWC of an athlete given by,
W b a l = W 0 t ( W exp ) e ( t u τ W ) d u
where W′ is AWC, W′bal is the amount of AWC remaining in Joules, W′exp is the amount of AWC that has been burned in Joules, (tu) is time spent below CP in seconds, and τW′ is the time constant of reconstitution of AWC in seconds. The time constant follows a non-linear trend with DCP, which is the difference between the average recovery power for the entire exercise and CP, given by:
τ W = 546 e ( .01 D C P ) + 316
While Skiba’s work provides a baseline equation to model expenditure and recovery, there are several limitations in the model. First, the recovery rate is dependent upon a DCP calculated for the entire exercise duration. Second, the mathematical model allows for a negative balance of AWC [16]. A negative balance of AWC could be due to the standard deviations associated with CP and AWC. However, it would mean that the athlete is drawing more from their AWC stores than they did during the baseline CP testing. Additionally, the integral term of Equation (2) results in Joules-second and this does not match with the units of AWC in Joules. Finally, there are two versions of Equation (2) [15,16].

3. Hypothesized Model of Recovery and Expenditure

The model presented in this research is based on the relationship shown in Equation (1) for the expenditure of AWC. Equation (1) is modified to reflect both expenditure and recovery of AWC as,
Δ W A n = { P ( t ) C P } t
where, ΔWAn is a change in energy or an amount of work expended or recovered from a single duration of exertion or recovery, P is the power level operated at for an expenditure interval, CP is the Critical Power of the subject, and t is the time of the expenditure interval.
To model a specific power level, β(t) is defined as a percent of Critical Power:
β ( t ) = P ( t ) C P
With this relationship, if β is less than 1, the subject is recovering; if β is equal to 1, the subject is at their CP; and if β is greater than 1, the subject is depleting their energy stores. The expenditure/recharge factor, Φ is represented in a piece-wise form as a function of β,
Φ = { i f β ( t ) > 1 , 1 i f β ( t ) = 1 , 0 i f β ( t ) < 1 , f { β ( t ) , t }
Combining Equations (4)–(6) results in the hypothesized model of expenditure and recovery as,
Δ W A n ( t ) = C P { β ( t ) 1 } Φ Δ t
W A n , B a l = A W C i = 1 n Δ W A n i

4. Materials and Methods

4.1. Participants

Nine recreationally active subjects (8 male, 1 female aged 23–44) voluntarily participated in the study. An informed consent form and a health survey were signed and submitted by each participant before testing began. The subjects were instructed to avoid strenuous exercise 24 h before each test and to arrive well-hydrated and well-rested. It was suggested that they have a carbohydrate-rich snack (e.g., a gel-pack or a banana) about an hour before testing and to avoid caffeine for at least 3 h before testing. All tests were performed under the compliance of Clemson University IRB2016-169.

4.2. Equipment and Data Collection

The 3-min all out test and 8 interval tests were conducted on a system comprising of a CompuTrainer cycling trainer with Racermate software, a BSX Insight muscle oxygenation (SmO2) sensor, and a Garmin Heart Rate monitor. The CompuTrainer system includes a cadence sensor which reads to the control panel. Data was analyzed using Microsoft Excel and Minitab.

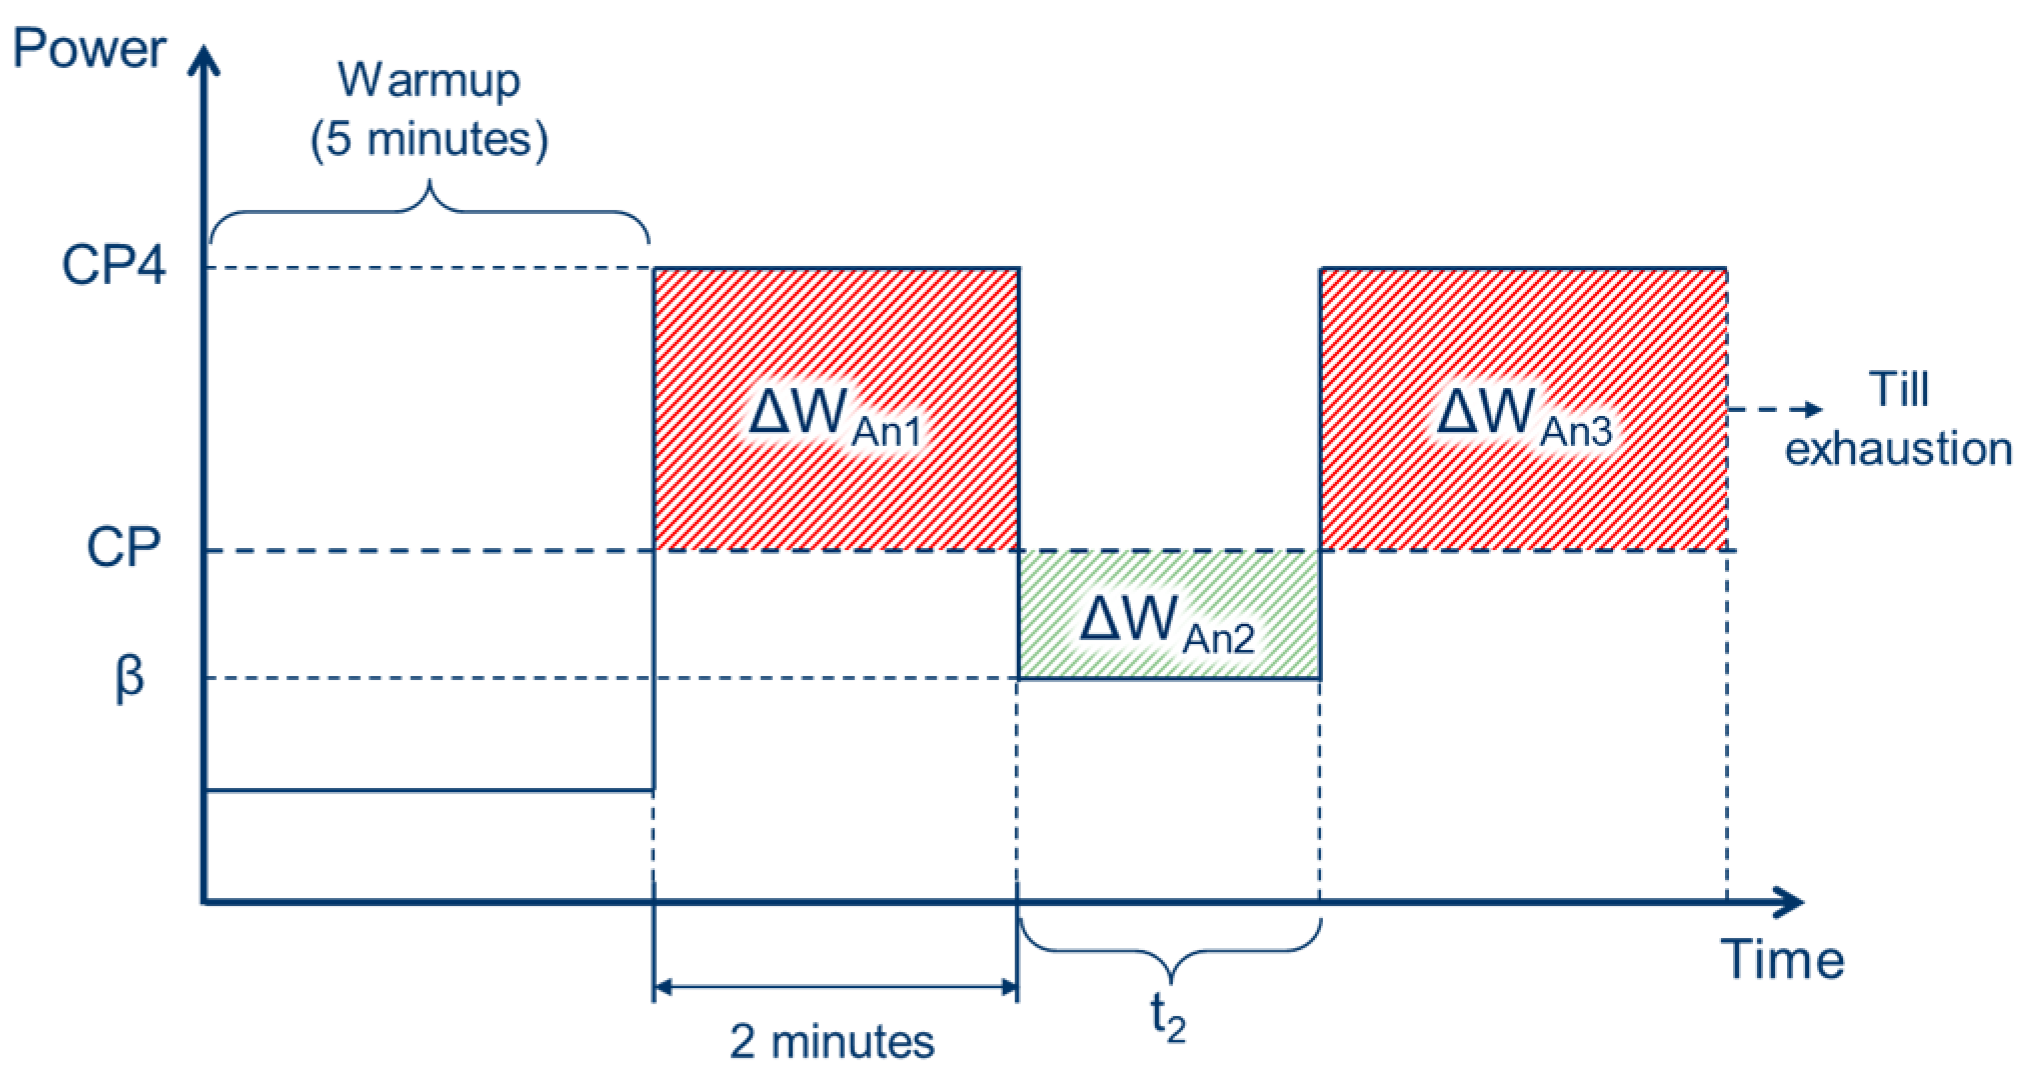
4.3. Experimental Design for Determining Phi, Φ

An experimental protocol (see Figure 1) was set up so that a known amount of AWC was burned, followed by a recovery interval, and then a constant power interval where time to exhaustion was measured. In Figure 1, CP4 refers to the work-rate at which a subject will reach exhaustion in 4 min. From Equation (7), Φ is determined as,
Δ W A n 2 = C P { β ( t ) 1 ) } Φ t 2 = A W C ( Δ W A n 1 + Δ W A n 3 )
Φ = A W C ( Δ W A n 1 + Δ W A n 3 ) C P ( β 1 ) t 2
Three values of β (50% CP, 75% CP, and 100% CP) and three values of tn (15 s, 30 s, and 60 s) were selected. The combination of β = 50% CP and t2 = 60 s was eliminated because pilot testing indicated complete recovery of AWC. On the first day, the subjects performed a modified version of Vanhatalo’s 3-min all out test. For the following tests, on separate days, the subjects followed the protocol shown in Figure 1. The point of complete depletion of AWC was determined to be the time at which a subject’s preferred cadence fell by >10 rpm for >10 s, despite continued encouragement. The subjects then cooled down until their heart rate and SmO2 values returned to those of resting. The subjects performed two tests each day and the testing days were separated by at least 24 h. Positive encouragement was provided throughout all the tests.

4.4. Determining Critical Power and Anaerobic Work Capacity

The validity of the 3mAOT using CompuTrainer has been documented by Clark and colleagues in [17]. To ensure that the 3mAOT on CompuTrainer was yielding comparable results, the average and standard deviation from Vanhatalo’s 3-min all out test [9] were studied. The subjects were grouped into two categories based on the standard deviation of their CP (see Table 1).
If a subject were to pace themselves during the 3mAOT, their CP and AWC would be miscalculated, which could lead to issues in determining statistical significance in the behavior of Φ. Results from Group 1 are in agreement with the results seen in [9]. Results similar to that of Group 2 can also be seen in 3mAOT performed by inexperienced cyclists as seen in Johnson and colleagues investigation in [12].

5. Results and Discussions

As discussed earlier, isolating a recovery interval is the key to determining Φ for each specific β and recovery time, t2. Using Equation (10), the amount of Anaerobic Work expended in both intervals was calculated as the sum of the Anaerobic Work expended each second:
Δ W A n 1 + Δ W A n 3 = C P { β ( t ) 1 } Φ Δ t
where Δt = 1 s and Φ =1 (expenditure intervals). The value for β was calculated to be the average power across the recovery interval. On some days, the subjects could not hold their CP4 for the 4 min minimally necessary to calculate Φ. This resulted in a negative Φ as it was assumed that the subject started the test with 100% AWC balance. It is possible that these subjects had not fueled in the same way the day before the testing and were not testing at the same initial anaerobic work balance as they were for the all-out test. These data points were not considered for statistical analysis.
An Anderson-Darling test was performed with α = 0.05 (level of significance) to calculate the normality of the data points. The p-value was calculated to be 0.375 and the null-hypothesis that the data follows a normal distribution could not be rejected. A t-test was then carried out to determine the probability of the mean value of Φ being equal to 1 with α = 0.05. For this test, only valid data points from the first testing session of each day were used, to follow the practices found in literature of giving subjects at least 24 h to recover before performing another test. The p-value was determined to be 0.029 (<0.05), indicating that the subjects did not recover AWC at the same rate as they expended their AWC stores. This aligns with the work done by Ferguson and colleagues [14], Skiba and colleagues [15,16], and Chidnok and colleagues [18]. Parallels cannot be drawn to Chidnok’s study as the power levels are based on CP in the study presented here. From the data collected, a regression equation for Φ in terms of β and Δt was determined to be:
Φ = 8.07 + 14.80 β 0.0180 Δ t
Equation (12) does not represent a universal recovery rate for all subjects and cannot be used to determine recovery rates for athletes. An Analysis of Variance (ANOVA) was performed on the regression to determine the probability of the coefficients of β and Δt being equal to zero with α = 0.05 and the p-value was determined to be 0.001. Therefore, it can be said that the regression equation provides a better model than the constant term alone. The ANOVA showed that the coefficient of β was significant (p-value = 0), whereas coefficient of Δt was not significant alone (p-value = 0.524). The recovery factor Φ followed different trends for different subjects. It might be prudent to investigate the recovery of AWC among similar athletes as the participants in this study were recreationally active people pursuing different sports. The results suggest that it might be worthwhile to look at subjects individually rather than as a group. These findings suggest that an optimal control system can be designed with objectives of minimizing race time and complete depletion of AWC by the end of the race. The system would need to be implemented into a human-in-the-loop feedback control system, as there are factors affecting the race day performance that cannot always be accounted for in training. It would be possible to achieve this human-in-the-loop system using a real-time multiple sensor network comprising of a power meter, cadence, GPS, and bike computer. For example, optimal power can be determined based on pre-race planning as well as in-race modifications through feedback control approaches. A cyclist would be prompted to adjust power by accounting for factors such as wind speed, ground conditions, and deviation from the optimal power. This approach can be adapted to optimize distance, efficiency, or time. The findings from this research provide encouraging signs to model the recovery of AWC. The authors are currently conducting tests with a larger participant pool to develop models of individual specific expenditure and recovery and a more generalized model of the population.

6. Conclusions and Future Work

The objective of the work presented in this paper was to understand the underpinnings of recovery of AWC and to model the same in terms of CP. In current literature, the lack of a robust understanding of recovery of AWC was identified. A model is proposed, and experiments were conducted to understand expenditure and recovery. Through the experiments, it was determined that that sub-CP recovery is not equal to above-CP expenditure. A regression equation for rate of recovery of AWC was determined in terms of recovery duration and recovery power. From the regression, it was determined that the amount of AWC recovered is more dependent upon the recovery power level than the time spent in recovery. It was observed that the rate of recovery varied significantly between subjects and hence it is important to look at athlete-specific recovery rates. The findings suggest a human in the loop optimal control system can be designed to optimize performance. Furthermore, AWC balance could be linked to overtraining and injury not only in cycling and running, but other sports involving multiple sprints like football and soccer. Another future research direction would be to determine the effect of power (as % V ˙ O 2 max ) on the value of Φ. This would help in gaining more insights into the relationships between power output and the physiological mechanisms occurring during fatigue.

Acknowledgments

This study was internally funded. No funds were received to cover the costs to publish in open access.

Conflicts of Interest

The authors declare no conflict of interest.

References

  1. Monod, H.; Scherrer, J. The Work Capacity of a Synergic Muscular Group. J. Ergon. 1965, 8, 329–338. [Google Scholar] [CrossRef]
  2. Someya, T.; Bao, Z.; Malliaras, G.G. The rise of plastic bioelectronics. Nature 2016, 540, 379–385. [Google Scholar] [CrossRef] [PubMed]
  3. Hill, A.V. The Physiological Basis of Athletic Records. Nature 1925, 116, 544–548. [Google Scholar] [CrossRef]
  4. Hill, D.W. The criticial power concept. Sports Med. 1993, 16, 237–254. [Google Scholar] [CrossRef] [PubMed]
  5. Gaesser, G.A.; Carnevale, T.J.; Garfinkel, A.; Walter, D.O.; Womack, C.J. Estimation of critical power with nonlinear and linear models. Med. Sci. Sports Exerc. 1995, 27, 1430–1438. [Google Scholar] [CrossRef] [PubMed]
  6. Housh, D.J.; Housh, T.J.; Bauge, S.M. A methodological consideration for the determination of critical power and anaerobic work capacity. Res. Q. Exerc. Sport 1990, 61, 406–409. [Google Scholar] [CrossRef] [PubMed]
  7. Morton, R.H. Critical power test for ramp exercise. Eur. J. Appl. Physiol. Occup. Physiol. 1994, 69, 435–438. [Google Scholar] [CrossRef] [PubMed]
  8. Morton, R.H.; Green, S.; Bishop, D.; Jenkins, D.G. Ramp and constant power trials produce equivalent critical power estimates. Med. Sci. Sports Exerc. 1997, 29, 833–836. [Google Scholar] [CrossRef] [PubMed]
  9. Vanhatalo, A.; Doust, J.H.; Burnley, M. Determination of critical power using a 3-min all-out cycling test. Med. Sci. Sports Exerc. 2007, 39, 548–555. [Google Scholar] [CrossRef] [PubMed]
  10. Clark, I.E.; Murray, S.R.; Pettitt, R.W. Alternative Procedures for the Three-Minute All-Out Exercise Test. J. Strength Cond. Res. 2013, 27, 2104–2112. [Google Scholar] [CrossRef] [PubMed]
  11. Vanhatalo, A.; Doust, J.H.; Burnley, M. Robustness of a 3 min all-out cycling test to manipulations of power profile and cadence in humans. Exp. Physiol. 2008, 93, 383–390. [Google Scholar] [CrossRef] [PubMed]
  12. Johnson, T.M.; Sexton, P.J.; Placek, A.M.; Murray, S.R.; Pettitt, R.W. Reliability analysis of the 3-min all-out exercise test for cycle ergometry. Med. Sci. Sports Exerc. 2011, 43, 2375–2380. [Google Scholar] [CrossRef] [PubMed]
  13. Morton, R.H.; Billat, L.V. The critical power model for intermittent exercise. Eur. J. Appl. Physiol. 2004, 91, 303–307. [Google Scholar] [CrossRef] [PubMed]
  14. Ferguson, C.; Rossiter, H.B.; Whipp, B.J.; Cathcart, A.J.; Murgatroyd, S.R.; Ward, S.A. Effect of recovery duration from prior exhaustive exercise on the parameters of the power-duration relationship. J. Appl. Physiol. 2010, 108, 866–874. [Google Scholar] [CrossRef] [PubMed]
  15. Skiba, P.F.; Chidnok, W.; Vanhatalo, A.; Jones, A.M. Modeling the Expenditure and Reconstitution of Work Capacity above Critical Power. Med. Sci. Sports Exerc. 2012, 44, 1526–1532. [Google Scholar] [CrossRef] [PubMed]
  16. Skiba, P.F.; Clarke, D.; Vanhatalo, A.; Jones, A.M. Validation of a novel intermittent w’model for cycling using field data. Int. J. Sports Physiol. Perform. 2014, 9, 900–904. [Google Scholar] [CrossRef] [PubMed]
  17. Clark, I.E.; Gartner, H.E.; Williams, J.L.; Pettitt, R.W. Validity of the 3-Minute All-Out Exercise Test on the CompuTrainer. J. Strength Cond. Res. 2016, 30, 825–829. [Google Scholar] [CrossRef] [PubMed]
  18. Chidnok, W.; Dimenna, F.J.; Bailey, S.J.; Vanhatalo, A.; Morton, R.H.; Wilkerson, D.P.; Jones, A.M. Exercise tolerance in intermittent cycling: Application of the critical power concept. Med. Sci. Sports Exerc. 2012, 44, 966–976. [Google Scholar] [CrossRef] [PubMed]
Figure 1. Visual Representation of Experimental Protocol.
Proceedings 02 00219 g001
Table 1. Average and standard deviation of final 30 s of 3-min test.
Group 1Group 2
SubjectCritical Power (W) (Mean ± SD)SubjectCritical Power (W) (Mean ± SD)
C7187 ± 5.6C11160 ± 13.6
C4236 ± 6.6C2119 ± 14.7
C1165 ± 8.2C12102 ± 23.8
C8236 ± 10.8C3135 ± 17.7
C10186 ± 11.5
Average202 ± 8.5 129 ± 17.5
Publisher’s Note: MDPI stays neutral with regard to jurisdictional claims in published maps and institutional affiliations.

