1. Introduction
Tibial stress fractures are common overuse injuries among runners [
1]. Tibial stress fractures can cause significant disruption to training, a reduction in physical fitness as well as increased psychological distress [
2]. An earlier prospective study [
3] suggests that increased tibial acceleration during the loading phase in running is related to tibial stress fractures and could therefore be an important risk factor for injury. Interventions focusing on decreasing tibial acceleration could help to reduce the prevalence of this injury and aid rehabilitation in the running population.
Biofeedback has previously been used to help runners reduce their tibial accelerations. In recent studies [
4,
5,
6] participants were asked to run on a treadmill while receiving feedback on tibial acceleration. All studies found beneficial effects of feedback in decreasing tibial acceleration within one session. One study [
4] found a beneficial effect was retained after a week, but none focused on the time participants took to modify tibial acceleration in response to real-time feedback within the feedback session. The time participants take to modify tibial acceleration and the strategies they use could be of interest to receive a better insight into how long feedback should be given to participants to allow them to respond accordingly.
The aim of this exploratory study was, therefore to identify the time participants took to modify tibial acceleration in response to feedback on tibial acceleration. We further wanted to confirm the short term retention effect of feedback on tibial acceleration.
2. Methods
2.1. Participants
Following institutional ethical approval, six runners were recruited for the study (4 female, 2 male; 28 ± 3.0 years; height: 1.69 ± 0.10 m; mass: 68 ± 9.3 kg). All participants ran at least once a week and were injury free at the time of testing. Participants completed a pre-screening questionnaire and provided written informed consent before participating in the study.
2.2. Study Design
An overview of the testing schedule can be seen in
Table 1. Participants’ preferred running speed was determined on the first day and kept constant through all trials. Determining their preferred running speed was based on the methods of Hamill et al. [
7]. To which, whilst running on a treadmill, participants increased and decreased the speed until a comfortable speed was found and could successfully identify the same speed (less than 0.5 m/s difference)on three successive runs. After warming up and taking baseline measurements on the first day, the participants received the instruction to change peak tibial acceleration by landing softer and to remain underneath or as close as possible to the target which was set for them (see
Section 2.3 for further explanation) during the feedback condition. The first day finished with a 10 min retention test where participants were asked to run without further instructions. Finally participants were interviewed on their experience of running with feedback. Questions included whether it was easy to reach the target and if not how that made them feel, whether the preferred running speed was ok and finally whether they had any further comments. These answers were written down in a measurement log. For all three days participants completed a six minute warm up to familiarise themselves to running on a treadmill [
8]. On the subsequent days the participants performed a retention test after the warm up. On the first day, participants were given a rest period between the baseline condition and the feedback condition and between the feedback condition and the retention test. During the rest period between the baseline condition and the feedback condition, the mean peak tibial acceleration value and target value were calculated. On the subsequent days participants run for 16 min without rest.
2.3. System
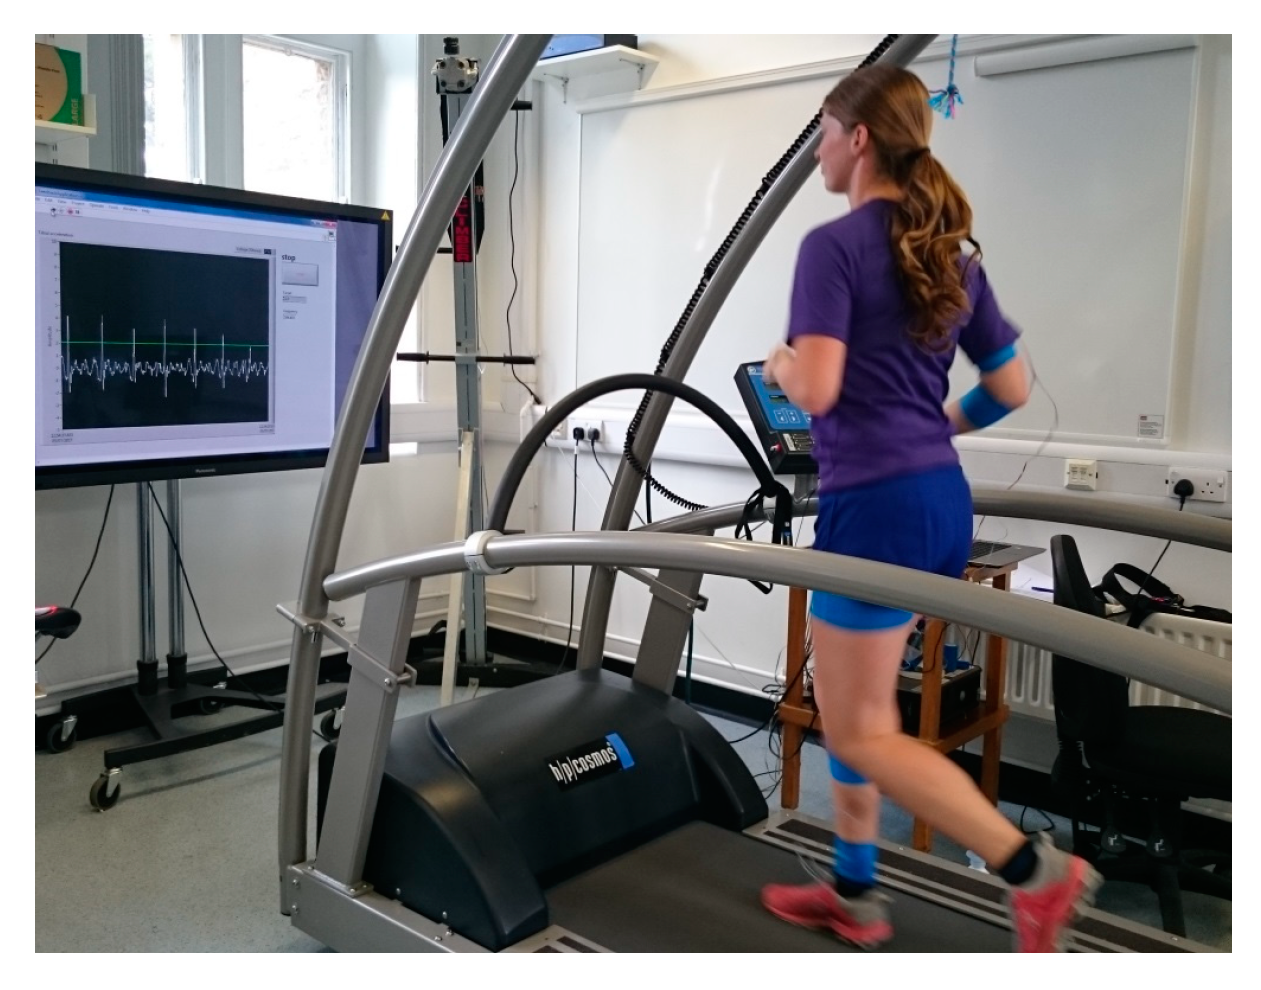
Tibial acceleration was measured using a research grade uniaxial accelerometer (PCB Piezotronics, Stevenage, UK, Model: 352C22), the sensitive axis of which was visually aligned with the long axis of the right tibia. The accelerometer was mounted on a small piece of themoplastic (total mass: 1.65 g) which was attached with double sided tape to the antero-medial aspect of the right tibia, 5 cm above the medial malleolus [
9]. The accelerometer was connected via a wire to a PCB signal conditioner (PCB Piezotronics, Stevenage, UK, model: 480E09; gain = 10) and sampled at 1000 Hz.
The data were processed in custom programs written in LabVIEW™ (National Instruments, Austin, TX, USA) and Matlab (Mathworks, Natick, MA, USA, R2016a). In both programs the acceleration data was filtered at 50 Hz with a 4th order Butterworth filter, after which the offset was removed. All feedback was generated in LabVIEW™ (National Instruments, Austin, TX, USA). Visual feedback consisted of the signal shown on a screen, together with the target line (
Figure 1). If participants failed to reach the target they heard a sound and felt a vibration scaled to the error, where a higher pitched sound and more intense vibration occurred as the value increased above the target. The vibration was applied on the wrist by a vibration motor (Precision Microdrives, London, UK, model: 307-103). Matlab was used for calculations of mean peak tibial acceleration after the conditions and the fiftieth percentile of peak positive tibial acceleration. The fiftieth percentile of peak positive tibial acceleration from the baseline condition was set as a target in the feedback condition [
2,
5].
2.4. Outcome Measures
To identify the time it took participants to change tibial acceleration, the start of a plateau was identified. After the signal for each feedback trial was smoothed by using a moving average filter with a window of 31 samples, a plateau was determined at the first point the data were between two standard deviations of the mean of the final 100 steps of the condition. To detect the short-term learning effect of feedback for each participant, the mean peak tibial acceleration of the final 20 steps of each condition was calculated and compared to the baseline condition within a participant.
2.5. Data Analyses
Since participants were expected to respond differently to feedback, a typical statistical analysis of group data might have masked individual changes. Therefore, a single-subject analysis was used to characterise the learning effects [
10]. In a single-subject analysis each step is seen as trial data, instead of each participant, so the final twenty steps of each condition within one participant were compared. In addition, each trial in a single-subject analysis is considered to be independent. This assumption of independence was evaluated using autocorrelation [
10]. After which a one-way analysis of variance (ANOVA) was performed. To find differences between the baseline condition and the other conditions, post-hoc tests were performed with a Tukey HSD correction. The level of significance for all statistical calculations was set at 0.05. The calculations were made using SPSS, version 24 (SPSS, Inc., Chicago, IL, USA). Effect sizes were calculated with the use of Cohen’s D. The data from the interviews were recorded in a spreadsheet.
3. Results
Six participants completed all five conditions. Participants ran at a mean speed of 10.2 km h−1 with a range of: 8.6–12.3 km h−1. The mean feedback target was set at 2.8 g with a range of: 1.8–3.6 g.
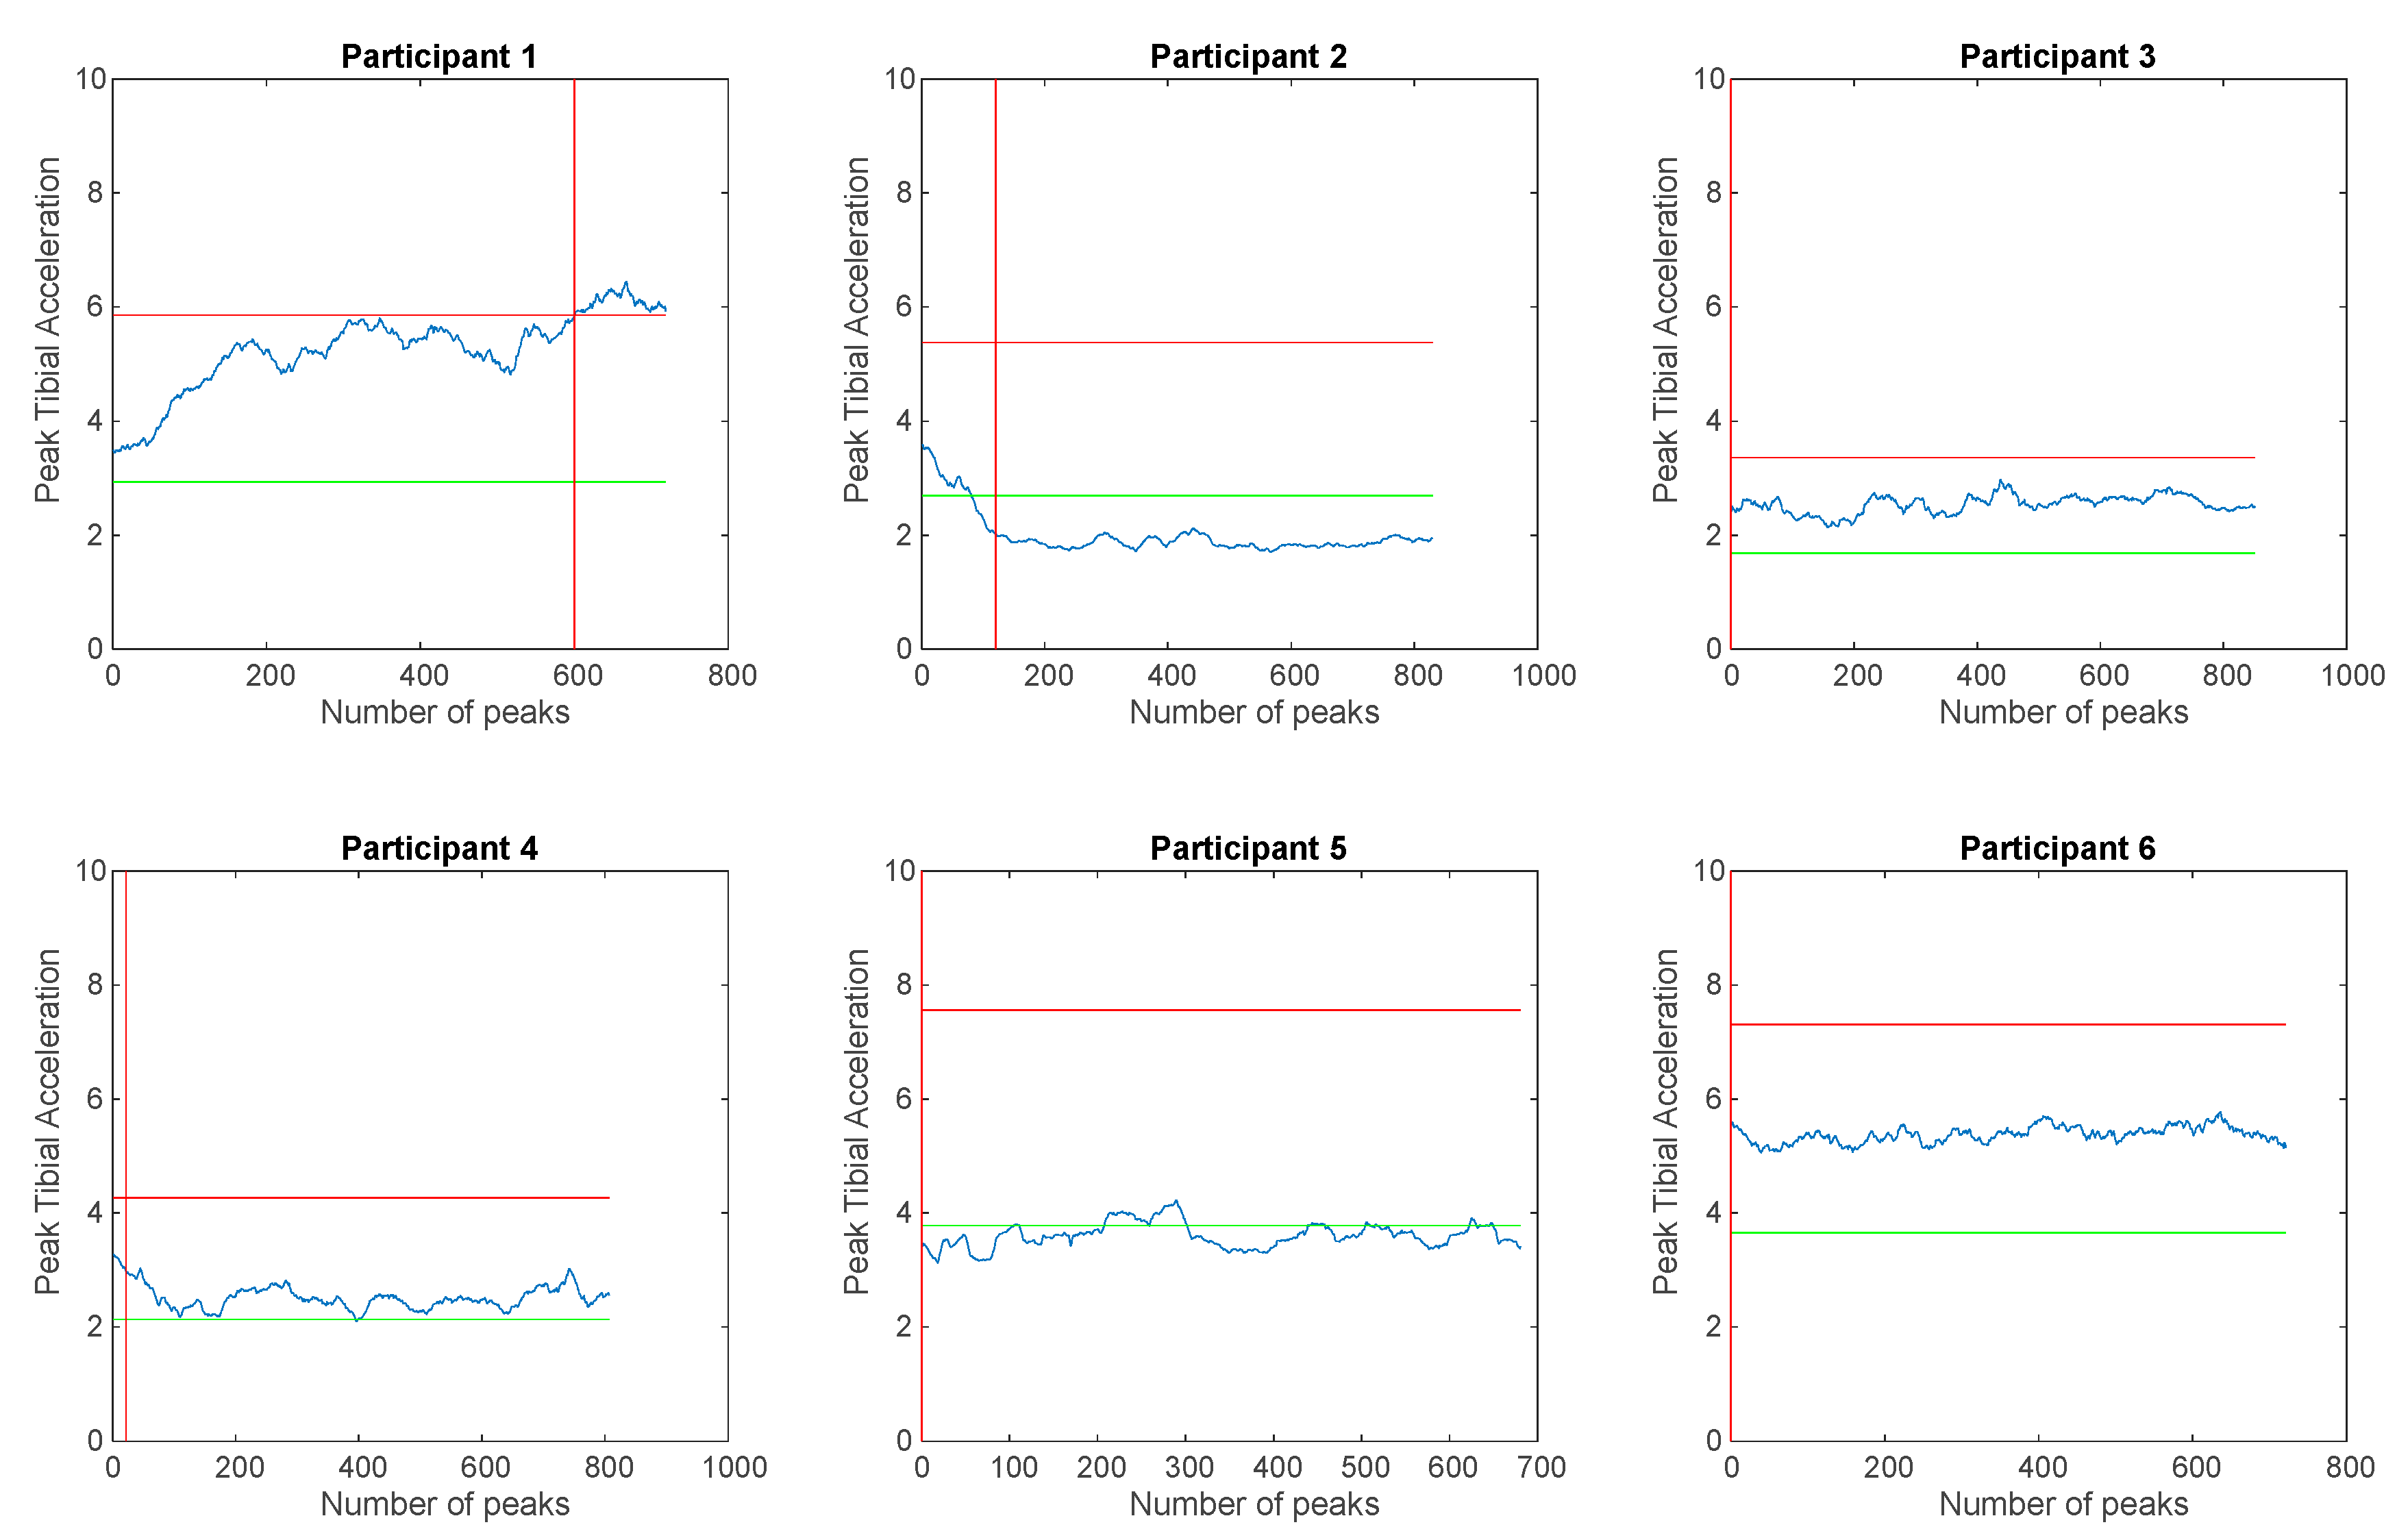
All participants changed peak tibial acceleration within the first step of running in the feedback condition (
Figure 2). Two participants further decreased peak tibial acceleration to reach a plateau after 120 (86 s) and 20 steps (14 s). Peak tibial acceleration remained within two standard deviations for three participants and increased for one participant, plateauing after 600 steps (465 s).
Participants both at the lower (participant 3,
Figure 3) and higher end (participant 5,
Figure 3) of the range of mean peak tibial acceleration of the baseline condition were able to significantly decrease peak tibial acceleration during the feedback session and maintain that significant decrease after a week.
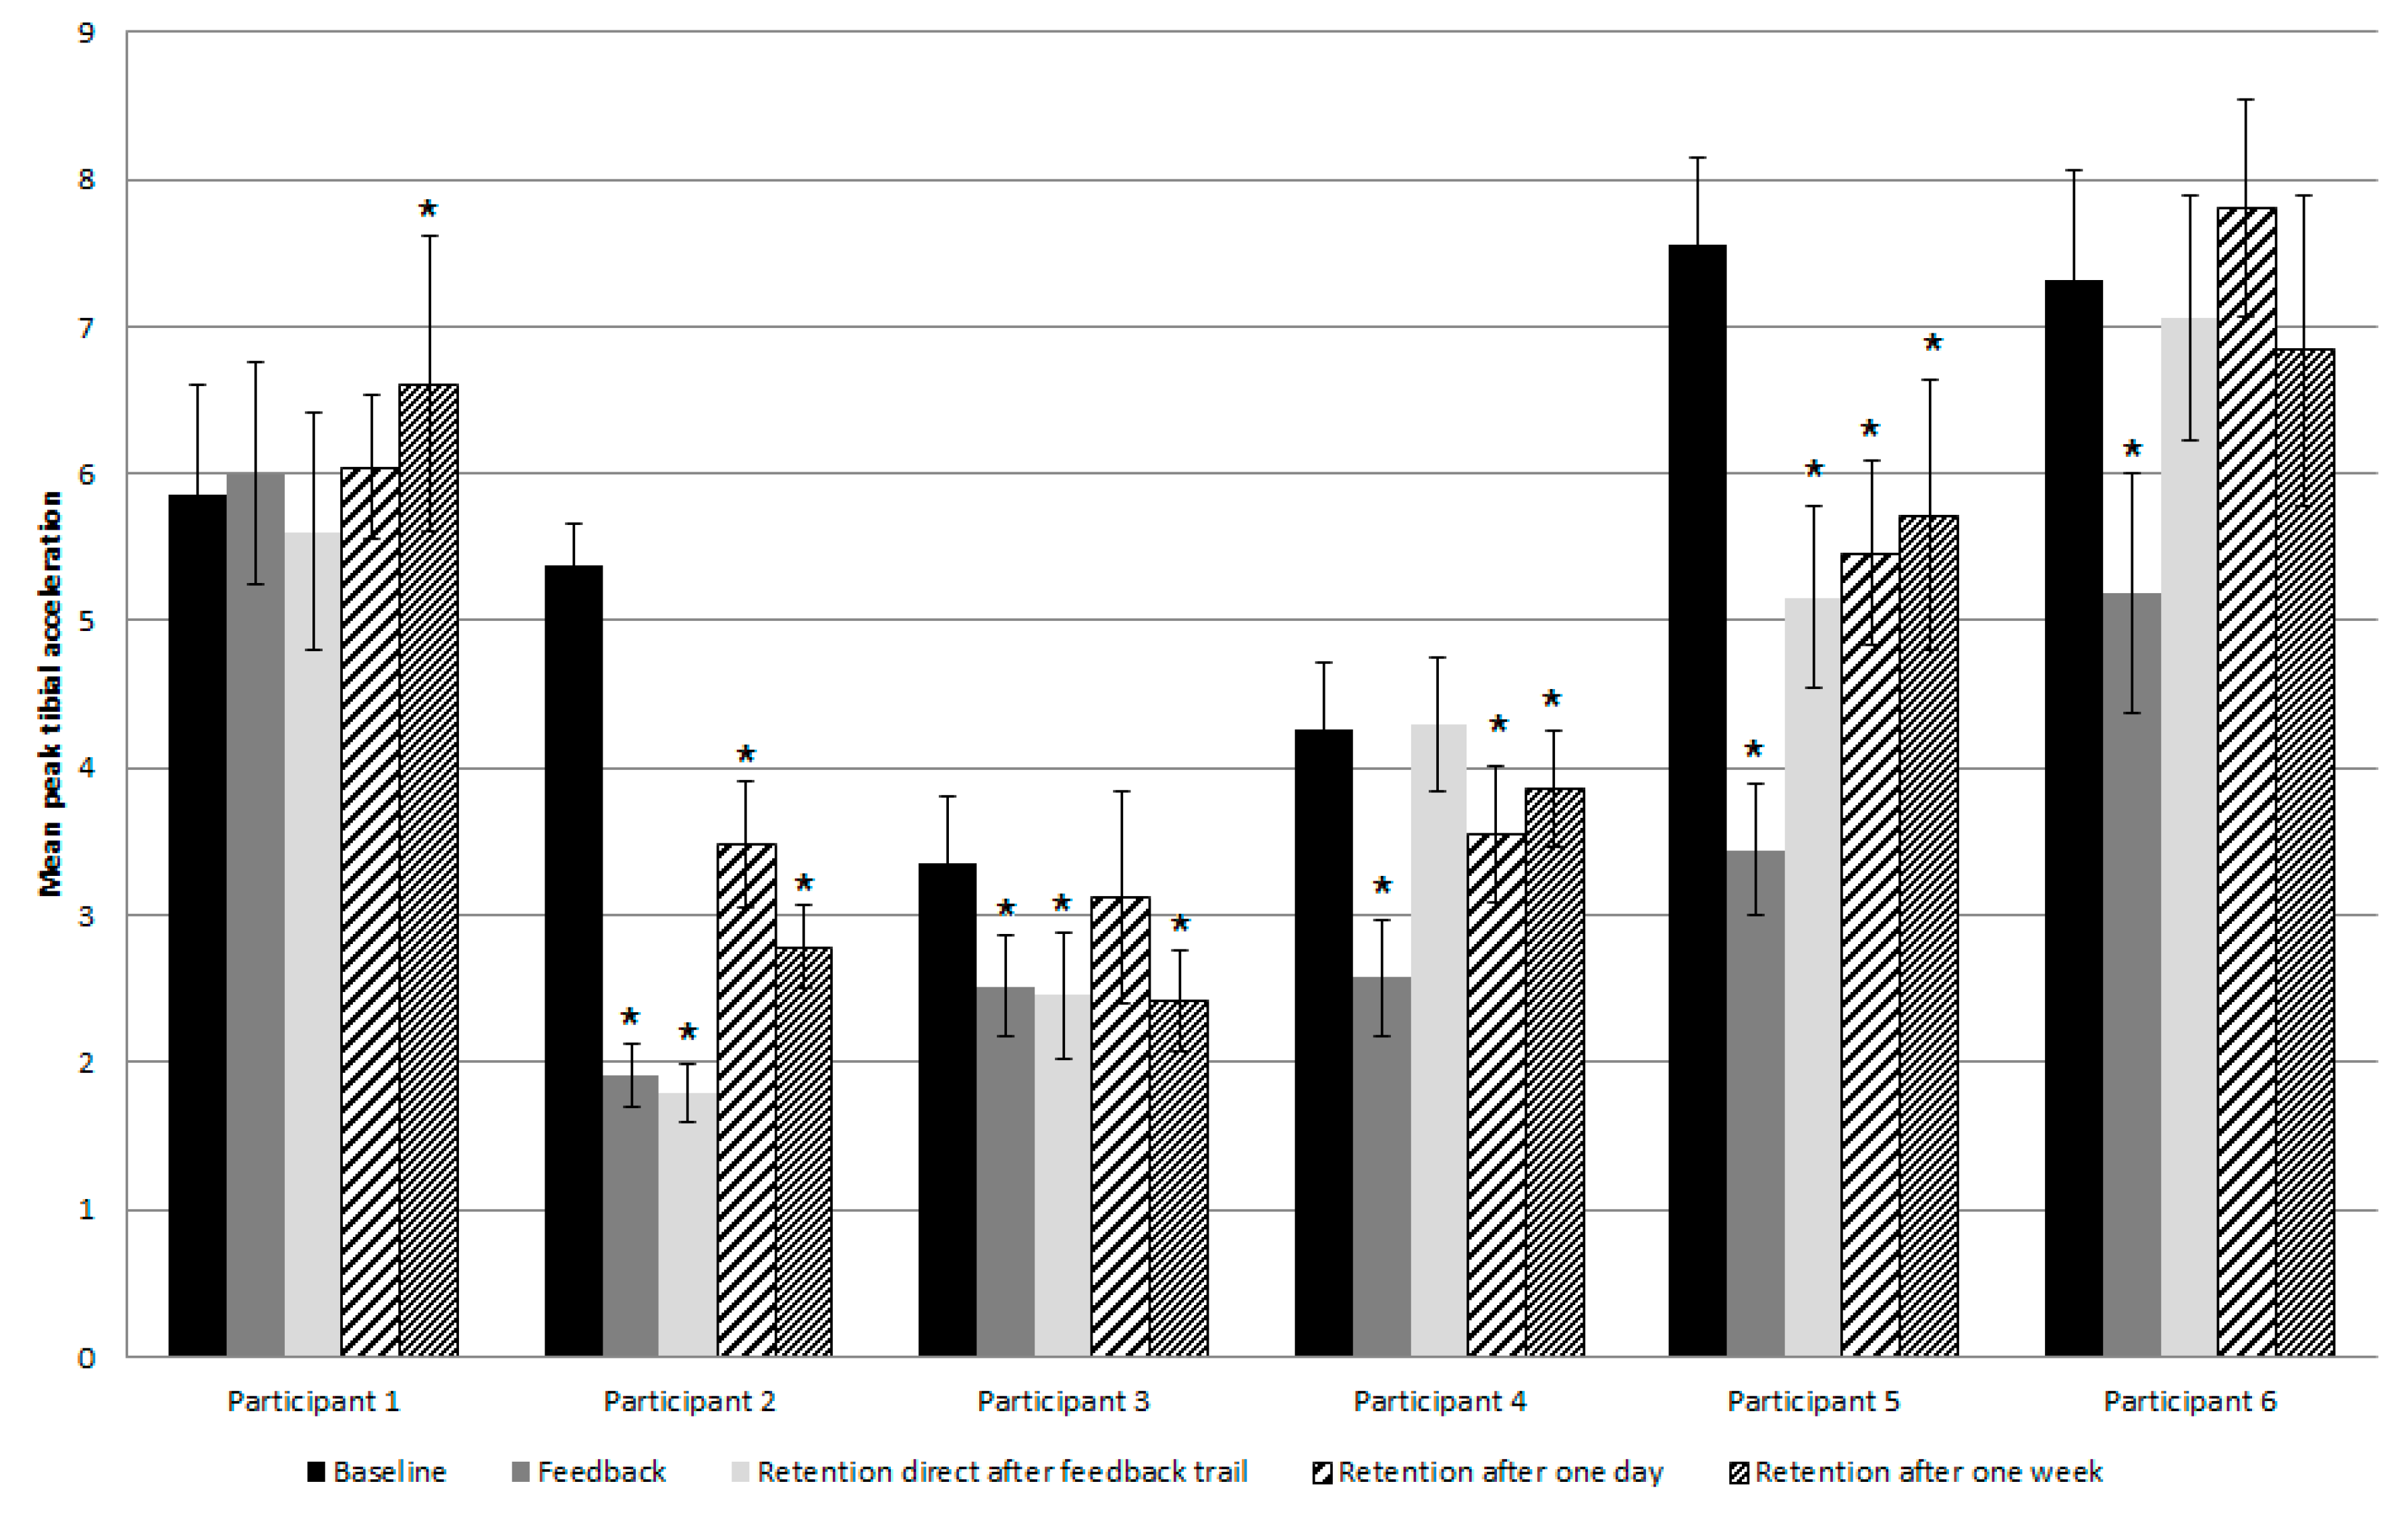
Mean peak tibial acceleration values of the final 20 steps of each condition can be found in
Figure 3. Participant 1 was the only participant who was unable to respond to the feedback with a decrease in tibial acceleration. Instead, a non-significant increase was found in mean peak tibial acceleration during the feedback condition, retention after one day and a significant increase was seen for retention after a week when compared to the baseline condition. A large negative effect of feedback on tibial acceleration was found for the retention test after a week (d = −1.00).
Two participants (2 and 5) significantly decreased mean peak tibial acceleration for all conditions compared to baseline. Further, Cohen’s d effect size values suggested that there was a large effect of feedback on tibial acceleration for all conditions for both participants 2 and 5 (Cohen’s D variating between d = 3.09 and d = 13.15).
Compared to the baseline condition, participant 3 significantly decreased mean peak tibial acceleration for the feedback condition, the retention test directly after the feedback condition and the retention test after a week. For all these conditions, large effect sizes were found (respectively d = 1.89, d = 2.03, d = 2.12). No significant difference was found between baseline mean peak tibial acceleration values and mean peak tibial acceleration values measured after one day.
Participant 4 significantly reduced mean peak tibial acceleration during the feedback condition and during the retention test recorded after one day and after a week compared to the baseline condition, all with a large effect size (respectively d = 3.74, d = 1.59 and d = 0.91). Mean peak tibial acceleration was increased in the retention test directly after the feedback condition.
Participant 6 significantly changed mean peak tibial acceleration during the feedback condition compared to the baseline condition and a large effect of feedback on tibial acceleration was also seen for this condition (d = 2.81). No significant differences were found in mean peak tibial acceleration between baseline values and the values found in the retention tests directly after the feedback condition, one day after the feedback condition and one week after the feedback condition.
In the interviews, four participants (participant 1, 3, 4 and 6) declared they found it difficult to reach the target. Participant 1 felt disappointed at not being able to reach the target and participant 4 got frustrated and felt they were being punished the whole time. While participants used different running patterns to change tibial acceleration, participant 3 ran in a squated position and found it hard to remain in this position and participant 6 believed that even though the target was hard to reach, the feedback helped. All participants felt the preferred running speed was right for them.
4. Discussion
The purpose of this study was to identify the time participants took to modify tibial acceleration in response to multisensory feedback on tibial acceleration. We further wanted to confirm the short term retention effect of feedback. Participants changed peak tibial acceleration within the first step of running and five of the six participants significantly decreased mean peak tibial acceleration in the feedback condition. Four participants maintained this significant decrease in mean peak tibial acceleration after one week.
The results found are in line with Creaby et al. [
4] and Wood and Kipp [
6] who also measured the effect of feedback on tibial acceleration in healthy participants. In all studies there was a trend towards decreased mean peak tibial acceleration in all conditions compared to the baseline, but the largest decrease was found in the feedback condition. Creaby et al. [
4] found a decrease of 28% in peak tibial accelereation in the feedback condition, Wood and Kipp [
6] found a decrease of 10% while the current research found a decrease of 36%.
Unlike previous studies [
4,
5,
6], we focused on the initial phase of learning. Results indicated that in this initial phase of learning all participants directly changed peak tibial acceleration within the first step of running in the feedback condition. The instruction to change peak tibial acceleration by landing softer might therefore be enough to effect change and biofeedback might not be needed. Creaby et al. [
4] support this statement, finding no difference in decrease between participants who received tibial accelerometry feedback versus clinician guided feedback. However, in the current research, two participants seem to have found an extra benefit from the feedback by further reducing peak tibial acceleration over time and reaching a plateau within 1.5 min. Further research with a control group who only receive the instruction to reduce peak tibial acceleration could give a better insight into the effect of biofeedback.
One participant was unable to decrease mean peak tibial acceleration during the feedback condition. Even though the participant did decrease tibial acceleration in the first few steps of the feedback condition, the participant was not able to continue this decrease and even increased in peak tibial acceleration compared to the baseline condition. In the interview the participant highlighted that they experienced a lack of motivation because of being unable to reach the target. Future research could focus on counteracting this effect by changing the target during the feedback condition according to the performance of the participant.
The participants only received one feedback session, which could be a limitation. Beneficial outcomes could be related to the duration of the intervention and therefore the duration of the training is important [
11]. However, in this research we did find that participants were able to decrease mean peak tibial acceleration even after only receiving one feedback session. Another limitation relates to the lack of a longer term retention test. Further, no kinematic and electromyography data were captured which could give a better insight in different strategies participants used to change their running patterns and to see whether they reached a stable pattern.
5. Conclusions
Participants responded differently to real-time feedback on tibial acceleration while running. All participants directly changed their gait pattern within one step in the feedback condition and two participants decreased peak tibial acceleration until a plateau was reached. Five out of the six participants were able to reduce peak tibial acceleration during the feedback trial. Further research should focus on the effect of feedback itself compared to verbal instructions, changing the target during the feedback condition according to the performance of the participant, long term retention tests and the collection of kinematic and electromyography data. In conclusion, this research gives promising results for the use of biofeedback to reduce tibial acceleration but more research is needed to optimise its use in helping to reduce the prevalence of tibial stress fractures.


