Robust and Adaptive Signal Segmentation for Structural Monitoring Using Autonomous Agents †


1
Department of Mathematics & Computer Science, University of Bremen, Robert Hooke Str. 5, 28359 Bremen, Germany
2
Fibre Institute Bremen, Simulation/Structuremechanics (SIM), Am Biologischen Garten 2, 28359 Bremen, Germany
3
German Aerospace Center (DLR), Institute of Composite Structures and Adaptive Systems, Lilienthalplatz 7, 38108 Braunschweig, Germany
*
Author to whom correspondence should be addressed.
†
Presented at the 4th International Electronic Conference on Sensors and Applications, 15–30 November 2017; Available online: https://sciforum.net/conference/ecsa-4.
Proceedings 2018, 2(3), 105; https://doi.org/10.3390/ecsa-4-04917
Published: 14 November 2017
(This article belongs to the Proceedings of The 4th International Electronic Conference on Sensors and Applications)
Abstract
:Monitoring of mechanical structures is a Big Data challenge and includes Structural Health Monitoring (SHM) and Non-destructive Testing (NDT). The sensor data produced by common measuring techniques, e.g., guided wave propagation analysis, is characterized by a high dimensionality in the temporal and spatial domain. There are off- and on-line methods applied at maintenance- or run-time, respectively. On-line methods (SHM) usually are constrained by low-resource processing platforms, sensor noise, unreliability, and real-time operation requiring advanced and efficient sensor data processing. Commonly, structural monitoring is a task that maps high-dimensional input data on low-dimensional output data (information, which is feature extraction), e.g., in the simplest case a Boolean output variable “Damaged”. Machine Learning (ML), e.g., supervised learning, can be used to derive such a mapping function. But ML quality and performance depends strongly on the input data size. Therefore, adaptive and reliable input data reduction (that is feature selection) is required at the first layer of an automatic structural monitoring system. Assuming some kind of two-dimensional sensor data (or n-dimensional data in general), image segmentation can be used to identify Regions of Interest (ROI), e.g., of wave propagation fields. Wave propagation in materials underlie reflections that must be distinguished, especially in hybrid materials (e.g., combining metal and fibre-plastic composites) there are complex wave propagation fields. The image segmentation is one of the most crucial parts of image processing. Major difficulties in image segmentation are noise and the differing homogeneity (fuzziness and signal gradients) of regions, complicating the definition of suitable threshold conditions for the edge detection or region splitting/clustering. Many traditional image segmentation algorithms are constrained by this issue. Artificial Intelligence can aid to overcome this limitation by using autonomous agents as an adaptive and self-organizing software architecture, presented in this work. Using a collection of co-operating agents decomposes a large and complex problem in smaller and simpler problems with a Divide-and-Conquer approach. Related to the image segmentation scenario, agents are working mostly autonomous (de-coupled) on dynamically bounded data from different regions of a signal or an image (i.e., distributed with simulated mobility), adapted to the locality, being reliable and less sensitive to noisy sensor data. In this work, self-organizing agents perform segmentation. They are evaluated with measured high-dimensional data from piezo-electric acusto-ultrasonic sensors recording the wave propagation in plate-like structures. Commonly, SHM deploys only a small set of sensors and actuators at static positions delivering only a few temporal resolved sensor signals (1D), whereas NDT methods additionally can use spatial scanning to create images of wave signals (2D). Both one-dimensional temporal and two-dimensional spatial segmentation are considered to find characteristic ROI.
1. Introduction
Monitoring of mechanical structures is a Big Data challenge that addresses Structural Health Monitoring (SHM) as well as Non-destructive Testing (NDT) methods. Trends poses the integration of sensor networks towards the design of self-aware structures, increasing the sensor density significantly and increasing the complexity of applications [1,2]. The sensor data produced by common measuring techniques, e.g., guided wave propagation analysis, is characterized by a high dimensionality of data in the temporal and spatial domain. There are off- and on-line methods applied at maintenance- or run-time, respectively. On-line methods (SHM) usually are constrained by low-resource processing platforms, sensor noise, unreliability, and real-time operation requiring advanced and efficient sensor data processing [3]. Commonly, structural monitoring is a task that maps high-dimensional input data on low-dimensional output data (information that is feature extraction), e.g., in the simplest case a Boolean output variable “Damaged”. Machine Learning (ML), e.g., supervised learning, can be used to derive such a mapping function, and reinforcement learning or unsupervised learning (clustering) can be used to improve information extraction. Numerical analysis of measuring data as well as ML quality and performance depends strongly on the input data size and feature variable selection (quality). Therefore, adaptive and reliable input data reduction (that is feature selection) is required on the first layer of an automatic structural monitoring system (regardless if it applied at run- or maintenance time).
Assuming some kind of one- or two-dimensional sensor data (or n-dimensional data in general), image segmentation can be used to identify Regions of Interest (ROI), e.g., of wave propagation signals and fields. A ROI is characterized by its relevance for further data processing, and can be recognized by specific patterns or by heuristic knowledge (e.g., the third wave of a recorded ultrasonic signal delivers information about a damage that is demonstrated in the experimental section). Wave propagation in materials underlie reflections that must be distinguished, especially in hybrid materials (e.g., combining metal and fibre-plastic composites) there are complex wave propagation fields. The image segmentation is one of the most crucial parts of image processing [4]. Commonly used approaches are edge detection by finding abrupt changes in the signal field suffering from a high sensitivity to noise and inhomogenities [5].
General difficulties in image segmentation are noise and the differing homogeneity (fuzziness and signal gradients) of regions, complicating the definition of suitable threshold conditions for the edge detection or region splitting/clustering. Many traditional image segmentation algorithms are constrained by this issue. Artificial Intelligence can aid to overcome this limitation by using autonomous agents as an adaptive and self-organizing software architecture, presented in this work. Using a collection of co-operating agents decomposes a large and complex problem in smaller and simpler problems with a Divide-and-Conquer approach. Related to the image segmentation scenario, agents are working mostly autonomous (de-coupled) on dynamic bounded data from different regions of an image (i.e., distributed with simulated mobility), adapted to the locality, being reliable and less sensitive to noisy sensor data. Agent-based approaches can be used to enhance classical edge-based approaches, e.g., applying edge regularization using Bayesian methods [5]. A review of agent-based image segmentation approaches can be found in [4]. Applying artificial intelligence approaches using autonomous agents and data marking to edge detection, clustering, and region growing was introduced in [6], featuring reduced computational costs and a wide application field (due to its self-adaptation feature). Random behaviour can aid finding regions and clusters more accurately, efficiently, and faster [7]. This technique is applied in this work to (virtual) agent migration decisions.
In this work, a simple but powerful agent-based segmentation approach is introduced and evaluated with measured high-dimensional data from piezo-electric acusto-ultrasonic sensors that recorded stimulated wave propagation in plate-like structures. Commonly, SHM deploys only a small set of sensors and actuators at static positions delivering only a few spatially resolved sensor signals (1D), but with high temporal resolution, whereas NDT methods additionally can use spatial scanning to create images of wave signals (2D). Both one-dimensional temporal and two-dimensional spatial segmentation is considered to find characteristic ROIs automatically.
2. Non-Destructive Test (NDT) of Structures
The two-dimensional recording of the wave propagation and interaction of guided waves can be performed by using laser vibrometry [8,9] or an airborne ultrasonic testing technique [10]. In order to be able to excite guided waves, an actuator, usually made of piezo-ceramic materials, must be applied to the structure. By adjusting the geometry of the actuator [11] or its electrode configuration [12], the amplitudes of individual modes can be amplified or attenuated to emphasize specific wave interaction. The identification of damages is made by wave interactions, such as reflection, scattering, mode conversion and wave number changes, in wave propagation.
At delaminations or thickness changes these wave interactions can be determined using wave number spectroscopy (2D-FFT of the wave propagation) [13]. However, these methods require a locally resolved scan of the wave propagation, producing wave propagation images with only a few regions of interest. The entire measuring setup and the synopsis with this work performing feature selection and extraction is shown in Figure 1.
A locally resolved segmentation and clustering of sensors and their sensory data as a precursor of SHM and ML methods have so far only been inadequately addressed, but it is an important sensor fusion and feature selection instrument. Here we analyze the wave propagation and interaction using air-ultrasound technology and identify features to the damage interaction of different modes in the time and wave number domain.
3. Image and Signal Segmentation
Image segmentation is a method to divide an image in different regions (clusters) to identify regions of interest, i.e., isolating regions for further processing (feature extraction). In a signal processing system this is the first important feature variable selection (considering each pixel of an image as variable), e.g., using this reduced variable set as an input vector for Machine Learning. In this work, one-dimensional vectors retrieved from time-resolved ultrasonic wave measurement are used for segmentation tasks. The goal is to detect the relevant signal region used for further damage detection and analysis.
4. The Multi-Agent System with Self-Organization and Adaptation
The Multi-agent System (MAS) consists of simple agents with different behaviour. The signal segmentation algorithm bases on an event-based divide-and-conquer approach, shown in Figure 2. Details of the underlying agent behaviour and programming model can be found in [3]. The time-resolved signal vector x(t) is reduced to a segment vector s(n) by using a data filter algorithm (peak, or arithmetic mean, or exponential mean). Each data segment is handled by a segment agent, instantiated by a master agent. A segment agent can create explorer agents to investigate the segment neighbourhood within a given radius. Agents communicate with each other by using signals (lightweight messages). The segment and explorer agents perform the feature variable selection, and the master agent finally performs the feature information extraction delivering ROIs of the signal input vector.
The summary of the behaviour of the different agents is listed below:
- Master Agent
- The master agent controls the divide-and-conquer process and instantiates segment agents (one for each signal data segment). The master agent transforms the input signal vector to a segment vector of fixed length. Each time a new data set is loaded, the segment agents are notified by sending a LOAD signal.
- The master agent collect all markings from marked data cells and computes ROIs (by using its gap and roiXX parameters, see below).
- Segment Worker Agent
- Each segment agent is responsible for one data cell and performs a check for a data event if it got a LOAD signal, that means, if there is a significant change in its associated cell data value. If an event was detected, an initial explorer agent is created. An explorer agent is created with a specific set of parameters, which can be adapted by the master agent and the segment agent. The segment agent communicates with its explorer child agents and with its master agent via signals.
- Explorer Agent
- The explorer agent has the goal to collect data from the current left and right side neighbourhood within a given radius. The neighbourhood data values are compared with the current associated data value (difference |s(i ± δ)-s(i)| with δ = {−r, …, −1, 1, …, r}), and differences lying within a given interval are counted. If the counter lies within another given interval {ηmin, …, ηmax}, the explorer marks the cell and reproduces itself. The clone migrates virtually to another neighbour cell (left or right side). If the counter values is outside of the interval, it migrates (virtually) to another neighbour cell, performing the exploration again. If random walk is enabled, the diffusion and reproduction direction are chosen randomly, otherwise always one more agent is instantiated on diffusion (opposite direction) and two agents are reproduced (moving in opposite directions).
The explorer agent parameter set consists of the following variables: {i, ∆, ηmin, ηmax, r, lifetime τ, decay δ, randomwalk ρ}. The segment agent is parameterized by: {threshold ζ}. The master agent is parameterized by the set: {gap, roiMin, roiMax, roiWeightMin, roiWeightMax}. A signal segmentation and ROI feature extraction delivers the following output variables (delivered by the master agent) enabling the calculation of a quality measure of the extraction: {agentsTotal, markings, roi, roiWeight}.
Initially there is a pre-defined set of parameters that must be adapted to different signal properties (i.e., sensitivity, noise, signal shape). This is performed by the master agent controlling its worker agents by updating parameter sets via signals (BEHAVIOUR signals).
5. Experimental Ultrasonic Measurement
The experimental setup for guided-wave propagation consists of a digital oscilloscope Tektronix DPO 5054 and an arbitrary signal generator Hewlett Packard HP 33120A connected to a wideband amplifier Falco Systems WMA-300. The input signal is a Hann-windowed 200 kHz sinusoidal burst of three counts.
Figure 3 shows the principle experimental setup delivering the signal vectors used by the MAS and analyzed in Section 6. 512 values of the sensor responses with a time resolution of 8 ns are averaged for the signal vectors. The device under test (DUT) is a hybrid structure consisting of a metal (aluminum) plate and a quasi-isotropic carbon fibre reinforced plastic (CFRP) composite plate. Each plate has a thickness of 4 mm and overall dimensions of 300 mm × 300 mm.
The plates are butt-coupled and an ultrasonic couplant gel is between the coupling edges of the plates. In this way the acoustic interface between the plates is realized by the ultrasonic couplant gel.
Along the vertical axis (side 1–side 3) ultrasonic round piezoelectric wafer active sensors (PWAS) with a thickness of 0.2 mm and a diameter of 10 mm are placed at different positions A–F. The distance between the positions C and D is 150 mm. The distance between the positions C and B is 100 mm. The PWAS are bonded on the plate surface with Z70 cyanoacrylate adhesive. The piezoelectric material of the PWAS is the ceramic lead zirconate titanate (PZT) PIC255 from PI Ceramic GmbH with the notation PRYY+0412.
In the measurements the PWAS at position C is used as actuator (and for some experiments at position D). As sensor for the reflected ultrasonic signal at the interface the PWAS at position B is used. As sensor for the transmitted ultrasonic signal through the interface the PWAS at position D is used. In order to simulate and create definite damages in the interface the ultrasonic couplant gel is removed over definite lengths and positions.
6. Simulation and Analysis
The sensor data recorded in the experiments from Section 5 was used to simulate and evaluate the MAS using the JavaScript Agent Machine (JAM) platform (details can be found in [14]).
Some example results of ROI marking using the MAS are shown in Figure 4. Experiments are made with different DUT configurations: (105) Aluminum only without coupling layer; (108) Hybrid structure C; (110) Hybrid structure D, summarized in Table 2. Furthermore, different MAS parameter sets were investigated. The plots in Figure 4 show the parameter set, the quality of measure variables, the marker plot with respect to the segment, the original down-sampled input data and the segment agents, and finally the temporal development of the agent population. Using random walk behaviour results in the lowest number of required (and created) agents on the order of a decade compared with the non-random walk behaviour (compare plot (a) and (b). Plots (a) and (b) show the original actor excitation signal. Plots (c) and (d) show measured sensor signals containing the relevant first wave group and an indefinite number of delayed signals not used for the damage detection.
The agents were able in all cases to find the relevant main ROI, requiring typically less than 40 explorer agents. The master agent observes the number of created agents (agentsTotal), the number of found ROIs (defined by the markers set by the explorer agents and a gap parameter), and the ROI weight (i.e., the mean width of the ROIs) to compute a quality measure of the self-organizing ROI detection. The higher the number of created explorer agents is, the higher is the number of markings (under the assumption there is the condition satisfied required to detect a region boundary).
The quality Q of the ROI detection computed by the master agent is given by Equation (1).
with #roi as the number of detected ROIs (must be one), roiw as the ROI weight (width, i.e., roi1 − roi0), roi0 and roi1 are the start and end time of the detected ROI, and c0 is the expected center position of the ROI (based on export knowledge), and k is an error weight factor in the range k = [5, 50]. The last term |roi0 + roi1|/2 − c0 is only used for the evaluation of these ROI detection approach in this work, but not used for the on-line quality estimation at run-time (the expected center point of the ROI c0 is unknown).
The first evaluation was performed with signals having a high signal-to-noise ratio (Figure 5a). The parameter sets and the signal data set descriptions can be found in Table 1 and Table 2. The DUT was the aforementioned Aluminum-Composite hybrid structure with an additional gap between the material boundaries. The parameter sets P0 and P1 differ only in their random walk behaviour setting (P0: disabled, replication on successful and not successful marking, P1: enabled, replication only on successful marking). The random walk behaviour requires about 20 times fewer agents, but with comparable quality of the ROI detection in all evaluated data sets! Commonly only about 20 agents are required for a high-quality detection. The choice of appropriate parameter sets with signals having a high signal-to-noise ratio is uncritical. Only P5 is not suitable for the ROI detection of any of the signals due to its low delta and threshold values. The settings of these parameters depend on the overall signal strength and noise.
The second evaluation (Figure 5b) uses signals with a low signal-to-noise ratio making the ROI feature selection more difficult and unreliable. Here is the choice of an appropriate parameter set crucial and parameter values must be chosen from narrow ranges for a specific signal. Only P8 delivers convincible results with all signals except the last one, and P7 for some of the signals. All other parameter settings fail (P0–P5 are not able to trigger the exploration), either without any markings (Q = 0) or with failed markings (Q < 0). As more as the parameter set is unmatched to the signal as higher is the agent creation rate, though this primarily correlates with the delta and threshold parameter values.
7. Conclusions
A self-organizing agent-based approach was used successfully to detect relevant regions in measured ultrasonic wave sensor signals performing a feature selection. The bounded regions are used for further processing in damage detection (feature extraction). The MAS operates event-based and divides the input data vector in segments and is populated with agents operating regionally but cooperating to satisfy a global goal (the feature selection generating ROI markers). The self-organizing and parameterizable behaviour capabilities ensure robust feature extraction. The transfer of the demonstrated feature extraction for one-dimensional signals to spatially distributed sensor images is straightforward. In future work, the parameter sets must be adapted automatically based on prior knowledge, pre-signal analysis, and a hybrid approach consisting of supervised and reinforcement learning (using the quality Q and the triggered exploration and marking rates of a ROI detection).
Acknowledgments
Parts of this work were supported by the AiF under IGF-Project Nr. 18651 N through the Research Association Deutsche Forschungsvereinigung für Mess-, Regelungs- und Systemtechnik within the funding scheme Industrielle Gemeinschaftsforschung implemented by the Federal Ministry of Economics and Technology based on a decision from the German Bundestag.
References
- Di Lecce, V.; Calabrese, M.; Martines, C. From Sensors to Applications: A Proposal to Fill the Gap. Sens. Transducers 2013, 18, 5–13. [Google Scholar]
- Lehmhus, D.; Brugger, J.; Muralt, P.; Pané, S.; Ergeneman, O.; Dubois, M.-A.; Gupta, N.; Busse, M. When Nothing Is Constant but Change: Adaptive and Sensorial Materials and Their Impact on Product Design. J. Intell. Mater. Syst. Struct. 2013, 24, 2172–2182. [Google Scholar] [CrossRef]
- Bosse, S.; Lechleiter, A. A Hybrid Approach for Structural Monitoring with Self-Organizing Multi-Agent Systems and Inverse Numerical Methods in Material-Embedded Sensor Networks. Mechatronics 2016, 34, 12–37. [Google Scholar] [CrossRef]
- Mishra, P.; Srivastava, N.; Singhal, A.; Shukla, K.K. Agent Based Image Segmentation Methods: A Review. Int. J. Comput. Technol. Appl. 2011, 2, 704–708. [Google Scholar]
- Mazouzi, S.; Guessoum, Z.; Michel, F.; Batouche, M. A Multi-agent Approach for Range Image Segmentation. In Proceedings of the CEEMAS 2007 International Central and Eastern European Conference on Multi-Agent Systems, Leipzig, Germany, 25–27 September 2007; pp. 1–10. [Google Scholar]
- Kagawa, H.; Kinouchi, M.; Hagiwara, M. Image Segmentation by Artificial Life Approach using Autonomous Agents. In Proceedings of the International Joint Conference on Neural Networks, Washington, DC, USA, 10–16 July 1999. [Google Scholar]
- Melkemi, K.E.; Batouche, M.; Foufou, S. MRF Model-Based Approach for Image Segmentation Using a Chaotic MultiAgent System; Springer: Berlin/Heidelberg, Germany, 2005. [Google Scholar]
- Staszewski, W.J.; Lee, B.C.; Mallet, L.; Scarpa, F. Structural Health Monitoring Using Scanning Laser Vibrometry: I. Lamb Wave Sensing. Smart Mater. Struct. 2004, 251–260. [Google Scholar] [CrossRef]
- Mallet, L.; Lee, B.C.; Scarpa, W.J.; Scarpa, F. Structural Health Monitoring Using Scanning Laser Vibrometry: II. Lamb Waves for Damage Detection. Smart Mater. Struct. 2004, 261–269. [Google Scholar] [CrossRef]
- Hillger, W. Visualisation of Guided Wave Propagation by Ultrasonic Imaging Methods. In Proceedings of the 4th International Conference on NDT of the Hellenic Society for NDT, Chania, Greece, 11–14 October 2007. [Google Scholar]
- Giurgiutiu, V. Tuned Lamb Wave Excitation and Detection with Piezoelectric Wafer Active Sensors for Structural Health Monitoring. J. Intell. Mater. Syst. Struct. 2005, 16, 291–305. [Google Scholar] [CrossRef]
- Schmidt, D. Modenselektive Übertragung von Lambwellen in Faserverbundstrukturen. Dissertation, Technische Universität Braunschweig, Braunschweig, Germany, 2014. [Google Scholar]
- Flynn, E.B.; Chong, S.Y.; Jarmer, G.J.; Lee, J.-R. Structural Imaging through Local Wavenumber Estimation of Guided Waves. NDT E Int. 2013, 59, 1–10. [Google Scholar] [CrossRef]
- Bosse, S. Mobile Multi-Agent Systems for the Internet-of-Things and Clouds Using the JavaScript Agent Machine Platform and Machine Learning as a Service. In Proceedings of the IEEE 4th International Conference on Future Internet of Things and Cloud, Vienna, Austria, 22–24 August 2016. [Google Scholar]
Figure 1.
Automated, model-free damage detection with guided ultrasonic waves and 2D scanning.
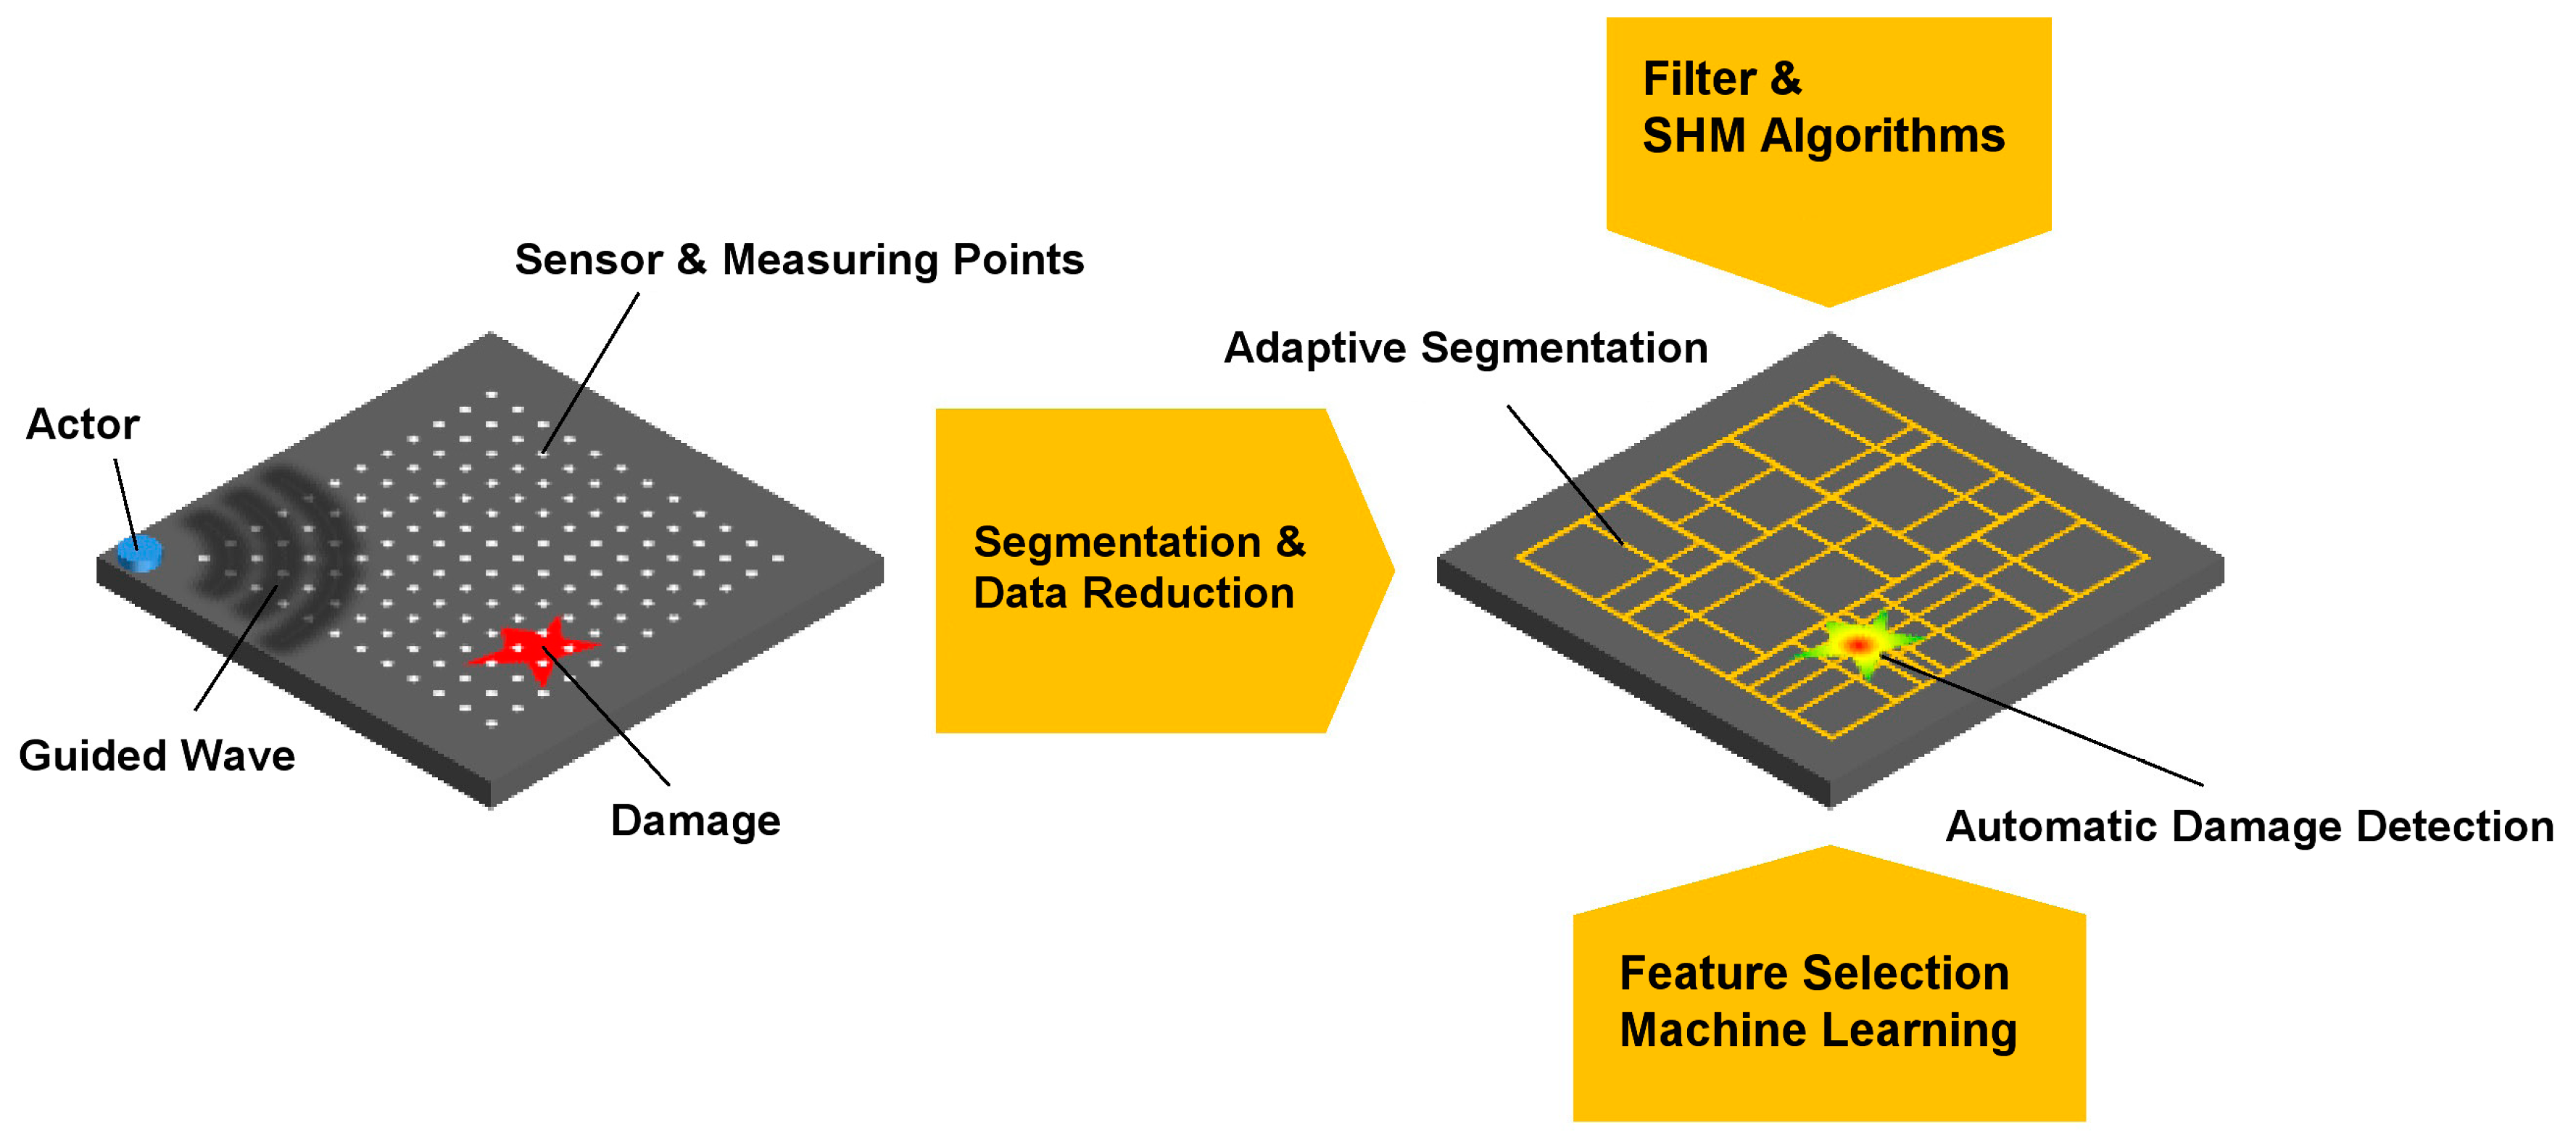
Figure 2.
The MAS: Perception; Event-based instantiation of explorer agents; Diffusion and Reproduction; Communication via signals.
Figure 2.
The MAS: Perception; Event-based instantiation of explorer agents; Diffusion and Reproduction; Communication via signals.
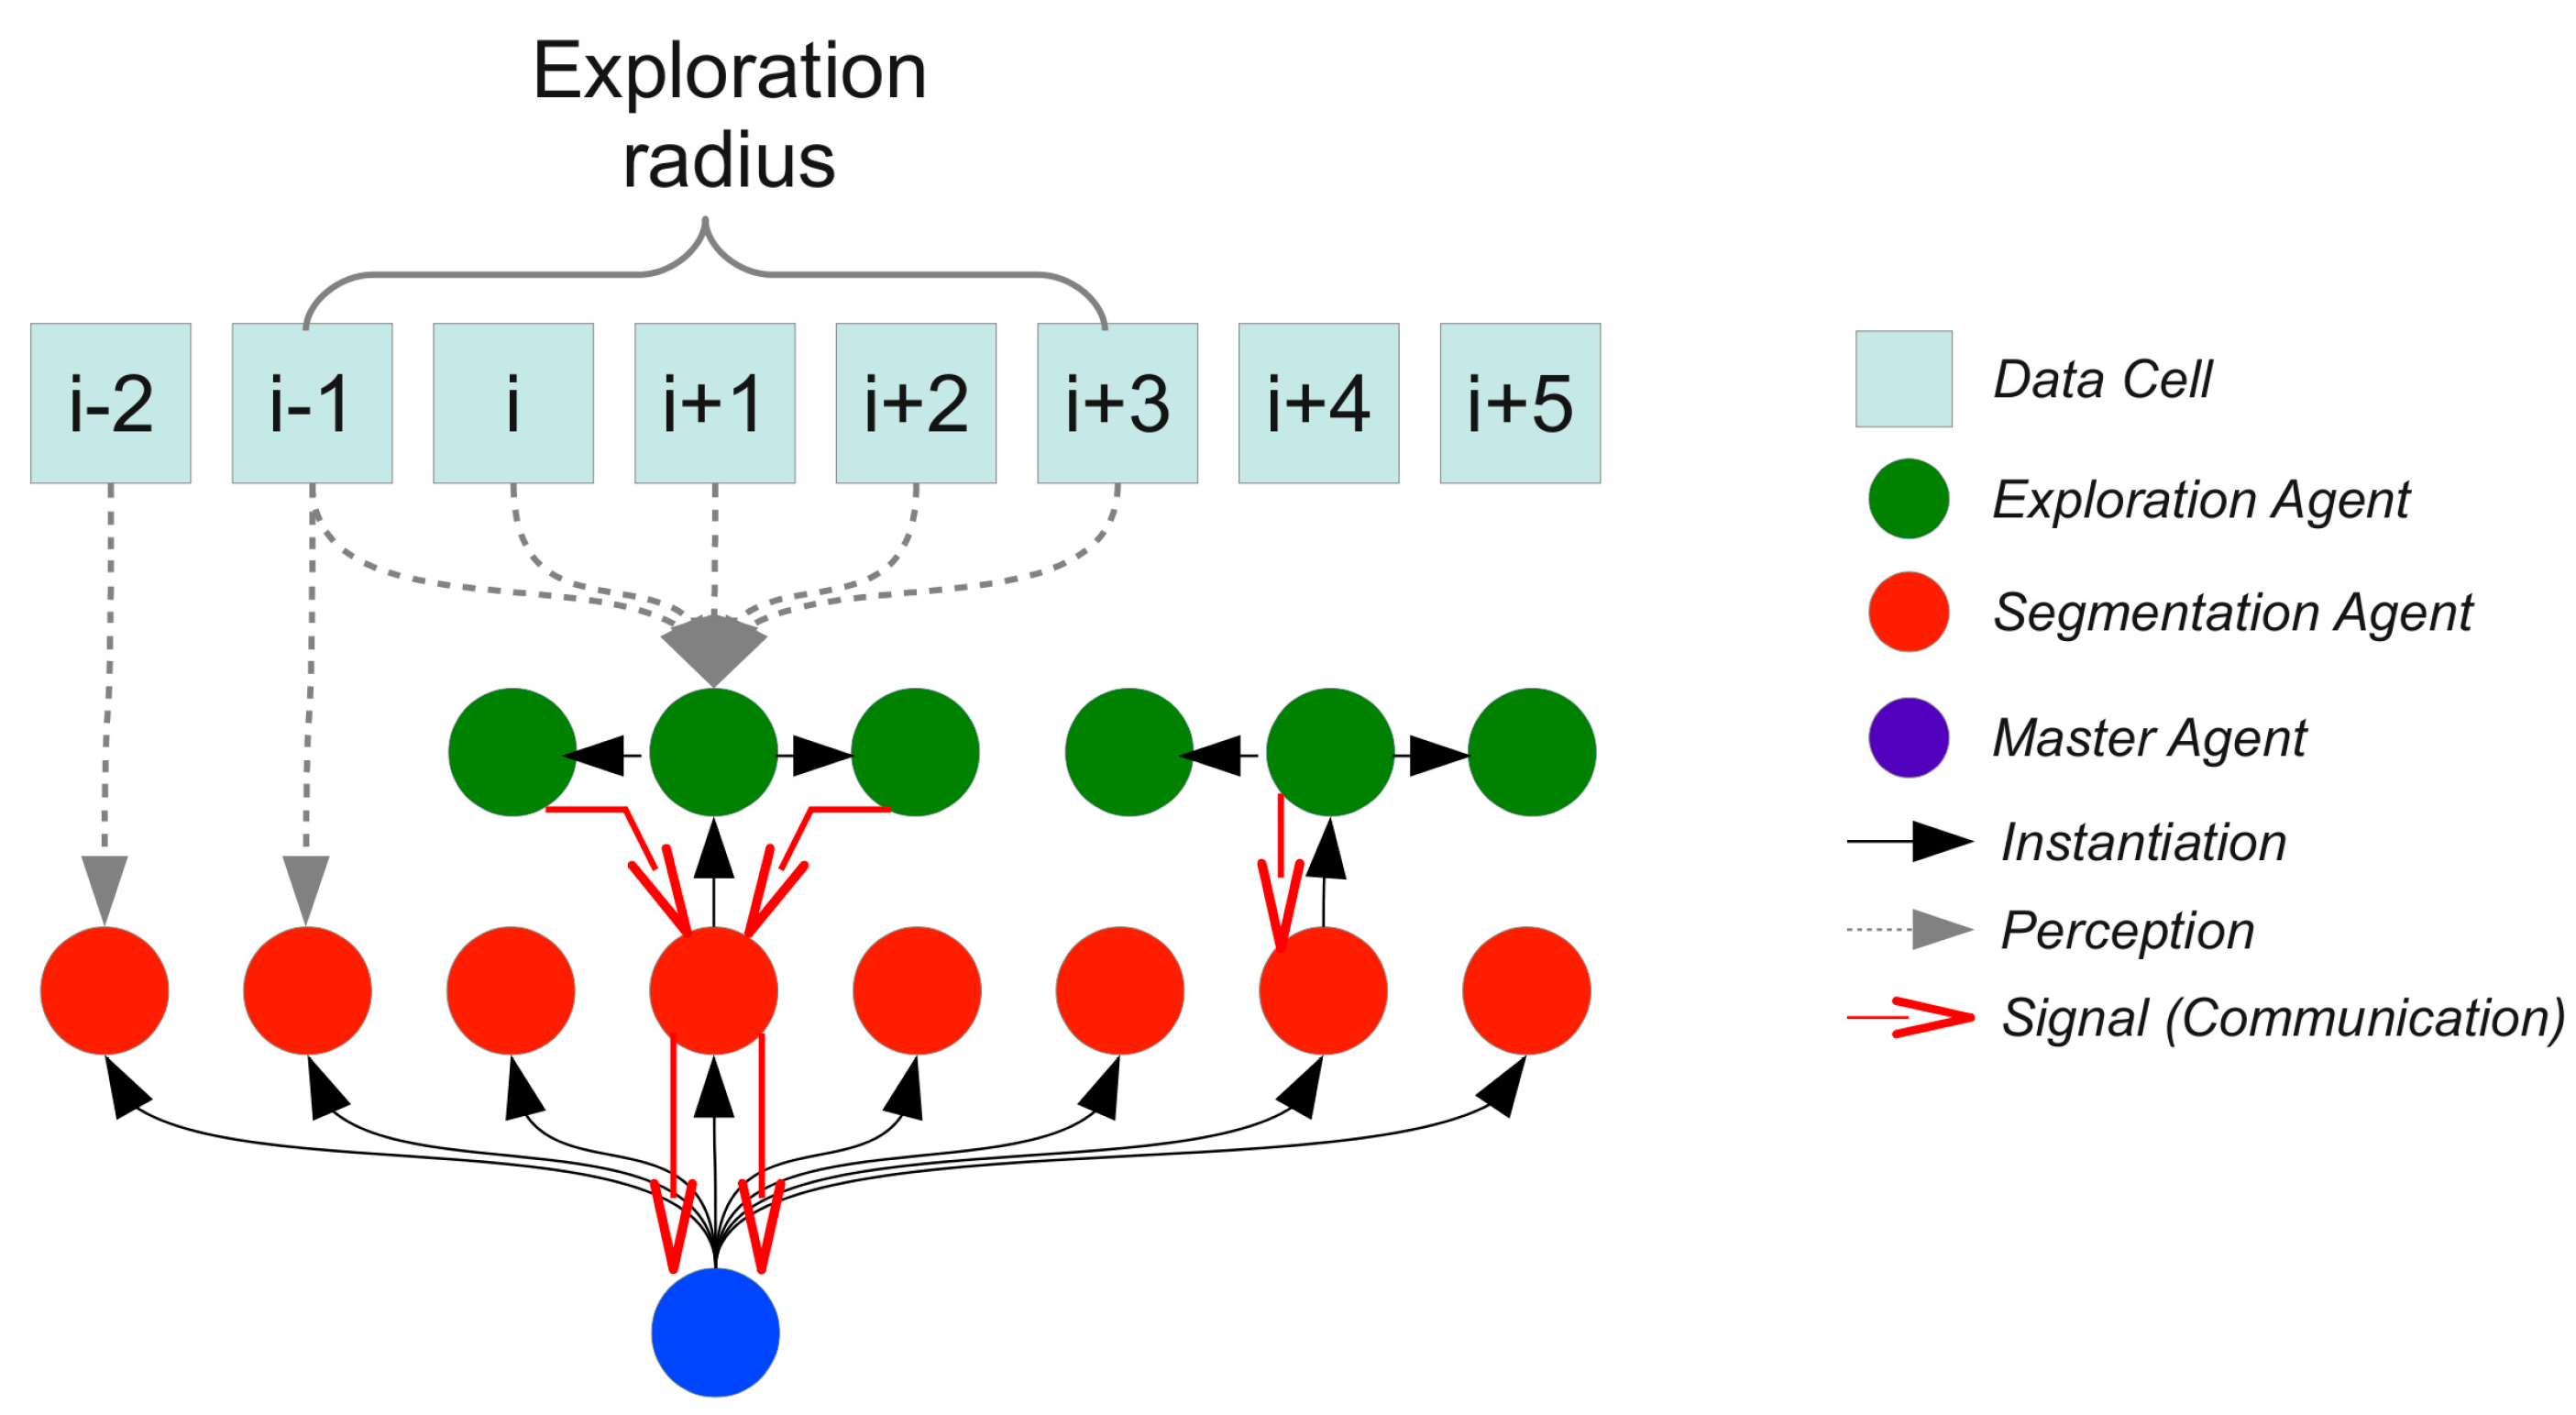
Figure 3.
Experimental setup and placement of PWAS; in this case the transmitted signal from position C to position D is measured.
Figure 3.
Experimental setup and placement of PWAS; in this case the transmitted signal from position C to position D is measured.
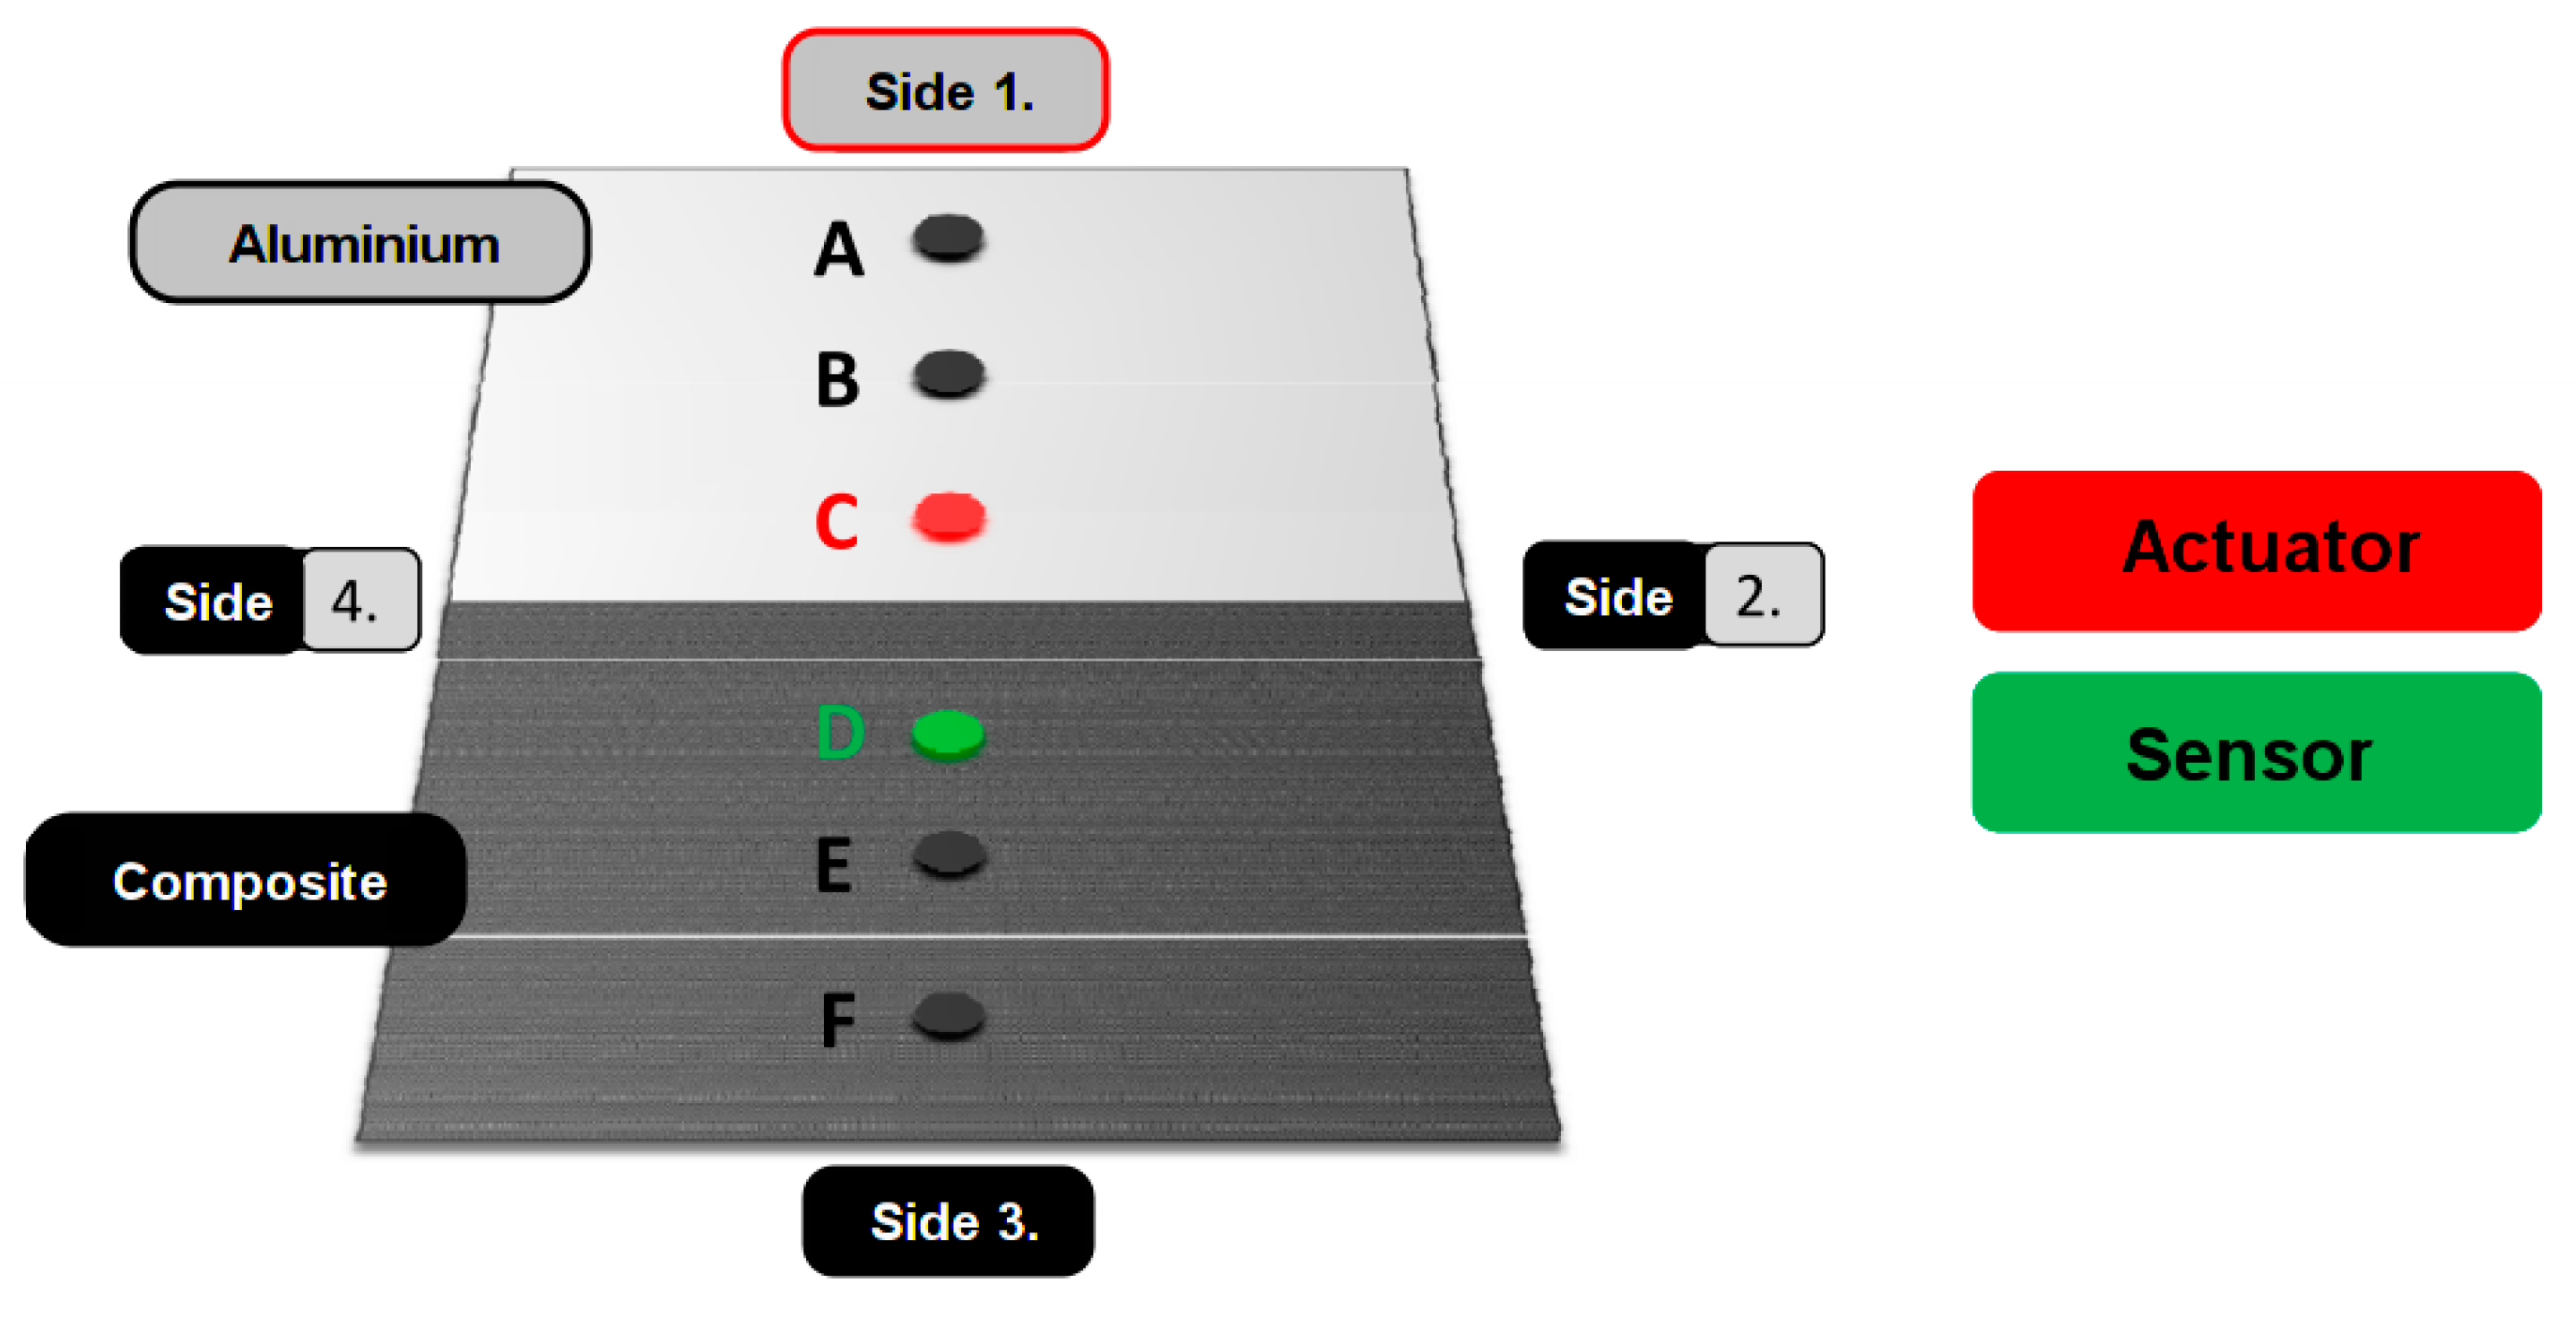
Figure 4.
Some selected results of ROI marking using the Self-organizing MAS: (a,b) Actor signal (c,d) Sensor signal; (a) Without random walk (b–d) With random walk behaviour (a,b) Experiment 105; (c) 110 (d) 108; all fsample = 150 KHz.
Figure 4.
Some selected results of ROI marking using the Self-organizing MAS: (a,b) Actor signal (c,d) Sensor signal; (a) Without random walk (b–d) With random walk behaviour (a,b) Experiment 105; (c) 110 (d) 108; all fsample = 150 KHz.
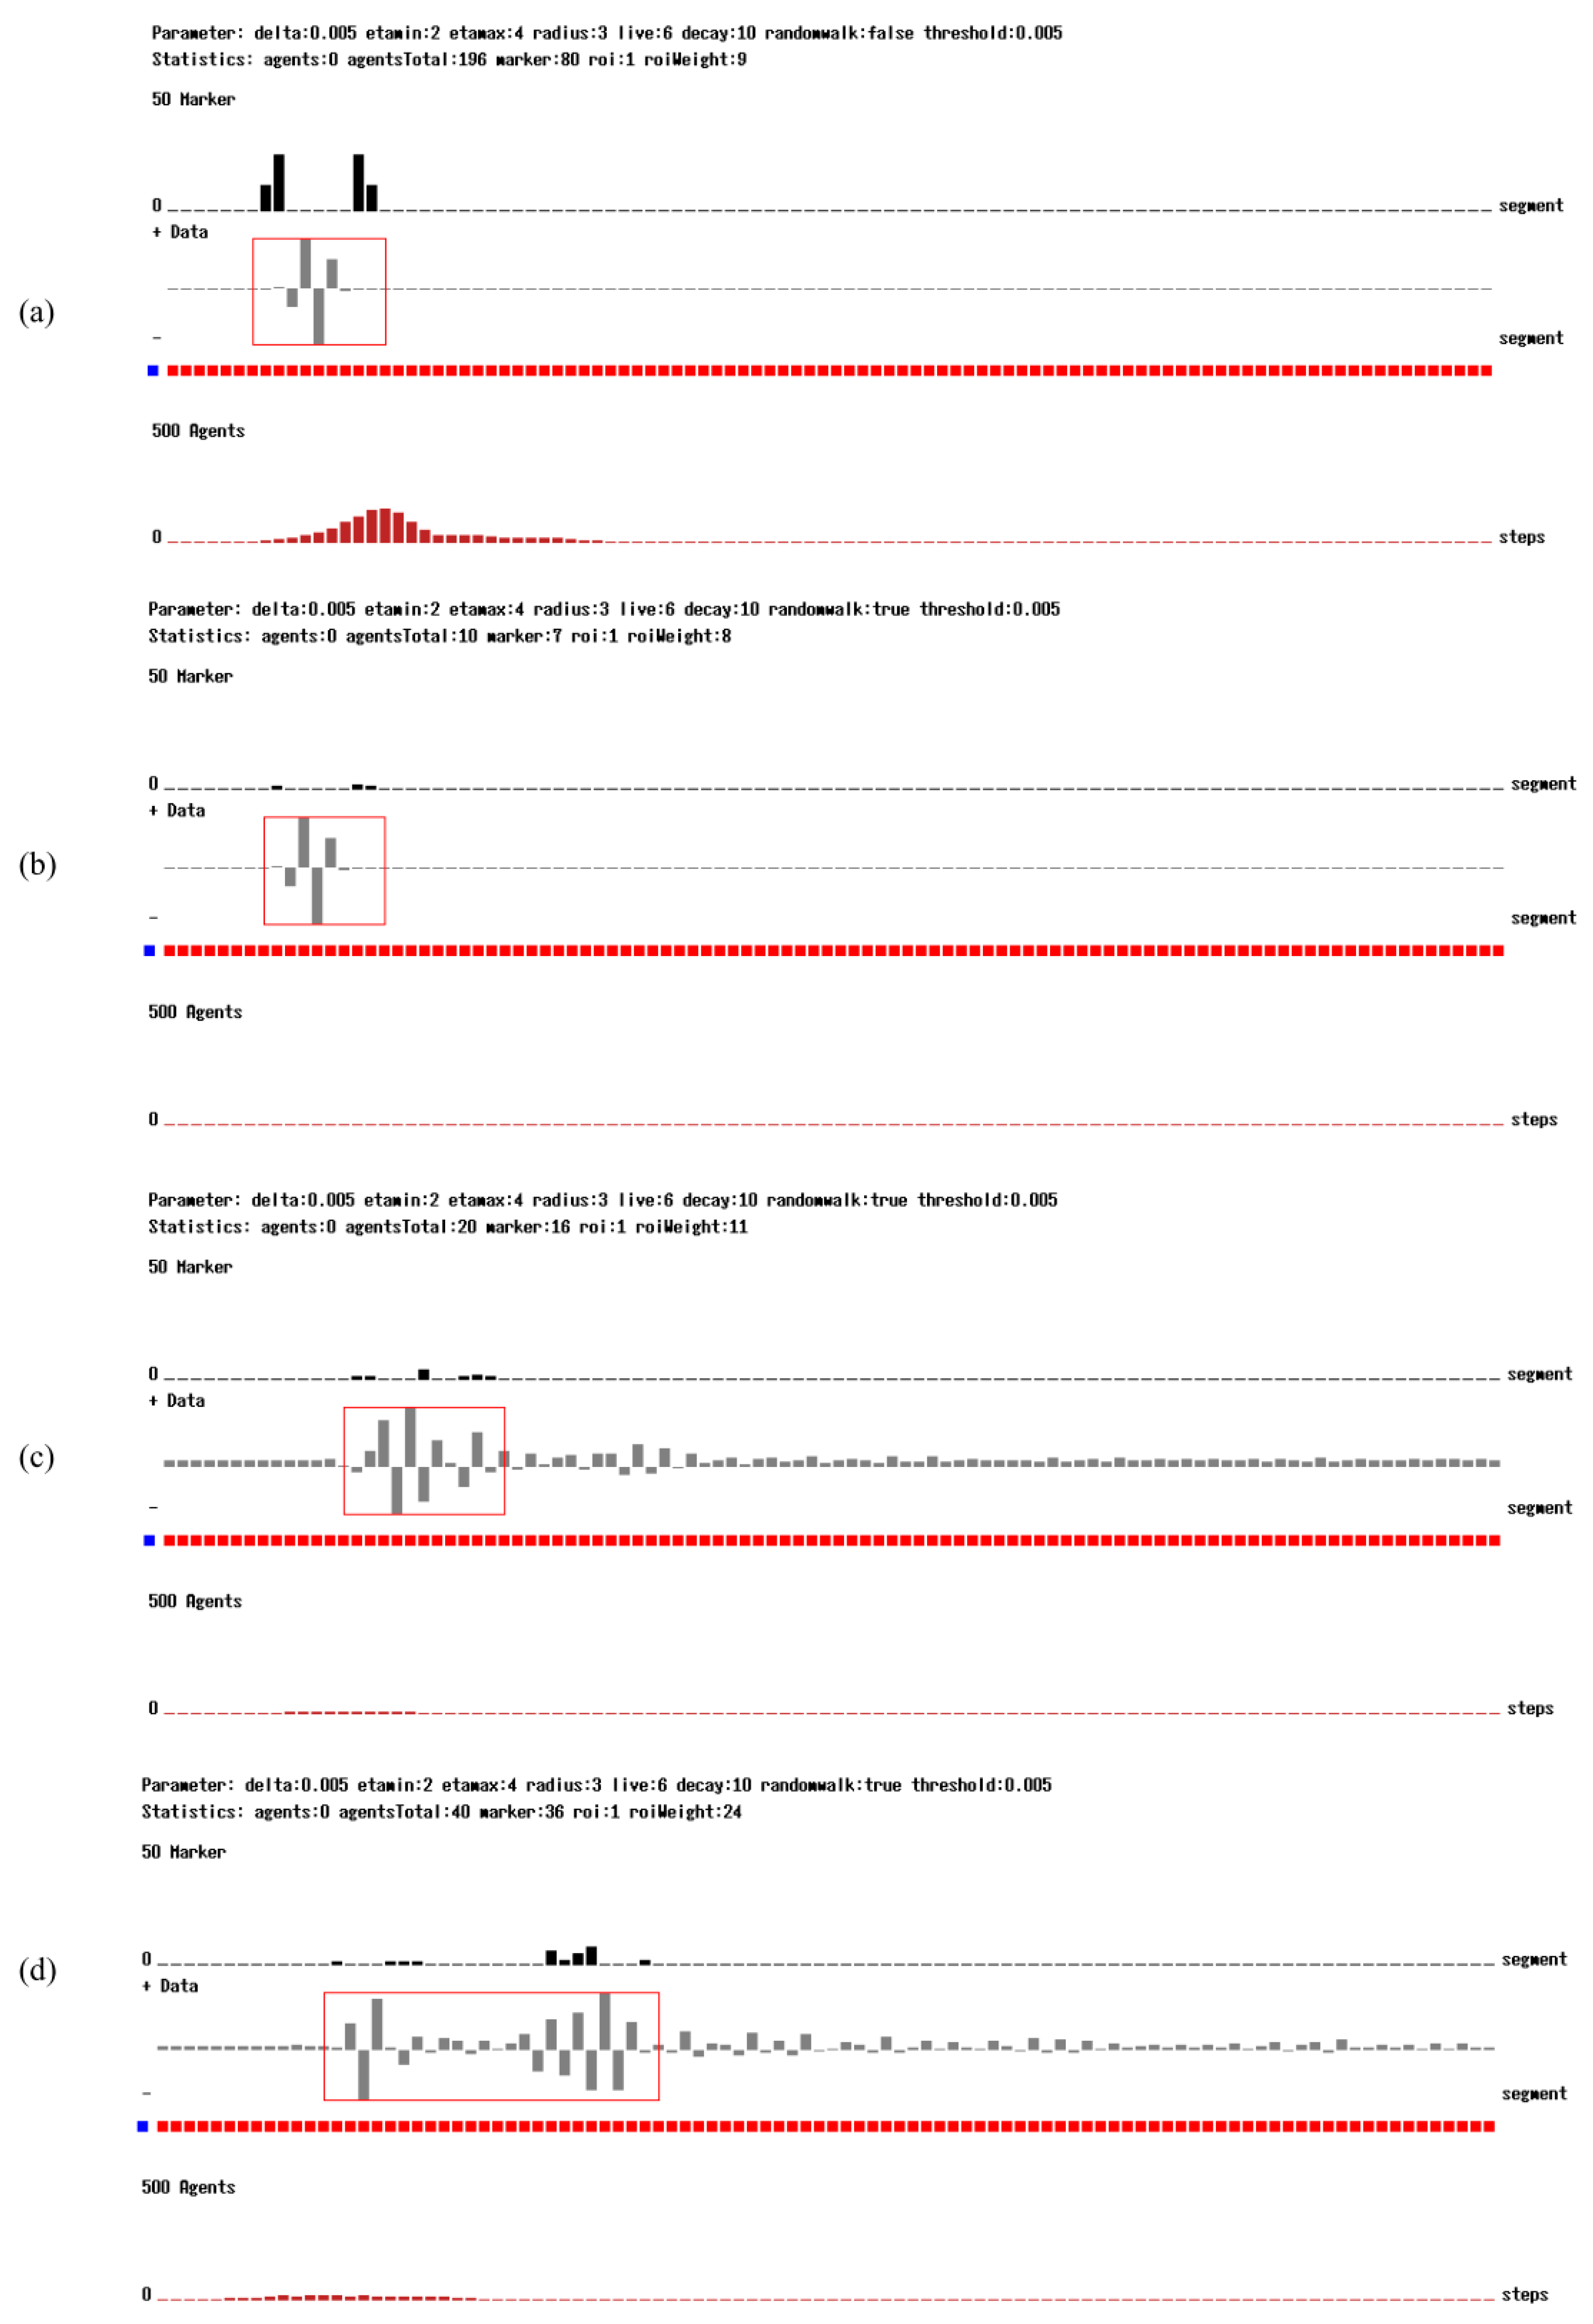
Figure 5.
Analysis results showing quality Q (left) and agent population plots (right) of the ROI detection with different signal data sets F = {1, 2, 3, 4, 5, 6, 7}, Sensor-Actuator configurations CB/CD, and parameter settings P = {0, 1, 2, 3, 4, 5}/{6, 7, 8, 9, 10} (different color bars). (a) Actuator pos. C (except F6: D), Sensor pos. B (except F6: E), error weight k = 10; (b) Actuator pos. C (except F6: D), Sensor pos. D (except F6: C), error weight k = 20.


Table 1.
Parameter sets.
| P | ∆ | ηmin | ηmax | r | τ | δ | ρ | ζ | w0 |
|---|---|---|---|---|---|---|---|---|---|
| 0 | 0.005 | 2 | 4 | 3 | 6 | 10 | false | 0.005 | 5 |
| 1 | 0.005 | 2 | 4 | 3 | 6 | 10 | true | 0.005 | 5 |
| 2 | 0.005 | 1 | 5 | 3 | 6 | 10 | true | 0.005 | 5 |
| 3 | 0.005 | 2 | 4 | 5 | 6 | 10 | true | 0.005 | 5 |
| 4 | 0.005 | 2 | 4 | 3 | 6 | 10 | true | 0.005 | 5 |
| 5 | 0.002 | 2 | 4 | 3 | 6 | 10 | true | 0.002 | 5 |
| 6 | 0.001 | 2 | 4 | 3 | 6 | 10 | true | 0.001 | 8 |
| 7 | 0.0005 | 2 | 4 | 3 | 6 | 10 | true | 0.0005 | 8 |
| 8 | 0.0002 | 2 | 4 | 3 | 6 | 10 | true | 0.0002 | 8 |
| 9 | 0.0001 | 2 | 4 | 3 | 6 | 10 | true | 0.0001 | 8 |
| 10 | 0.00005 | 2 | 4 | 3 | 6 | 10 | true | 0.00005 | 8 |
Table 2.
Signal data sets and analysis setup.
| F | Probe | fsample | Sensor Pos. | Actuator Pos. |
|---|---|---|---|---|
| 0 | Hybrid Alu.-Comp., no gap | 200.1 kHz | B/D | C |
| 1 | Hybrid, gap width 50 mm | 200.1 kHz | B/D | C |
| 2 | Hybrid, gap width 40 mm | 200.1 kHz | B/D | C |
| 3 | Hybrid, gap width 30 mm | 200.1 kHz | B/D | C |
| 4 | Hybrid, gap width 25 mm | 200.1 kHz | B/D | C |
| 5 | Hybrid, gap width 15 mm | 200.1 kHz | E/C | D |
| 6 | Hybrid, gap width 15 mm | 200.1 kHz | B/D | C |
Publisher’s Note: MDPI stays neutral with regard to jurisdictional claims in published maps and institutional affiliations. |
© 2018 by the authors. Licensee MDPI, Basel, Switzerland. This article is an open access article distributed under the terms and conditions of the Creative Commons Attribution (CC BY) license (https://creativecommons.org/licenses/by/4.0/).
Share and Cite
MDPI and ACS Style
Bosse, S.; Koerdt, M.; Schmidt, D. Robust and Adaptive Signal Segmentation for Structural Monitoring Using Autonomous Agents. Proceedings 2018, 2, 105. https://doi.org/10.3390/ecsa-4-04917
AMA Style
Bosse S, Koerdt M, Schmidt D. Robust and Adaptive Signal Segmentation for Structural Monitoring Using Autonomous Agents. Proceedings. 2018; 2(3):105. https://doi.org/10.3390/ecsa-4-04917
Chicago/Turabian StyleBosse, Stefan, Michael Koerdt, and Daniel Schmidt. 2018. "Robust and Adaptive Signal Segmentation for Structural Monitoring Using Autonomous Agents" Proceedings 2, no. 3: 105. https://doi.org/10.3390/ecsa-4-04917