Thermal Coals Revalue: Environmental Implications †
by
 ,
,
Juan José Vidal-Lombas
1,* ,
,
Martina Inmaculada Álvarez-Fernández
2 and
María Concepción Casado-Sulé
3 1
Department of Materials and Metallurgical Science, School of Mining, Energy and Materials Engineering, University of Oviedo, 33004 Oviedo, Spain
2
Department of Mining Explotation and Prospecting, School of Mining, Energy and Materials Engineering, University of Oviedo, 33004 Oviedo, Spain
3
School of Mining Engineering, University of León, 24005 León, Spain
*
Author to whom correspondence should be addressed.
†
Presented at the 2nd International Research Conference on Sustainable Energy, Engineering, Materials and Environment (IRCSEEME), Mieres, Spain, 25–27 July 2018.
Proceedings 2018, 2(23), 1441; https://doi.org/10.3390/proceedings2231441
Published: 2 November 2018
(This article belongs to the Proceedings of The 2nd International Research Conference on Sustainable Energy, Engineering, Materials and Environment)
Abstract
:Being thermal coal such an abundant resource in Spain, we are looking for alternative uses for it. This would enable its future use in different fields, same of them already classic, such as: new materials (graphene, activated carbon, molecular sieves, etc.), nano-technology, in situ energy use (gasification and liquefaction), CBM (coal bed methane), ECBM (coal bed methane with CO2 injection) and CMM (coal mine methane). It could also be used in other innovative areas with high added value, such as gastronomy and biomedicine.
1. Introduction
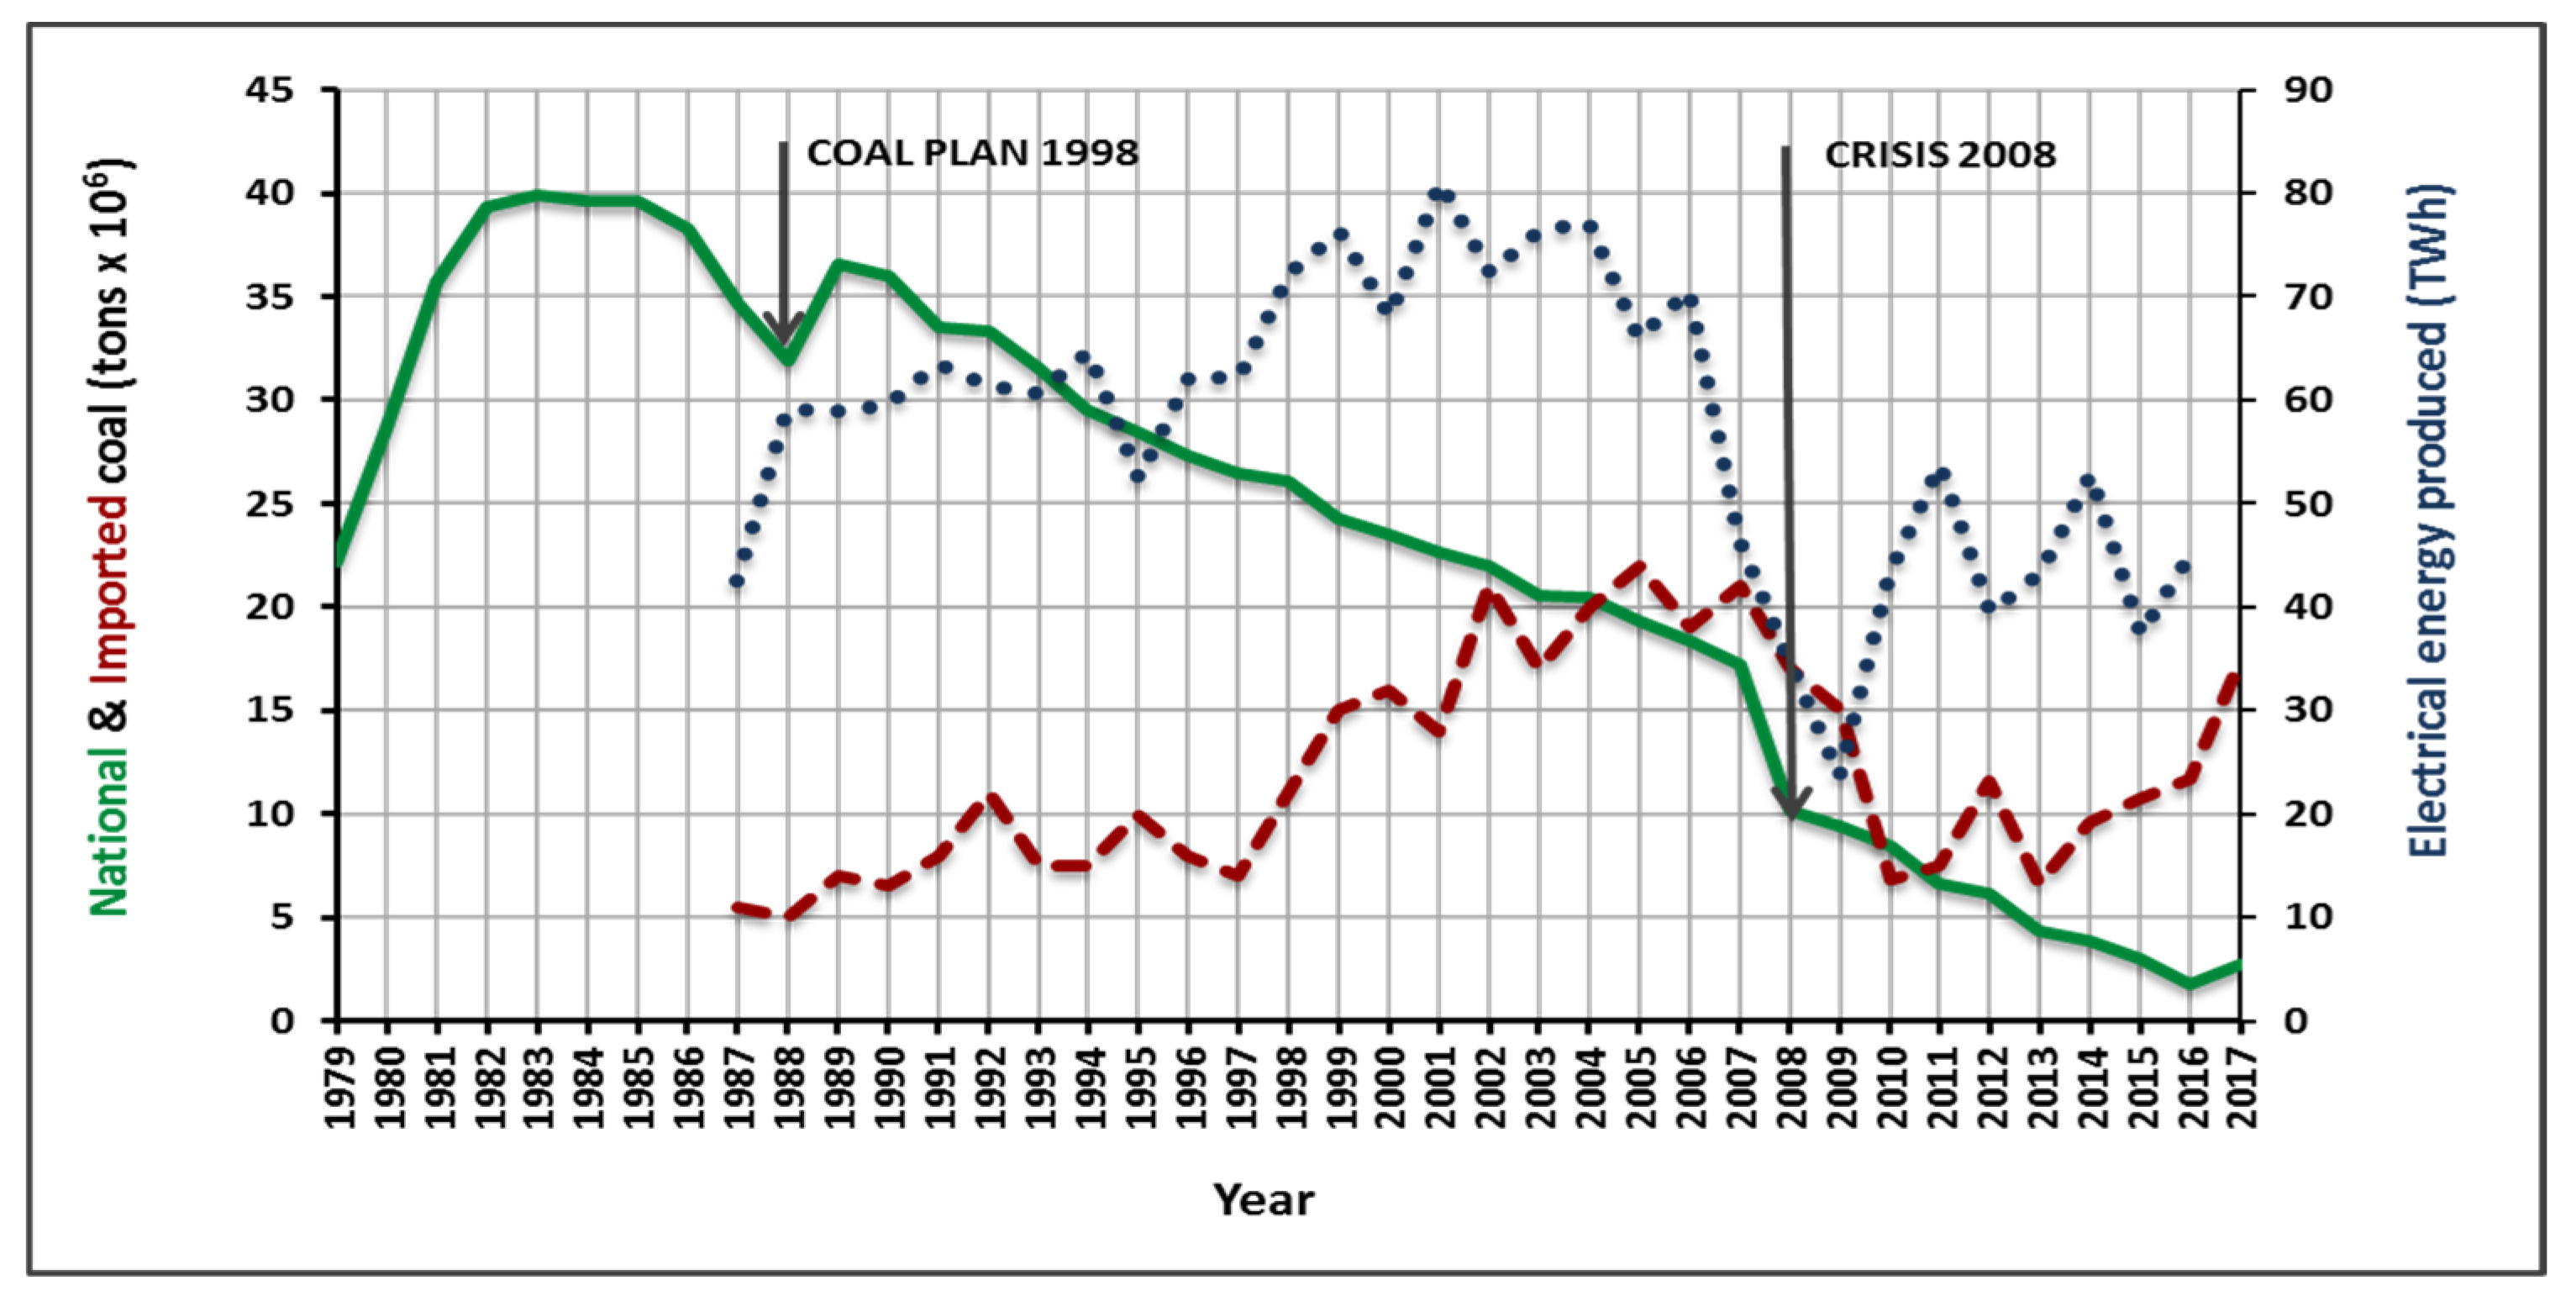
The gradual decrease in the use of mineral coal as an energy resource in Spain has resulted in a continuous decline in production, which started in the year 1991 (Figure 1). As a result, most of the country’s coal mines are being shut down. This situation implies a crisis that will result in an industrial, socioeconomic and population decline of whole regions.
To help mitigate this situation, an analytical study of mineral coal samples from two sites located in coalfields of the Cantabrian Mountains, in the Northern part of Spain, has been carried out.
According to ISO 11760-2005 [3] classification criterion, the two types of coal chosen can be defined as Bitominous A, low in volatile, which corresponds to a medium-high range coal, not very abundant worldwide in coal deposits (Table 1).
In addition, the results of the immediate analysis highlight its low ash content. This is very important for the manufacture of activated carbon, since in some of the stages there is a progressive increase of ash [4].
In relation to the activated carbon, the consumption in Spain in the year 2016 was of 68,805 tons [5,6], which were imported in its entirety, since the national production is null (Figure 2).
Due to all these circumstances, the use of the chosen mineral coals as raw materials for the production of activated carbon has been suggested.
2. Environmental Implications
In addition to the causes previously adduced, the following have been taken into account, related to the preservation of the environment:
- This raw material has a high starting porosity, which means a saving of energy in the activation process.
- Physical activation (thermal) is applied, which avoids the manipulation and elimination of polluting substances used in the chemical activation of other raw materials.
3. Materials and Methods
The mineral coal was collected in situ in two deposits located in the coal basins of the Carboniferous-Stephanian B. A total of 30 referenced samples were prepared according to a pre-established nomenclature. Two granulometric fractions were applied: fine (0.125–0.425 mm) and granular (1–3 mm). These particle sizes are adapted to the two types of activated carbon most used and marketed, as are the Powdered Activated Carbon (PAC), with particle size less than 0.18 mm and Granular Activated Carbon (GAC), whose size varies from 0.2 to 5 mm [8].
The initial chemical characterization was performed by immediate analysis: UNE 32002; elemental analysis: UNE 32004 and ash analysis: UNE 32019; the determination of C, H2 and N2: UNE 32112 and UNE 32013; the determination of S: UNE 32008; the contents of Si, Al, Fe, Ca, Mg, Na, K and Ti by X-ray fluorescence: ASTM 4326-13.
In view of the preliminary results obtained (Table 2), it was decided to apply a process of physical activation of coal, with CO2 and H2O (STEAM) as activating agents. The choice was based on three fundamental reasons:
- Quality of the product obtained: activated carbons richer in micro-pores and with more specific surfaces than those obtained by the chemical method [11].
- Economy: H2O (STEAM) and CO2 are the two most affordable physical activators for their low cost.
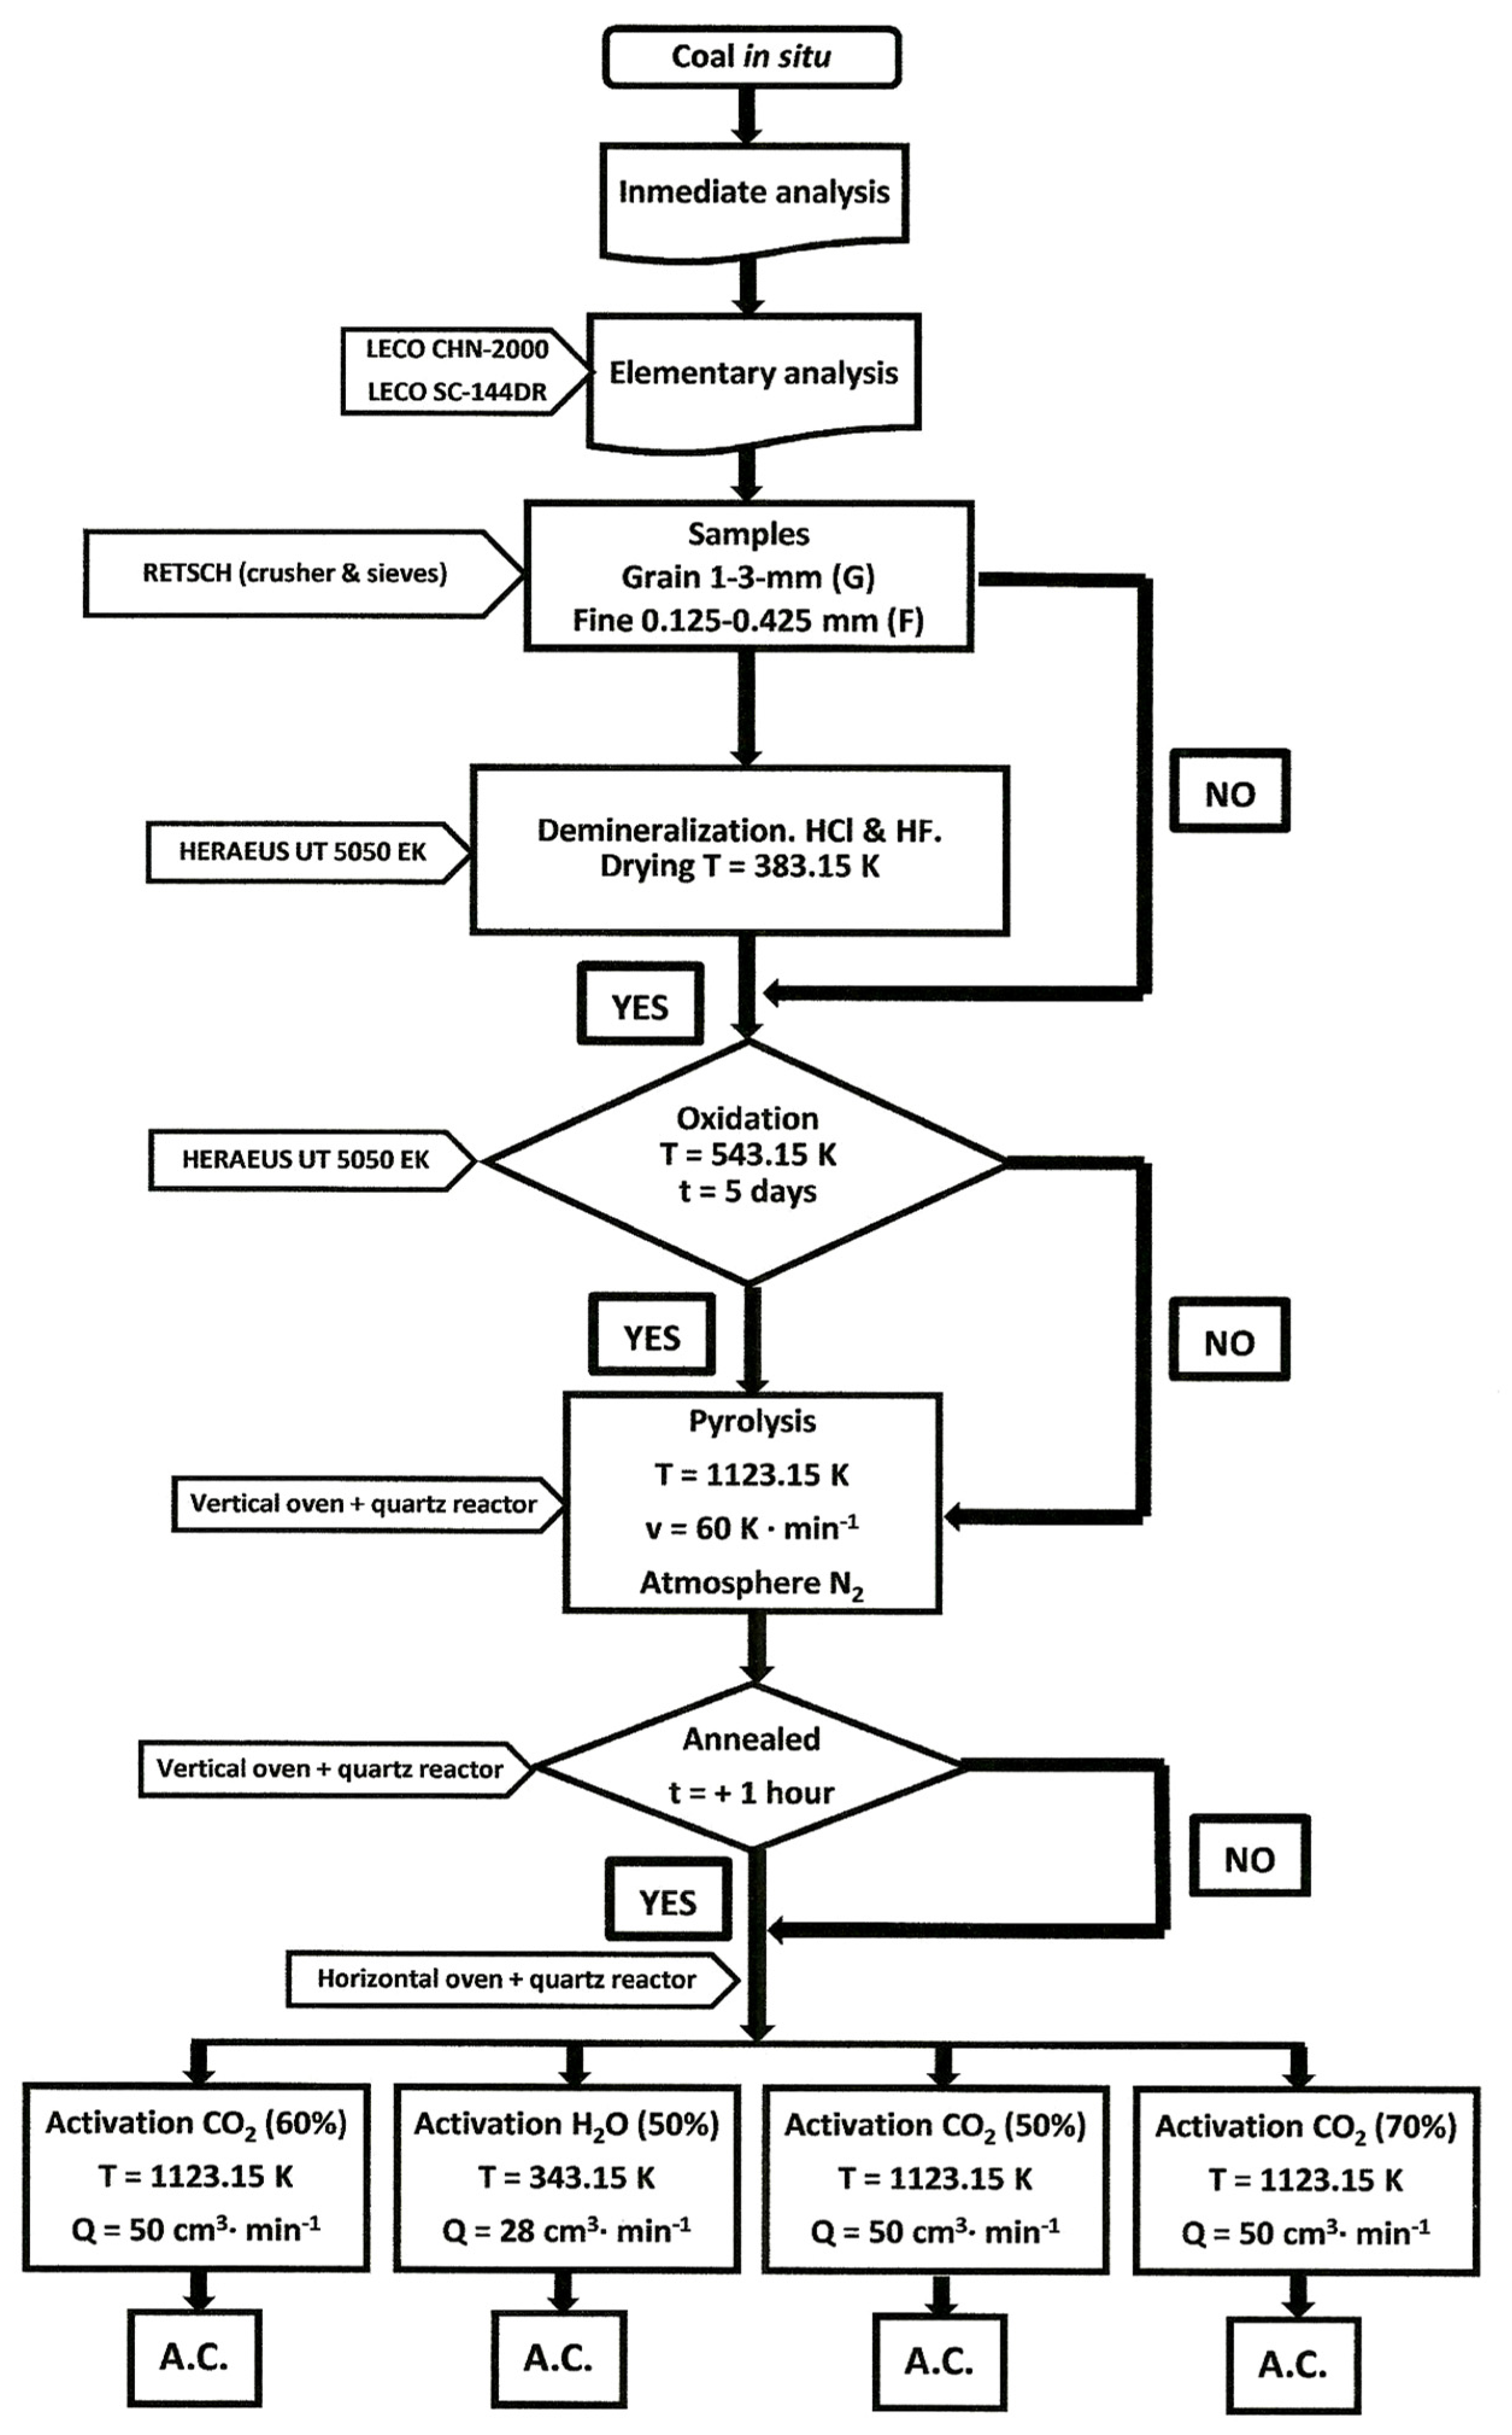
The prepared samples were subjected to various treatments, trying to cover all possible combinations. Some of them were previously demineralised by acid attacks. Then they were subjected to oxidation and pyrolysis, and finally all were activated with CO2 and H2O (STEAM). The sequence of the process and the different treatments, as well as the equipment used, are observed in Figure 4.
4. Results
With the aim of getting a complete characterization of the carbonaceous products obtained, an immediate analysis and a textural characterization of each of them were carried out. For this analysis we used the same equipment and applied the same standards UNE that for the starting materials. For the characterization, the appropriate equipment was used for each test. According to the criteria of the IUPAC [12] the following parameters have been obtained: real density (Dr), apparent density (Dap), total pore volume (VT), porosity (Є), pore size distribution (V), specific surface area (SH2-BET and SCO2-DR) and pore size distribution (Vmicro ≤ 2 nm, 2 < Vmeso > 50, Vmacro ≥ 50 nm).
5. Discussion
In order to analyse and collate the experimental results obtained for each sample, these have been graphically represented using N2 adsorption isotherms (77 K) (Figure 5a), mercury porograms (Figure 5b) and por size distribution histograms (Figure 5c).
In general, the study highlights the progressive increase in actual density Dr, as well as a decrease in the apparent density Dap. This effect is evident, both with the application of the different treatments and with the increase of each one of them, according to the following sequence:
DEMINERALIZATION → OXIDATION → PYROLYSIS → ANNEALED → ACTIVATION
The most significant increase occurs in the activation stage, as a consequence of the significant increase in the total pore volume due to the gasification produced, both with CO2 and H2O (STEAM) [13].
6. Conclusions
Analyzing, processing and studying the results obtained, we conclude the following:
- (1)
- All pre-activation treatments have proved positive for the subsequent textural development of the starting materials, allowing the obtaining of materials with the best structural properties.
- (2)
- The proper handling of the processes and of the different operating variables, allows the obtaining of carbonaceous materials with a structural development “to measure” of activated carbon, that can be used in specific and specific processes.
Conflicts of Interest
The authors declare no conflict of interest.
References
- Available online: http://www.minetad.gob.es/ENERGIA/MINERIA/ESTADISTICA.aspx (accessed on 26 April 2018).
- Available online: http://www.ree.es/es/estadisticas-del-sistema-electrico-espanol (accessed on 26 April 2018).
- Available online: https://www.iso.org/standard/38898.html (accessed on 26 April 2018).
- Jankpwska, H.; Swiatkowski, A.; Com, J. Active Carbon; Ellis Horwood: London, UK, 1991. [Google Scholar]
- Available online: http://www.ihs.com/products/chemical/planning/ceh/acyivated-carbon.aspx (accessed on 26 April 2018).
- Available online: http://www.trademap.org (accessed on 26 April 2018).
- Available online: http:/www.transparencymarketresearch.com/activated-carbon-market.html (accessed on 26 April 2018).
- Available online: http://www.chemviron.eu (accessed on 26 April 2018).
- Benaddi, H.; Legras, D.; Rouzard, J.N.; Begui, F. Influence of the atmosphere in the chemical activation of wood by phosphoric acid. Carbon 1998, 36, 306–309. [Google Scholar] [CrossRef]
- Byamba-Ochira, N.; Shimb, W.G.; Balathanigaimanic, M.S.; Moona, H. Highly porous activated carbons prepared from carbon rich Mongolian anthracite by direct NaOH activation. ; Appl. Surf. Sci. 2016, 379, 331–337. [Google Scholar] [CrossRef]
- Othmer, K. (Ed.) Encyclopedia of Chemical Technology, 5th ed.; 27 Volume Set; Wiley: New York, NY, USA, 2004. [Google Scholar]
- International Union of Pure and Applied Chemistry. Available online: https://iupac.org (accessed on 26 April 2018).
- Bansal, R.C.; Goyal, M. Activated Carbon Adsorption; Taylor anf Francis Group, CRC Press: Boca Raton, FL, USA, 2005. [Google Scholar]

Figure 2.
World comsuption of activated carbon year 2016.

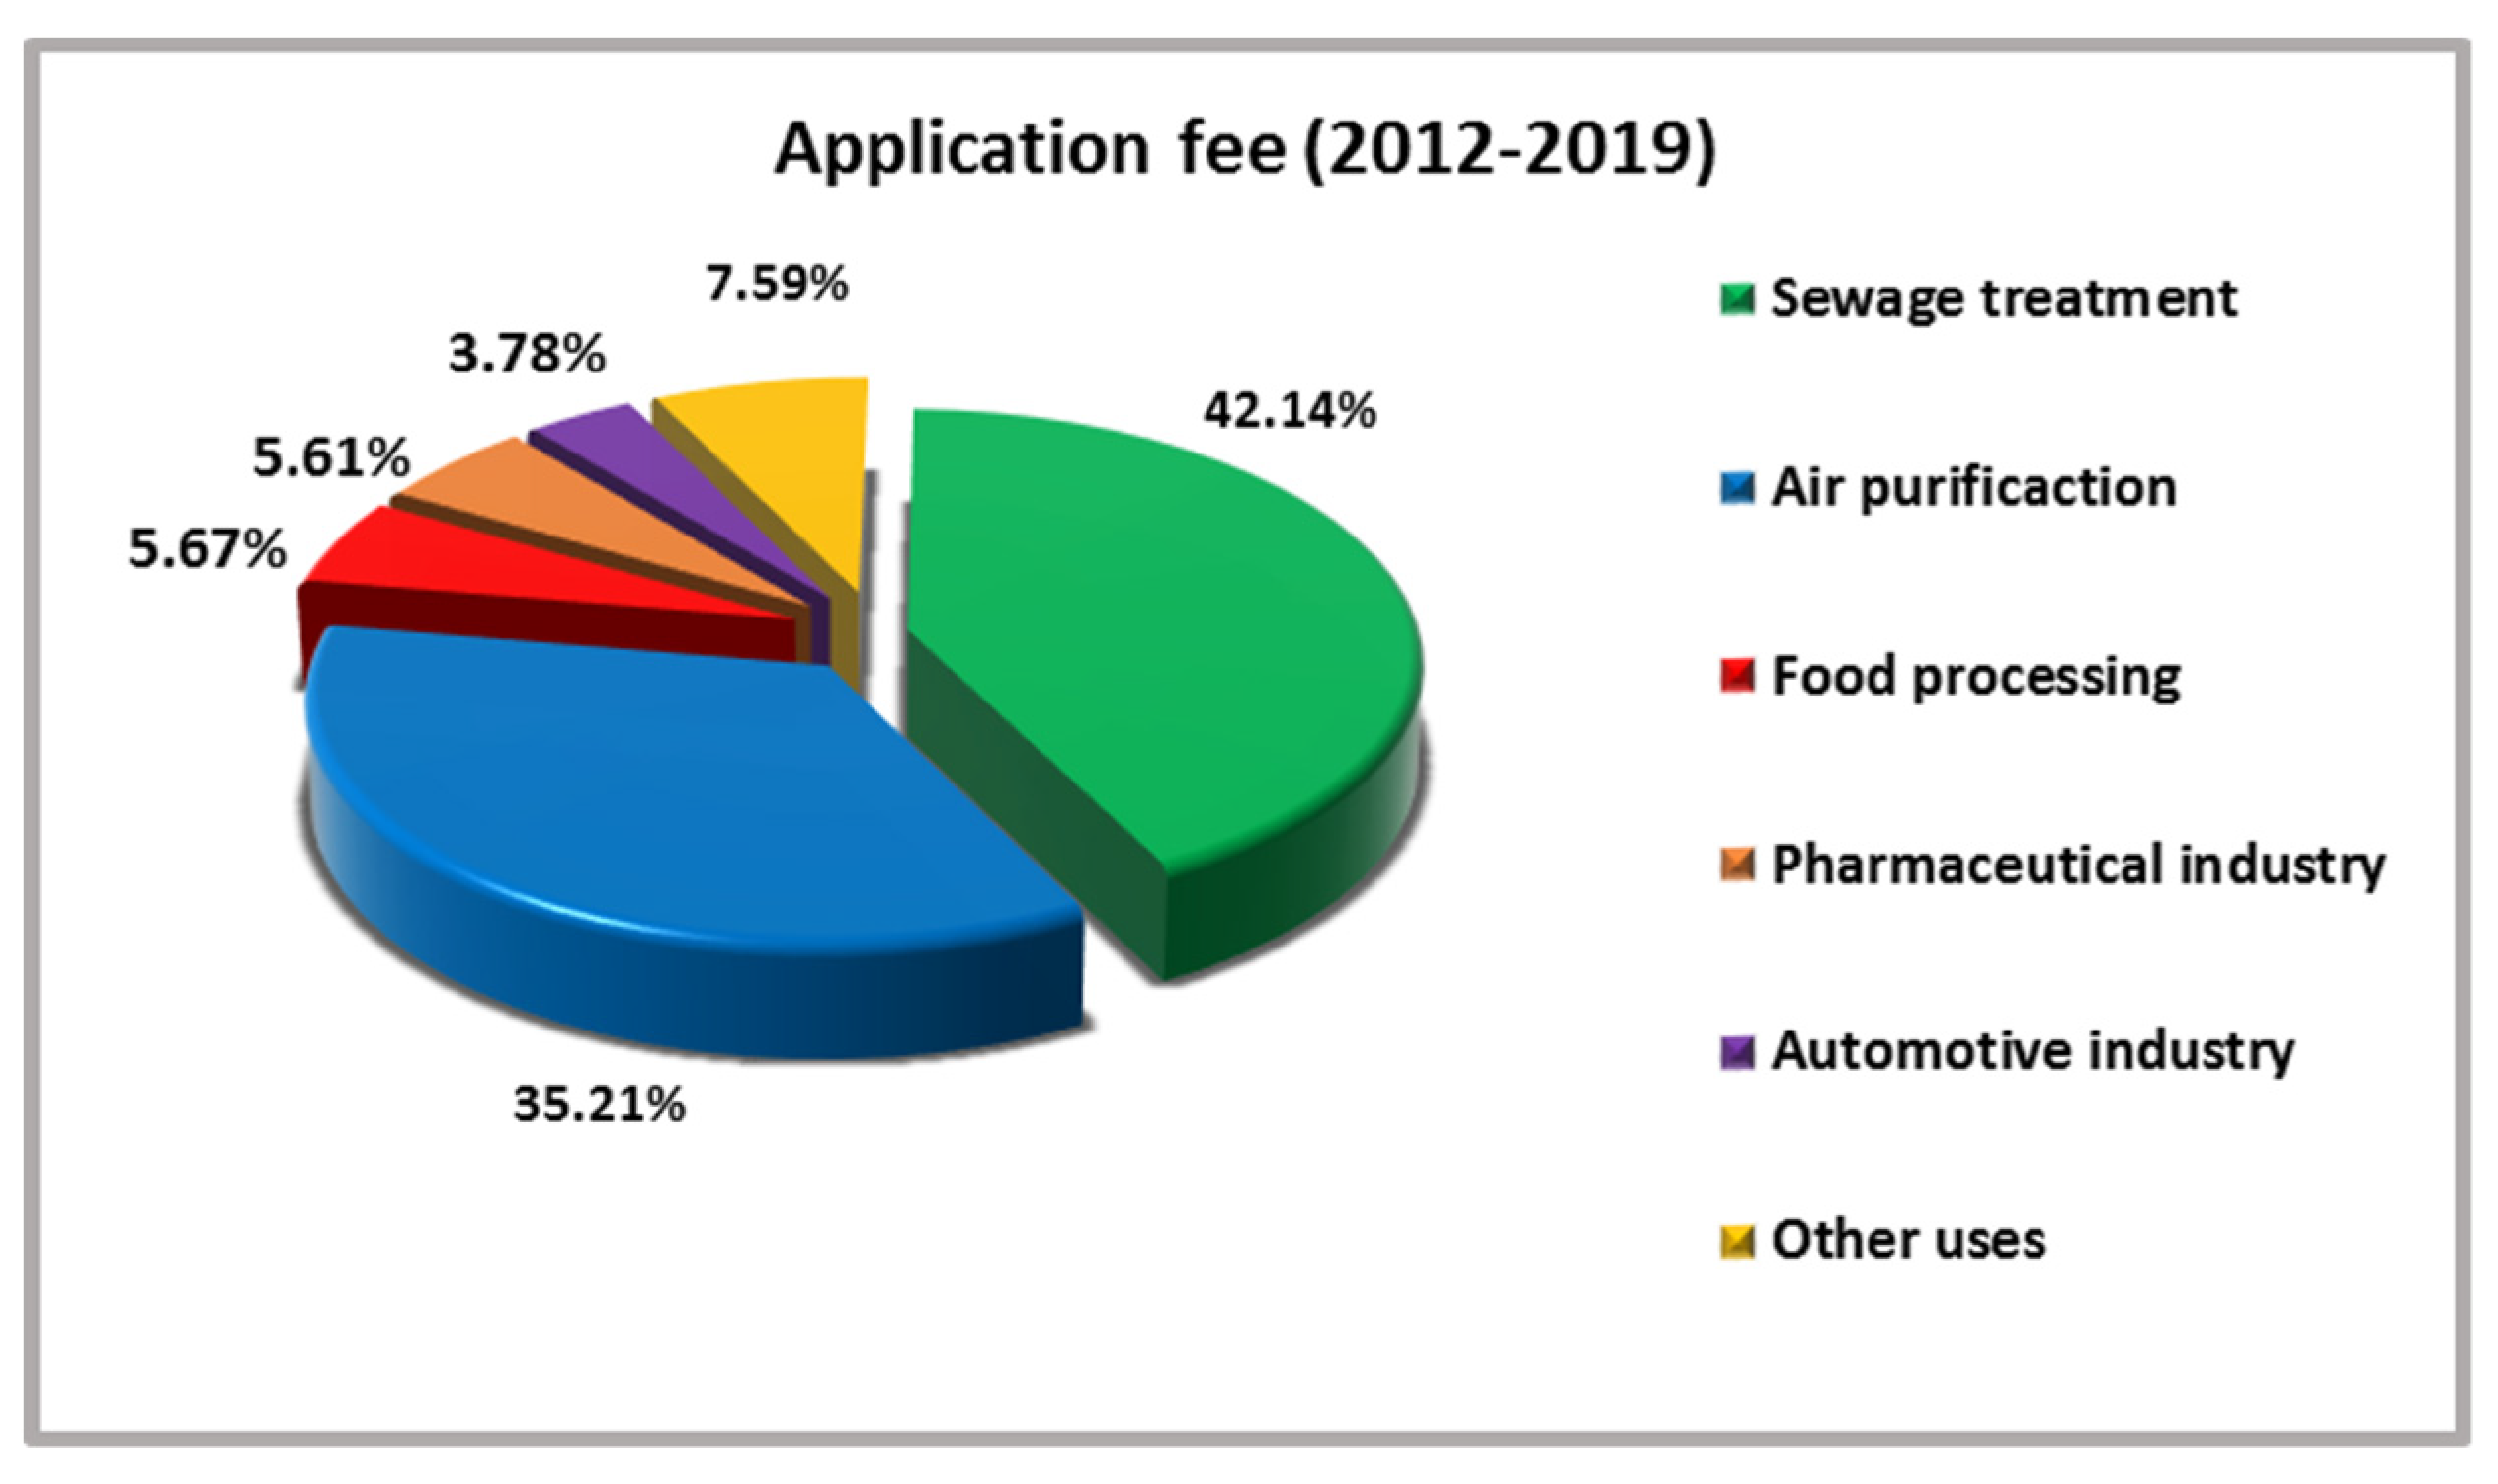
Figure 3.
Application fee (2012–2019).

Figure 4.
Diagram of process and treatments.

Figure 5.
Graphics of textural characterization results.


Table 1.
Reflectance of the two types of coal “D” and “A”.
| REFLECTANCE/MACERAL COMP. (% volume, pc) | COAL “D” | COAL “A” |
|---|---|---|
| Inertinite | 3.60 | 1.80 |
| Reflectance | 1.77 | 1.72 |
| Standard deviation | 0.10 | 0.09 |
Table 2.
Characterization of the two types of coal “D” and “A”.
| ANALYSIS | ||||||||||
|---|---|---|---|---|---|---|---|---|---|---|
| INMEDIATE (% weight) | ELEMENTAL (% weight, pc) | |||||||||
| Parameter | Moisture (sample) | Ash (db) | Volatile (db) | Volatile (pc) | Fixed C (db) | Carbon | Hydrogen | Nitrogen | Total Sulfur | Oxygen (by diffrence) |
| COAL "D" | 1.12 | 4.98 | 8.41 | 8.85 | 86,17 | 91.52 | 2.57 | 1.66 | 0.95 | 3.30 |
| COAL "A" | 1.10 | 5.51 | 8.95 | 9.47 | 85.02 | 91.47 | 3.05 | 1.99 | 1.34 | 2.15 |
| db: dry base pc: pure coal | ||||||||||
Publisher’s Note: MDPI stays neutral with regard to jurisdictional claims in published maps and institutional affiliations. |
© 2018 by the authors. Licensee MDPI, Basel, Switzerland. This article is an open access article distributed under the terms and conditions of the Creative Commons Attribution (CC BY) license (https://creativecommons.org/licenses/by/4.0/).
Share and Cite
MDPI and ACS Style
Vidal-Lombas, J.J.; Álvarez-Fernández, M.I.; Casado-Sulé, M.C. Thermal Coals Revalue: Environmental Implications. Proceedings 2018, 2, 1441. https://doi.org/10.3390/proceedings2231441
AMA Style
Vidal-Lombas JJ, Álvarez-Fernández MI, Casado-Sulé MC. Thermal Coals Revalue: Environmental Implications. Proceedings. 2018; 2(23):1441. https://doi.org/10.3390/proceedings2231441
Chicago/Turabian StyleVidal-Lombas, Juan José, Martina Inmaculada Álvarez-Fernández, and María Concepción Casado-Sulé. 2018. "Thermal Coals Revalue: Environmental Implications" Proceedings 2, no. 23: 1441. https://doi.org/10.3390/proceedings2231441