Influence of Attached Sunspaces on Indoor Thermal Comfort. The Case Study of a Traditional Asturian House †


Department of Energy, University of Oviedo, School of Mining, Energy and Materials Engineering of Oviedo, 33004 Oviedo, Spain
*
Author to whom correspondence should be addressed.
†
Presented at the 2nd International Research Conference on Sustainable Energy, Engineering, Materials and
Environment (IRCSEEME), Mieres, Spain, 25–27 July 2018.
Proceedings 2018, 2(23), 1392; https://doi.org/10.3390/proceedings2231392
Published: 29 November 2018
(This article belongs to the Proceedings of The 2nd International Research Conference on Sustainable Energy, Engineering, Materials and Environment)
Abstract
:Attached sunspaces are widely employed in the higher floors of traditional residences in the North of Spain. More specifically, in Asturias, it is easy to find them south-oriented and cantilever-positioned. This helps to take the greatest advantage of sun rays, especially during long winter months, and provides a ground-leveled, rain-protected, arcaded space. The function of such space is being a passing area (if it is to be found in a city house), or an exterior mudroom (if it is to be found in a country estate). With respect to the thermal impact of attached sunspaces in inner comfort condition, it is worth determining whether they are truly valuable elements, suitable to be employed in contemporary passive residences in the Atlantic area, or if their climate-dependant performance invalidates such use.
1. Introduction
Since people in the European Union spend on average 90% of our time indoors, it has become crucial to provide thermal comfort inside the buildings with the lowest possible energy consumption [1]. Such is to be achieved either by developing bio-climatic, environmentally adapted constructive designs [2,3] or by improving the efficiency of HVAC systems [4,5].
Unfortunately, thermal neutrality (or, even better, thermal satisfaction) involves a high degree of subjectivity [6,7] and it is not easy to define. That is why: (1) Personal parameters (such as clothing insulation or metabolic heat rate) are significant inputs in most thermal comfort models [7]. (2) Survey-based comfort indices (such as Predicted Mean Vote (PMV), Actual Mean Vote (AMV) or Predicted Percentage of Dissatisfied (PPD) [8]) are widely employed. (3) Adaptative, based on human-behavior comfort criteria [9] have been developed all over the last 20 years.
The current work is about a XIX century, Avilés-located Traditional Asturian House (TAH), with two south-oriented glazed balconies on the first floor (Figure 1). In 2010, the TAH was partially restored and the original single window-paned wooden galleries were substituted by new double-paned wooden-aluminum ones. Nevertheless, the TAH protection level (inherent to its historical condition) made it impossible to install a mechanical HVAC system.
2. Materials and Methods
The aim of this study is to determine the influence of the two attached sunspaces in internal thermal comfort condition. Such status was merely evaluated at the first floor using ASHRAE 55-2010 standard adaptative model (for occupant-controlled, naturally conditioned spaces).
Since the gallerias were not to be physically removed, findings were made by simulating the two scenarios with TRNSYS 17. To do so, the TAH was treated as being a multi-zone building, with 7 significant thermal zones on the first floor. At any of them, indoor Temperature (T Indoor (°C)) data were obtained from 1 h time-step simulations. And, due to ASHRAE 55 requirements of permanent regime, all those values were considered to be constant along the following 1 h interval.
Thermal comfort evaluation was accomplished with ASHRAE Thermal Comfort Tool. So, only the 3 following inputs were requested by the adaptative model: (1) Indoor Air Temperature (T Indoor (°C)), which was obtained from TRNSYS 17 simulations. (2) Mean Radiant Temperature (T Mean Radiant (°C)), which was assumed to be equal to T Indoor (°C). (3) Mean Outdoor Temperature (T Mean Outdoor (°C)), which was provided by Meteonorm 7.1 climate database.
3. Results and Discussion
The presence of sunspaces has proved significant at contiguous thermal zones (1, 2, 4, 5 and 7), although merely anecdotic at the others (3 and 6) (Figure 2 and Figure 3).
The study interval is a four weeks, non-continuous one. Any of the chosen weeks (from 22 to 28, March, June, September and December, 2017) is meant to be representative of a different season weather condition. Inherent T Indoor (°C) jump is never higher than 5.48 °C (thermal zone 2, in September 2017) and it never falls more than 1.54 °C (thermal zone 3, in September 2017) (Figure 2 and Figure 3b–e).
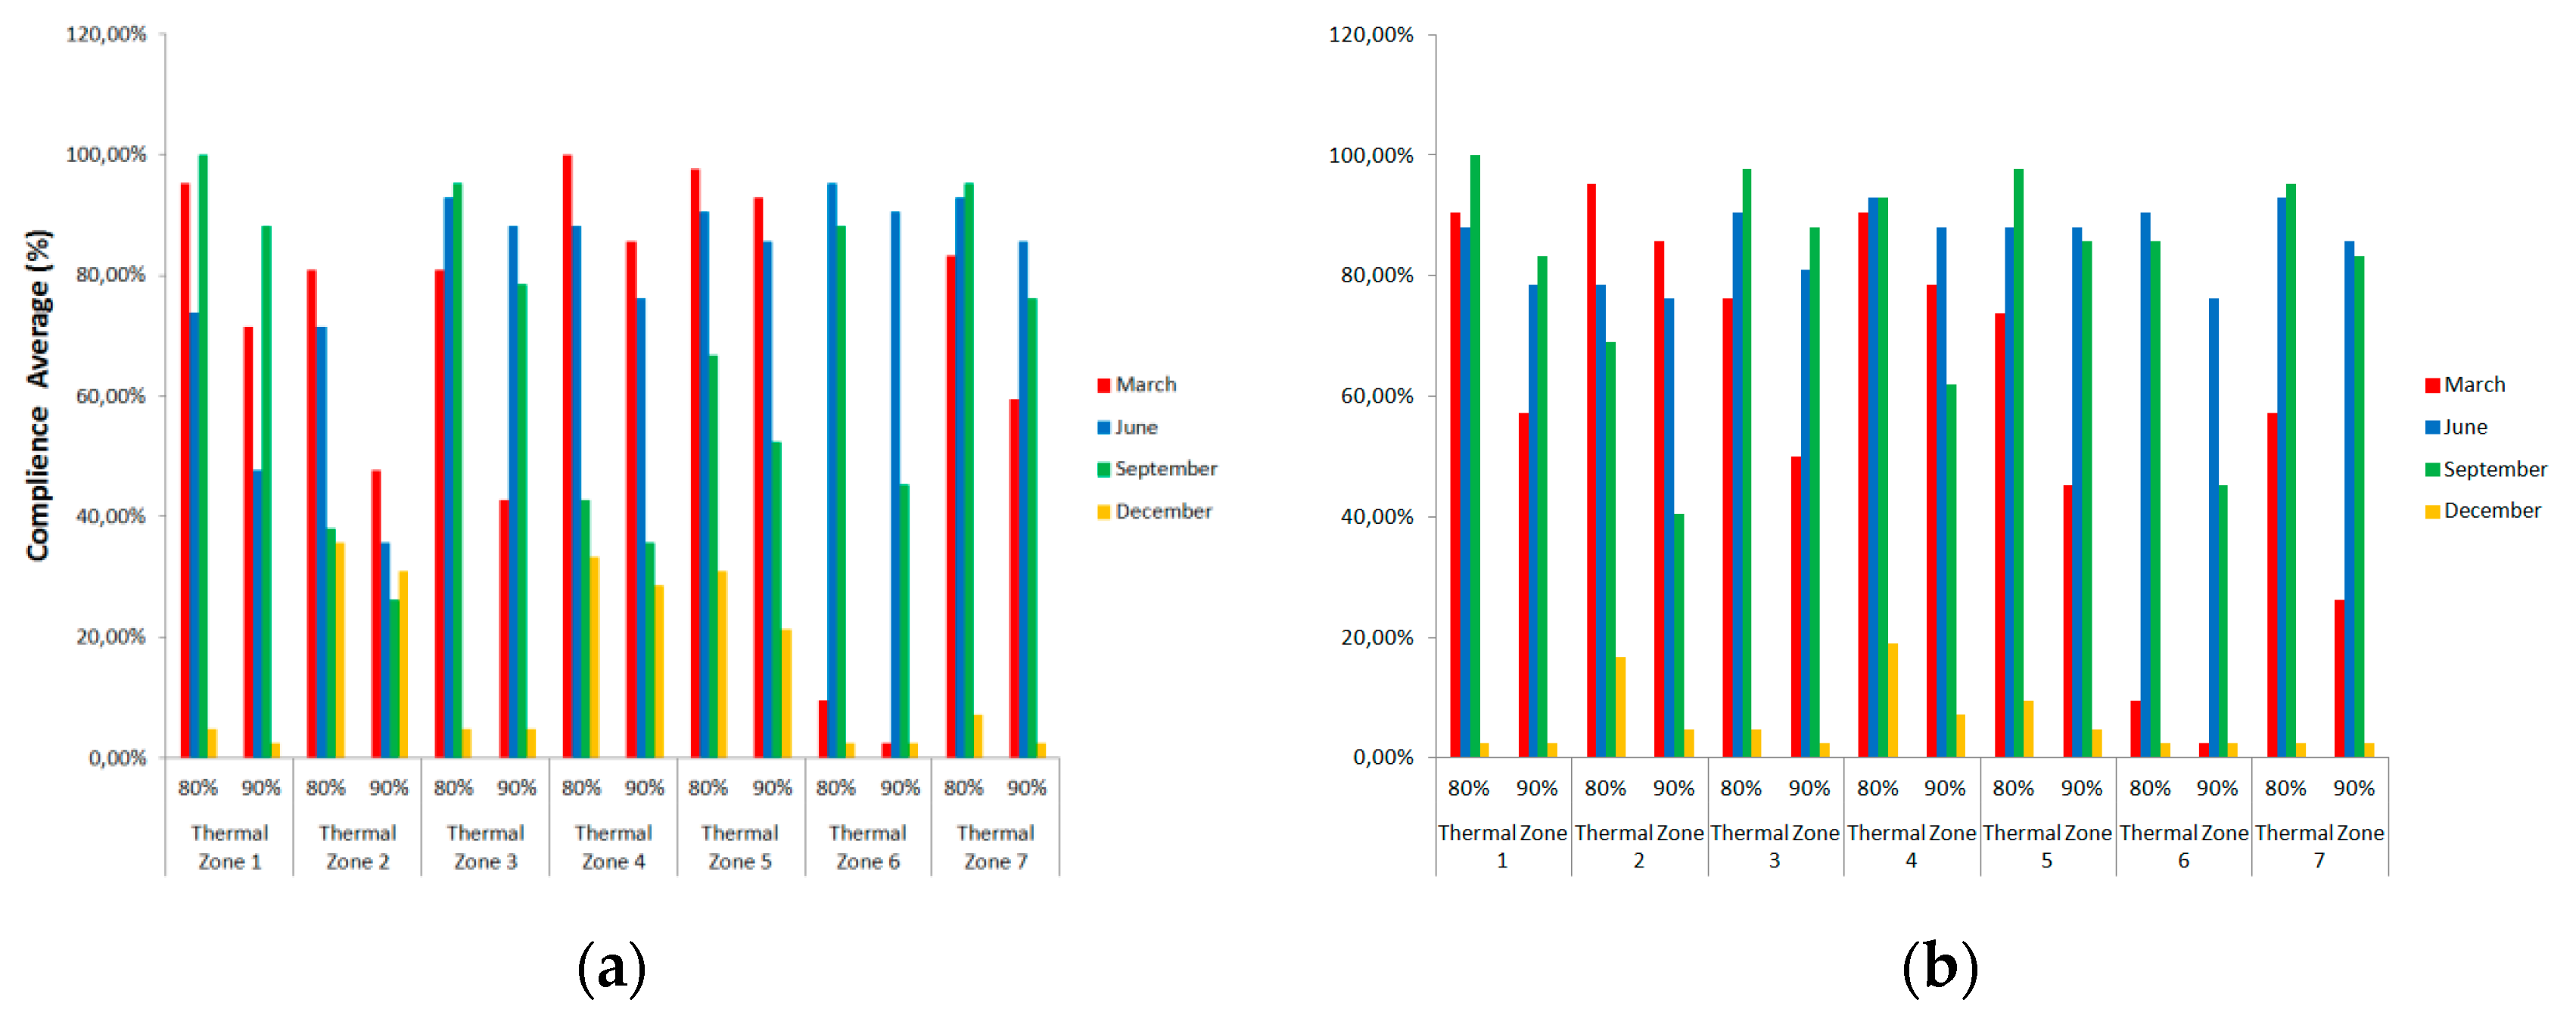
When it comes to thermal comfort, it was evaluated by determining the average of compliance with both 80% and 90% Adaptative ASHRAE 55 acceptability limits (Figure 4). Most significant (although reverse) results relate to both December and June time lapses. More precisely: (1) In December 2017 glazed balconies contribute to profit of the scarce solar radiation available and thermal comfort indexes either remain constant (such as in thermal zone 6) or grow up to a rate of 550% (thermal zone 2–90%) (Figure 4) (2) In June 2017 long day hours maximize the greenhouse effect in the gallerias, with the consequence of unwished fall of thermal comfort indexes at contiguous thermal zones (up to −53.3% in thermal zone 2–90%) and the rise of the same rates at not-contiguous ones (up to 18.75% in thermal zone 6-90%). The only exception takes place in thermal zone 7, where both 80% and 90% indexes remain unaltered (Figure 4).
With respect to March and September time lapses, sunspaces performance has a most diverse effect over inner thermal comfort condition. In both cases, 80% and 90% rates fall at south-oriented thermal zone 2 and remain practically unchanged in north-oriented thermal zone 6. But, beyond that: (1) In March 2017 thermal comfort indexes (with the only exception of thermal zone 3–90%) are increased up to a rate of 127.27%, in thermal zone 7–90% (Figure 4). (2) In September 2017 thermal comfort rates are significantly reduced in thermal zones 3, 4 and 5 (up to 53.85% in thermal zone 4–80%) and remain almost unchanged at thermal zones 1 and 7 (Figure 4).
4. Conclusions
The traditional south-oriented disposition of gallerias has proved to be a good passive measure for thermal comfort improvement during the coldest months of the year. Unfortunately, their performance fades during the rest of the year, most particularly during the summer season.
Author Contributions
S.L.C., B.F.D. and C.L.G. conceived and designed the case study; S.L.C. performed the modeling; S.L.C. and B.F.D. analyzed the data; C.L.G. contributed with TRNSYS 17, Meteonorm 7.1 and ASHRAE 55 software packs; S.L.C. wrote the paper.
Conflicts of Interest
The authors declare no conflict of interest.
References
- Alfano, F.R.A.; Olesen, B.W.; Palella, B.I.; Riccio, G. Thermal comfort: Design and assessment for energy saving. Energy Build. 2014, 81, 326–336. [Google Scholar] [CrossRef]
- Ortiz, J.; Fonseca, A.; Salom, J.; Garrido, N.; Fonseca, P.; Russo, V. Comfort and economic criteria for selecting passive measures for the energy refurbishment of residential buildings in Catalonia. Energy Build. 2016, 110, 195–210. [Google Scholar] [CrossRef]
- Attia, S.; Carlucci, S. Impact of different thermal comfort models on zero energy residential buildings in hot climates. Energy Build. 2015, 102, 117–128. [Google Scholar] [CrossRef]
- Karmann, C.; Schiavon, S.; Bauman, F. Thermal comfort in buildings using radiant vs. all-air systems: A critical literature review. Build. Environ. 2017, 111, 123–131. [Google Scholar] [CrossRef]
- Soutullo, S.; Enríquez, R.; Jiménez, M.J.; Heras, M.R. Thermal comfort evaluation in a mechanically ventilated office building located in a continental climate. Energy Build. 2014, 81, 424–429. [Google Scholar] [CrossRef]
- Almeida, R.M.S.F.; Ramos, N.M.M.; de Freitas, V.P. Thermal comfort models and pupils’ perception in free-running school buildings of a mild climate country. Energy Build. 2016, 111, 64–75. [Google Scholar] [CrossRef]
- Holopainen, R.; Tuomaala, P.; Hernandez, P.; Häkkinen, T.; Piira, K.; Piippo, J. Comfort assessment in the context of sustainable buildings: Comparison of simplified and detailed human thermal sensation methods. Build. Environ. 2014, 71, 60–70. [Google Scholar] [CrossRef]
- Fabbri, K. Thermal comfort evaluation in kindergarten: PMV and PPD measurement through datalogger and questionnaire. Build. Environ. 2013, 68, 202–214. [Google Scholar] [CrossRef]
- Nematchoua, M.K.; Tchinda, R.; Orosa, J.A. Adaptation and comparative study of thermal comfort in naturally ventilated classrooms and buildings in the wet tropical zones. Energy Build. 2014, 85, 321–328. [Google Scholar] [CrossRef]
Figure 1.
(a) External view to the TAH from the south. (b) Inside detail of south-east balcony. (c) Outside detail of south-west balcony.
Figure 1.
(a) External view to the TAH from the south. (b) Inside detail of south-east balcony. (c) Outside detail of south-west balcony.
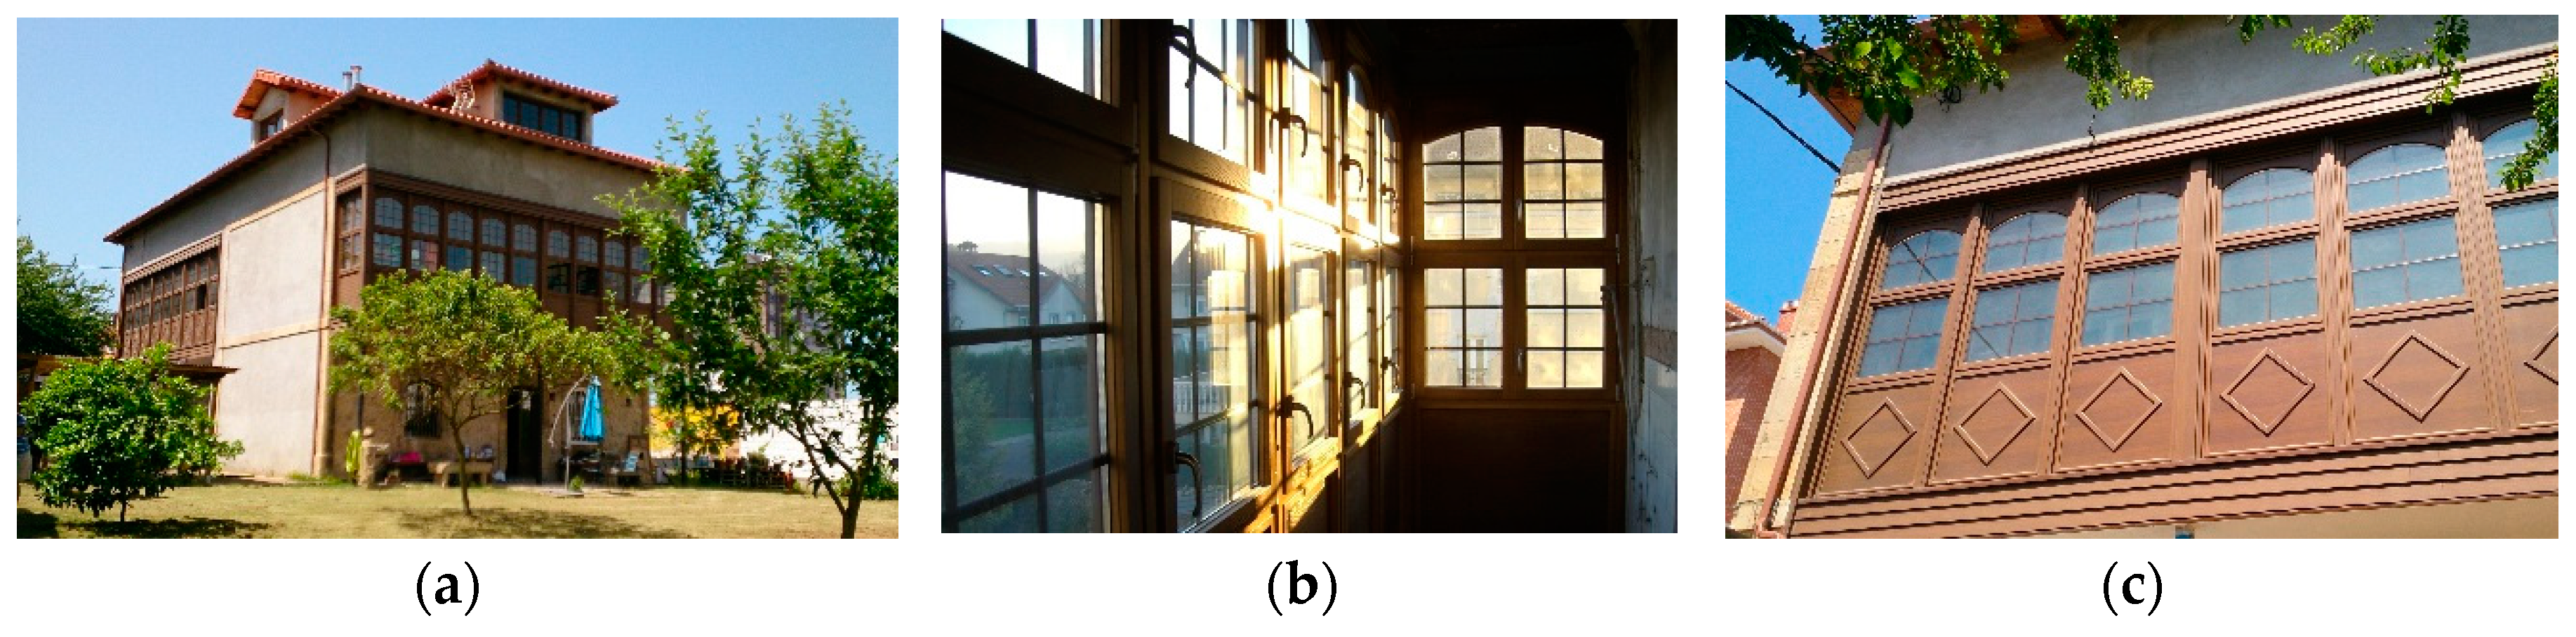
Figure 2.
(a) Thermal zones on the existing first floor of the TAH, numbered from 1 to 7. T Mean Outdoor and 1–7 Thermal zones T Indoor from 22 to 28: (a) March (b) June (c) September (d) December.
Figure 2.
(a) Thermal zones on the existing first floor of the TAH, numbered from 1 to 7. T Mean Outdoor and 1–7 Thermal zones T Indoor from 22 to 28: (a) March (b) June (c) September (d) December.
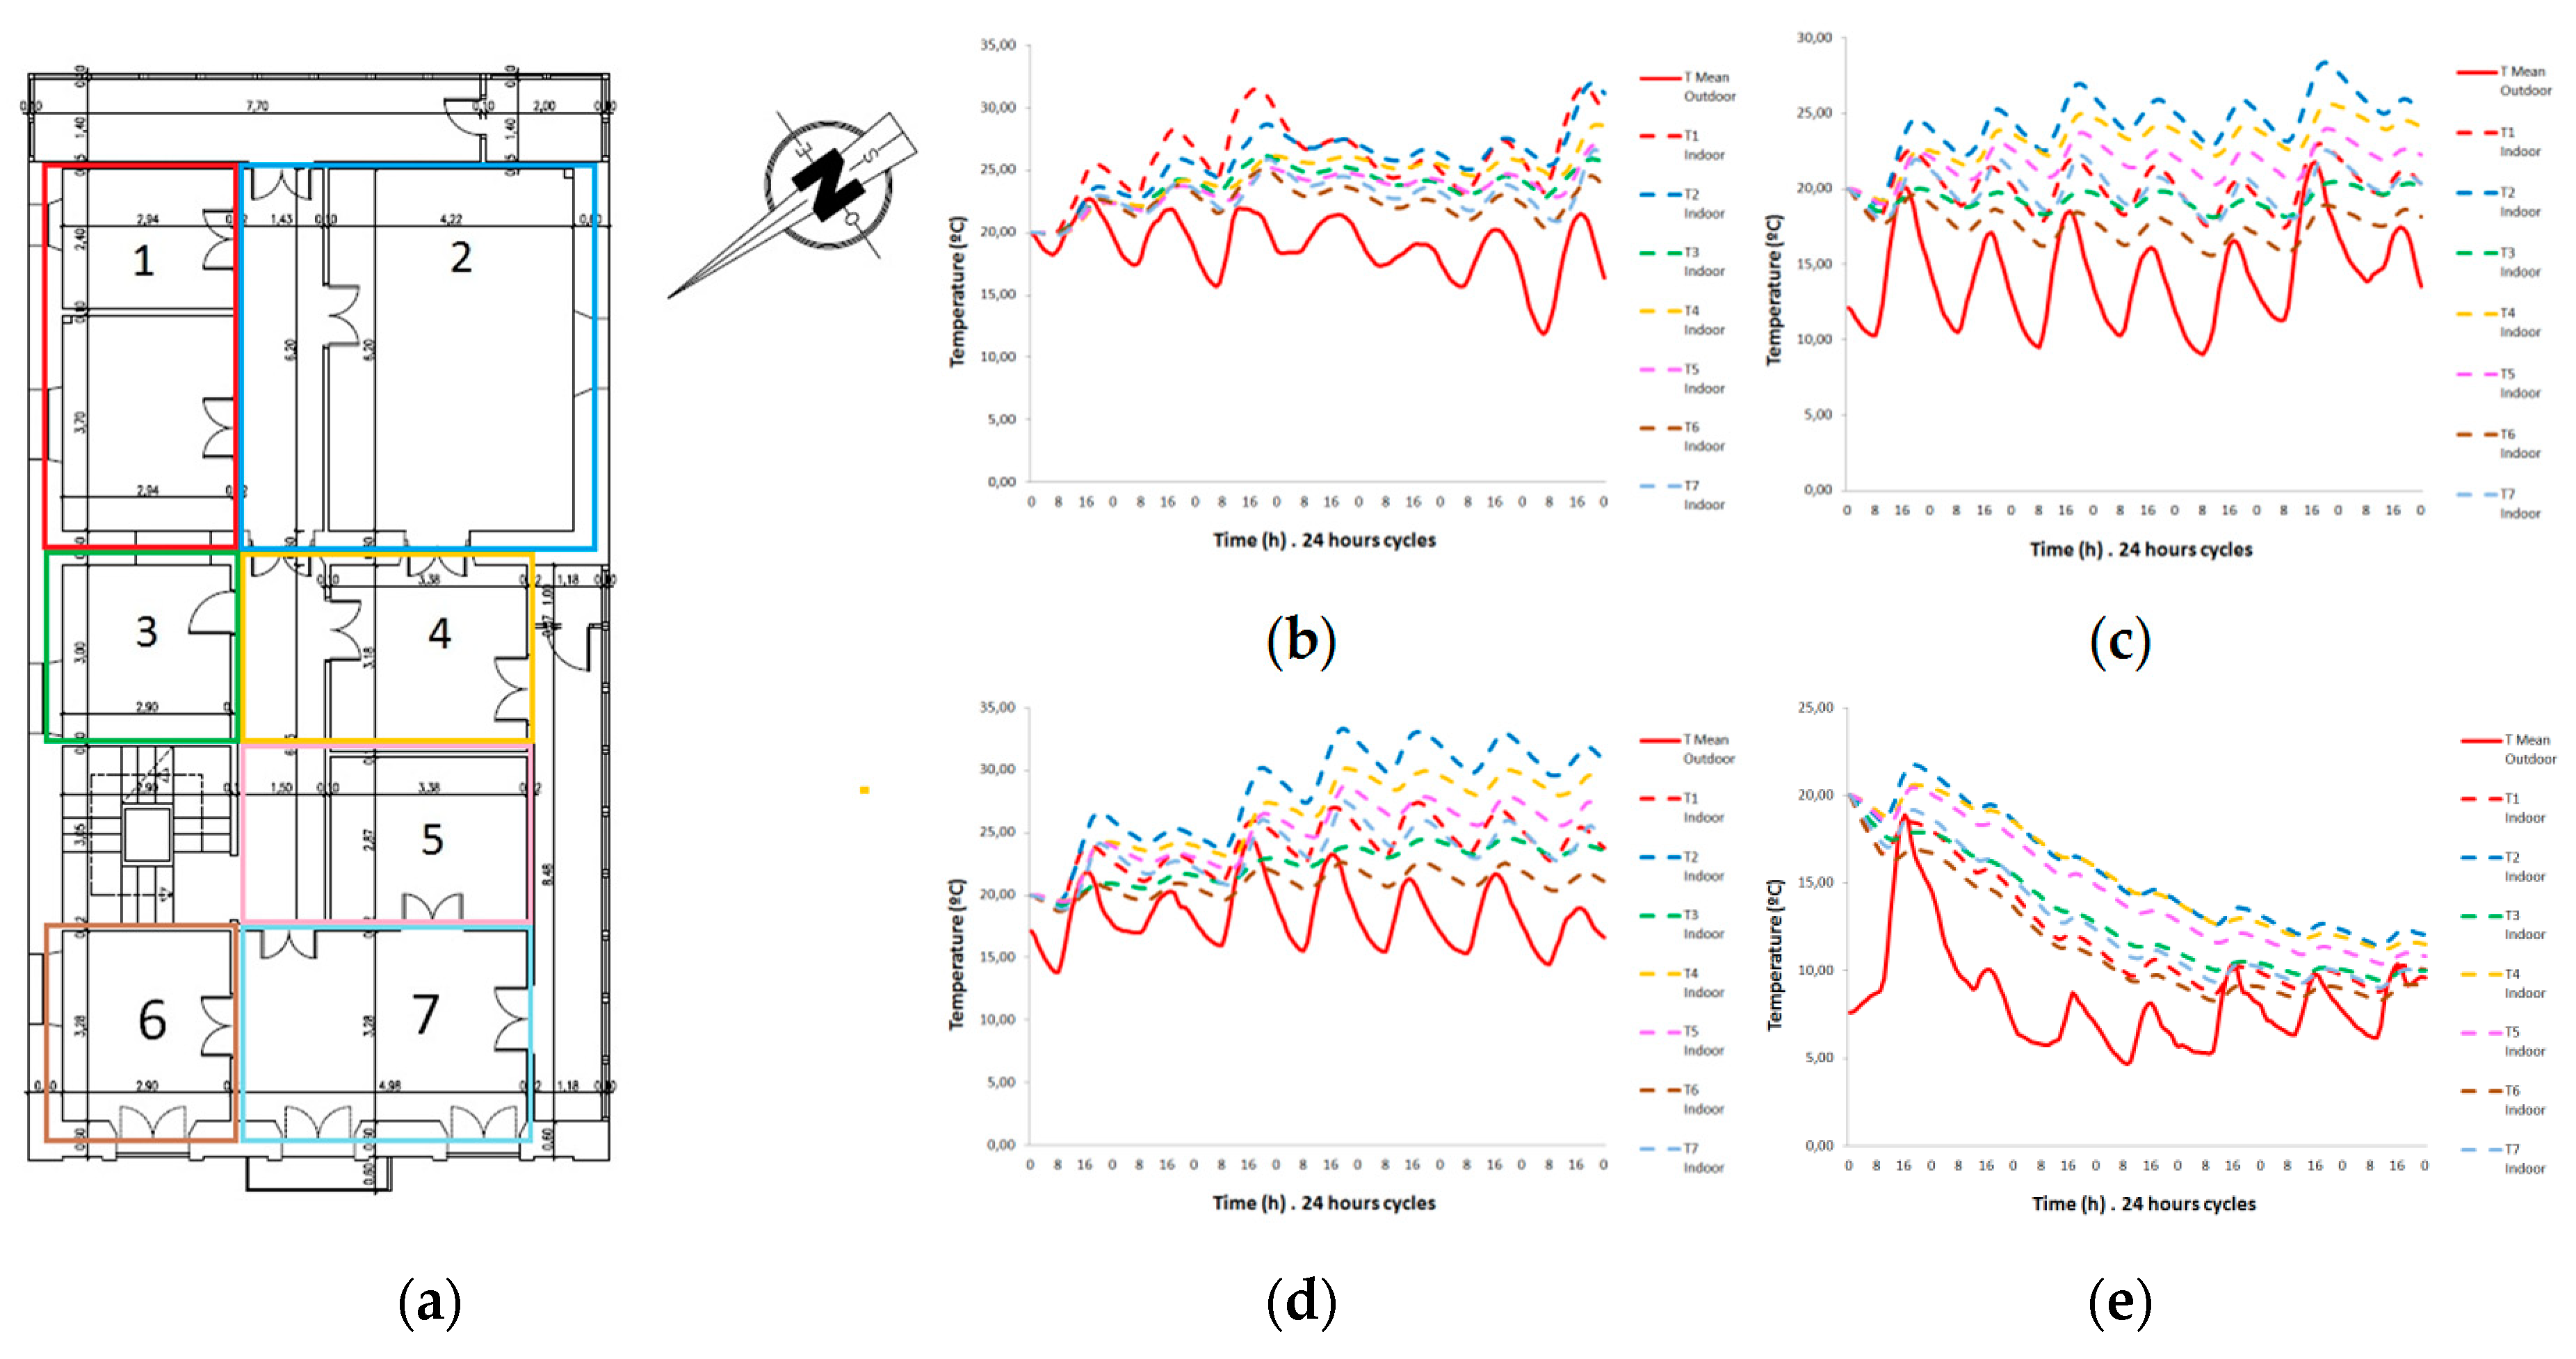
Figure 3.
(a) Thermal zones on the galleries-removed first floor of the TAH, numbered from 1 to 7. TMean Outdoor and 1–7 Thermal zones T Indoor from 22 to 28: (a) March (b) June (c) September (d) December.
Figure 3.
(a) Thermal zones on the galleries-removed first floor of the TAH, numbered from 1 to 7. TMean Outdoor and 1–7 Thermal zones T Indoor from 22 to 28: (a) March (b) June (c) September (d) December.
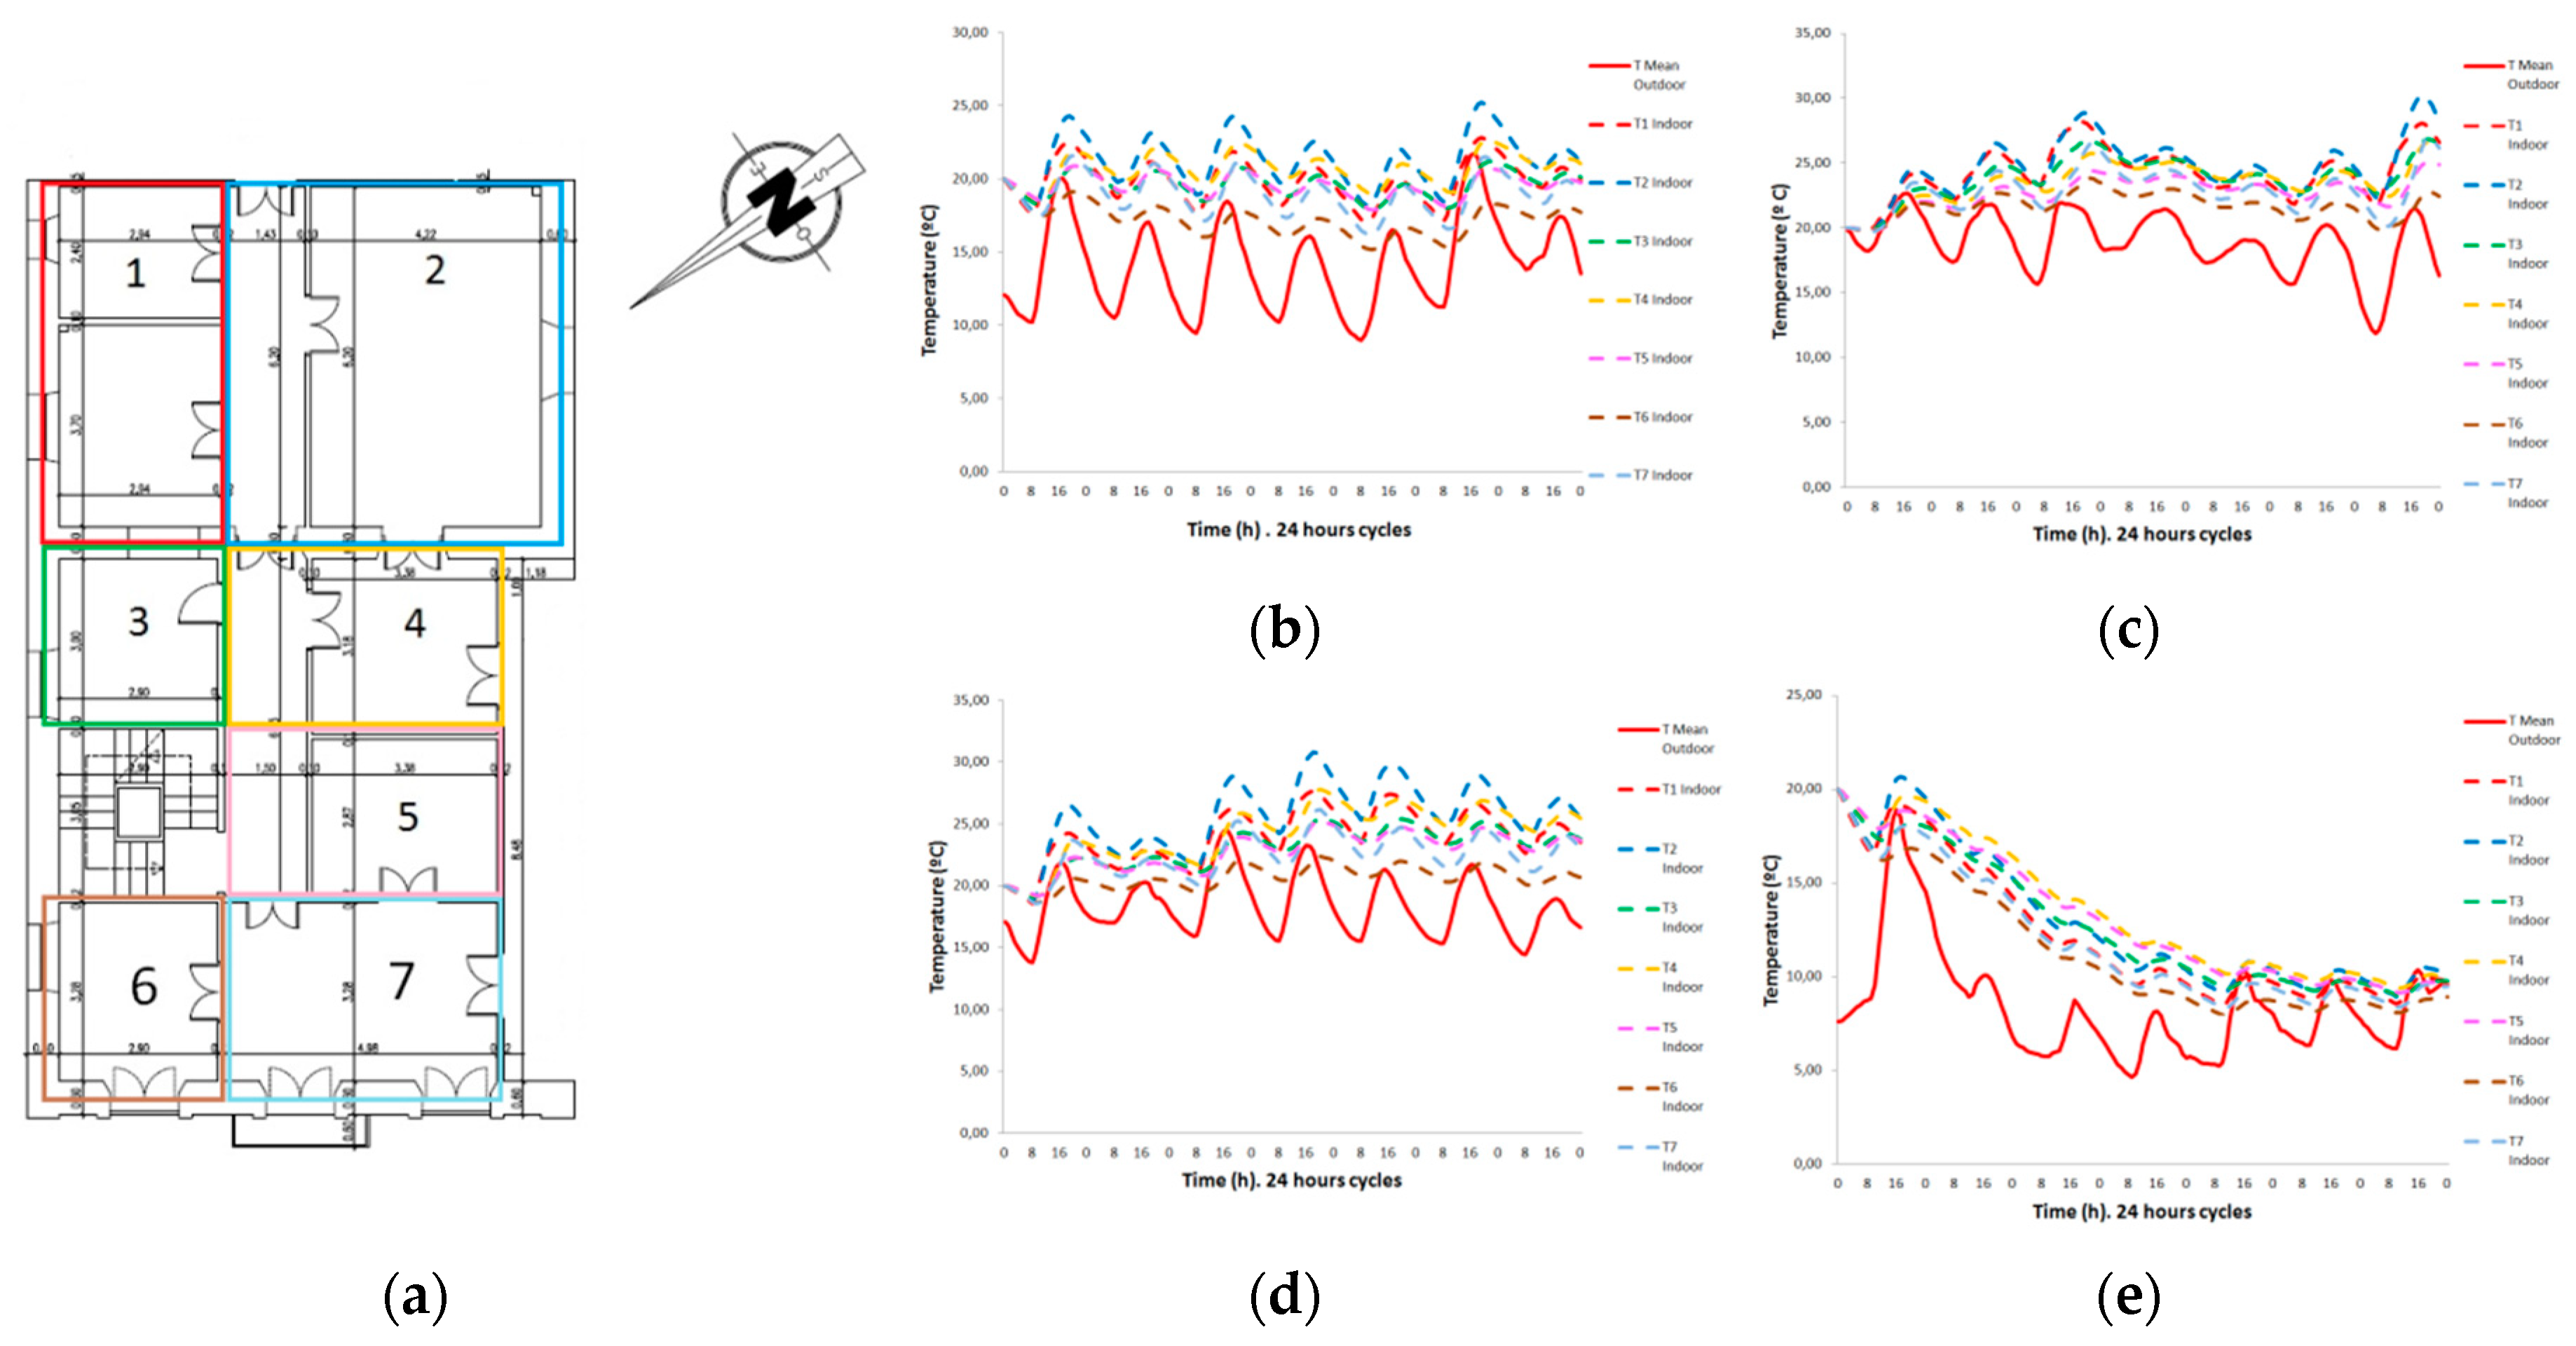
Figure 4.
Rate of compliance of 80% and 90% Adaptative ASHRAE 55 acceptability limits, at 1–7 thermal zones on the first floor of the TAH: (a) With galleries. (b) Without galleries.
Figure 4.
Rate of compliance of 80% and 90% Adaptative ASHRAE 55 acceptability limits, at 1–7 thermal zones on the first floor of the TAH: (a) With galleries. (b) Without galleries.
Publisher’s Note: MDPI stays neutral with regard to jurisdictional claims in published maps and institutional affiliations. |
© 2018 by the authors. Licensee MDPI, Basel, Switzerland. This article is an open access article distributed under the terms and conditions of the Creative Commons Attribution (CC BY) license (https://creativecommons.org/licenses/by/4.0/).
Share and Cite
MDPI and ACS Style
Lage-Cal, S.; Folgueras-Díaz, M.B.; Luengo-García, J.C. Influence of Attached Sunspaces on Indoor Thermal Comfort. The Case Study of a Traditional Asturian House. Proceedings 2018, 2, 1392. https://doi.org/10.3390/proceedings2231392
AMA Style
Lage-Cal S, Folgueras-Díaz MB, Luengo-García JC. Influence of Attached Sunspaces on Indoor Thermal Comfort. The Case Study of a Traditional Asturian House. Proceedings. 2018; 2(23):1392. https://doi.org/10.3390/proceedings2231392
Chicago/Turabian StyleLage-Cal, Susana, M. B. Folgueras-Díaz, and Juan Carlos Luengo-García. 2018. "Influence of Attached Sunspaces on Indoor Thermal Comfort. The Case Study of a Traditional Asturian House" Proceedings 2, no. 23: 1392. https://doi.org/10.3390/proceedings2231392