Proceeding Paper

Environmental Monitoring Integrated with a Proactive Marine Information System †

Institute of Information Science and Technologies, National Research Council of Italy, Via Moruzzi, 1-56124 Pisa, Italy
*
Author to whom correspondence should be addressed.
Presented at the International Workshop on Computational Intelligence for Multimedia Understanding (IWCIM), Kos Island, Greece, 2 September 2017.
Proceedings 2018, 2(2), 98; https://doi.org/10.3390/proceedings2020098
Published: 8 January 2018

Abstract

:
In the framework of environmental monitoring, the remote detection and monitoring of oil spills at sea is an important ability due to the high demand of oil based products. This situation causes, that shipping routes are very crowded and the likelihood of oil slicks occurring is also increasing. In this paper we propose a fully integrated and inter-operable information system which can act as a valuable monitoring tool. Such a marine information system is able to monitor ship traffic and marine operators by integrating heterogeneous signals and data through sensing capabilities from a variety of electronic sensors, along with geo-positioning tools, and through a communication infrastructure. This system is able to transfer the integrated data, freely and seamlessly, between different elements of the system itself (and their users). The system also provides a set of decision support services capable of performing functionalities which can act as a support for decision makers.

1. Introduction

The increasing importance of petroleum products and its principal mean of transportation through the sea, raised the concern on maritime safety and environment protection, leading to a greater interest in frameworks for remotely detecting oil spill at sea. The main approaches usually focus on large oil spills while smaller ones as well as operational discharges in regional areas, are more difficult to detect, despite their importance, especially in protected areas of great environmental value [1]. Nowadays, classical remote sensing frameworks can be enriched by adding information collected in situ thanks to various different sensors and exploiting innovative methods for data integration and correlation [2]. This paper addresses these issues by proposing an integrated and inter-operable information system based on acquired data from a variety of electronic sensors. In particular, the proposed Marine Information System (MIS) integrates classical SAR satellite processed data [3], with multi-spectral aerial data, as well as environmental data from in situ monitoring stations (e.g., placed on static and floating buoys) [4], and dynamic data acquired from in situ mobile sources (e.g., Autonomous Underwater Vehicles (AUVs) equipped with sensing modules). The designed MIS provides a collection of environmental Decision Support Services (EDSS), for (i) automatically monitoring the overall environmental situation, (ii) quantitatively representing environmental risk factors and (iii) proactively notifying events that deserve the consideration of end users. A dynamic risk map is included, and its computational model is presented.
The aggregated risk map is the most effective environmental monitoring method, allowing to have an outlook of the situation in the monitored area, while its automatic analysis—performed by intelligent agents—allows the delivery of proactive alerts to local authorities in charge of monitoring. The presented system has been developed within the work of FP7 Project Argomarine, and its efficiency demonstrated during extensive tests held in Greece and Italy. In the following, first the global architecture of the system is presented. Then the dynamic risk map model is presented. Afterwards, the provided proactive services for environmental monitoring are presented. At the end the performed field tests are presented and the model and its results discussed.

2. MIS Architecture

The MIS has been designed able to gather data from a number of monitoring devices deployed in the controlled sites, aiming at detecting and managing marine pollution events. Thus, the MIS exploits a set of adequate IT tools for integrating data, information and knowledge from various sources pertained to the marine areas of interest. More precisely, the MIS has been conceived as a connected group of subsystems devoted to store data, provide decision-support, data mining and analysis over data warehouses functionalities, as well as a web-GIS portal for the access and usage of products and services released to end-users. Products are herein considered as the marine environmental data acquired by the system or result of their processing; while the services are the processing facilities supplied by the system. The system has to deal with all these kinds of knowledge in order to effectively operate in the environmental management process [5], which typically consists of four activities in the following order: hazard identification, risk assessment, risk evaluation and intervention. The MIS aims at being very effective in managing and organizing quick solutions to severe and complex environmental problems. In order to develop the MIS following INSPIRE and GMES recommendations [6], the modalities to communicate and interact among systems paying specific attention on how information flows within the system: the efficient management of the information flow is a crucial point to guarantee and the interoperability among the different components. MIS architecture was designed as a set of independent and re-configurable units. This aspect guarantees system modularity, interoperability and portability: each single unit could be re-designed, or its internal components could be modified in order to fit to specific different domains of application (or case study), without the need to re-design the whole architecture [7]. Figure 1 shows the MIS architectural design, where the composing units and sub-components are represented, along with the communication paths that exist and are needed for the MIS to work.
The Environmental Decision Support System component (EDSS) enriches the MIS with intelligence capabilities. EDSS analyzes and combines multi-source data (coming from both sensors and processing subsystems) in order to detect and monitor pollution accidents. In order to fulfill its task, the EDSS requires the understanding of the environmental problem domain and the identification of the domain experts and authorities to cooperate with. According to the specific problem to be addressed, the EDSS has been conceived as a three levels structure; each level is a task which EDSS has to fulfill.
  • Data Gathering: EDSS has to take into account a large variety of data. These data gathered, even in real-time condition, from different sensors are: SAR and hyperspectral images and interpretative reports, data collected in-situ by buoys or underwater autonomous vehicles (such as weather condition, wave and e-nose), weather forecast data, simulation models, and maritime traffic.
  • Diagnosis and/or Prediction: Risk analysis models are applied for diagnosis and prediction. Gathered data are fused and related together considering the site characteristics aiming at detecting oil spill events and their evolution.
  • Decision Support: Support to decision is supplied in terms of an optimized plan of exploitation of the available resources to accurately confirm the event and issue an alert. Further information about the oil spill are presented together in order to precisely address the event and provide an useful aid for the choice of best intervention policies to be adopted.

3. Dynamic Risk Map Model

In this section the developed model for providing a near real-time risk assessment through a map visualization will be detailed.
A global risk estimation index is usually derived by multiplying the probability of occurrence of various adverse events by a factor representing the negativity (e.g., environmental damage) of each consequence. In our method we extend this model by computing local risk estimates for each point in a geographical region of interest [8]. The computed point-wise estimates can then be gathered and represented in a thematic map of risk for the region. Among the data integrated into the MIS, a selection has been made to extract those parts of information which might be relevant in risk analysis for the control of oil spills and other pollution events. Those variables are presented in the following subsections.

3.1. Maritime Traffic

Maritime traffic information derived either by real-time AIS messages and by remote sensing images is considered [9]. Beside vessel position which is mandatory, the speed over ground, the course and the typology (e.g., cargo, tanker, and passenger ships) are also considered when available. Indeed, a Kernel Density Estimation (KDE) approach has been followed [10]. In this approach, each vessel v contributes to an increase of traffic-related risk R t r in a region around v whose shape and modulation are determined by a kernel function K. The traffic-related risk R t r in the point q at time t can be written as:
R t r ( q , t ) = v w v · K ( p v , q )
where the sum runs over all the vessels which reported their position in the time window [ t τ , t ] where τ is a configurable parameter, and w v is a weight associated to v depending on the vessel speed, course and typology. As for the kernel K, a common option is to use a Gaussian kernel.

3.2. Oil Spill Reports

Our model assumes that each oil spill report s, obtained from the image sensors analysis, provides a two-dimensional region R e g s representing the area covered by the pollutant, a degree of confidence d s , and a timestamp t s representing detection time. Let χ s be the characteristic function of the region R e g s . We let the oil spill report-related risk R s p :
R s p ( q , t ) = s w s · ( Γ χ s ) ( q ) · exp ( λ | t t s | )
where the sum runs over all oil spill reports, w s is a weight proportional to the confidence d s and Γ is a convolution kernel. Notice that the convolution Γ χ s represents the original region R e g s smeared by the convolution kernel. Kernel Γ can be designed so as to optimally control the influence area of the report. The last exponential in the equation above controls the time validity of the report. The validity of the report is maximal for t = t s (i.e., when the report has just been issued), while for t > > t s (i.e., when the report becomes obsolete) the contribution becomes negligible and it is omitted in practice.

3.3. In Situ Observations

The various sensors (e.g., static and floating buoys, AUVs) deployed in the region of interest, permit the collection of observations that are another variable in the model for the risk assessment [11]. Considering that Equation (2) works also when s is the characteristic function of a point, we may define the in situ observation related risk as:
R s i t u ( q , t ) = s w s · ( Γ χ s ) ( q ) · exp ( λ | t t s | )
where the sum runs over all observations s, w s is the weight of the observation and Γ is again a convolution kernel.

3.4. Local Monitoring Coverage

As the latter variable of the model we define the quality of monitoring. In order to give an estimation to the quality of monitoring coverage, we assume that each monitoring resource m available on the field in position p m has an effect in the nearby area with a strength that diminishes with distance. We define the quality of monitoring Q m o n ( q , t ) at point q as:
Q m o n ( q , t ) = m w m · K ( p m , q )
where the sum runs over all the monitoring resources m which are operational in the time window [ t τ , t ] where τ is a configurable parameter and w m is a weight associated to m depending on the characteristics of the monitoring resource (autonomy, mitigation power, …). K is a convolution kernel such as a Gaussian kernel.

3.5. Risk Assessment and Multi-Scale Visualization

Finally the global model for the dynamic risk assessment can be described by a composition of the various risk terms from (1)–(4), namely we define the risk R ( q , t ) in point q at time t as:
R ( q , t ) = α t r R t r ( q , t ) + α s p R s p ( q , t ) + α s i t u R s i t u ( q , t ) + α m o n Q m o n ( q , t )
where α are positive coefficients determined heuristically for each of the variables. The function R ( q , t ) in (5) can be plotted as a dynamic map of risk. Its definition allows the point wise evaluation of the function R. However, the visualization of the region of interest has been divided by means of grids having different steps. In particular, we modeled a three layered grid; each square in the grid is represented by a single value of risk. In this way, by visualizing the coarsest grid (i.e., layer 1), it is possible to appreciate the areas that demands for more attention since they are denoted by an incremented risk. Then, it is possible to focus on such areas by visualizing the grids at a finer scale (i.e., layer 3).

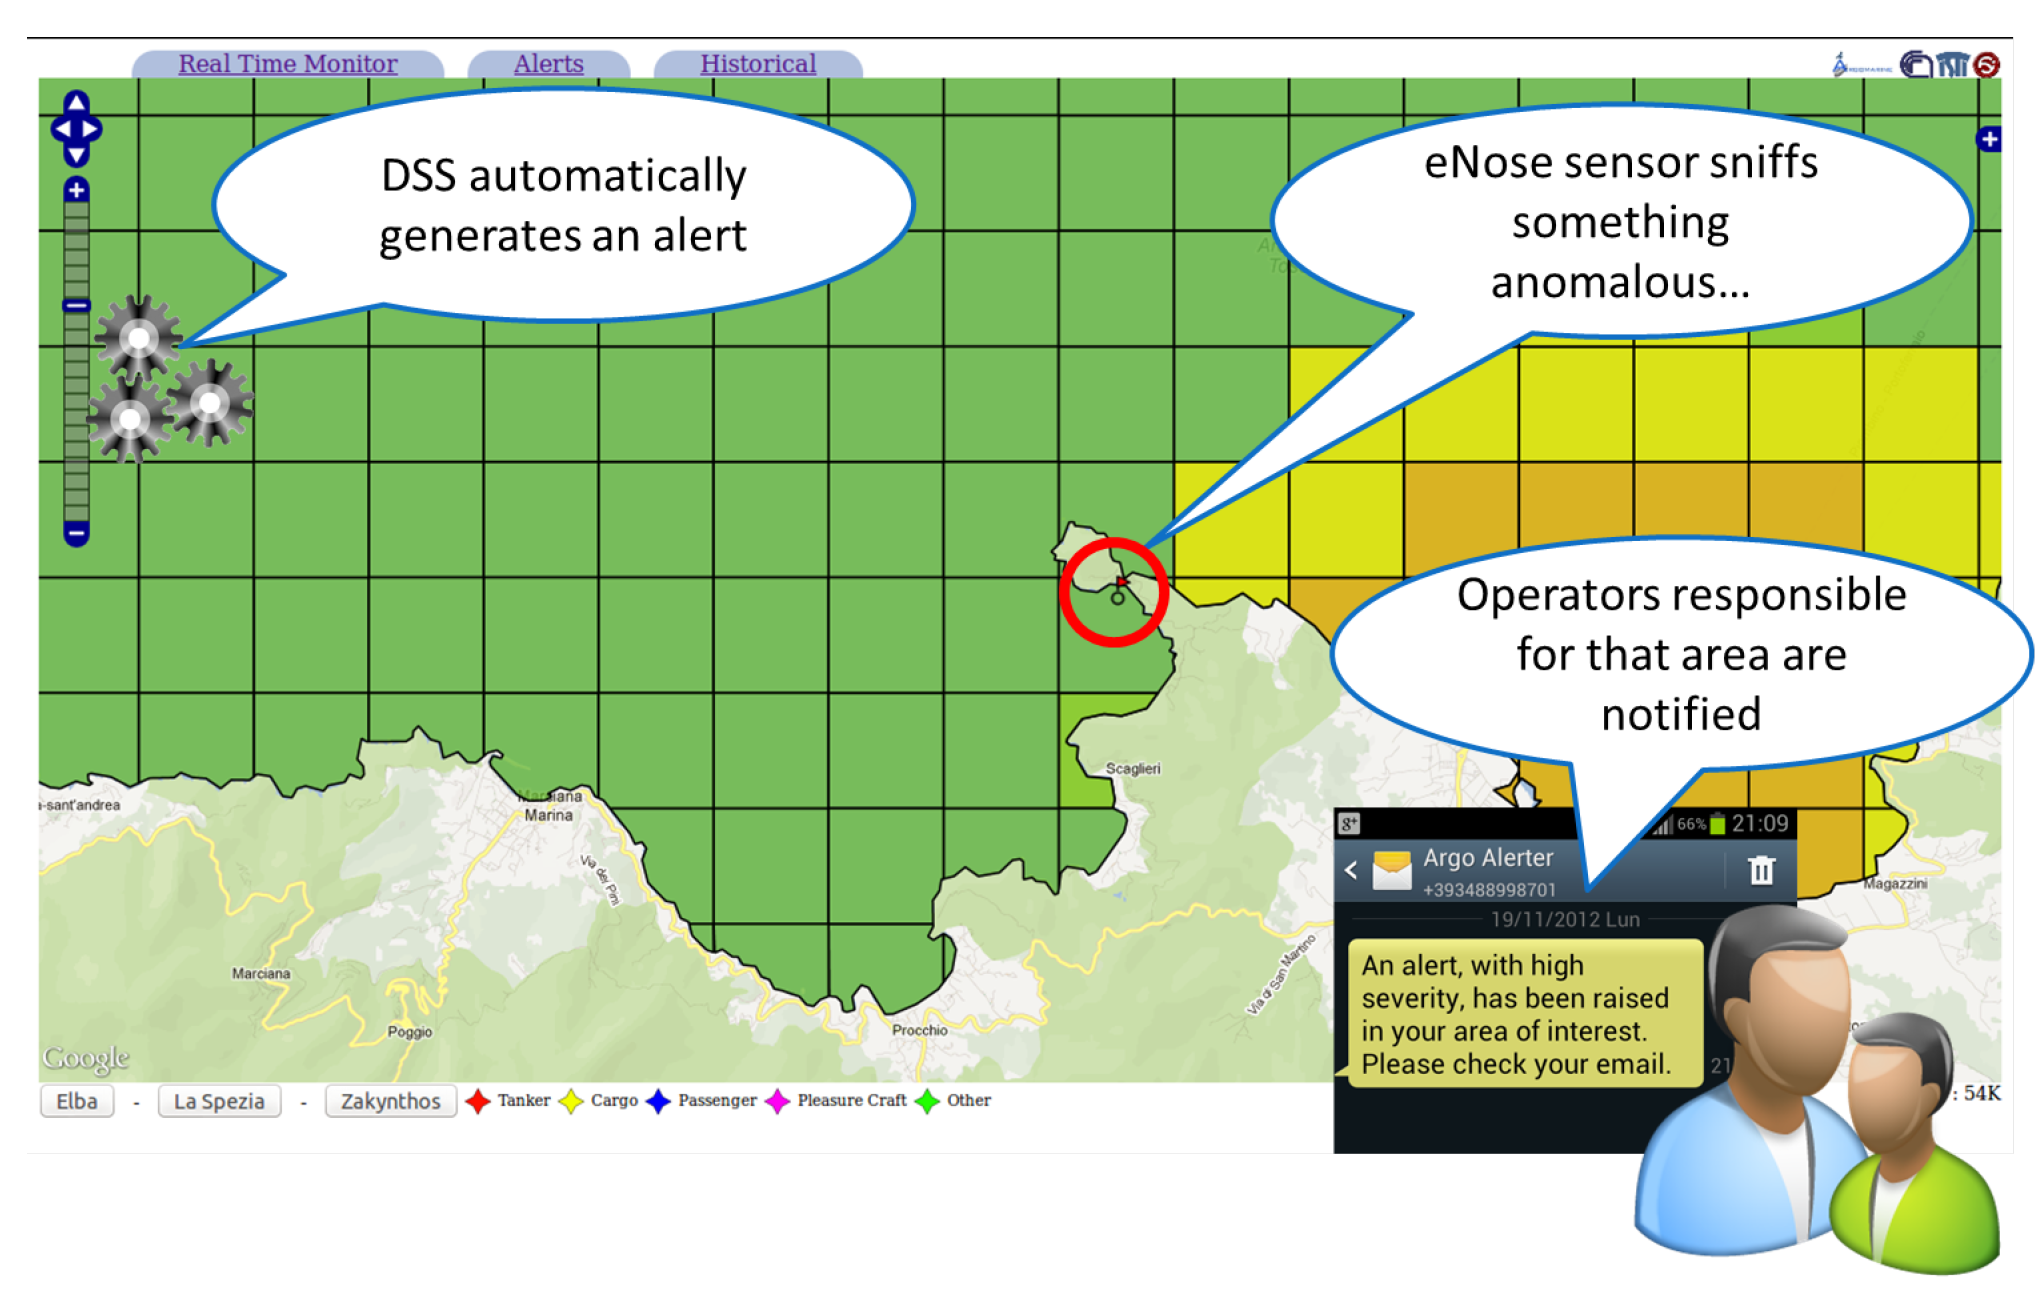
4. Proactive Services for Environmental Monitoring

With the aim of improving environmental monitoring, not just a simple observation, a set of services has been designed and implemented. These services provide a continuous monitoring of the region of interest, but moreover, they supply tools for the dynamic management of monitoring resources and on the provision of proactive services for user notification. Every designed service is implemented by an intelligent software agent, which is autonomous and reconfigurable. Each service has a number of probes for fetching data from the MIS and a set of preconfigured actions. Its work-flow is based on a logic that follows the condition-action rule. As examples, the work-flow may be requesting the acquisition of further new data, or performing other simulations.
A quite important example is given by the service dedicated to resource management, which is in charge of controlling adaptively the sampling frequency of the in situ resources. Considering that buoys and AUVs are battery powered, thus having strict energy constraints to be taken into account, the sensor sampling rate and time periods for data transfer via radio, can be pro-actively delegated to the service, which checks the overall risk status around the resource as given by the risk map and its trends as well as the status of batteries and energy harvesting system; if the risk is low and no increment in risk has been observed, sampling rate can be reduced; similarly, rates can be increased in case of need, considering trade-offs with resource autonomy. The notification services (see Figure 1) are devoted to the current status analysis and to the issue of alerts in case some anomalies are detected. In particular, oil spill reports coming from image processing facilities and the computed risk map are monitored on 24 h basis by the services. In case the service receives a report with a high confidence, it generates an alert. Moreover, the proactive services consider both the absolute value of the risk and its trend [7]. When issuing an alert, a service task is also to contact the most suitable authority selected automatically on the basis of proximity criterion, the contact occurs with all relevant information regarding the event.

5. Field Tests and Results

The described MIS has been extensively tested in different areas of interest, namely at Zakynthos island in Greece and Elba Island in Tuscany, Italy. These field tests envisaged the acquisition and processing of data coming from heterogeneous resources as well as to the provision of decision support services. In detail, data has been collected from (i) AIS receivers, (ii) airborne and space-borne image sensors and their interpretative reports regarding both oil spills and vessel detection, (iii) static ad drifting buoys, (iv) eNose mounted on static buoys and AUVs and (v) hand-held spectroradiometer. One of the goals has been to perform stress tests using dummy data, for understanding the limits of the platform. The obtained results have shown that such a system has proved to be adequate to handle data for local regions. As long as the simulated packets have been inputted into the MIS for artificially reproducing the case in which the eNose perceives the presence of hydrocarbons in the nearby area. As shown in Figure 2, such an event triggers a list of actions; in particular the risk map is updated and the decision support services issue a notification to the authorities competent for the area. The proactive services on the basis of polled data and of the logic used by the services, were able to suggest for resource management and to issue alert notifications.
The above described methods for risk assessment have been run automatically at regular time intervals to produce risk maps. The maps were visualized by experienced users (an example of the appearance of the map at the layer 1 scale is given in Figure 3) as well as stored into a database. The users found the map to be very meaningful, to yield significant information and regarded it as a useful tool to better focus the attention on local areas requiring a more accurate monitoring.

6. Discussion and Conclusions

In this paper we presented an integrated and inter-operable Marine Information System based on data acquired from a variety of electronic sensors along with geo-positioning tools, suitable for local authorities and stakeholders in the environmental monitoring and management of sea and coastal oil pollutions. The implemented MIS is enhanced with various environmental Decision Support Services, aiming at an automatic screening of the real-time situation. The interface provides a quantitative representation of the risk factors, and proactive notification of events and suggestion for the support to the intervention chain in the management of pollution situations. The architecture of the implemented MIS has been presented, followed by specifications on the methods used for real-time risk estimation and the services realized for environmental monitoring. Finally demonstration of the proposed system has been shown during extensive test exercises held in Italy and Greece.

Acknowledgments

This paper has been partially supported by the EU FP7 Project ARGOMARINE (Automatic oil-spill recognition and geopositioning integrated in a marine monitoring network, FP7-Transport-234096).

References

  1. Abascal, A.J.; Castanedo, S.; Medina, R.; Liste, M. Analysis of the reliability of a statistical oil spill response model. Mar. Pollut. Bull. 2010, 60, 2099–2110. [Google Scholar] [CrossRef] [PubMed]
  2. Jordi, A.; Ferrer, M.; Vizoso, G.; Orfila, A.; Basterretxea, G.; Casas, B.; Álvarez, A.; Roig, D.; Garau, B.; Martínez, M.; et al. Scientific management of Mediterranean coastal zone: A hybrid ocean forecasting system for oil spill and search and rescue operations. Mar. Pollut. Bull. 2006, 53, 361–368. [Google Scholar] [CrossRef] [PubMed]
  3. Ferraro, G.; Meyer-Roux, S.; Muellenhoff, O.; Pavliha, M.; Svetak, J.; Tarchi, D.; Topouzelis, K. Long term monitoring of oil spills in European seas. Int. J. Remote Sens. 2009, 30, 627–645. [Google Scholar] [CrossRef]
  4. Janeiro, J.; Zacharioudaki, A.; Sarhadi, E.; Neves, A.; Martins, F. Enhancing the management response to oil spills in the Tuscany Archipelago through operational modelling. Mar. Pollut. Bull. 2014, 85, 574–589. [Google Scholar] [CrossRef] [PubMed]
  5. Cortès, U.; Sànchez-Marrè, M.; Ceccaroni, L.; R-Roda, I.; Poch, M. Artificial intelligence and environmental decision support systems. Appl. Intell. 2000, 13, 77–91. [Google Scholar] [CrossRef]
  6. Directive, I. 2/EC of the European Parliament and of the Council of 14 March 2007 establishing an Infrastructure for Spatial Information in the European Community (INSPIRE); European Parliament and of the Council of the European Union: Strasbourg, France, 2007. [Google Scholar]
  7. Moroni, D.; Pieri, G.; Tampucci, M.; Salvetti, O. A proactive system for maritime environment monitoring. Mar. Pollut. Bull. 2016, 102, 316–322. [Google Scholar] [CrossRef] [PubMed]
  8. Cocco, M.; Colantonio, S.; D’Acunto, M.; Martinelli, M.; Moroni, D.; Pieri, G.; Salvetti, O.; Tampucci, M. Geomatrix model as new tool for improving oil spill surveillance. In International Conference on Instrumentation, Measurement, Circuits and Systems (ICIMCS 2011); ASME Press: New York, NY, USA, 2011. [Google Scholar]
  9. Martinelli, M.; Moroni, D.; Pieri, G.; Tampucci, M. A proactive gis infrastructure for environmental monitoring. In Proceedings of the Seventeenth International Water Technology Conference (IWTC17), Istanbul, Turkey, 5–7 November 2013. [Google Scholar]
  10. Laxhammar, R.; Falkman, G.; Sviestins, E. Anomaly detection in sea traffic-a comparison of the gaussian mixture model and the kernel density estimator. In Proceedings of the 12th International Conference on Information Fusion, Seattle, WA, USA, 6–9 July 2009; pp. 756–763. [Google Scholar]
  11. Moroni, D.; Pieri, G.; Salvetti, O.; Tampucci, M. Proactive marine information system for environmental monitoring. In Proceedings of the OCEANS 2015-Genova, Genoa, Italy, 18–21 May 2015; pp. 1–5. [Google Scholar]
Figure 1. The detailed architectural design of the MIS for environmental monitoring.
Proceedings 02 00098 g001
Figure 2. The interface during field tests showing an event from an eNose sniffing: transmitted to the MIS, the DSS generates a preliminary alert, and operators notified.
Proceedings 02 00098 g002
Figure 3. The web interface of the integrated MIS for environmental monitoring.
Proceedings 02 00098 g003
Publisher’s Note: MDPI stays neutral with regard to jurisdictional claims in published maps and institutional affiliations.

