Vehicle Logo Recognition with Reduced-Dimension SIFT Vectors Using Autoencoders †


1
Applied Informatics Department, Informatics Institute, Istanbul Technical University, 34469 Istanbul, Turkey
2
Department of Electronics and Communications Engineering, Graduate School of Science Engineering and Technology, Istanbul Technical University, 34469 Istanbul, Turkey
*
Author to whom correspondence should be addressed.
†
Presented at the International Workshop on Computational Intelligence for Multimedia Understanding (IWCIM), Kos Island, Greece, 2 September 2017.
Proceedings 2018, 2(2), 92; https://doi.org/10.3390/proceedings2020092
Published: 9 January 2018
(This article belongs to the Proceedings of International Workshop on Computational Intelligence for Multimedia Understanding (IWCIM))
Abstract
:Vehicle logo recognition has become an important part of object recognition in recent years because of its usage in surveillance applications. In order to achieve a higher recognition rates, several methods are proposed, such as Scale Invariant Feature Transform (SIFT), convolutional neural networks, bag-of-words and their variations. A fast logo recognition method based on reduced-dimension SIFT vectors using autoencoders is proposed in this paper. Computational load is decreased by applying dimensionality reduction to SIFT feature vectors. Feature vectors of size 128 are reduced to 64 and 32 by employing two layer neural nets called vanilla autoencoders. Publicly available vehicle logo images are used for testing purposes. Results suggest that the proposed method needs half of the original SIFT based method’s memory requirement with decreased processing time per image in return of a decrease in the accuracy less than 20%.
1. Introduction
The well-known feature extraction method SIFT [1] is used for large number of tasks in computer vision that requires object recognition and point matching between different scenes. SIFT descriptors are translation, rotation and scale invariant, robust to illumination variations and very useful on real-world tasks. But matching process is expensive because SIFT feature vectors are 128 dimensional and calculating distance between these vectors is very time consuming. Several methods are proposed to improve comparing process [2,3,4,5]. In this study we represented 128 dimensional SIFT vectors in 32 and 64 dimensions with vanilla autoencoders.
We propose a SIFT method which is more time and memory efficient than traditional SIFT method for vehicle logo recognition.
2. SIFT
SIFT (scale invariant feature transform) is a successful method to find interest points in an image. It basically consists of four steps:
2.1. Scale Space Extrema Detection
Laplacian of Gaussian (LoG) which is a blob detector can be used to obtain different sized blobs, via different sigma values. But LoG is a costly function, hence a similar function which is Difference of Gaussians (DoG) is used with different sigma values. The difference of The Gaussian blurred images with different sigma values are obtained in DoG process. These new images are formed a pyramid over scale space. In this pyramid, local extrema are marked as possible keypoints.
2.2. Keypoint Localization
The extrema points consist of strong interest points, edge points and points that have low contrast. In order to get rid of the low-contrast points, points are firstly localized with more precision and then the points whose intensity value are less than a threshold, are removed. In order to get rid of the edge points, an algorithm that is similar to Harris corner detector is used.
2.3. Orientation Assignment
In order to have rotation invariant keypoints, the orientations are defined for each keypoint according to their neighborhood. This process consists of determining neighborhood, computing orientation histogram which covers 360 degrees, weighting the histogram, then taking the highest peak and values more than 80% of it in the histogram and finally computing orientation. Hence different oriented keypoints at the same location and scale are obtained.
2.4. Keypoint Descriptor
At the previous steps, the keypoints that have scale, orientation and image location information were obtained. In other words, the keypoints are now invariant to these variables. In this step descriptor for the local image region which is invariant to remaining variables such as illumination change and local shape distortion too, is calculated.
The obtained descriptors are 128 dimensional vectors. Information in the keypoint descriptor comes from 16 × 16 neighborhood of the keypoint. 8 bin orientation histogram value is computed for each 4 × 4 sized sub-blocks which are the pieces of 16 × 16 neighborhood.
3. Autoencoders
Autoencoders are neural networks that tries to generate its input with minimum difference. In other words, if weight and bias sets are W and b and input is x, the autoencoder tries to map input x to output x’ with hW,b(x) = x’. The goal is finding best set of parameters (W,b) that minimizes the difference between x and x’. Like other neural networks applications, trying to minimize x − x’ is a convex optimization problem and solved with gradient based methods.
Autoencoder neural network is an unsupervised learning algorithm, it takes no label. When autoencoder is shallow and vanilla type, it learns similar to PCAs. Stacking more layers of neurons makes it easier to find correlation between different components because each layer adds a nonlinear operation with activation function. However, if capacity of autoencoder is too large, network just copies instead of finding useful features.
Generally, there are several error functions used in autoencoders. Equations (1) and (2) are two frequently used error functions. Equation (1) is L2 norm and Equation (2) is cross entropy loss that is used when the input is bit probabilities,
where k is the index of hidden unit. In this study L2 norm is used as the error function. There are several autoencoder types such as sparse autoencoders, denoising autoencoders, and variational autoencoders. In this study we used vanilla autoencoders.
4. Method
In [1], after SIFT vectors are obtained, to compare vectors and find matchings, cosine distances were calculated. Instead of calculating cosine distance between 128 dimensional vectors, we use cosine distance between 64 dimensional vectors which are reduced vectors by autoencoders.
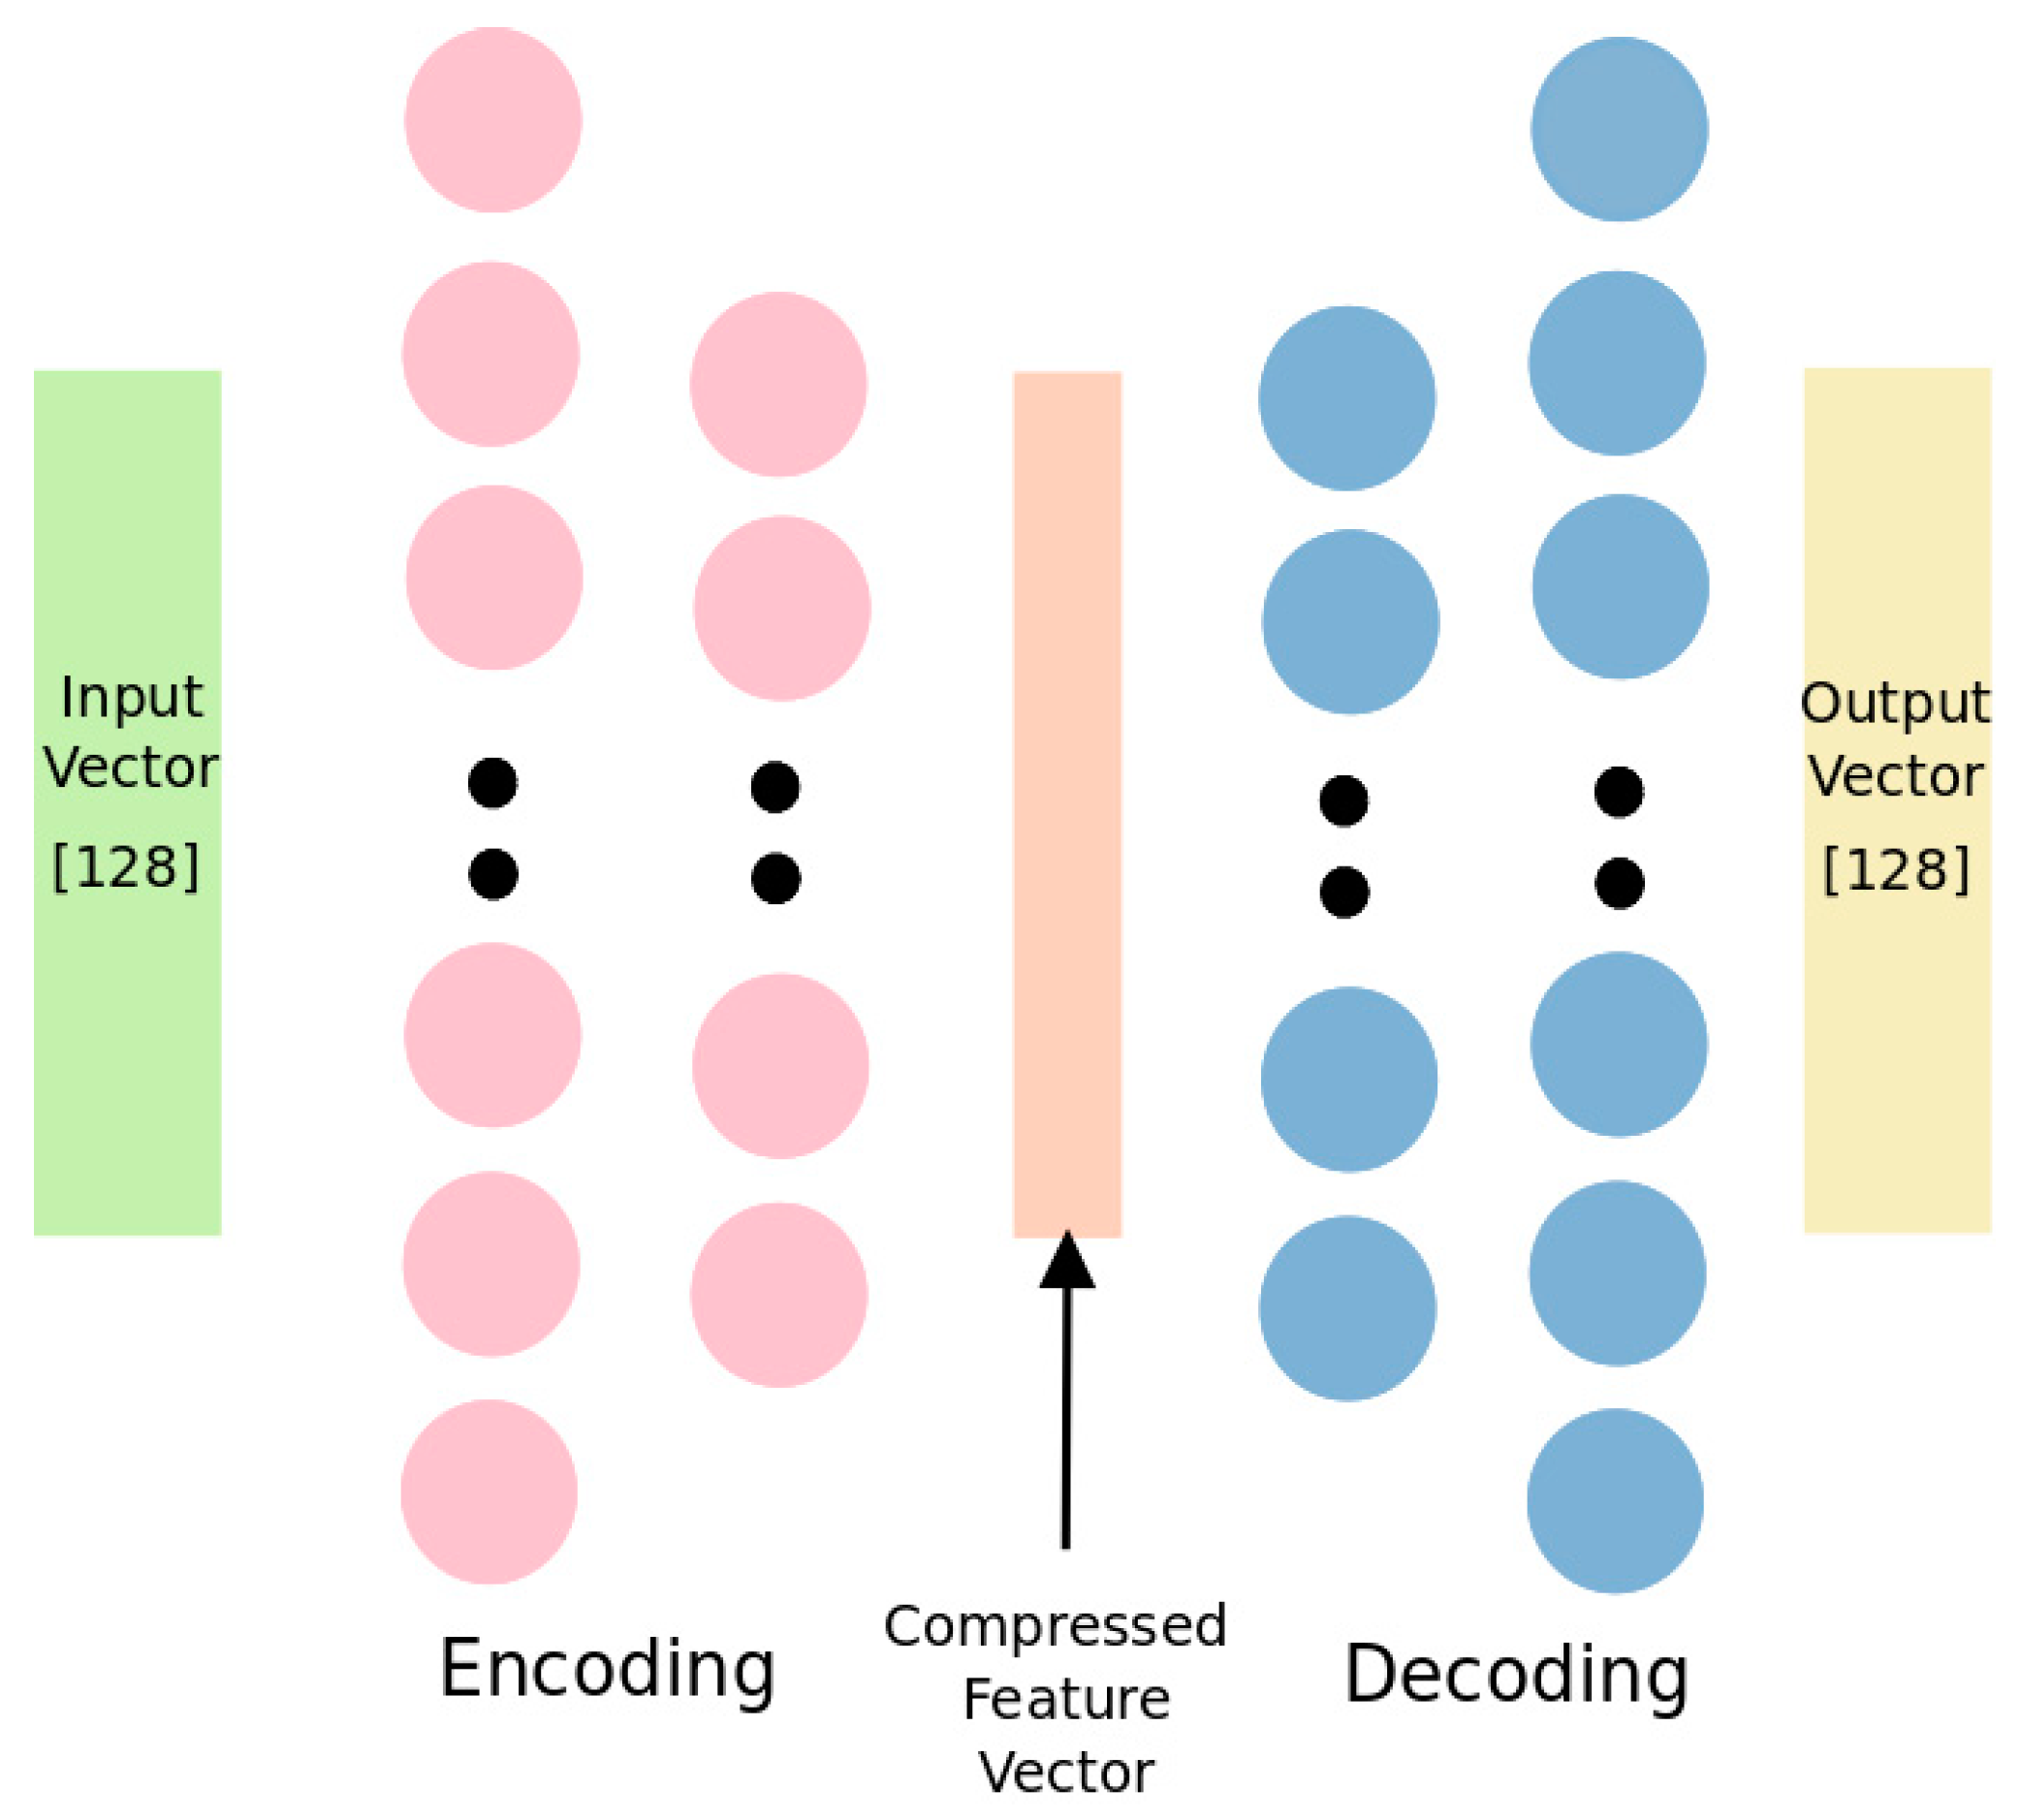
Figure 1 shows the autoencoder architecture we implemented. This is a traditional autoencoder model which has 2 encoder and 2 decoder layers with sigmoid activation function. Left-most rectangle is input SIFT feature vector with 128 dimensions. Right-most rectangle represents generated SIFT feature vector. Encoder layers encodes 128 dimensional input vectors to 64 dimensional vectors while decoder layers decode this vector back to 128 dimensions. Cost function is squared distance between original input and generated output. Our purpose is to find suitable representation for these vectors with lower number of components. This is a symmetrical network, first and second encoder layers have 128 and 64 number of units, respectively. Encoder and decoder layers are symmetric; first decoder layer has 64 number of unit while second has 128.
5. Experimental Results
Our dataset consists of 90 cropped vehicle logo images which are obtained from 9 different car brands [6]. The dataset includes images from Medialab database as well as other public resources [7]. Cropped logo images are fed to the feature extraction algorithm to obtain the SIFT vectors [8]. Consequently, the SIFT vectors are used to train the autoencoder structure which is implemented on Python using TensorFlow [9].
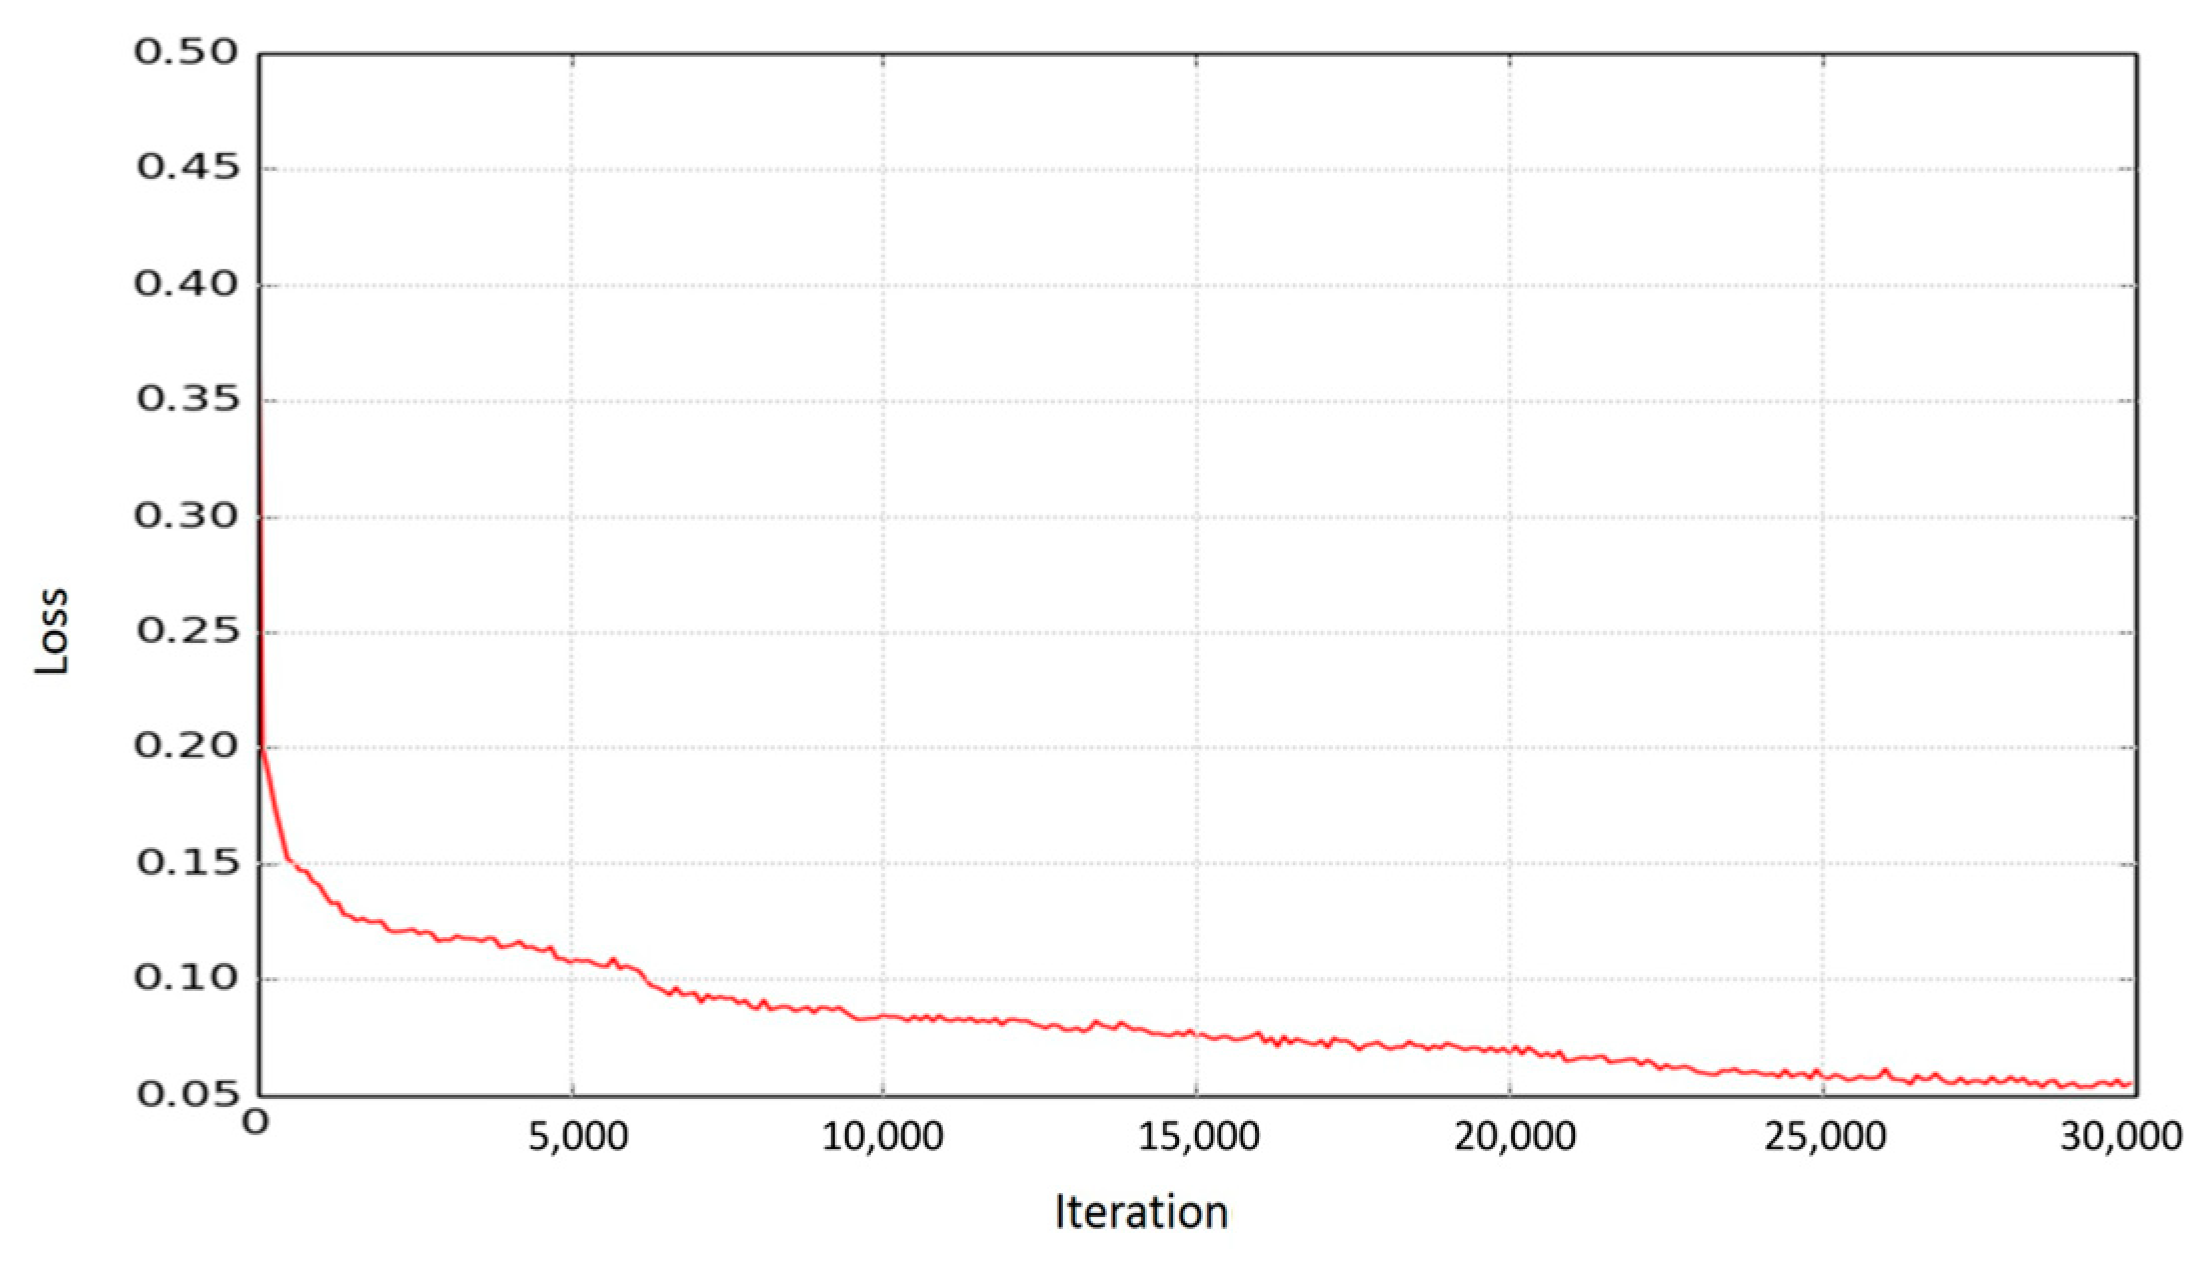
Implemented autoencoder architecture is trained with 5621 SIFT vectors through 30,000 iterations. Learning rate and batch size are set to 1 × 10⁻⁴ and 256 respectively. Loss function is optimized with Adam optimizer [10]. Plot of loss obtained from Equation (1) vs iteration number can be seen from Figure 2. During training process, a single CPU is used.
The recognition performance of the proposed method is measured using the “accuracy” metric, A, defined by:
where TM is the number of true matches and N is the number of all images in the data set.
81% accuracy is achieved after training through 30,000 iterations while matching process with 64 dimensional vectors. In addition to this, 32 dimensional vectors are obtained and tested. Memory usage which is the occupied memory by vectors obtained from all images in data set and logo data set, is computed the results are shown in Table 1. Some of example results obtained by 128, 64 and 32 dimensional vectors are shown in Table 2, for comparison.
6. Conclusions and Future Work
A reduced-dimension SIFT features based vehicle logo detection method is proposed using autoencoders. The dimension reduction of features is achieved with two-layer neural network structures called vanilla autoencoders.
Results indicate that by employing the proposed dimension reduction technique, an accuracy decrease of less than 20% yields a memory space saving 100% along with a reduced processing time requirement per image.
Future work consists of 4, 8 and 16 dimensional reduced vectors, quantization and binarization of these vectors and using different similarity measures, such as Jaccard and Manhattan measures.
References
- Lowe, D.G. Distinctive image features from scale-invariant keypoints. Int. J. Comput. Vis. 2004, 60, 91–110. [Google Scholar] [CrossRef]
- Chen, C.C.; Hsieh, S.L. Using binarization and hashing for efficient SIFT matching. J. Vis. Commun. Image Represent. 2015, 30, 86–93. [Google Scholar] [CrossRef]
- Zhou, X.; Wang, K.; Fu, J. A Method of SIFT Simplifying and Matching Algorithm Improvement. In Proceedings of the 2016 International Conference on Industrial Informatics-Computing Technology, Intelligent Technology, Industrial Information Integration (ICIICII), Wuhan, China, 3–4 December 2016; pp. 73–77. [Google Scholar]
- Yu, L.L.; Dai, Q. Improved SIFT feature matching algorithm. Comput. Eng. 2011, 37, 210–212. [Google Scholar]
- Zhao, J.; Xue, L.J.; Men, G.Z. Optimization matching algorithm based on improved Harris and SIFT. In Proceedings of the IEEE International Conference on Machine Learning and Cybernetics (ICMLC), Qingdao, China, 11–14 July 2010; Volume 1, pp. 258–261. [Google Scholar]
- ITU Vehicle Logo Dataset. Available online: https://kovan.itu.edu.tr/index.php/s/o36RNe6ac6cahli (accessed on 20 July 2017).
- Medialab LPR Database. Available online: http://www.medialab.ntua.gr/research/LPRdatabase.html (accessed on 20 July 2017).
- Lowe, D.G. Method and Apparatus for Identifying Scale Invariant Features in an Image and Use of Same for Locating an Object in an Image. U.S. Patent 6,711,293, 23 March 2004. [Google Scholar]
- Abadi, M.; Agarwal, A.; Barham, P.; Brevdo, E.; Chen, Z.; Citro, C.; Ghemawat, S. Tensorflow: Large-scale machine learning on heterogeneous distributed systems. arXiv 2016, arXiv:1603.04467. [Google Scholar]
- Kingma, D.; Ba, J. Adam: A method for stochastic optimization. arXiv 2014, arXiv:1412.6980. [Google Scholar]
Figure 1.
Our autoencoder structure.
Figure 2.
Loss, L, vs. number of iterations.

Table 1.
Results that are obtained with 128, 64 and 32 dimensional feature vectors.
| Dimension | Process Time Per Image (Sec) | Accuracy | Memory Usage (Mbit) |
|---|---|---|---|
| 128 | 0.01042 | 1 | 25.05 |
| 64 | 0.00963 | 0.81 | 12.53 |
| 32 | 0.00822 | 0.78 | 6.26 |
Table 2.
Examples of input logo images, corresponding true matches and algorithm results obtained utilizing (a.) 128, (b.) 64 and (c.) 32 dimensional SIFT feature vectors.
Table 2.
Examples of input logo images, corresponding true matches and algorithm results obtained utilizing (a.) 128, (b.) 64 and (c.) 32 dimensional SIFT feature vectors.
| Input | a. | b. | c. | True Match |
|---|---|---|---|---|
 |  |  |  |  |
 |  |  |  |  |
 |  |  |  |  |
 |  |  |  |  |
Publisher’s Note: MDPI stays neutral with regard to jurisdictional claims in published maps and institutional affiliations. |
© 2018 by the authors. Licensee MDPI, Basel, Switzerland. This article is an open access article distributed under the terms and conditions of the Creative Commons Attribution (CC BY) license (https://creativecommons.org/licenses/by/4.0/).
Share and Cite
MDPI and ACS Style
Keser, R.K.; Ergün, E.; Töreyin, B.U. Vehicle Logo Recognition with Reduced-Dimension SIFT Vectors Using Autoencoders. Proceedings 2018, 2, 92. https://doi.org/10.3390/proceedings2020092
AMA Style
Keser RK, Ergün E, Töreyin BU. Vehicle Logo Recognition with Reduced-Dimension SIFT Vectors Using Autoencoders. Proceedings. 2018; 2(2):92. https://doi.org/10.3390/proceedings2020092
Chicago/Turabian StyleKeser, Reyhan Kevser, Esra Ergün, and Behçet Uğur Töreyin. 2018. "Vehicle Logo Recognition with Reduced-Dimension SIFT Vectors Using Autoencoders" Proceedings 2, no. 2: 92. https://doi.org/10.3390/proceedings2020092